
Abstract
To comprehensively understand the bulk macro conduction characteristics of typical geomaterials existing in deep underground coal mines, i.e. coal, rock, and concrete (shotcrete), meso-scale composition (solid mineral and fluids such as water and air) and structure (particle and pore size, shape, and contact form) analyses were conducted via water absorbability and thermal conductivity measurements, scanning electron microscope, and X-ray diffraction technologies. The results indicate that coal, rock, and concrete's respective meso-scale composition and structures have different degrees of influence on their macro bulk effective thermal conductivity at various conditions. First, the fluid (water and air) composition significantly impacts thermal conductivity at a certain bulk effective porosity: coal < rock < concrete. The ranking of thermal conductivity shows two different forms: concrete < coal < rock in a dry state and coal < concrete < rock in a water-saturated state. Second, the surface morphology and face porosity obtained by scanning electron microscope imaging can explain thermal conductivity fluctuations at various moisture contents and magnification times. The face porosity as well as its quadrant anisotropy degree can also be achieved via scanning electron microscope digital image processing technology, and both of them have a certain relationship with magnification times (scale effect) and effective volumetric porosity, as obtained by water absorbability experiments. In addition, apart from the fluid composition, the mineral composition (species and content of mineral) of the solid skeleton or matrix also significantly influences the macro-scale thermal conductivity of geomaterials. Furthermore, a quantitative comparison analysis can be performed by X-ray diffraction, but further research is needed to improve its accuracy. This study's detailed meso-characterization of the macro effective thermal conductivity for typical geomaterials in an underground coal mine may be of reference value to establish the relationship between different properties of differing scales.
Keywords
Introduction
At present, many coal mines all over the world (China, Poland, Australia, etc.) are exposed to high temperature and humidity, which has become an important factor that restricts the safe mining of deep coal resources (Amin et al., 2016; Chu et al., 2016; Szlazak et al., 2008; Yang et al., 2011; Kong et al., 2016). Existing literature indicates that the main heat source in deep underground openings is rocks with high virgin temperatures due to increasing mining depth (McPherson, 1986; Kong et al., 2016). Based on Fourier's law, thermal conductivity, a type of thermophysical parameter used to evaluate a material's ability to conduct heat, is of great importance to accurately calculate the heat flow from the surrounding coal and rock to underground space, in order to estimate whether the cooling capacity of the air-conditioning system is sufficient or not. Apart from coal and rock, concrete, especially shotcrete, is widely used as a reinforcing measure during the tunnel excavation process. Thus, all three typical geomaterials (Figure 1) need to be considered when we calculate the heat flow entering into a mining environment.
Interaction types between coal, rock, and concrete in an underground coal mine.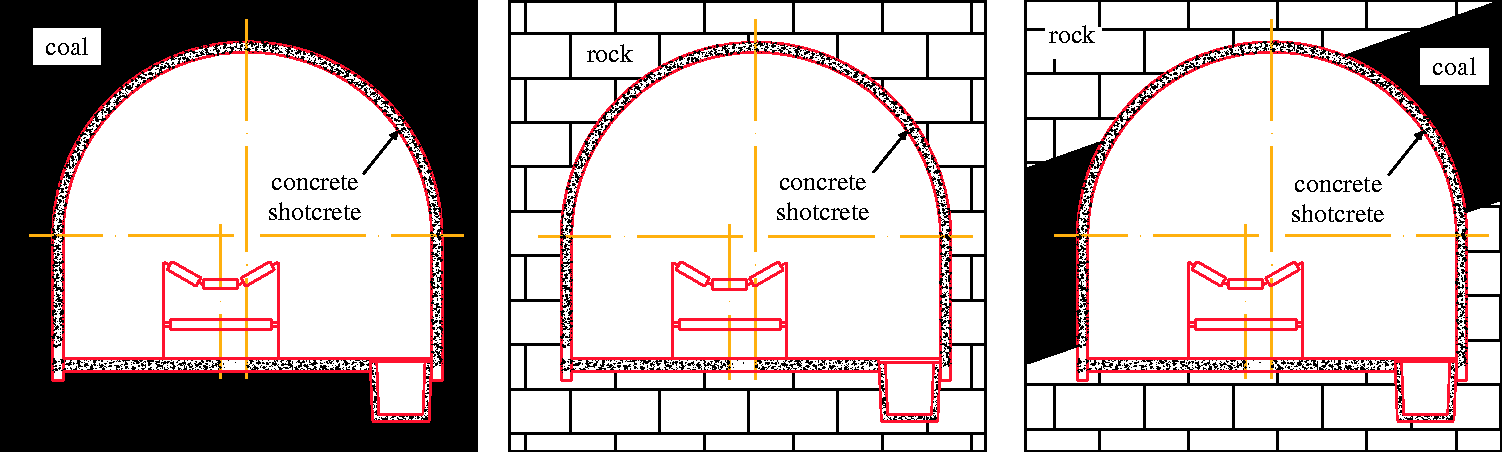
In previous studies many researchers have focused on the thermal conductivity of geomaterials, including coal, rock, and concrete. For coal, most studies examine the relationship between thermal conductivity and temperature ranging from room temperature to several hundred degrees, which has considerable relevance to the prevention and control of mine fires caused by spontaneous coal combustion (Deng et al., 2017; Wen et al., 2015). More attention was paid to rock's thermal conductivity, particularly the geothermal resource exploitation field. But closely related to mine heat hazard control are studies on the influences of porosity, moisture content, and uniaxial and triaxial stress on the thermal conductivity of rocks in underground mines (Demırcı et al., 2004; Görgülü, 2004; Görgülü et al., 2008). Concrete with low thermal conductivity was not only used as a type of supporting structure but also as an insulating material, to weaken the heat transfer process between the surface of the rock and the mining environment. It showed excellent cooling load reductions and significant operational cost savings for ventilation and cooling systems in deep underground hot mines (Liu et al., 2014; Szlazk and Obracaj, 2016). However, in most cases, the above studies only examined one type of geomaterial rather than performing a comprehensive comparison among various typical geomaterials in a particular research field. To the authors' knowledge, the existing literature lacks comprehensive thermophysical properties analyses, even at a simple level, of different types of common geomaterials related to heat hazard control in deep underground coal mines.
From another perspective, coal, rock, and concrete are typical geotechnical porous media consisting of three phases: solid, liquid, and gas. Obtaining their bulk effective/equivalent thermal conductivity, however, is very difficult owing to their complex and opaque internal structure. There are many factors influencing the effective thermal conductivity of geomaterials, which can be divided into two main categories: composition and structure (Clauser, 2011a, 2011b; Wong et al., 2007; Zhang and Wang, 2017). The former includes the mineralogical composition for solid skeletons and fluid in pores, cracks, and fissures, while the latter includes porosity, grains, and pore shape and size, as well as the contact form of particles and pores. Of course, the thermal conductivity also depends on the temperature, which is beyond the scope of this paper.
Scanning electron microscope (SEM), X-ray diffraction (XRD), and CT technologies have also been widely applied in many research fields to investigate the composition and structure properties of geomaterials (Hu et al., 2017; Liu et al., 2017; Wang et al., 2005; Zuo et al., 2010), especially at the micro- or meso-scale. However, until now, little strict demarcation has been made among the micro-, meso-, and macro-scales, and then only in some studies related to the criteria of scale classification of pores by diameter and morphology (Loucks et al., 2012). For instance, according to the IUPAC classification (Chemistry, 1994), pores can be classified as micropores (<2 nm), mesopores (2 nm, 50 nm), or macropores (>50 nm) by diameter. Taking this as a reference, multiscale thermal property research on coal, rock, and concrete is also classified as micro-scale ( < nm, corresponding to the atomic or molecular level with respect to electron motion and lattice vibration), meso-scale ((nm, mm), corresponding to the most spatial resolution of SEM or CT technology), and macro-scale ( > mm, approximately corresponding to the resolution of the human eye), as shown in Figure 2. Due to the limitation of research conditions and application fields, geomaterial research at the meso- (called microstructure in some studies) and macro-scale, both of which can be treated as continuous media, has become a hot spot in recent years. Therefore, based on the above classification, this paper aims to link the macro-scale effective thermal conductivity of three typical geomaterials in underground coal mines to their meso-scale composition and structure via the experiments performed with SEM and XRD technologies.
Thermal property multiscale research for coal, rock, and concrete.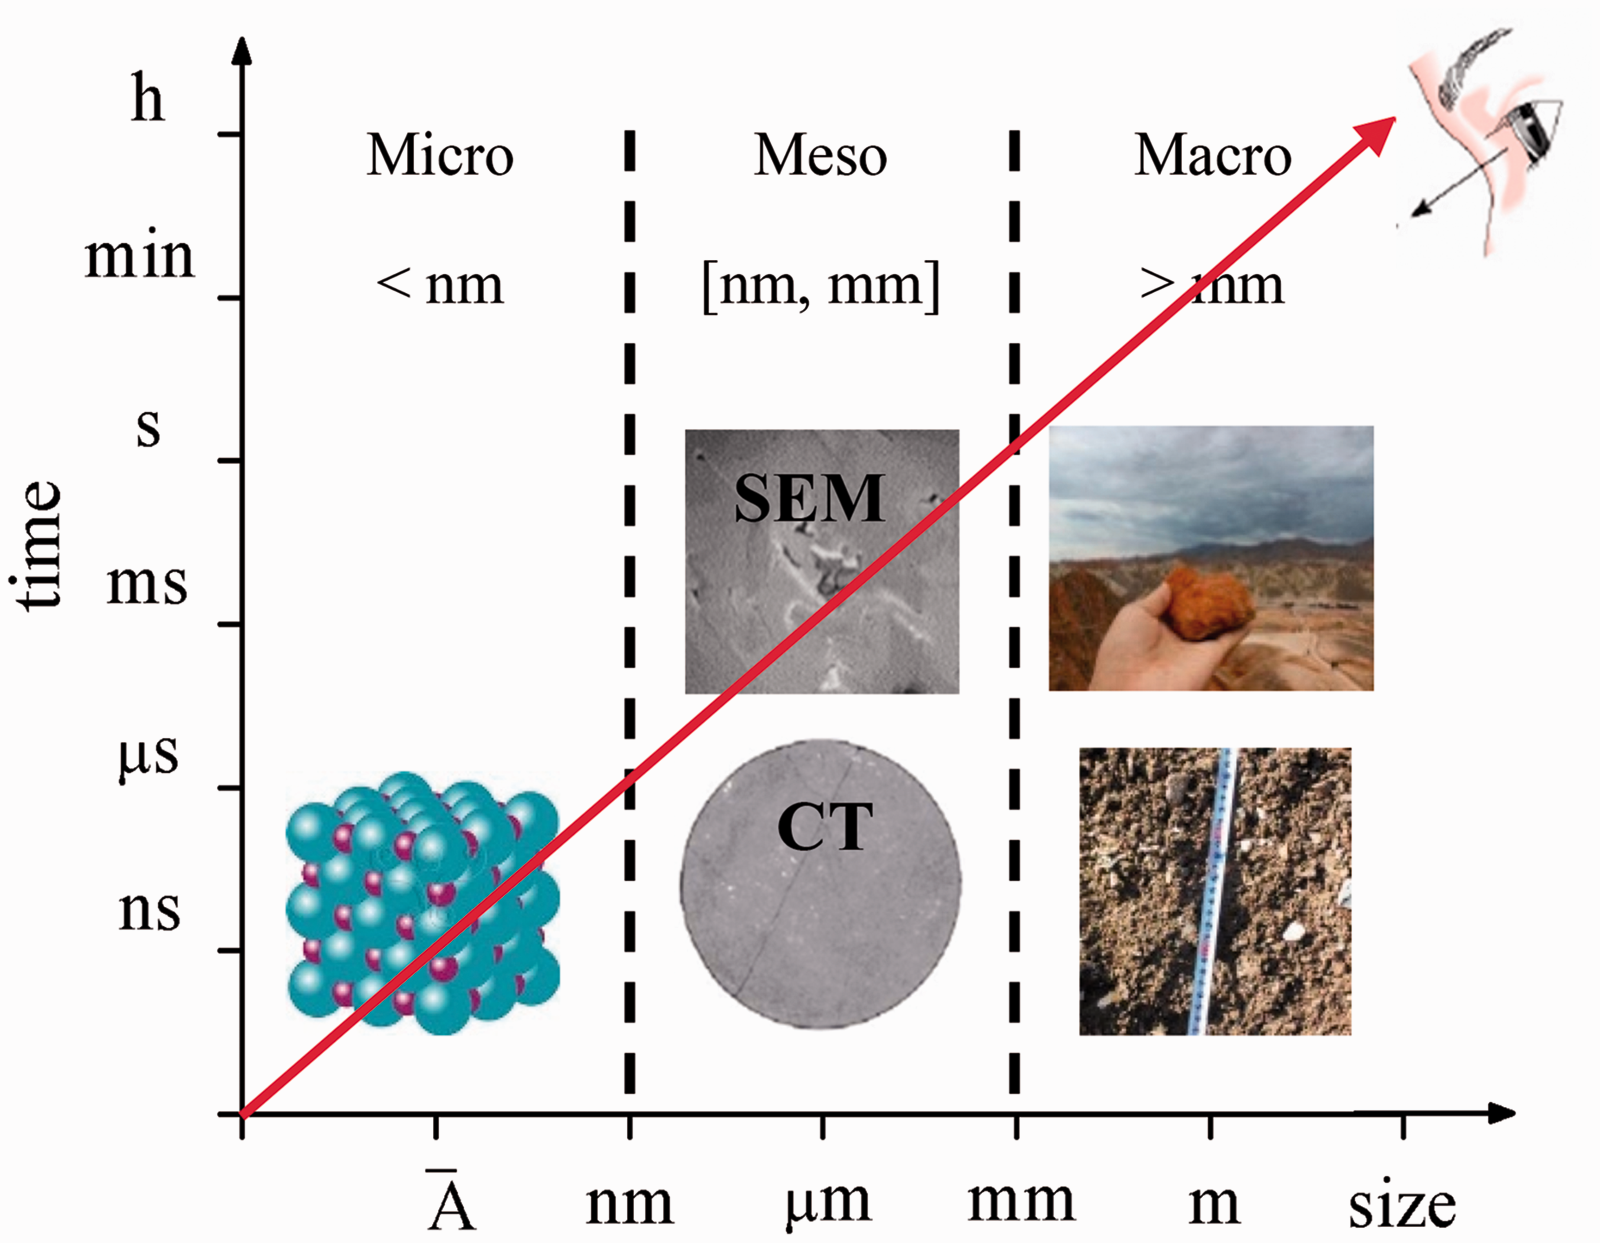
The article is organized as follows. After this introduction, the next section provides the experimental materials, methods, and procedures. Then special attention is paid to the results and discussion in the following section. At last, the conclusions section ends the paper.
Experimental materials, methods, and procedures
Water absorbability and thermal conductivity measurements
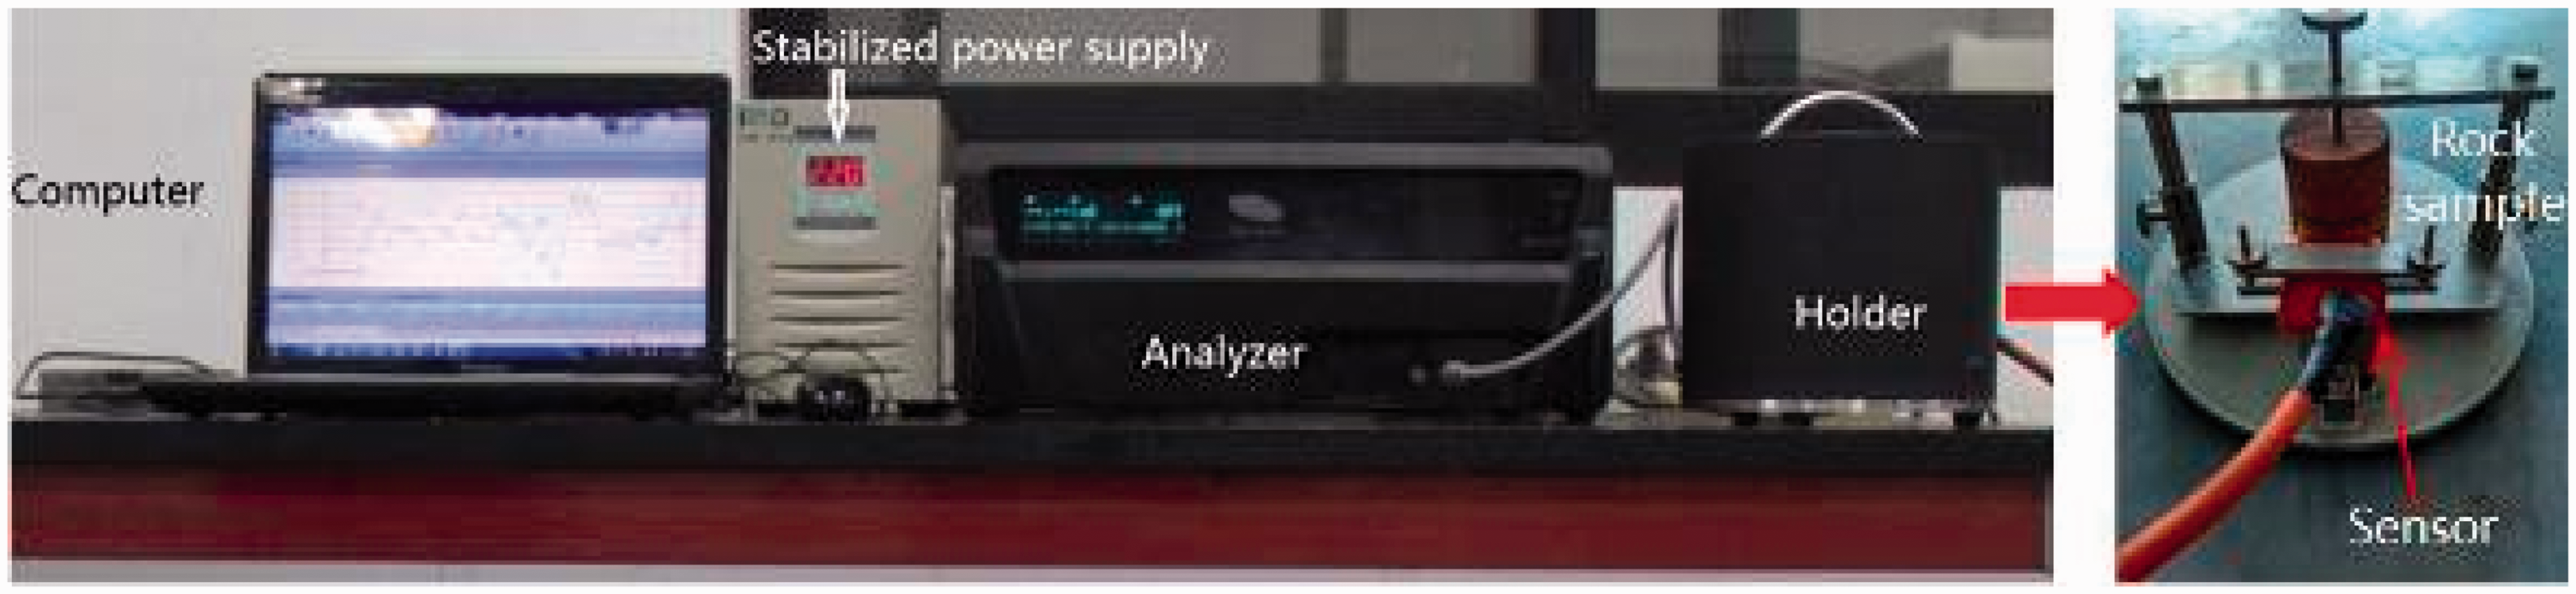
The samples investigated in this paper contain three typical geomaterials: coal, rock, and concrete (Figure 3). The coal and rock were taken from a construction site while the concrete was produced in the laboratory (Wu, 2013). The samples were separated into two categories. Five small samples (diameters between 20 and 30 mm) with irregular round shapes were used for the water absorbability tests, to obtain the effective porosity in accordance with the test methods introduced in GB/T 50266-2013 (Standard for Test Methods of Engineering Rock Mass) (China, 2013). Two cylinder specimens, with diameters about 50 mm and in the 30–50 mm height range for each type of geomaterial, were used to conduct the thermal conductivity tests under five different conditions via Hot Disk-TPS500 (Figure 4). The related detailed principle and method of TPS were introduced in Fang et al. (2017) and Liu et al. (2014). The cylinder specimens must have a perfectly flat cylindrical surface to achieve sufficient contact between two separated specimens on the sensor of the thermal conductivity testing device.
Specimens for (a) water absorbability measurements and (b) thermal conductivity measurements. The apparatus for the Hot Disk-TPS500.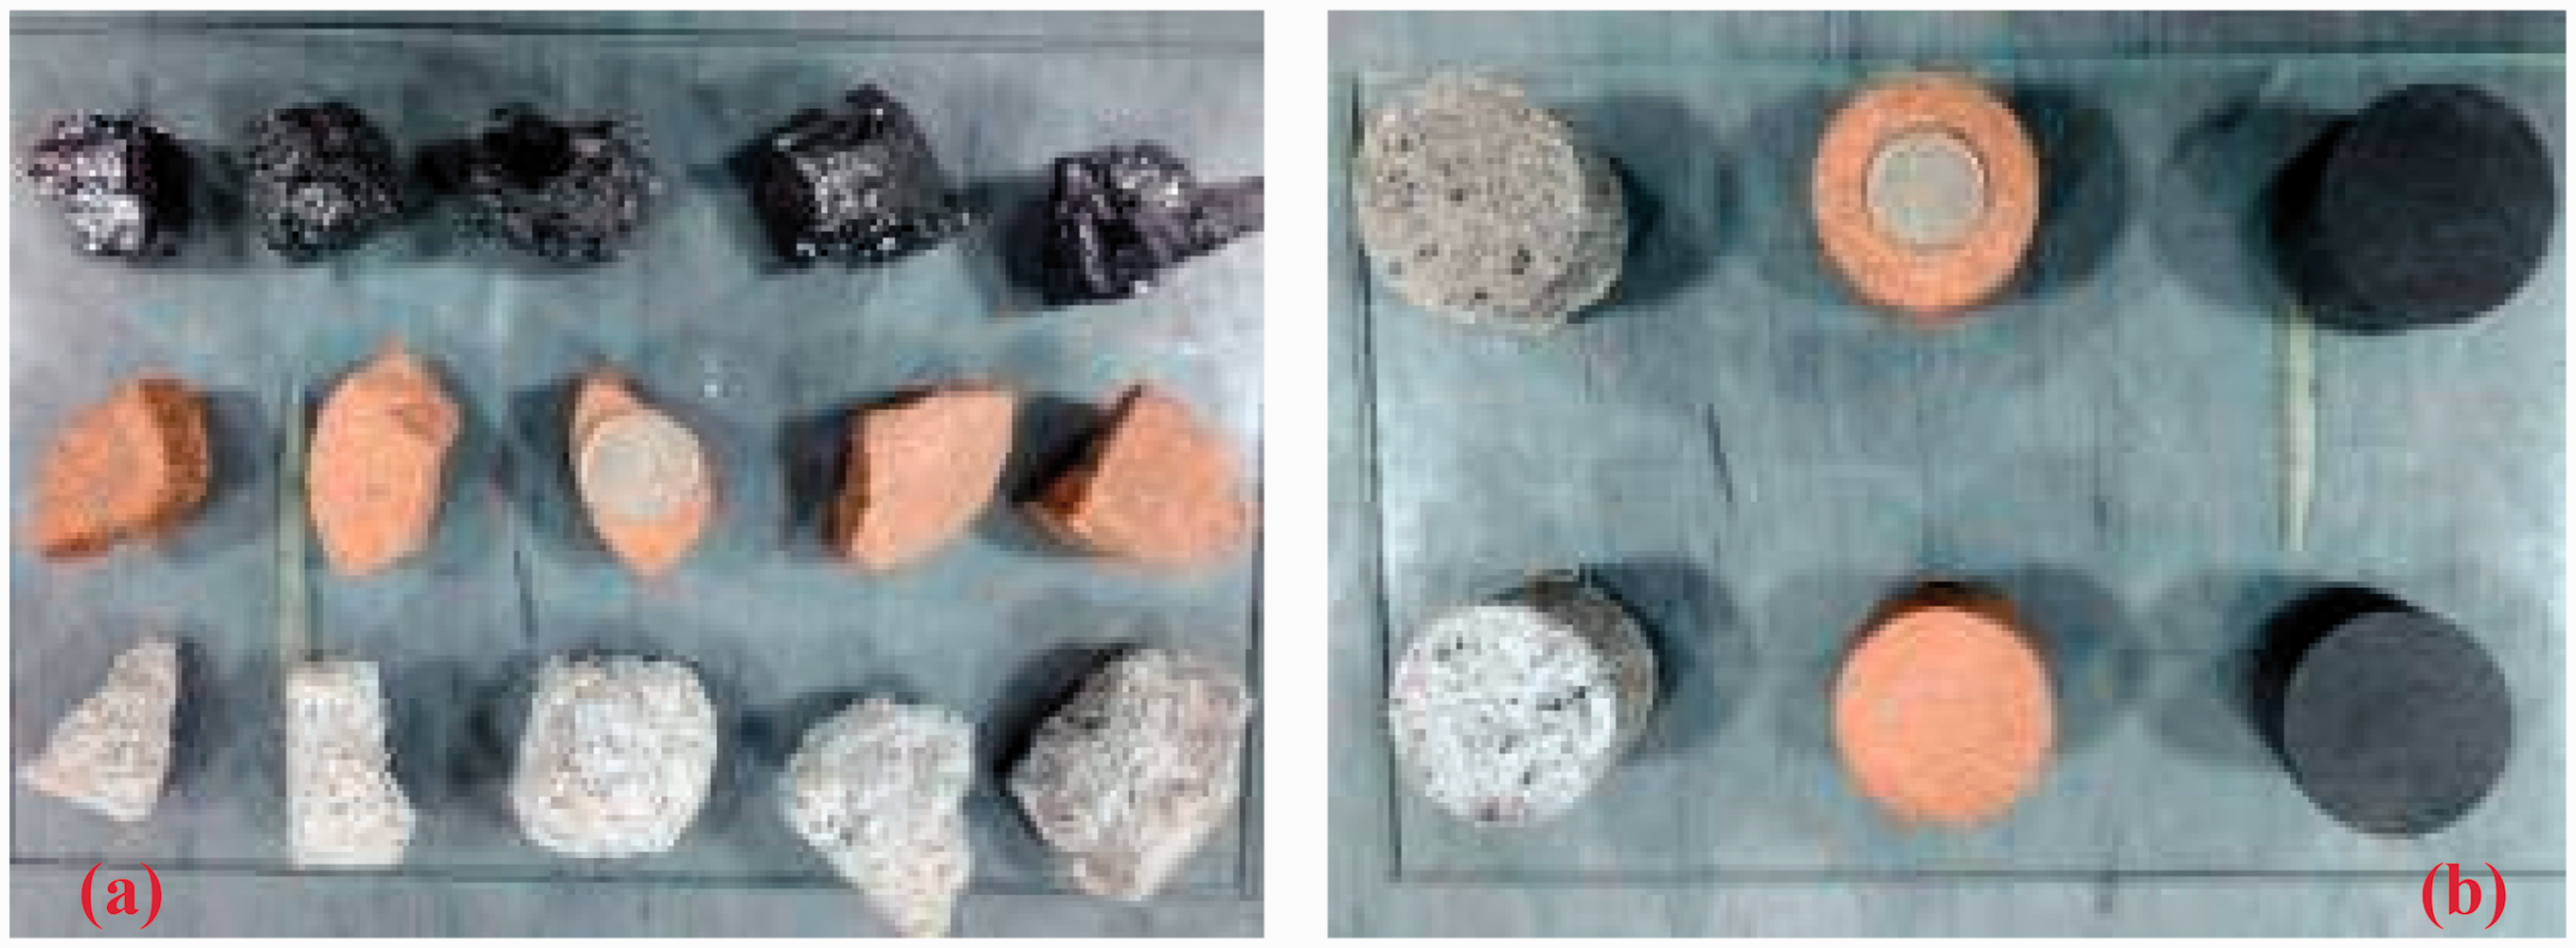
SEM and XRD experiments
Each type of specimen was treated to create irregular round shapes less than 10 × 10×10 mm3, as shown in Figure 5, and the morphology as well as elemental composition characterization of coal, rock, and concrete was carried out using a FEI QuantaTM 250 (Figure 5). Lastly, digital images at five different magnification times (50×, 500×, 1500×, and 6000×) were obtained for further analysis.
Specimens for SEM and the device.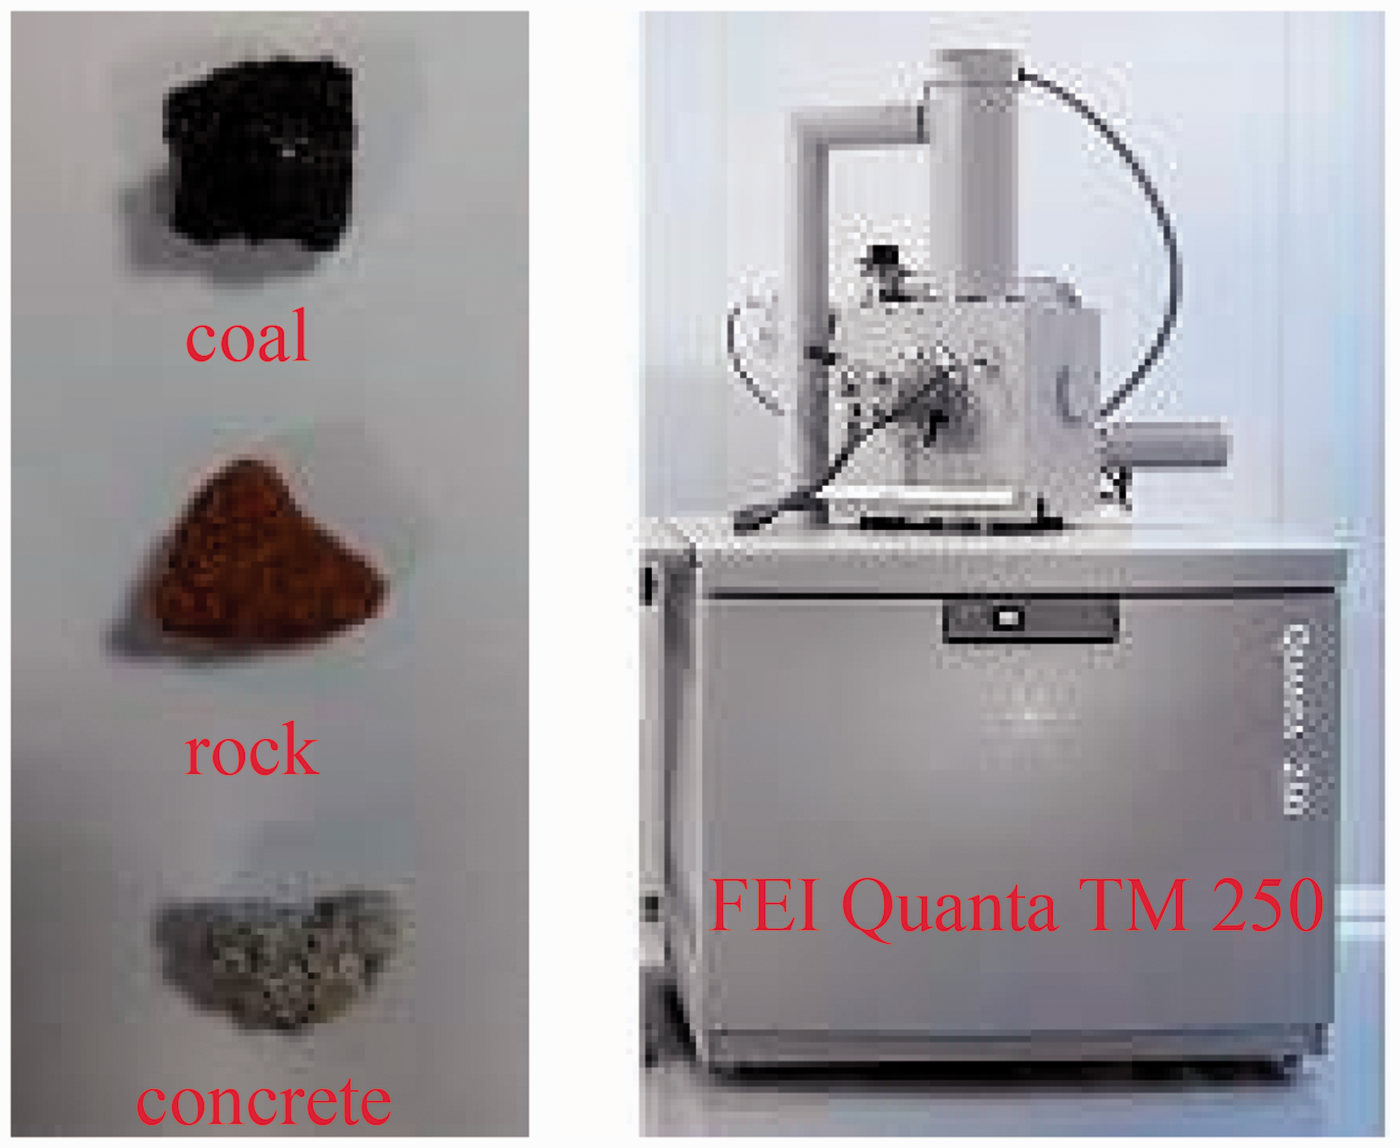
XRD analyses were performed with a Bruker D8 Advance X-ray diffractometer. In order to adapt this X-ray diffractometer, the specimens need to be pounded into powder and filtered with a not less than 200 mesh strainer. Figure 6 shows the used X-ray diffractometer and the fine geotechnical material powder. An X-ray tube was scanned at a power of 40 kV and 30 mA to produce Cu–Kα radiation. The scanning range of the diffraction angle was set to 3–65°, and the scanning speed was 8°/min.
X-ray diffractometer and test sample powder.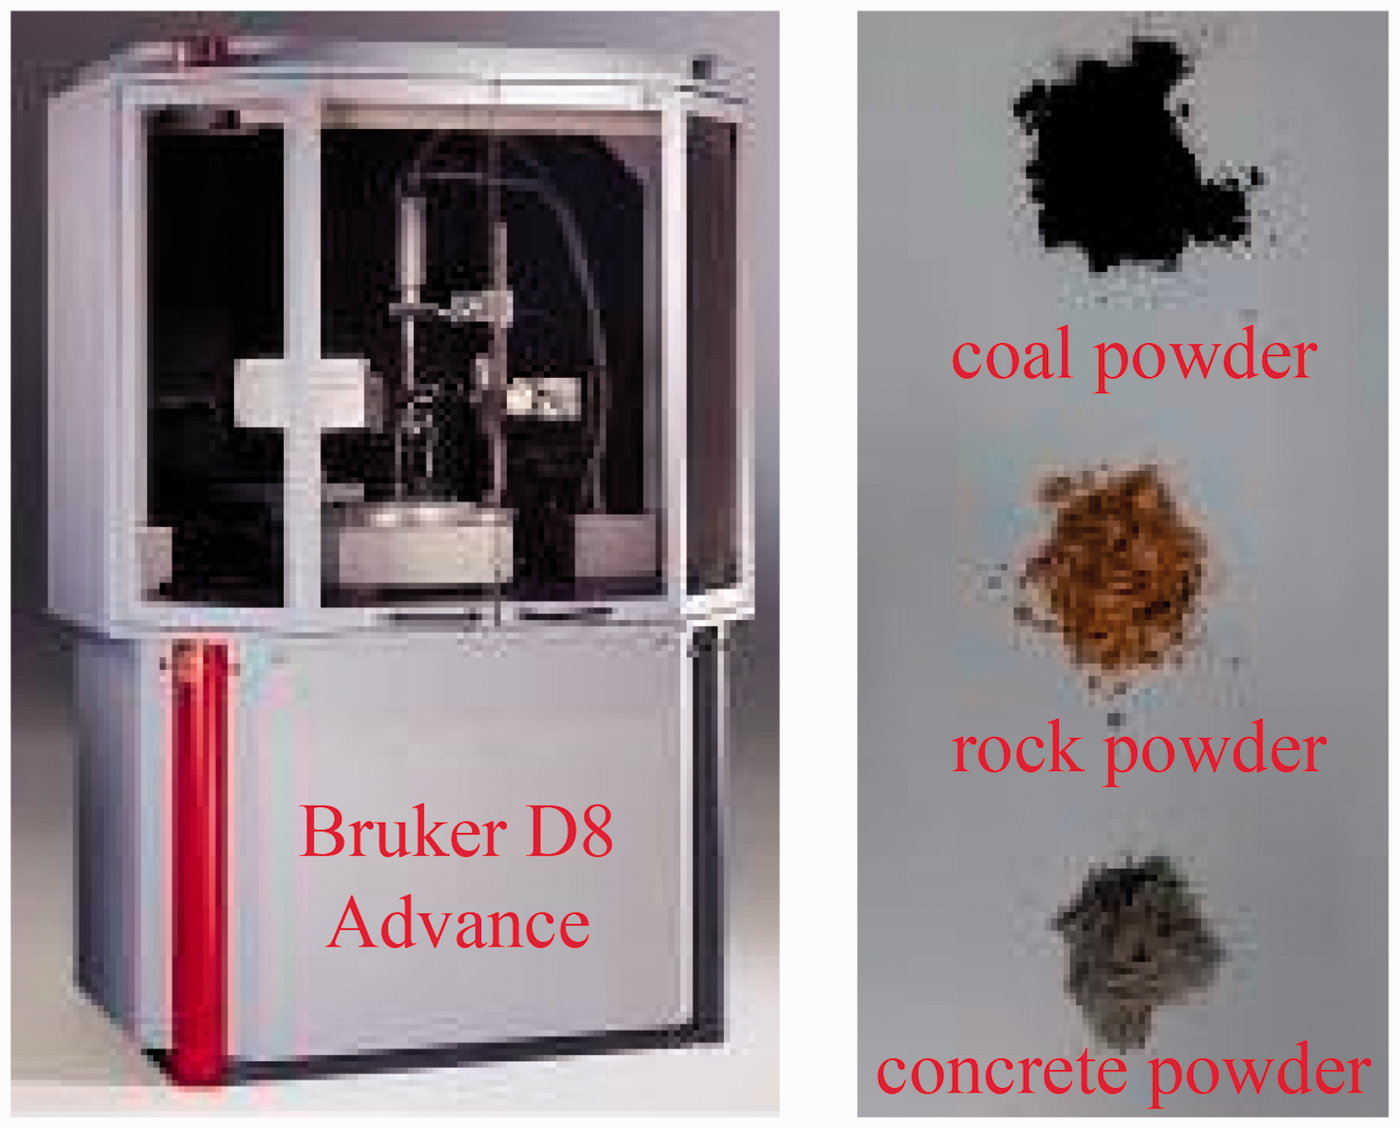
Results and discussion
Effective porosity and thermal conductivity
Results of water absorbability measurements.
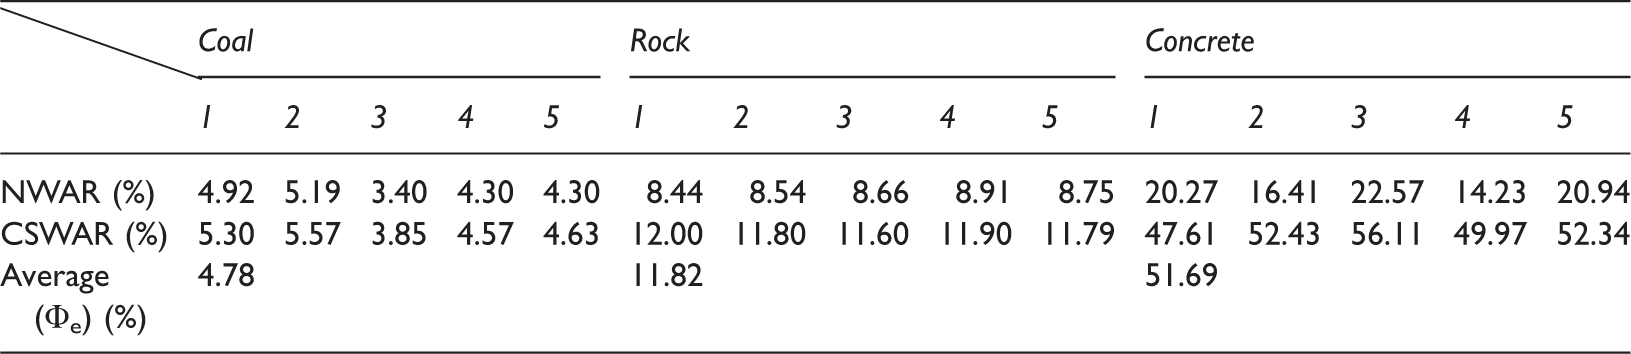
CSWAR: compulsory saturated water absorption ratio; NWAR: natural water absorption ratio; Φe: effective porosity.
Thermal conductivity under five different conditions.
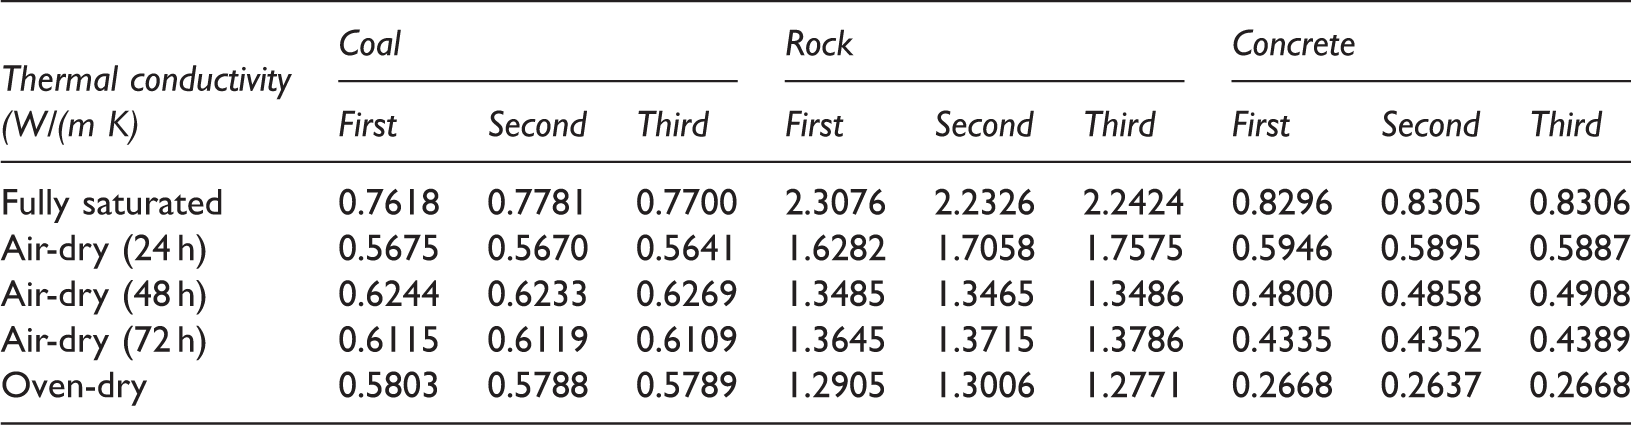
From the experimental results in Table 1, it was found that the effective porosity ranges of the three types of targeted geomaterials were 3.85–5.57% (coal), 11.60–12.00% (rock), and 47.61–56.11% (concrete), respectively, giving the corresponding average values of 4.78, 11.82, and 51.69%. They can be ranked in terms of porosity: coal < rock < concrete. The results in Table 2 show that rock has the highest thermal conductivity and the variation tendency is significant, changing from a maximum of 2.3076 W/(m K) to a minimum of 1.2771 W/(m K). In contrast, at the initial saturated condition, the thermal conductivity of coal was the lowest but stayed nearly stable at 0.6 W/(m K) during the whole experiment period. For concrete, the thermal conductivity declined steadily from 0.83 W/(m K) (water saturated) to 0.26 W/(m K) (oven-dry), corresponding closely to the minimum 0.2637 W/(m K) in all experiments. Among the materials, the thermal conductivities of concrete demonstrated the largest relative fluctuation range, followed by rock, while coal was insignificant. In other words, the thermal conductivity increases with the moisture content as every condition represents a moisture content value. At present, the thermal conductivity of a porous medium increasing with moisture content has been accepted as common sense, due to the fact that the thermal conductivity of water (0.6 W/(m K)) is considerably higher than that of the air (0.026 W/(m K)) which may fill the pores (Walsh and Decker, 1966).
SEM images qualitative analysis
Figure 7 shows SEM images of the surface morphology and structure with different magnification times (left to right: 50×, 500×, 1500×, and 6000×). For each image the pixel resolution is 1024 × 943; accordingly, each pixel is approximately 5.6 µm at 50× magnification and 0.05 µm (50 nm) at 6000×, so all the images belong to the meso-scale. In this paper, the pores, cracks, fissures, and fractures are treated as the same structure (pores) and are divided into two types: matrix pores and fracture pores. The former contains interparticle and intraparticle pores while the latter includes cracks, fissures, and fractures, as in previous studies (Hou et al., 2017; Loucks et al., 2012; Wang et al., 2014).
SEM images of coal (a), rock (b), and concrete (c) with different magnification times.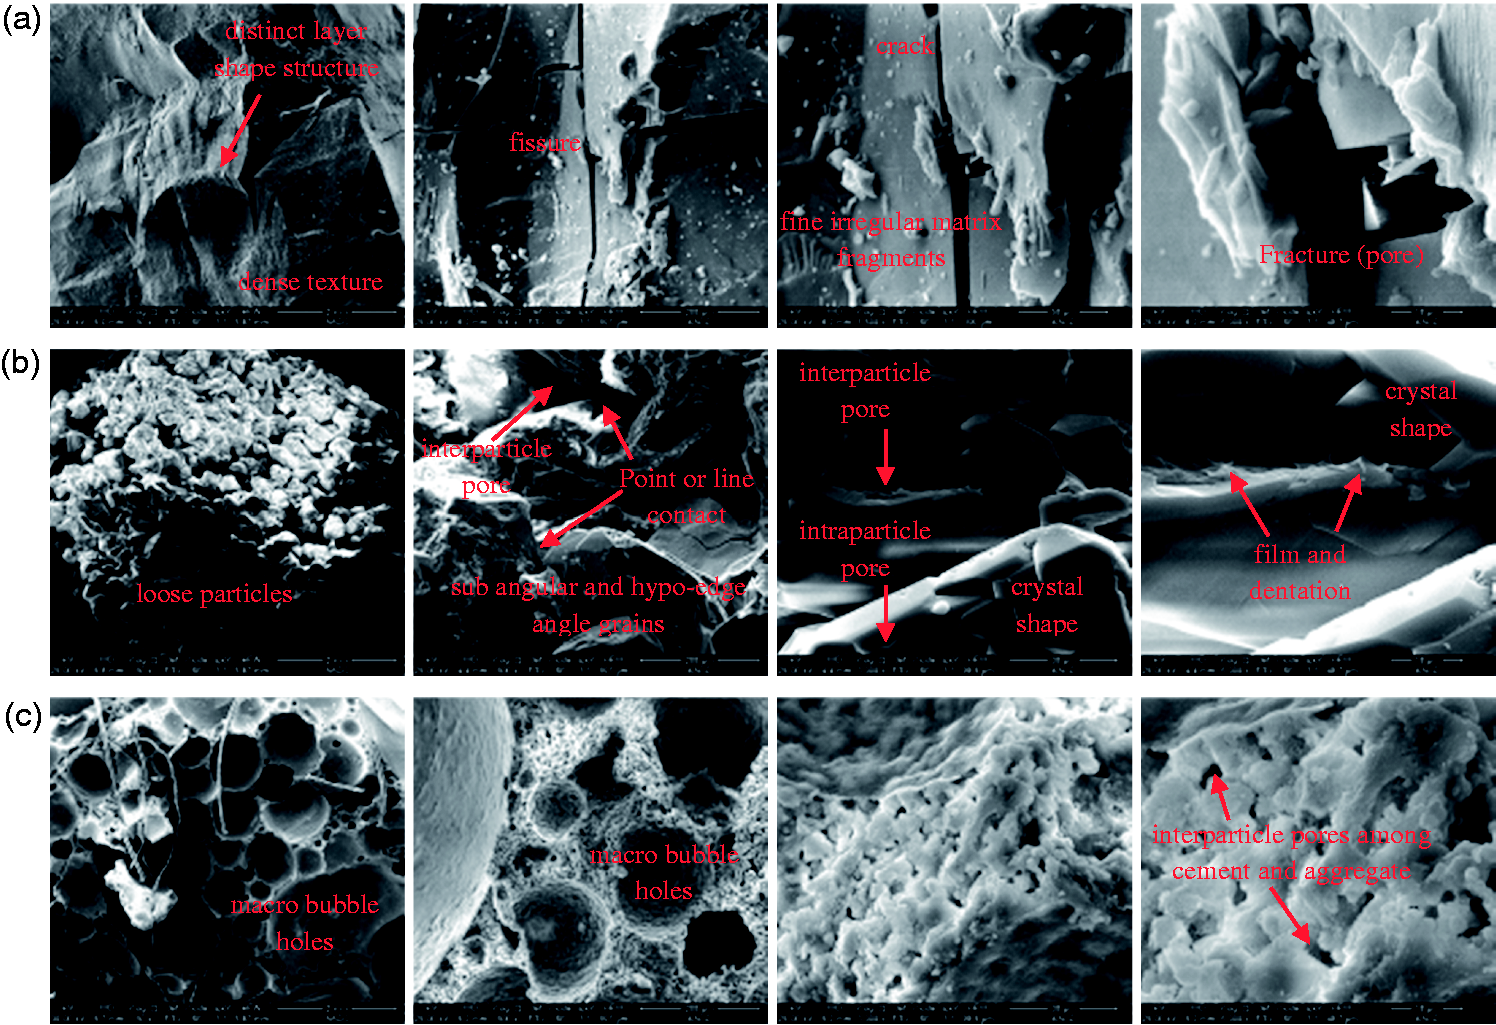
Coal, a type of sedimentary rock, has a dense texture and distinct layer shape structure. Fine irregular coal matrix fragments can be found on the surface. Restricted by scanning electron microscopy imaging resolution (Sun et al., 2017), its matrix pores, including micropores below the nanometer level, cannot be observed and distinguished, and the meso and macropores are also not obvious. However, the meso-scale fracture pores are obvious, and the cracks resulting from native or external causes can be easily observed. Micro-crack development can be not only parallel to the stratification but perpendicular to the bedding with good connectivity. With lengths up to millimeters and widths over several micrometers, these cracks are the main channels for liquid seepage and gas migration. Although the growth of meso-scale cracks in coal will affect macro thermal properties, the effect is still not relatively significant. Such cracks generally do not achieve well development. Therefore, it can be initially concluded that the macroscopic thermal conductivity fluctuation range of coal with close texture would not be great, due to the few matrix and fracture pores filled with different fluids (water or air). According to the measurements of thermal conductivity under the conditions of different water content, such as oven-dried and water saturation, the thermal conductivity fluctuation range of coal is 0.57–0.77 W/(m K) and the maximum relative change is only 35%.
Compared with the dense structure of coal, sandstone is relatively loose in terms of the macro-scale and usually has obvious subangular and hypo-edge angle grains in contact with each other in the form of a point or line. In the SEM images numerous matrix pores can be observed, especially the interparticle pores. The particle size is between 0.1 and 0.5 mm with more pores and better connectivity. From the meso-scale, it can be observed that the surface of sandstone particles is smooth and the crystal shape is significant. There are silicate and clay minerals on the surface of some particles, and they are distributed in the form of a film or indentation. According to the SEM images of sandstone, it can be determined that the contact among sandstone particles is mostly in the form of point to point and point to line at a dry state. The thermal conductivity is also greatly influenced by air in the pores with good connectivity. Given an increase of water content the water around the particles will increase, and a water film will be formed on the surface of the particles. The heat transfer with the point–line contact will be gradually turned into one with line–face contact. The thermal conductivity will increase rapidly and the variation may be larger. The thermal conductivity measurement results under different conditions also show that the fluctuation range of rock's thermal conductivity is 1.27–2.3 W/(m K), and the maximum relative change is more than 80%, which meshes well with the above analysis.
In order to reduce its thermal conductivity so as to improve heat insulation performance, foams are often injected into concrete. On the other hand, fiber material is added to reinforce the toughness of concrete without excessively decreasing its strength. Therefore, as a type of artificial geomaterial, the complex structure of concrete leads to a dual-porosity structure at the macro- and meso-scale: clear macropores are formed by added bubbles and the mesopores among cement, aggregates, and fibers. The diameter of macro bubble holes in concrete is up to 2–3 mm, and most of them are approximately 0.5–1 mm. Most are hollow balls with high roundness, regular shape, and good connectivity among pores. Apart from the macro bubble holes, there are still meso-scale interparticle pores among the cement, aggregate matrix, and fiber due to inadequate vibration and the hydration of the cement. This type of pore mainly exists in the solid matrix framework or on the bubble holes wall, with irregular shape and a size over several microns. Even without considering the thermal conductivity of the solid matrix, the effect of the fluid implantation on thermal conductivity for concrete is likely the most obvious, and the relative fluctuation is also the most significant among the three types of geomaterials in an underground coal mine due to its large porosity. The thermal conductivity test results demonstrate that the fluctuation range of the thermal conductivity of foamed fiber concrete is 0.26–0.83 W/(m K). As a kind of thermal insulation material, it has low thermal conductivity in dry conditions but large rangeability up to 220% if it is fully water saturated.
Quantitative analysis on face porosity obtained by SEM images
Many studies have shown that image segmentation techniques are useful ways to separate different objects and study micro- and meso-structure geomaterial parameters such as porosity (Sinha and Fieguth, 2006; Yang and Buenfeld, 2001; Zelelew et al., 2013). However, little distinction is made between porosity obtained by image process (face porosity) and other methods. Here, the porosities obtained by SEM image segmentation techniques (face porosity) were compared to those deduced from water absorbability measurements (effective volumetric porosity). The steps for image processing via MATLAB software are as follows: Original image→Gray scale conversion→Gray scale image→Opening operations to remove the background brightness→Histogram equalization for image enhancement→Binary image by artificial threshold due to unimodally gray distribution histograms. Taking the 500× magnification SEM images as an example, the image segmentation process is demonstrated in Figure 8.
SEM gray images before and after processing, gray distribution histograms, and binary images for coal (a), rock (b), and concrete (c) at 500× magnification.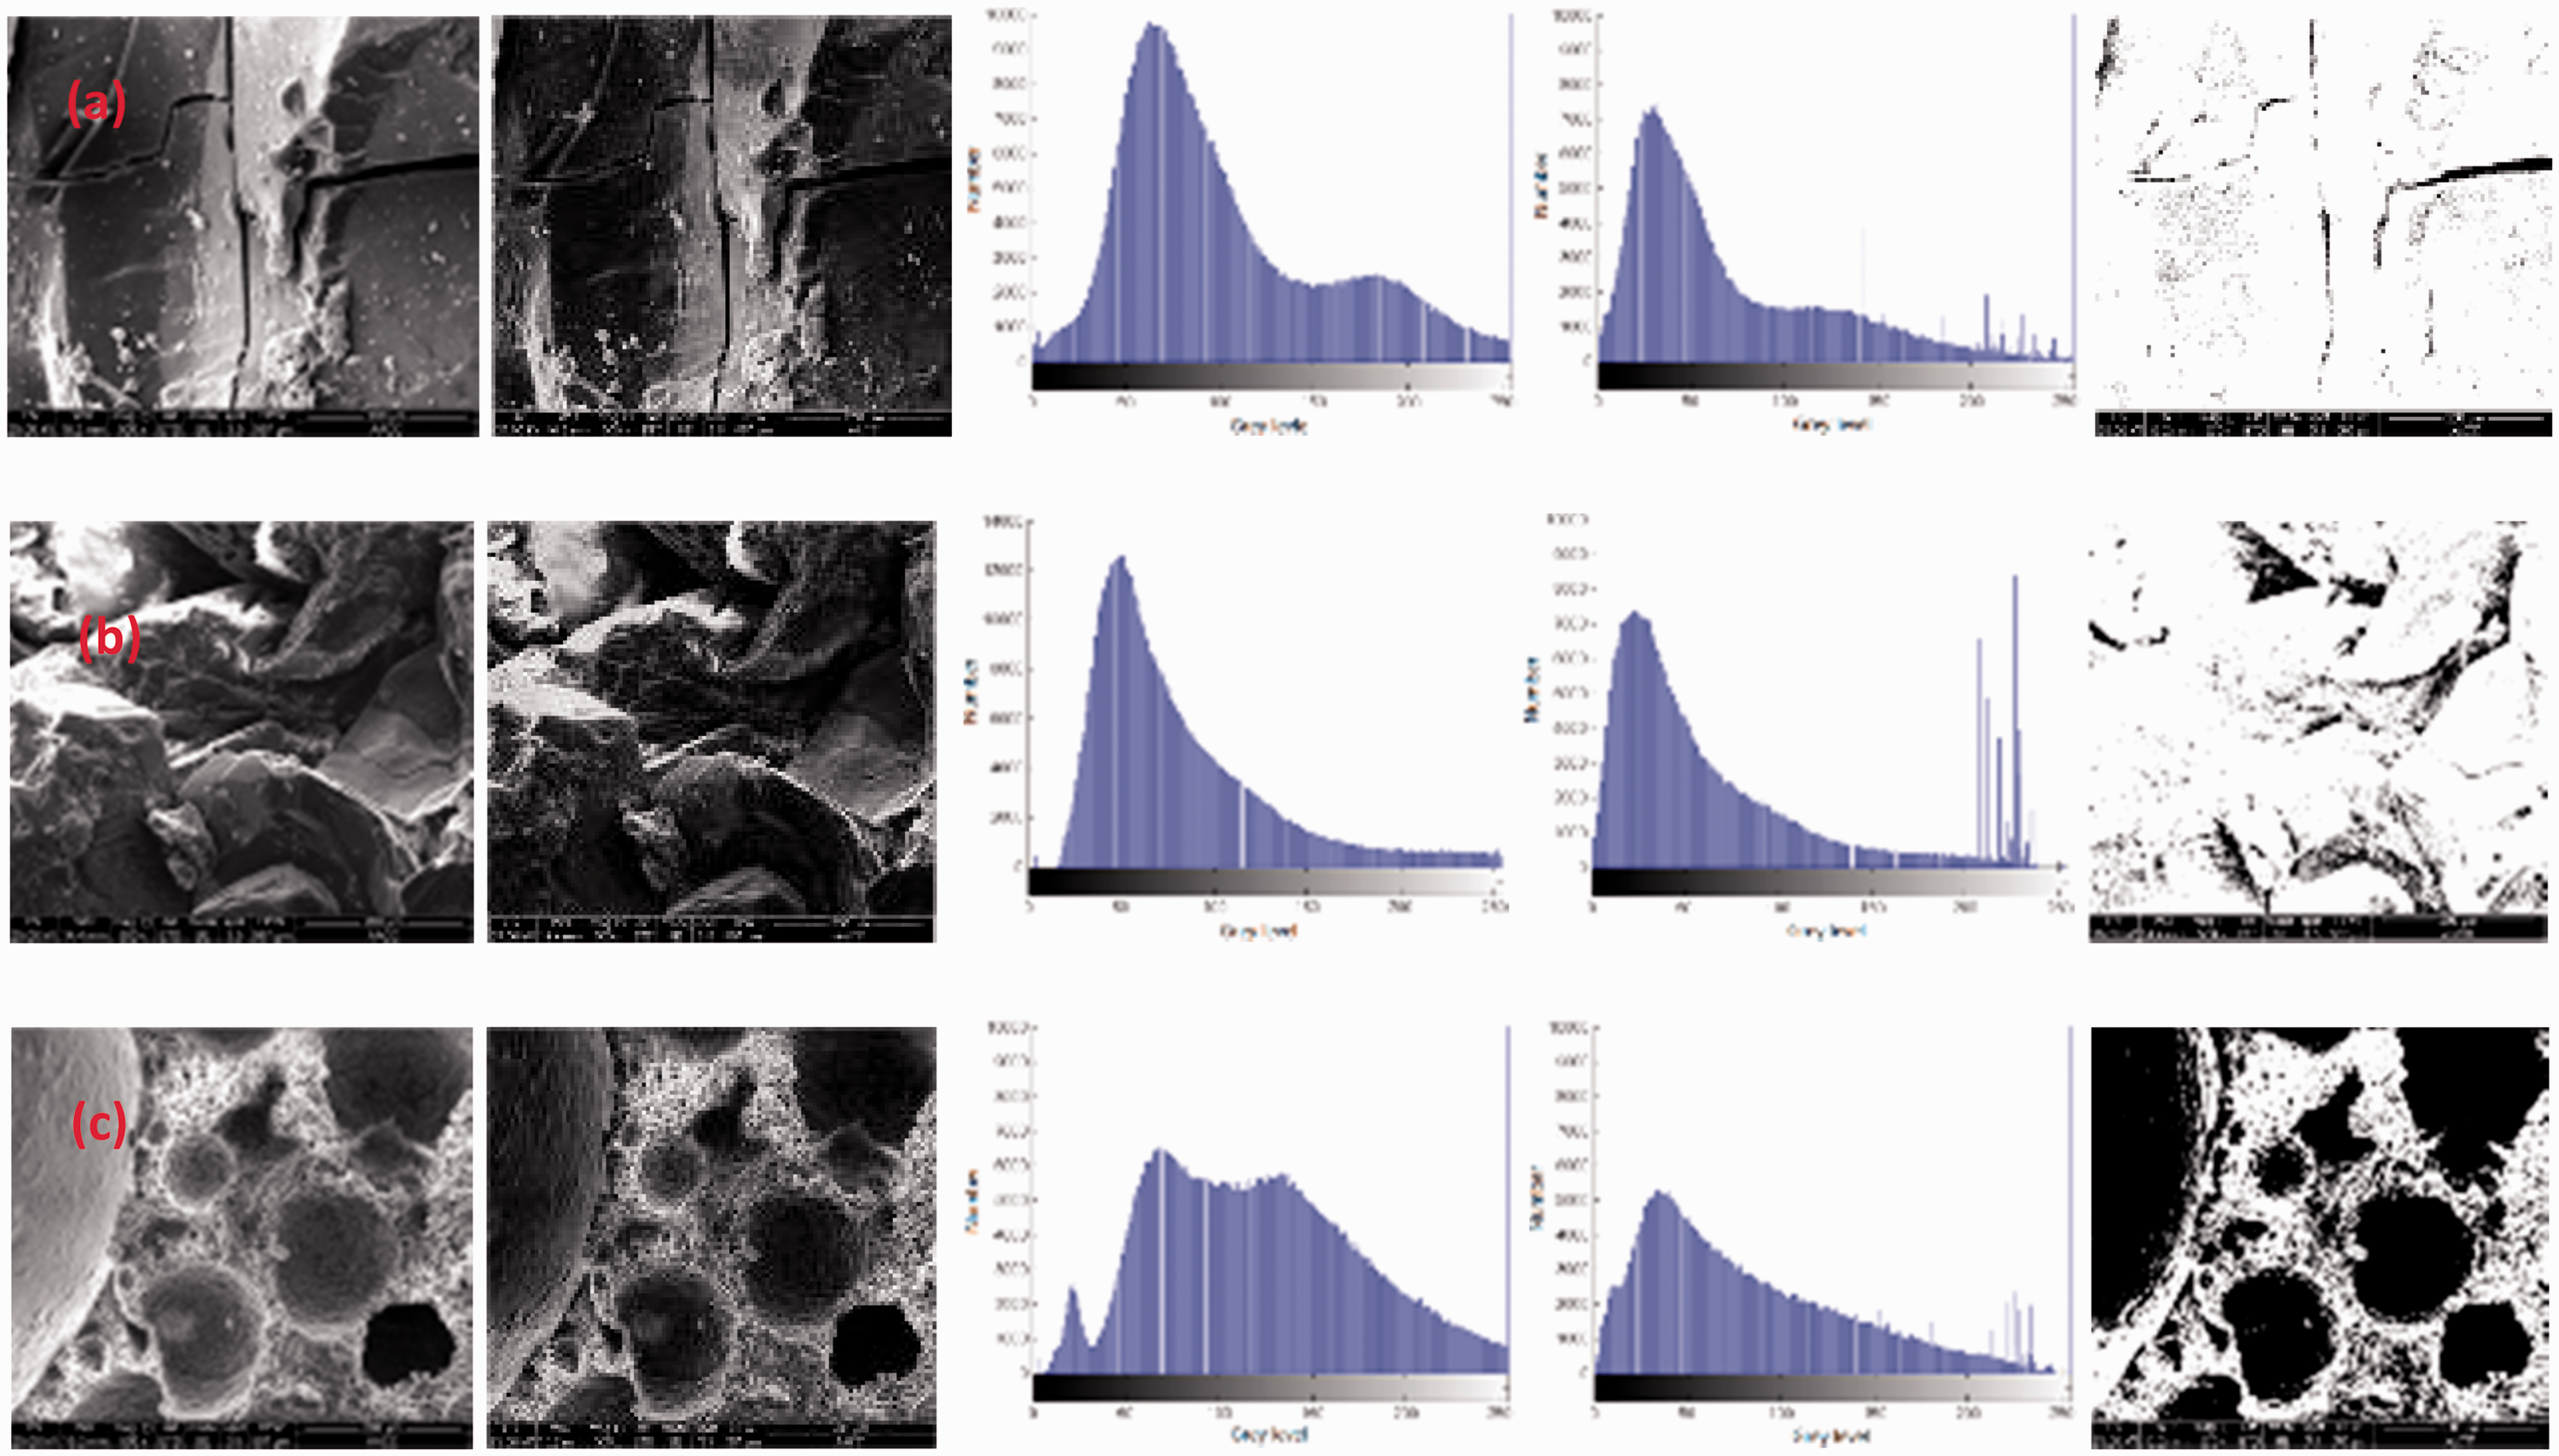

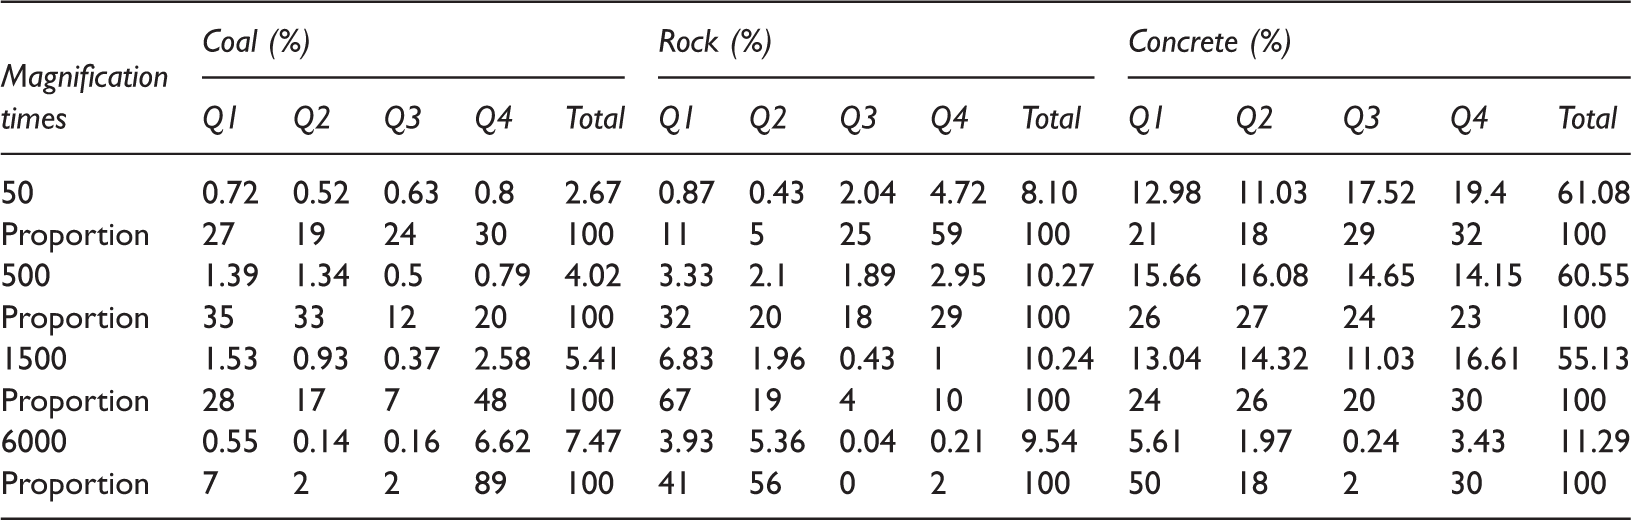
Porosities for coal, rock, and concrete at various magnification times via different methods.
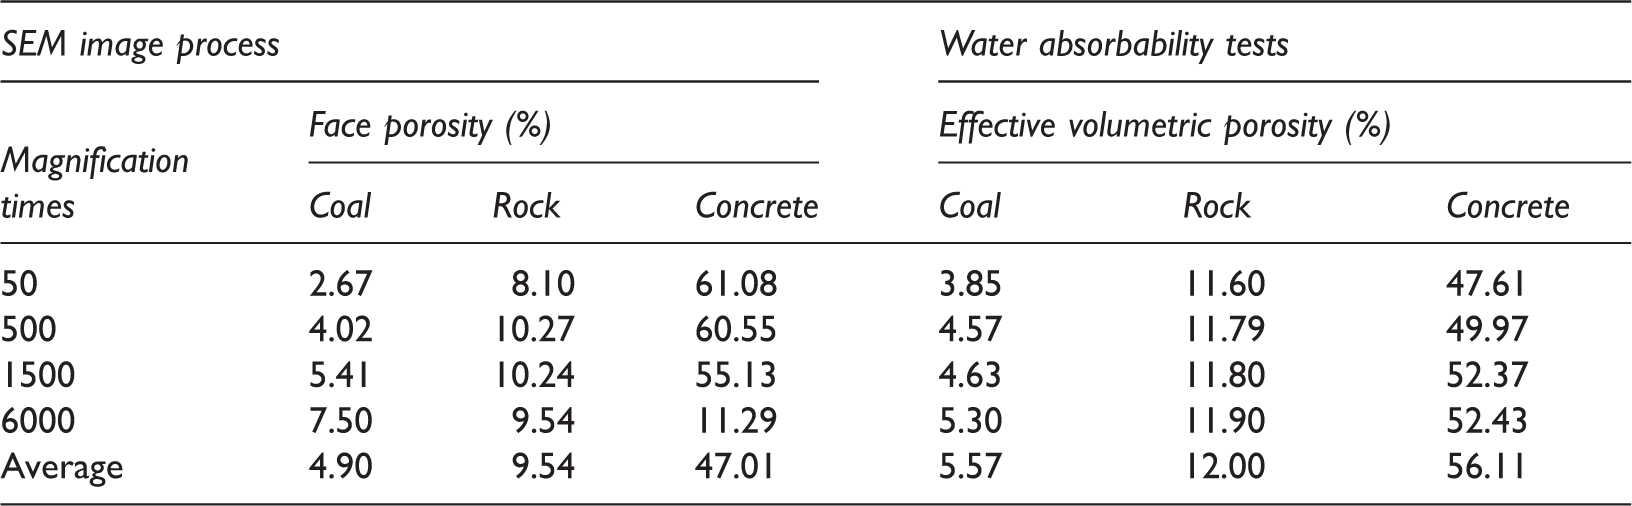
SEM: scanning electron microscope.
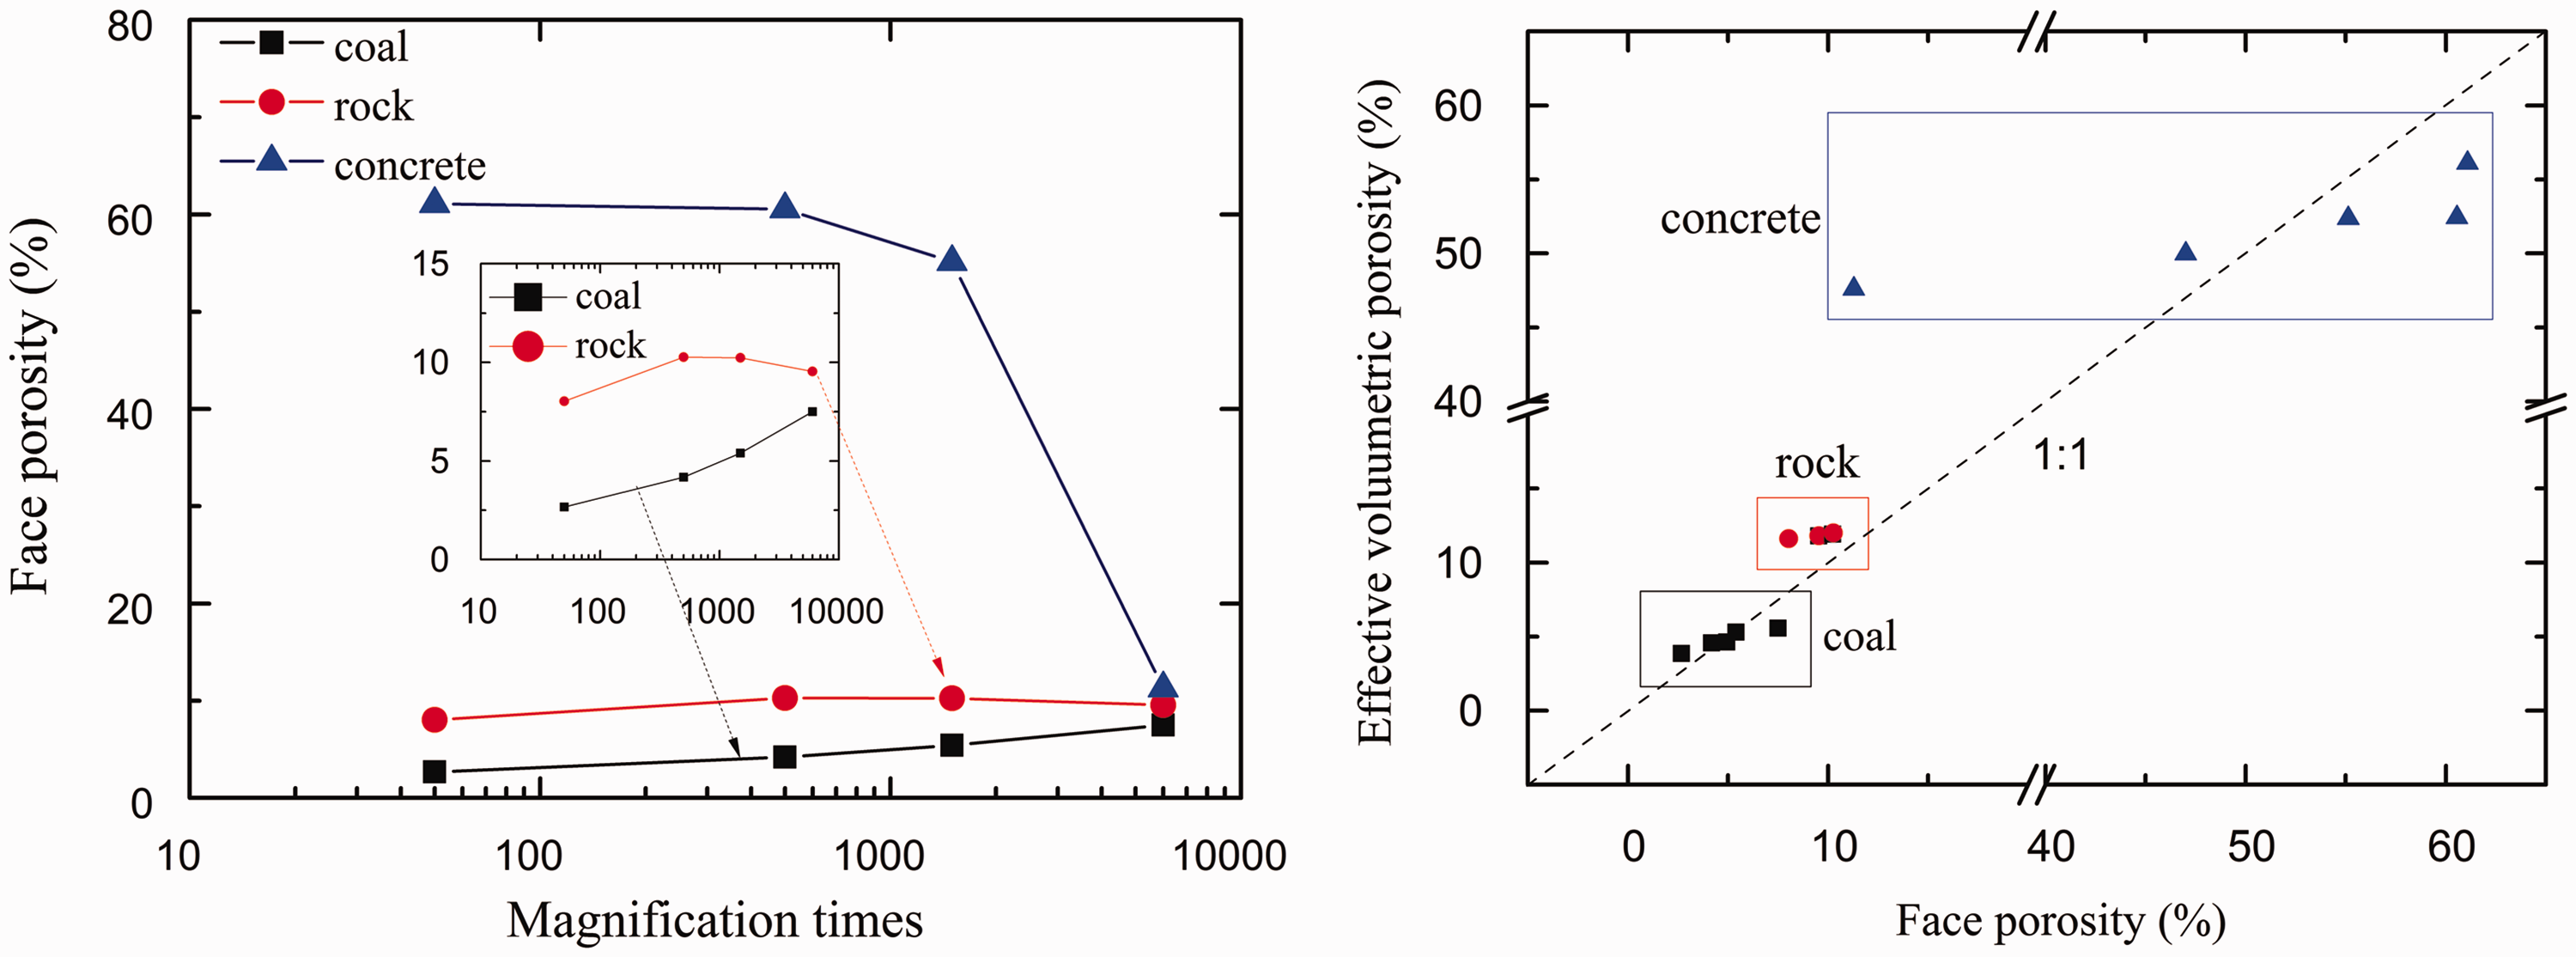
Relationship between porosity deduced from image processing and magnification times, as well as the comparison of porosity obtained by each method.
As presented in Table 3 and Figure 9, the face porosity obtained by SEM image processing for coal increases with magnification, from 2.67% at 50× to 7.5% at 6000×: the porosity is lower than that obtained by water absorbability tests when the magnification is under 1500×, but higher over it. However, the average porosity values acquired by the two different methods are remarkably close (4.95 and 4.78%). The reason for this phenomenon may be that a low magnification observation focuses on a panorama while a high magnification focuses on the micro-zone. As mentioned in “SEM images qualitative analysis” section, the matrix pores of coal are difficult to observe in a meso- or macro-scale SEM image, and only the cracks and fissures are obvious, yielding low face porosity. Once the SEM image focuses on a crack zone at high magnification, obviously the porosity in the binary image will increase considerably. Meanwhile the effects of low and high magnification times on face porosity obtained by SEM binary image processing can cancel each other out, showing remarkably close to average porosity results acquired from two different methods. Therefore, the conclusion can be easily drawn that the scalar effect has a great influence on the face porosity obtained by SEM binary image processing for coal.
For rock, as presented in Table 3 and Figure 9, the face porosity initially increases from 8.1 to 10.27% but then decreases to 9.54% when the magnification times are 50×, 500×, and 6000×, respectively. Although they show a small fluctuation, the porosity results are always less than those achieved by the water absorption experiments. As a result, the mean values of porosity obtained by the two methods are 9.54 and 11.82%, which is a significant gap. It is very difficult to account for this gap. The human subjective factor during the binary image threshold determination is a key factor influencing the face porosity. Additionally, the rock structure may be another important reason for underestimating the face porosity, as carbonate, silicate, and clay minerals on the surface of particles are typically favorable gas reservoirs with high porosity. However, due to the high brilliance, the above minerals are treated as a matrix or solid skeleton in the SEM binary image, leading to lower face porosity.
Compared with coal and rock, concrete has the most dramatic changes in face porosity. It decreases with increasing magnification times; in particular, at 6000× magnification the face porosity dramatically declines to 11.29%, a factor of 1/5 compared to other magnification times, showing a negative correlation between face porosity and magnification. At the same time, Figure 9 (right side) clearly shows that concrete has the largest fluctuation range between the face and effective volumetric porosity. These two aspects indicate that for artificial geomaterials, especially concrete, the porosity varies widely and is significantly affected by scalar effects. The main reason for this is similar to that which caused the face porosity changes in coal, but in the opposite direction. For example, at low magnification, the macro bubble holes occupying the body of the image are obvious and are treated as pores during the binary processing, yielding a larger face porosity. However, at high magnification, only meso-scale interparticle pores among the cement, aggregate, and fiber can be observed, which leads to a quite small face porosity.
From the above experimental and analytical results, one can conclude that the face porosity of coal, rock, and concrete can be acquired via SEM image processing technology with different magnification times, as well as via MATLAB. The obtained face porosity has a certain relationship with magnification times and the water absorbent experiment's effective volumetric porosity, in which coal and rock are more in line with the results of the water absorption experiment, but the concrete is not the same. Song (2014) extracted the rock pore with digital image processing technology. It was found that porosity fluctuated with the change of image size (i.e. the magnification times in this paper). When the image size increased, i.e. the magnification decreased, the porosity fluctuation range became narrow and then tended to be stable, which is very consistent with the results obtained in this paper. The existing literature has shown that the porosity of geotechnical porous media is closely related to its macro effective thermal conductivity. Under specific parameter conditions the change law, in which the macroscopic effective thermal conductivity of geomaterials decreases gradually with the increase of porosity, has become a consensus. In addition, many published studies have examined the relationship between porosity and macro thermal properties such as bulk effective thermal conductivity, thermal diffusion, and special heat capacity of geotechnical porous and multiphase materials (Abdulagatova et al., 2009; DeVries, 1963; Tarnawski and Leong, 2012). Several different prediction models also have been proposed to determine macro thermal properties such as block or solid matrix thermal conductivity, whether at a dry or water-saturated state. To sum up, the porosity of geomaterials obtained by SEM image processing technology could achieve higher accuracy after handling the correlation among macro-, meso-, and even micro-scales (scale effect), which will be more conducive to further analysis on its influence on other parameters.
Anisotropy analysis on porosity and thermal conductivity
Quadrant distribution proportion of porosity obtained via image processing.
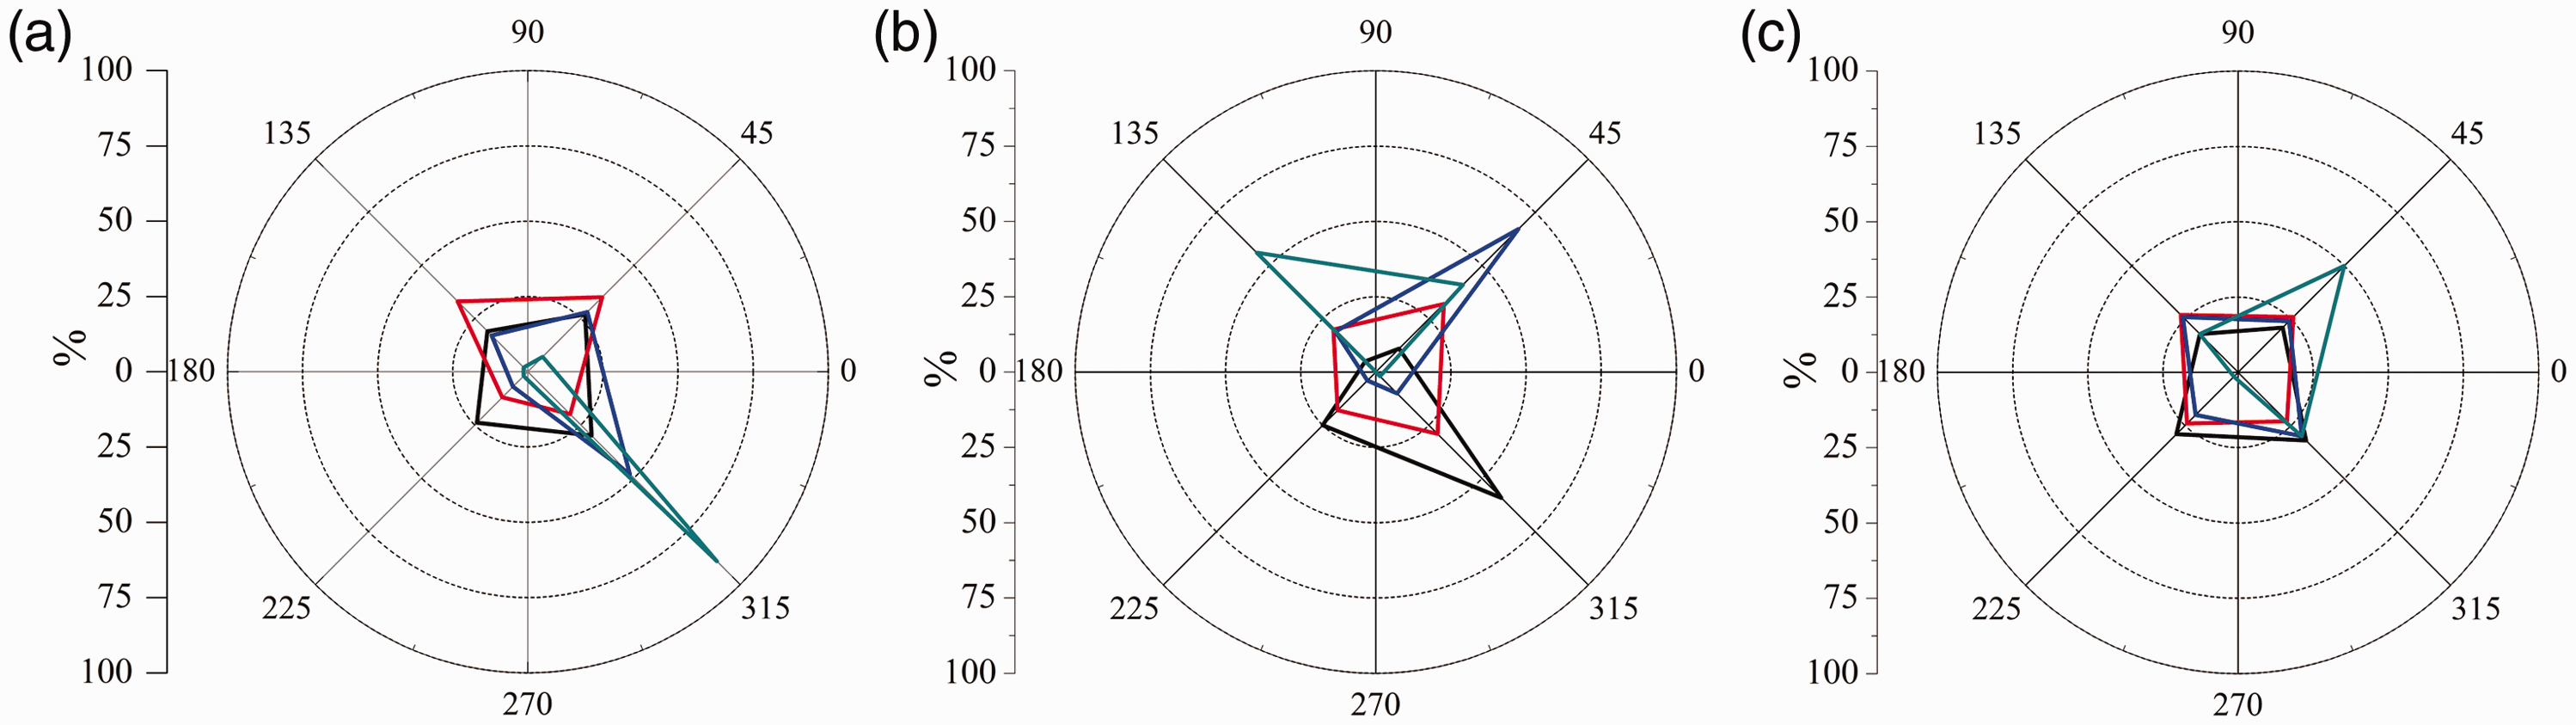
Quadrant anisotropy of porosity obtained via image processing for coal (a), rock (b), and concrete (c) with different magnification times.
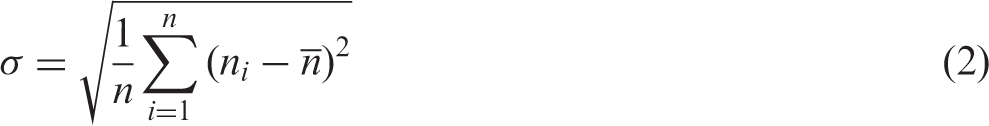
Standard deviation (
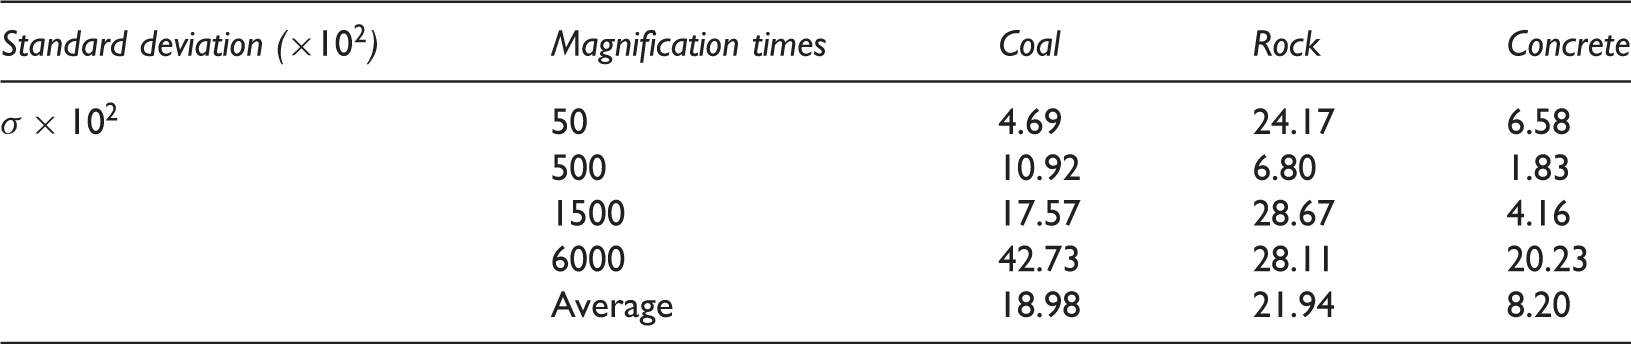
Figure 10(a) clearly shows that there is an insignificant change in the porosity distribution anisotropy of coal at less than 1500× magnification. At 6000× magnification, the porosity distribution is partial, and obviously the fourth quadrant has the largest anisotropy. Meanwhile, the corresponding standard deviation (
Horizontally, considering various magnification times, it was concluded that the order of the porosity quadrant distribution anisotropy for three types of geomaterials was concrete < coal < rock, which does not have a significant relationship with the size of the porosity itself. Vertically, at 6000× magnification, all three types of geomaterials indicate the highest porosity quadrant distribution anisotropy, while 500× magnification shows the strongest isotropy, which means that the porosity quadrant distribution anisotropy of geomaterials under various scales is significantly different. This is probably mainly due to the great influence of the scale effect on the anisotropy of pores distribution, i.e. anisotropy is the main reason for the scale effect in some characteristics of the material.
The porosity 2D images of the porous geomaterials could be obtained by digital image processing. However, it is difficult to obtain such a similar result for an important index—thermal conductivity indicates the macro thermal characteristic for the material. Therefore, most previous studies focused on the bulk effective thermal conductivity for materials with different porosities. Few scholars paid attention to analyzing whether there is a correlation between the porosity 2D image distribution anisotropy and the thermal conductivity 2D image distribution anisotropy. Based on the proposed optical scanning thermal conductivity determination method by Popov et al. (2016), further research on thermal conductivity anisotropy is possible. Similar to Shi et al. (1995) and Shi (1996), Popov et al. (2003) defined two conceptual factors in anisotropy:
Composition effects on macro-scale thermal conductivity
Apart from the structural parameters such as porosity, grain shape, size, etc., there are also some composition factors influencing the macro-scale thermal conductivity of geomaterials. The mineralogical composition of the solid skeleton and fluid in pores, cracks, and fissures are two of the most important elements contributing to thermal conductivity. In “Effective porosity and thermal conductivity” section, a simple analysis was carried out to explain the influence of different fluids on bulk thermal conductivity. The thermal conductivity of water (0.6 W/(m K)) is considerably higher than that of the air (0.026 W/(m K)) which may fill the pores, cracks, and fissures, yielding thermal conductivity changes with different porosity, moisture content, and so on. Here, special attention was paid to the mineralogical composition of the solid skeleton and matrix to research its effects on geomaterials' bulk effective thermal conductivity.
The micro-zone SEM/EDS elemental analysis was conducted prior to the XRD experiment to provide a fundamental reference for mineral petrographic analysis. Figure 11 shows that the main chemical elements for the coal, rock, and concrete investigated in this paper are C(73.67%), O(17.37%), S(4.02%), Fe(4.07%), and Au(0.87%); O(52.64%), Si(21.34%), Al(8.36%), C(4.55%), Na(4.36%), Fe(2.84%), Mg(1.94%), K(1.61%), and Au(2.36%); O(54.72%), Ca(22.56%), C(17.25%), Si(2.53%), Al(1.11%), Fe(0.83%), S(0.41%), Mg(0.32%), and K(0.25%), respectively. In order to improve the electrical conductivity, some samples were treated with gold spray. Therefore, the chemical element Au can be removed from the original composition of the specimens.
SEM/EDS elemental analysis for coal (a), rock (b), and concrete (c) specimens.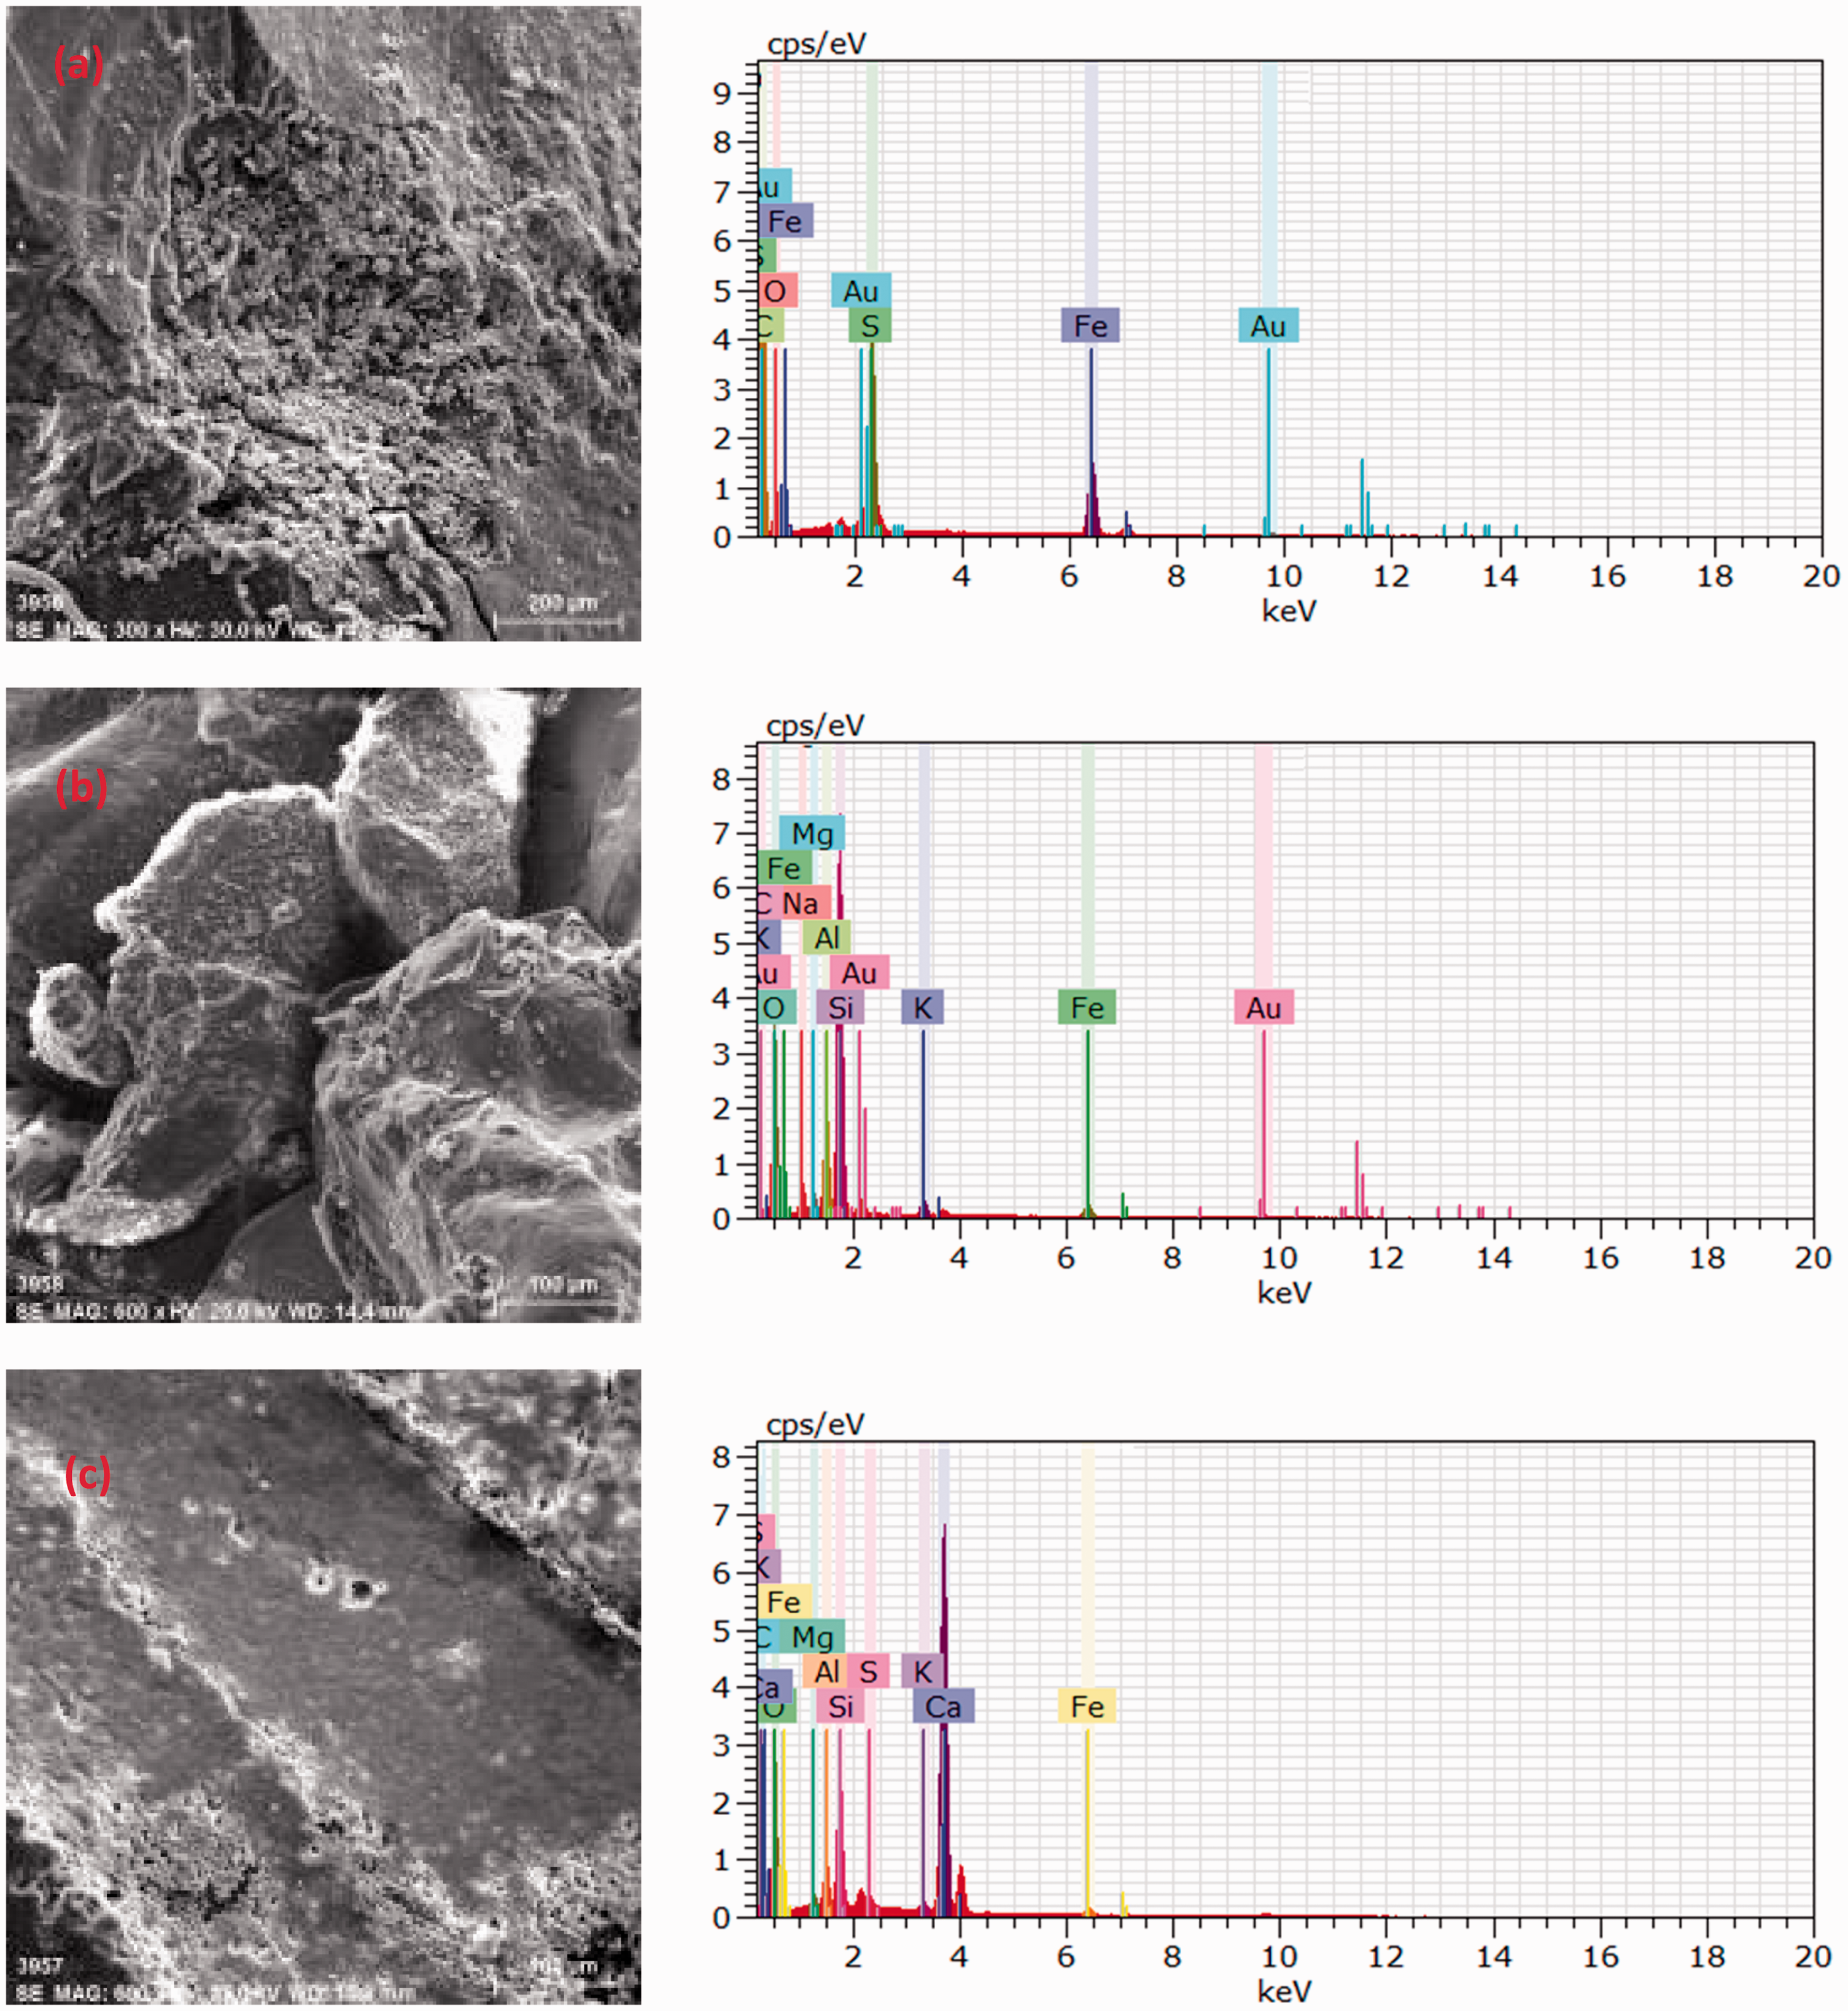
After the XRD experiments were carried out, the original diffraction spectrum can be obtained, as shown in Figure 12(a). Via the MDI Jade software, the qualitative and quantitative petrographic analysis achieved useful results, giving the mineral phases and their content information (quantitative or semiquantitative determination by K value method), which is shown in Figure 12(b) to (e).
XRD spectrum as well as petrographic identification and analysis for coal, rock, and concrete powder.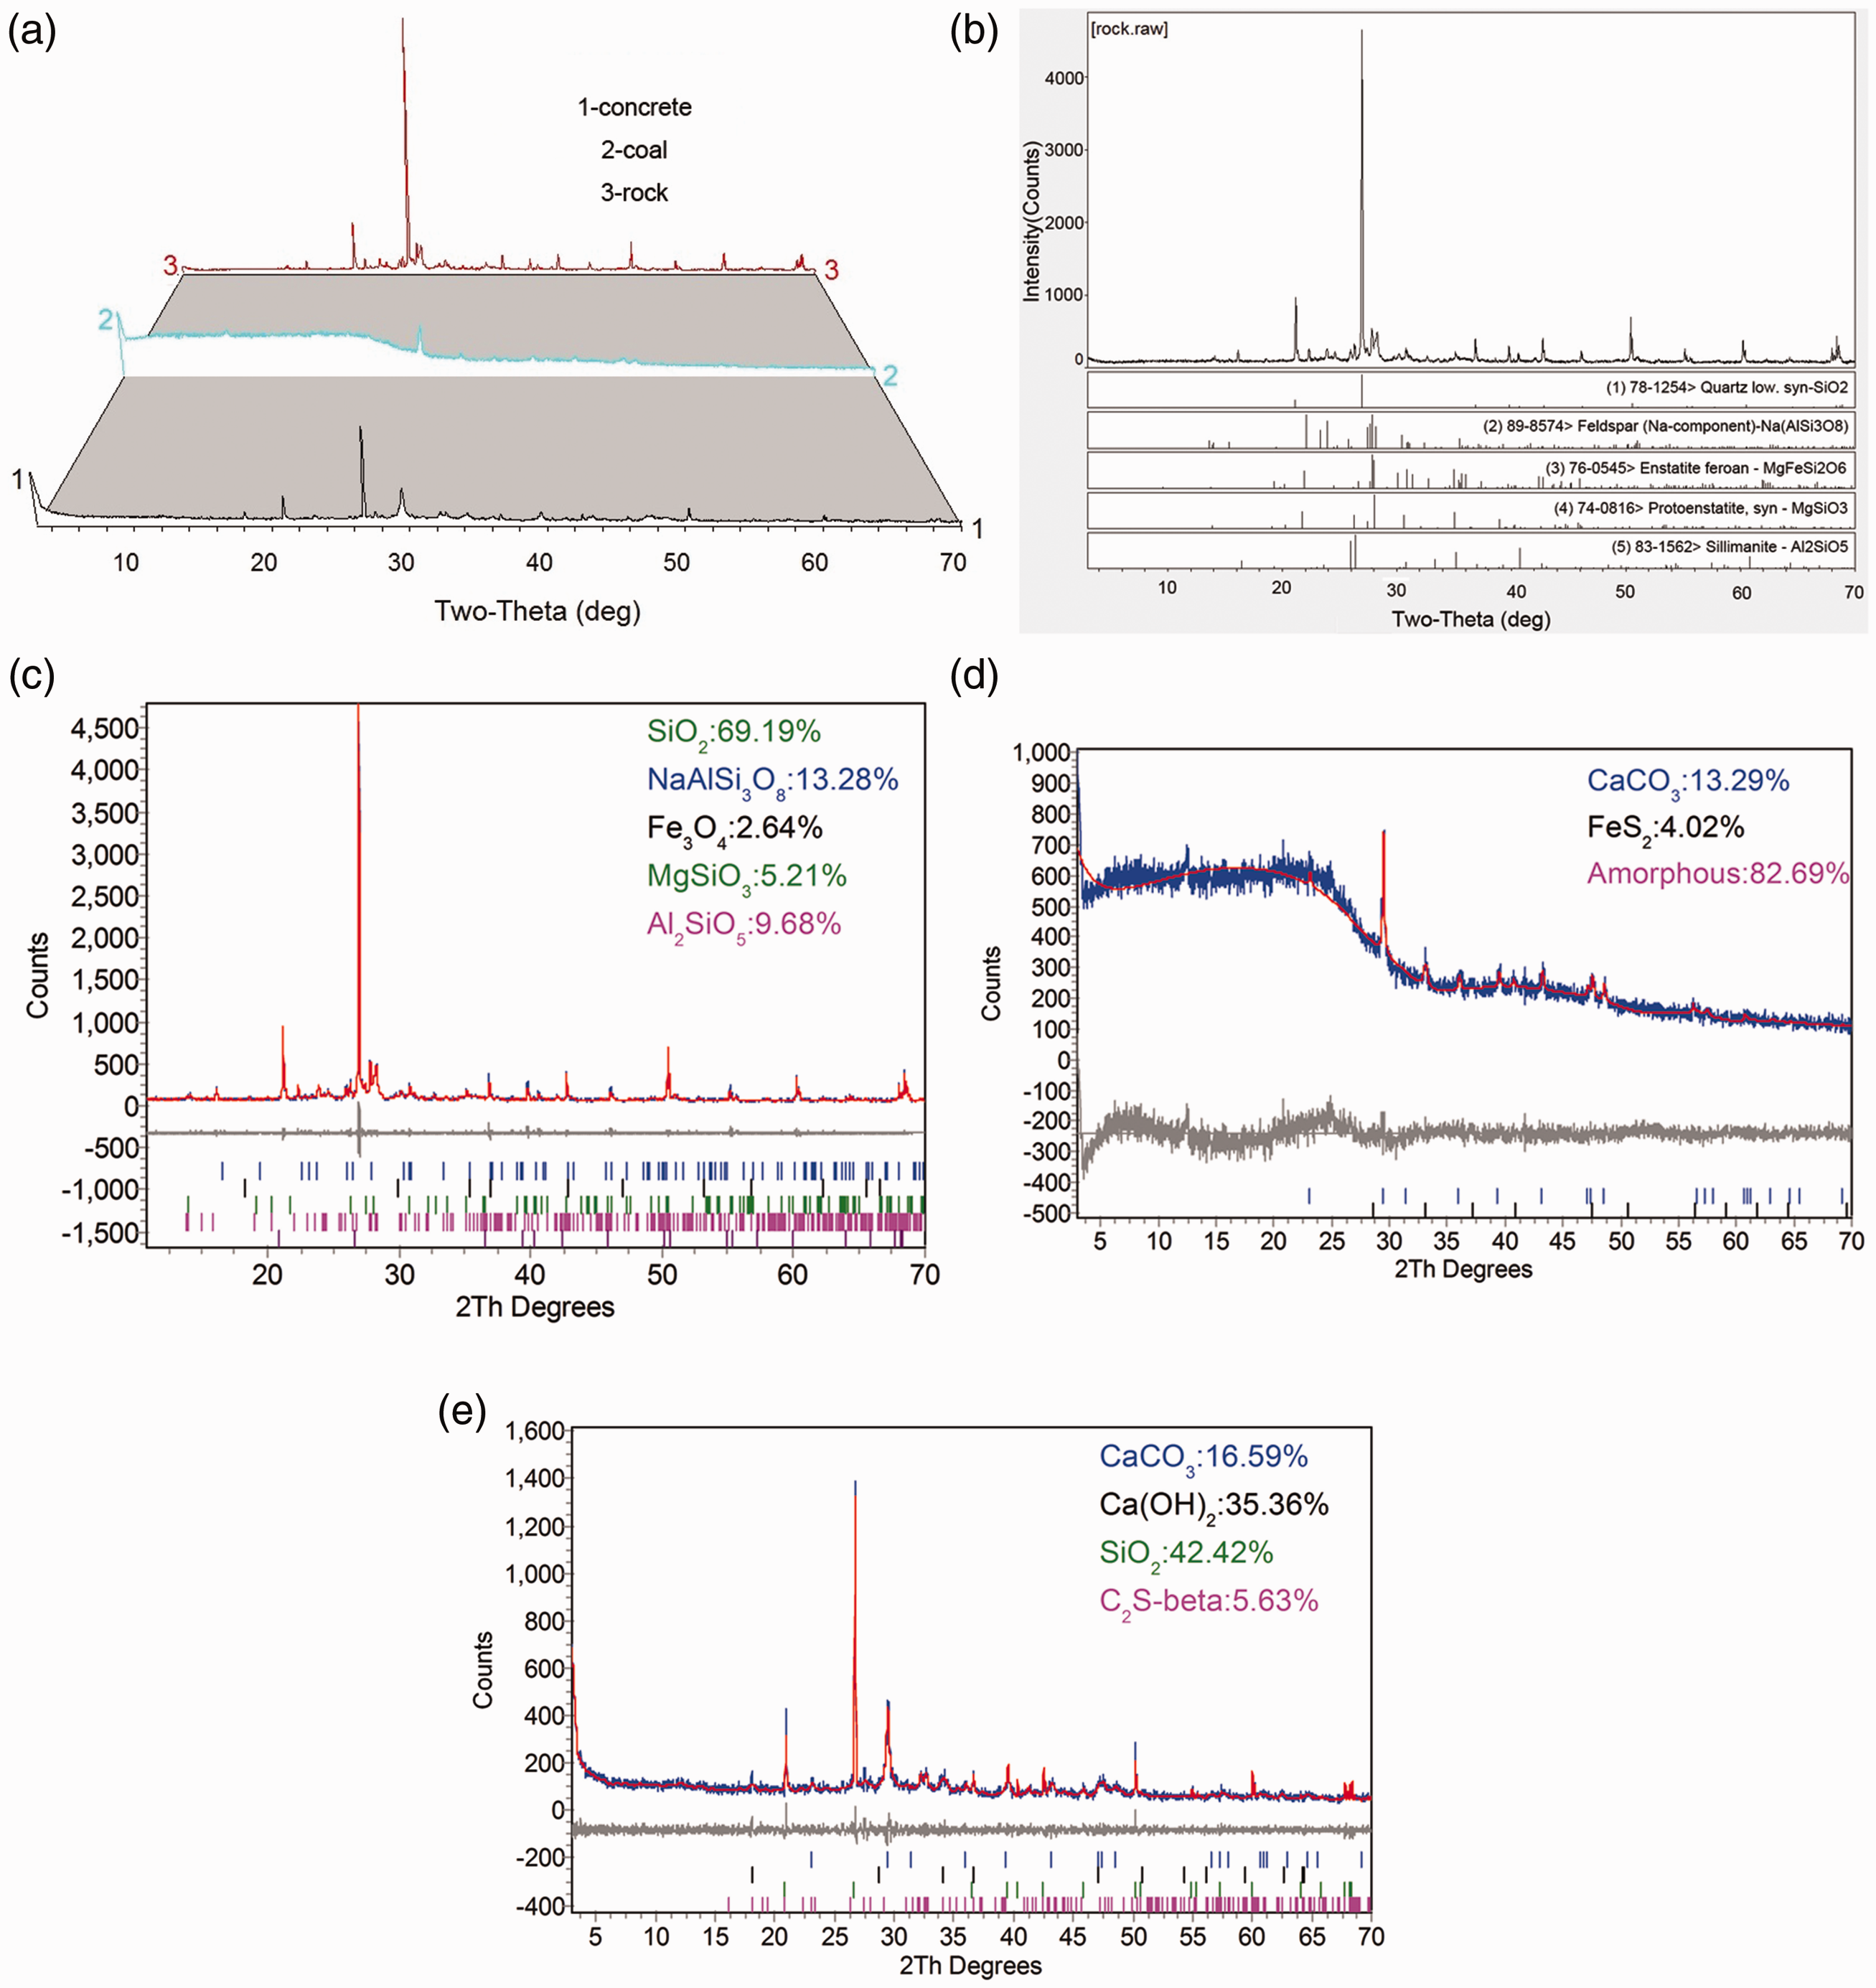
Apart from some pyrite and calcite (the main mineral phases in coal), the coal is mainly made up of amorphous and semicrystalline elements (the characteristic peaks are not obvious), which are combustible organic macerals consisting of vitrinite, inertinite, and liptinite according to the classification in coal geology. Individually determining the thermal conductivity of vitrinite, inertinite, and liptinite is inherently challenging due to the difficulty of accurately separating them in the macro-scale from the coal matrix. For rock and concrete, the characteristic peak intensity of quartz is the most obvious, which indicates that the quartz is the main mineral in the rock and concrete investigated in this paper. There are also some other mineral phases in rock: feldspar, sillimanite, magnetite, etc. Meanwhile, as a type of artificial geomaterial, it is easier to obtain the main elemental and mineral phases in concrete, which contains quartz, limestone, and calcite, among other things. At room temperature, the thermal conductivity of common minerals is known, e.g. the thermal conductivity of quartz is approximately 7.7–7.8 W/(m K) while that for feldspar is nearly 2.3 W/(m K) (Albert et al., 2017; Fuchs and Forster, 2010). The other minerals' thermal conductivity also can be easily obtained from the existing literature or a handbook. Obviously, the solid skeleton or matrix thermal conductivity of geomaterials depends on the species and content of mineral phases. Once the mineral phases' volume fractions and thermal conductivities are known, the solid skeleton or matrix thermal conductivity of the geomaterials can be computed by an appropriate mixing model, e.g. the thermal conductivity geometric mixing law defined as follows
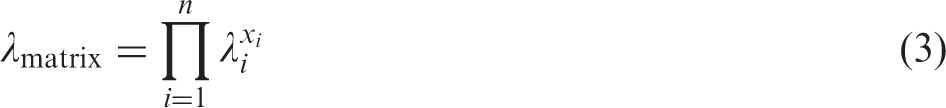
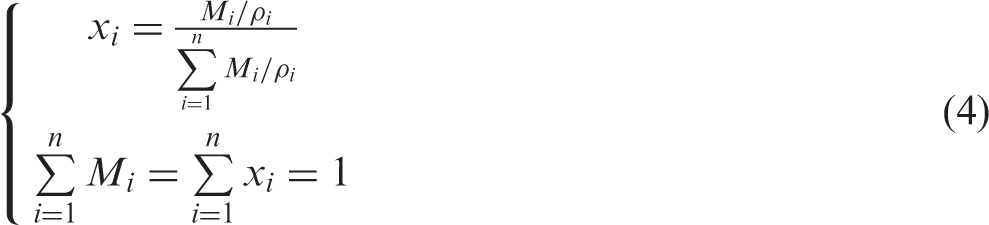
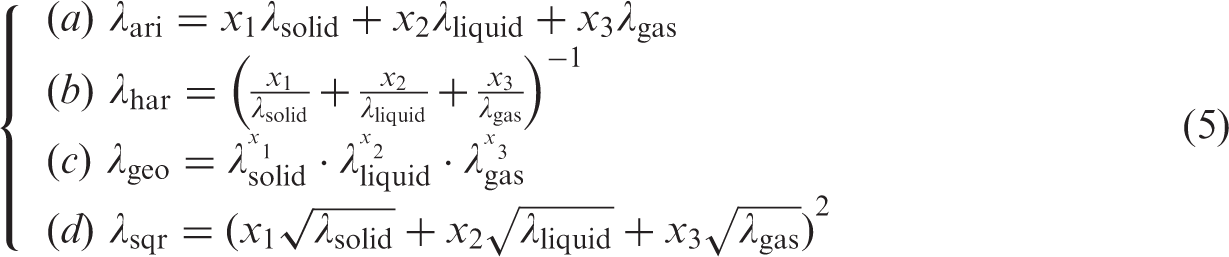
Furthermore, with the fundamental parameters such as λmatrix, λfluid, and Φe, the macro-scale bulk effective thermal conductivity for geotechnical porous media consisting of three phases (solid, liquid, and gas) can be calculated via various existing mixing law models (Albert et al., 2017), e.g. arithmetic and harmonic means, geometric and square root means, etc. The geometric means model is the most widely used. These four basic models can be illustrated as follows
With the combination of the above results, the relationship between meso-scale composition and structure characterization and macro-scale bulk effective thermal conductivity, for typical multicomponent porous geomaterials, can be illustrated in Figure 13. From Figure 13 we can also explain the relationship between laboratory-measured thermal conductivity and the other parameters of geomaterials targeted in this paper. On the one hand, quartz with a high thermal conductivity is the dominant mineral in rock, and on the other hand, the porosity of rock is in the median, not the highest and lowest, implying that the rock shows the highest macro effective thermal conductivity. Although quartz also accounts for the greatest percentage in concrete, the concrete does not have a great thermal conductivity due to its high porosity. This porosity also leads to a relatively significant fluctuation on thermal conductivity compared to coal and rock, when the concrete is dry or water saturated. Coal has the lowest porosity but a median macro effective thermal conductivity, from which we can judge that the coal matrix thermal conductivity may be not very high (perhaps less than 1 W/(m K)). The thermal conductivity differences of coal under various conditions are also the most insignificant. However, the above explanation only applies to qualitative analysis; sufficiently accurate quantitative analysis still requires further research.
The relationship between meso-scale composition, structure, and macro-scale bulk effective thermal conductivity for typical multicomponent porous geomaterials. SEM: scanning electron microscope; XRD: X-ray diffraction.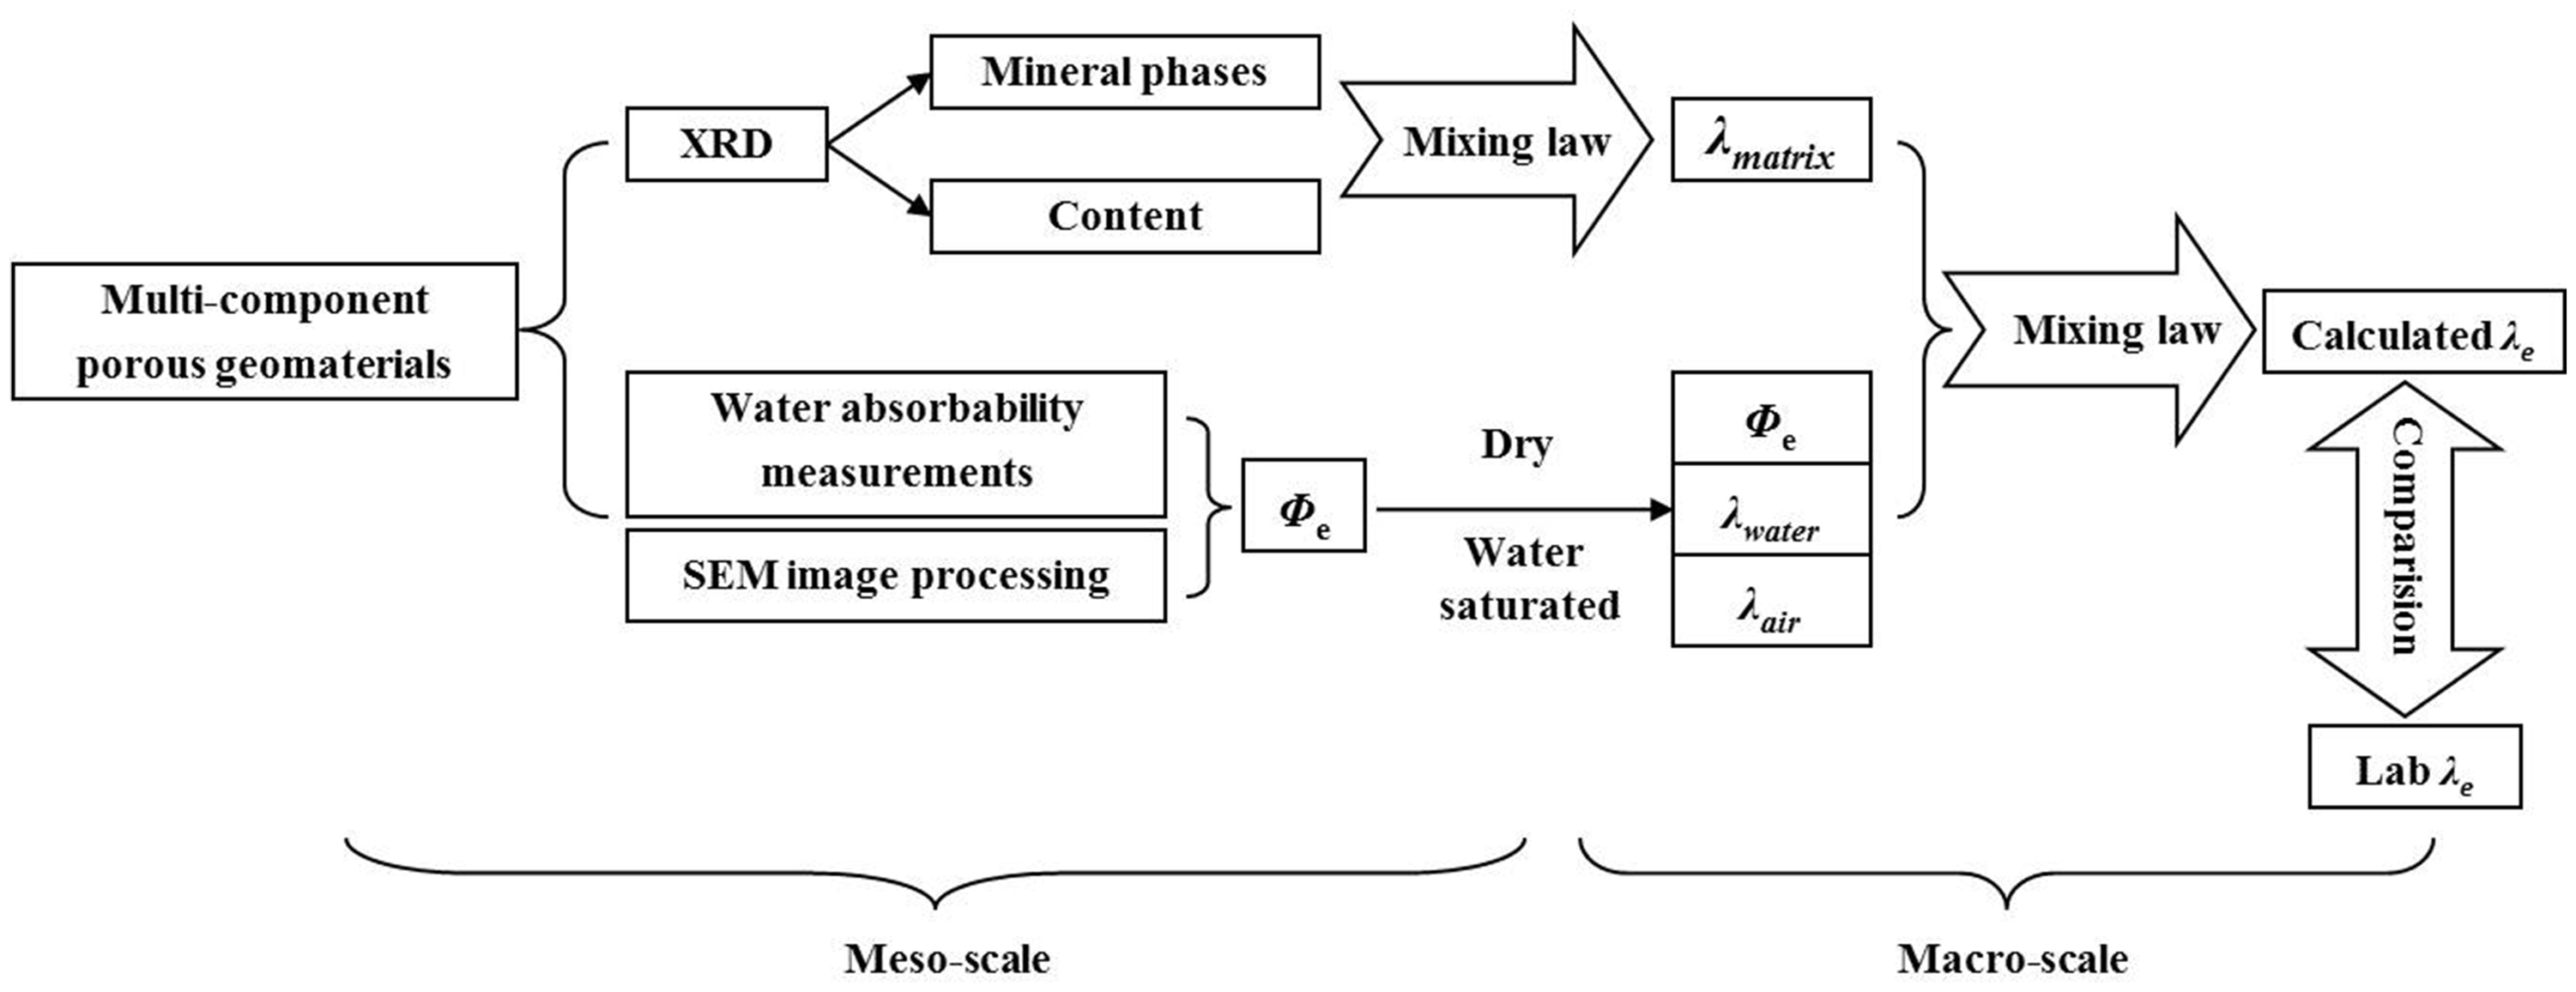
Conclusion
This paper carried out horizontally comprehensive meso-scale composition and structure analyses on the influences on the macro-scale bulk effective thermal conductivity for coal, rock, and concrete. Based on the findings in this study, the following principal conclusions can be drawn.
The ranking in terms of bulk effective porosity for coal, rock, and concrete (foamed fiber shotcrete) is coal < rock < concrete. However, for thermal conductivity, the orders are concrete <coal < rock in a dry state and coal < concrete < rock in a water-saturated state, showing the different effects of the degree of meso-scale composition (solid versus fluid) and structure (porosity) on macro-scale bulk effective thermal conductivity. To a certain extent, the coal, rock, and concrete surface morphology obtained by SEM imaging can explain thermal conductivity fluctuation under various conditions, illustrating that the meso-scale structure, i.e. the shape, size, and contact form of particles and pores (matrix pore and fracture pore), influences the macro-scale thermal conductivity. The face porosity and its quadrant anisotropy degree can be obtained via SEM digital image processing technology. Both of them have a certain relationship with magnification times (scale effect) and water-absorbent experimental effective volumetric porosity, which in turn are closely related to the macro effective thermal conductivity and its anisotropy degree. Besides the solid and fluid composition, the mineral composition (species and content of mineral) of the solid skeleton or matrix also significantly influences the macro-scale thermal conductivity of geomaterials. Quantitative analysis can be achieved via XRD, however, but it still needs further research to improve the accuracy. The relationship between meso-scale composition and structure and macro-scale bulk effective thermal conductivity for typical multicomponent porous geomaterials was established to summarize the research outline of this paper, which may be of detail reference value for similar research in the future.
Footnotes
Declaration of conflicting interests
The author(s) declared no potential conflicts of interest with respect to the research, authorship, and/or publication of this article.
Funding
The author(s) disclosed receipt of the following financial support for the research, authorship, and/or publication of this article: This work was supported by “The Fundamental Research Funds for the Central Universities” (2017BSCXB55), Research and Innovation Project for College Graduates of Jiangsu Province” (KYCX17_1527). The authors thank for these financial supports.