
Abstract
The aim of this paper is to evaluate the economic and environmental effects of increasing indigenous coal share in electricity generation by using extended input–output analysis. The policy scenario is a $1 million increase in demand for investment in the coal mining sector. In order to analyze this policy option, we specifically developed an extended input–output analysis associated with disaggregating the electricity sector into electricity generation transmission and distribution and the mining sector into coal and oil–gas mining. Furthermore, we use a range of key economic and environmental indicators to evaluate the effects of increasing indigenous coal production on these indicators. The results indicate that the $1 million increase in final demand for indigenous coal produces an increase in economic output for all sectors of $1,389,241 and an increase in total greenhouse gases of 229,572 CO2-equivalents (kg CO2-e) as well.
Introduction
Development of Turkey’s electricity generation industry (1990–2015).
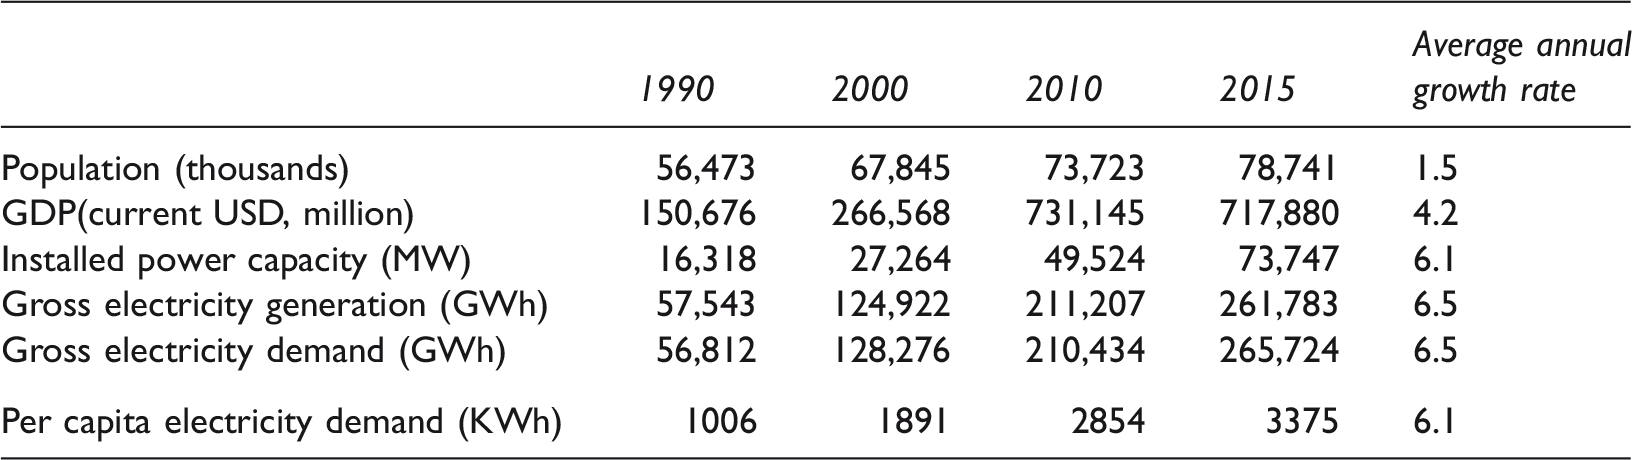
Source: TUIK (2017) and IEA (2016).
Overview of electricity generation and capacity.
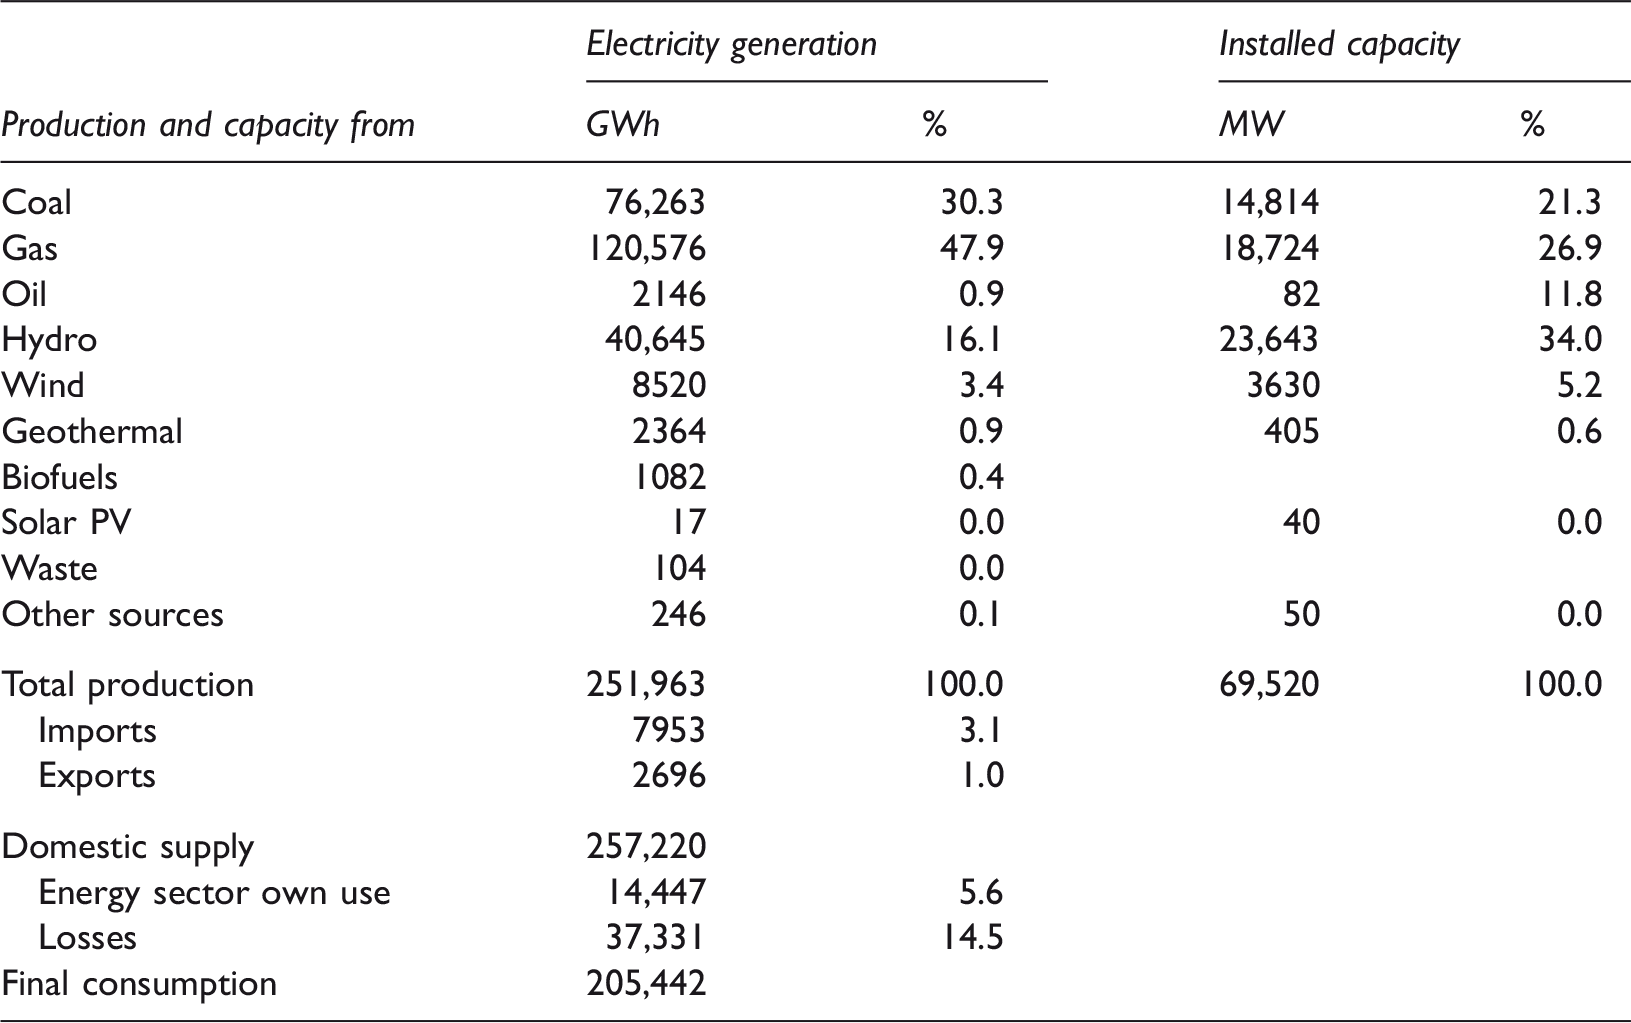
Source: IEA (2017) and TEIAS (2016).
In Turkey, the mix of electricity generation fluctuates each year due to the seasonal nature of the hydro resources and disabled or unavailable old lignite thermal power plants. For example, the hydropower production was at a low level of 40.6 TWh in 2014, while the production of hydropower averaged 47 TWh for the period of 2005–2015, or 22% of total generation. The share of hydro and natural gas in total electricity generation has been volatile. In recent years, while the share of coal in electricity generation has increased, the share of petrol has decreased gradually, while the share of natural gas has increased from 45% in 2005 to 48% in 2014 (IEA, 2016).
It is clear that Turkey mostly meets its energy demand from imported fossil fuels due to the very limited high-quality indigenous oil and natural gas resources it has. However, Turkey is rich in lignite reserves, 1 which are regarded as the essential component of the future energy supplies. More than 80% of the domestically produced lignite is used in electricity generation. In 2014, approximately 9,000 MW or 12% of total installed power generation capacity comes from the domestic (lignite) coal-fired power plants. With coal, nuclear energy, and renewable resources, the government hopes to play an important role in electricity generation and also in ensuring energy supply (IEA, 2016). Therefore, government attempts to cover its deficit of electricity generation and decrease its dependence on foreign energy resources namely natural gas. The main goal of Turkey’s energy strategy is to increase the amount of electricity generated from indigenous coal to 60 TWh by 2019 (MENR, 2015) and ultimately to generate electricity for all existing lignite and coal potential to ensure supply security. This approach has the potential to create certain global and national environmental issues that must be taken into account, among which carbon emission and its implications on climate change can be counted.
The proposed analysis in this paper evaluates economic and environmental impacts of using more domestic coal (lignite) in electricity generation on Turkish economy. Electricity generation for sustainable development is not only the main issue in Turkey, but it is also vital one for many countries around the world. Therefore, this issue has been studied on life cycle basis for developed or developing countries in literature. With the limits of life cycle analysis as a tool to assess sustainability (Bergerson and Lave, 2004), it is widely used as a tool for evaluation of the impact for a commodity to sustainable development because it is widely accepted and perfectly suited for evaluating the environmental, economic, and social sustainability (Atılgan and Azapagic, 2016). In the electricity generation literature, the life cycle assessment studies of Uchiyama (2007), Weisser (2007), Lenzen (2008), Hondo (2005), Denholm and Kulcinski (2004), and Gagnon et al. (2002) are the most comprehensive examples of electricity generation. In their assessments, these studies used one or more indicators, particularly greenhouse gas (GHG) emissions and energy accounting. Gagnon et al. (2002) take the widest range of indicators of sustainability into account with no consideration of social impacts. Life cycle assessment studies often employ not only process analysis but also input–output analysis. A number of studies (Heijungs et al., 2006; Heijungs and Suh, 2002; Hendrickson et al., 1998; Joshi, 1999; Lave et al., 1995; Lenzen, 2002; Matthews and Small, 2000; Suh and Huppes, 2005) have evaluated the impacts of environmental, economic, and social sustainability on electricity generation using input–output analysis. However, Atılgan and Azapagic (2016) study presents, for the first time, an integrated life cycle sustainability assessment of the electricity sector in Turkey, using multi-criteria analysis. Using input–output-based techniques with process analysis, comparing life-cycle inventories generally provide more comprehensive results since process analysis truncates inputs from higher upstream production processes lead to the system boundaries (Lenzen, 2002; Suh and Huppes, 2005).
The Turkey’s electricity generation sector has significant effects on environment, economy, and society. Although it is of great importance to measure and analyze the effects of sustainability on electricity generation, it has not been studied sufficiently. For this reason, the main purpose of this study is to measure the environmental, economic, and social impacts of the domestic coal-based power generation sectors in Turkey, using a sustainability assessment framework based on an economic input–output analysis. As one of the developing countries, the assessment of the impact of the increased domestic coal share in electricity generation on key economic and environmental indicators in Turkey is key to providing tools for planners and decision makers on the way to the sustainable development.
The paper is organized as follows: The underlying method, which is based on input–output techniques associated with data and policy scenario, is presented in the next section. Then, the results of economic and environmental impacts of analysis are carried out. Finally, the conclusions and policy recommendation are given.
Methodology, data, and policy scenario
Economic input–output analysis
The economic input–output analysis is a quantitative economic method that represents the interdependencies between different industries of examined economy, developed by Leontief (1941, 1966). Even though applications of the economic input–output model are based on a large body of literature, the most recent overviews are given by Miller and Blair (2009) and Rose and Miernyk (1989), which are also considered the best overviews.
Input–output analysis is known as a top-down linear macroeconomic approach of analyzing industrial structure. Sectoral monetary transaction data are used in an inter-industry model to evaluate the complex dependencies of industries in national economies. Even though the input–output analysis has been developed for economic analysis, extended input–output analysis has been implemented for energy and environmental issues since the late 1960s. 2
Input–output analysis based on input–output table depicts the flow of goods and services through the sectors of the entire economy in terms of monetary exchange. Hence, the table shows how output from one industrial sector may become an input for another industrial sector by forming input–output matrix. This format therefore shows the monetary value of inputs to each sector at each column, and the value of each sector’s outputs at each row. As shown in Figure 1, the extended input–output table is composed of many blocks and commodity flows between sectors and final users. The intermediate flows (Xij),
3
core of the input–output table, look like two-dimensional matrix and describe the purchasing
4
and the selling flows among the productive sectors in the first block. In the second block, a series of columns show the industry deliveries to the final demand (Fj) including household consumption and public expenditure, investments, and exports. The third part completes the matrix with the rows that represent the labor and capital incomes and the taxes.
Schematic overview of extended input–output analysis.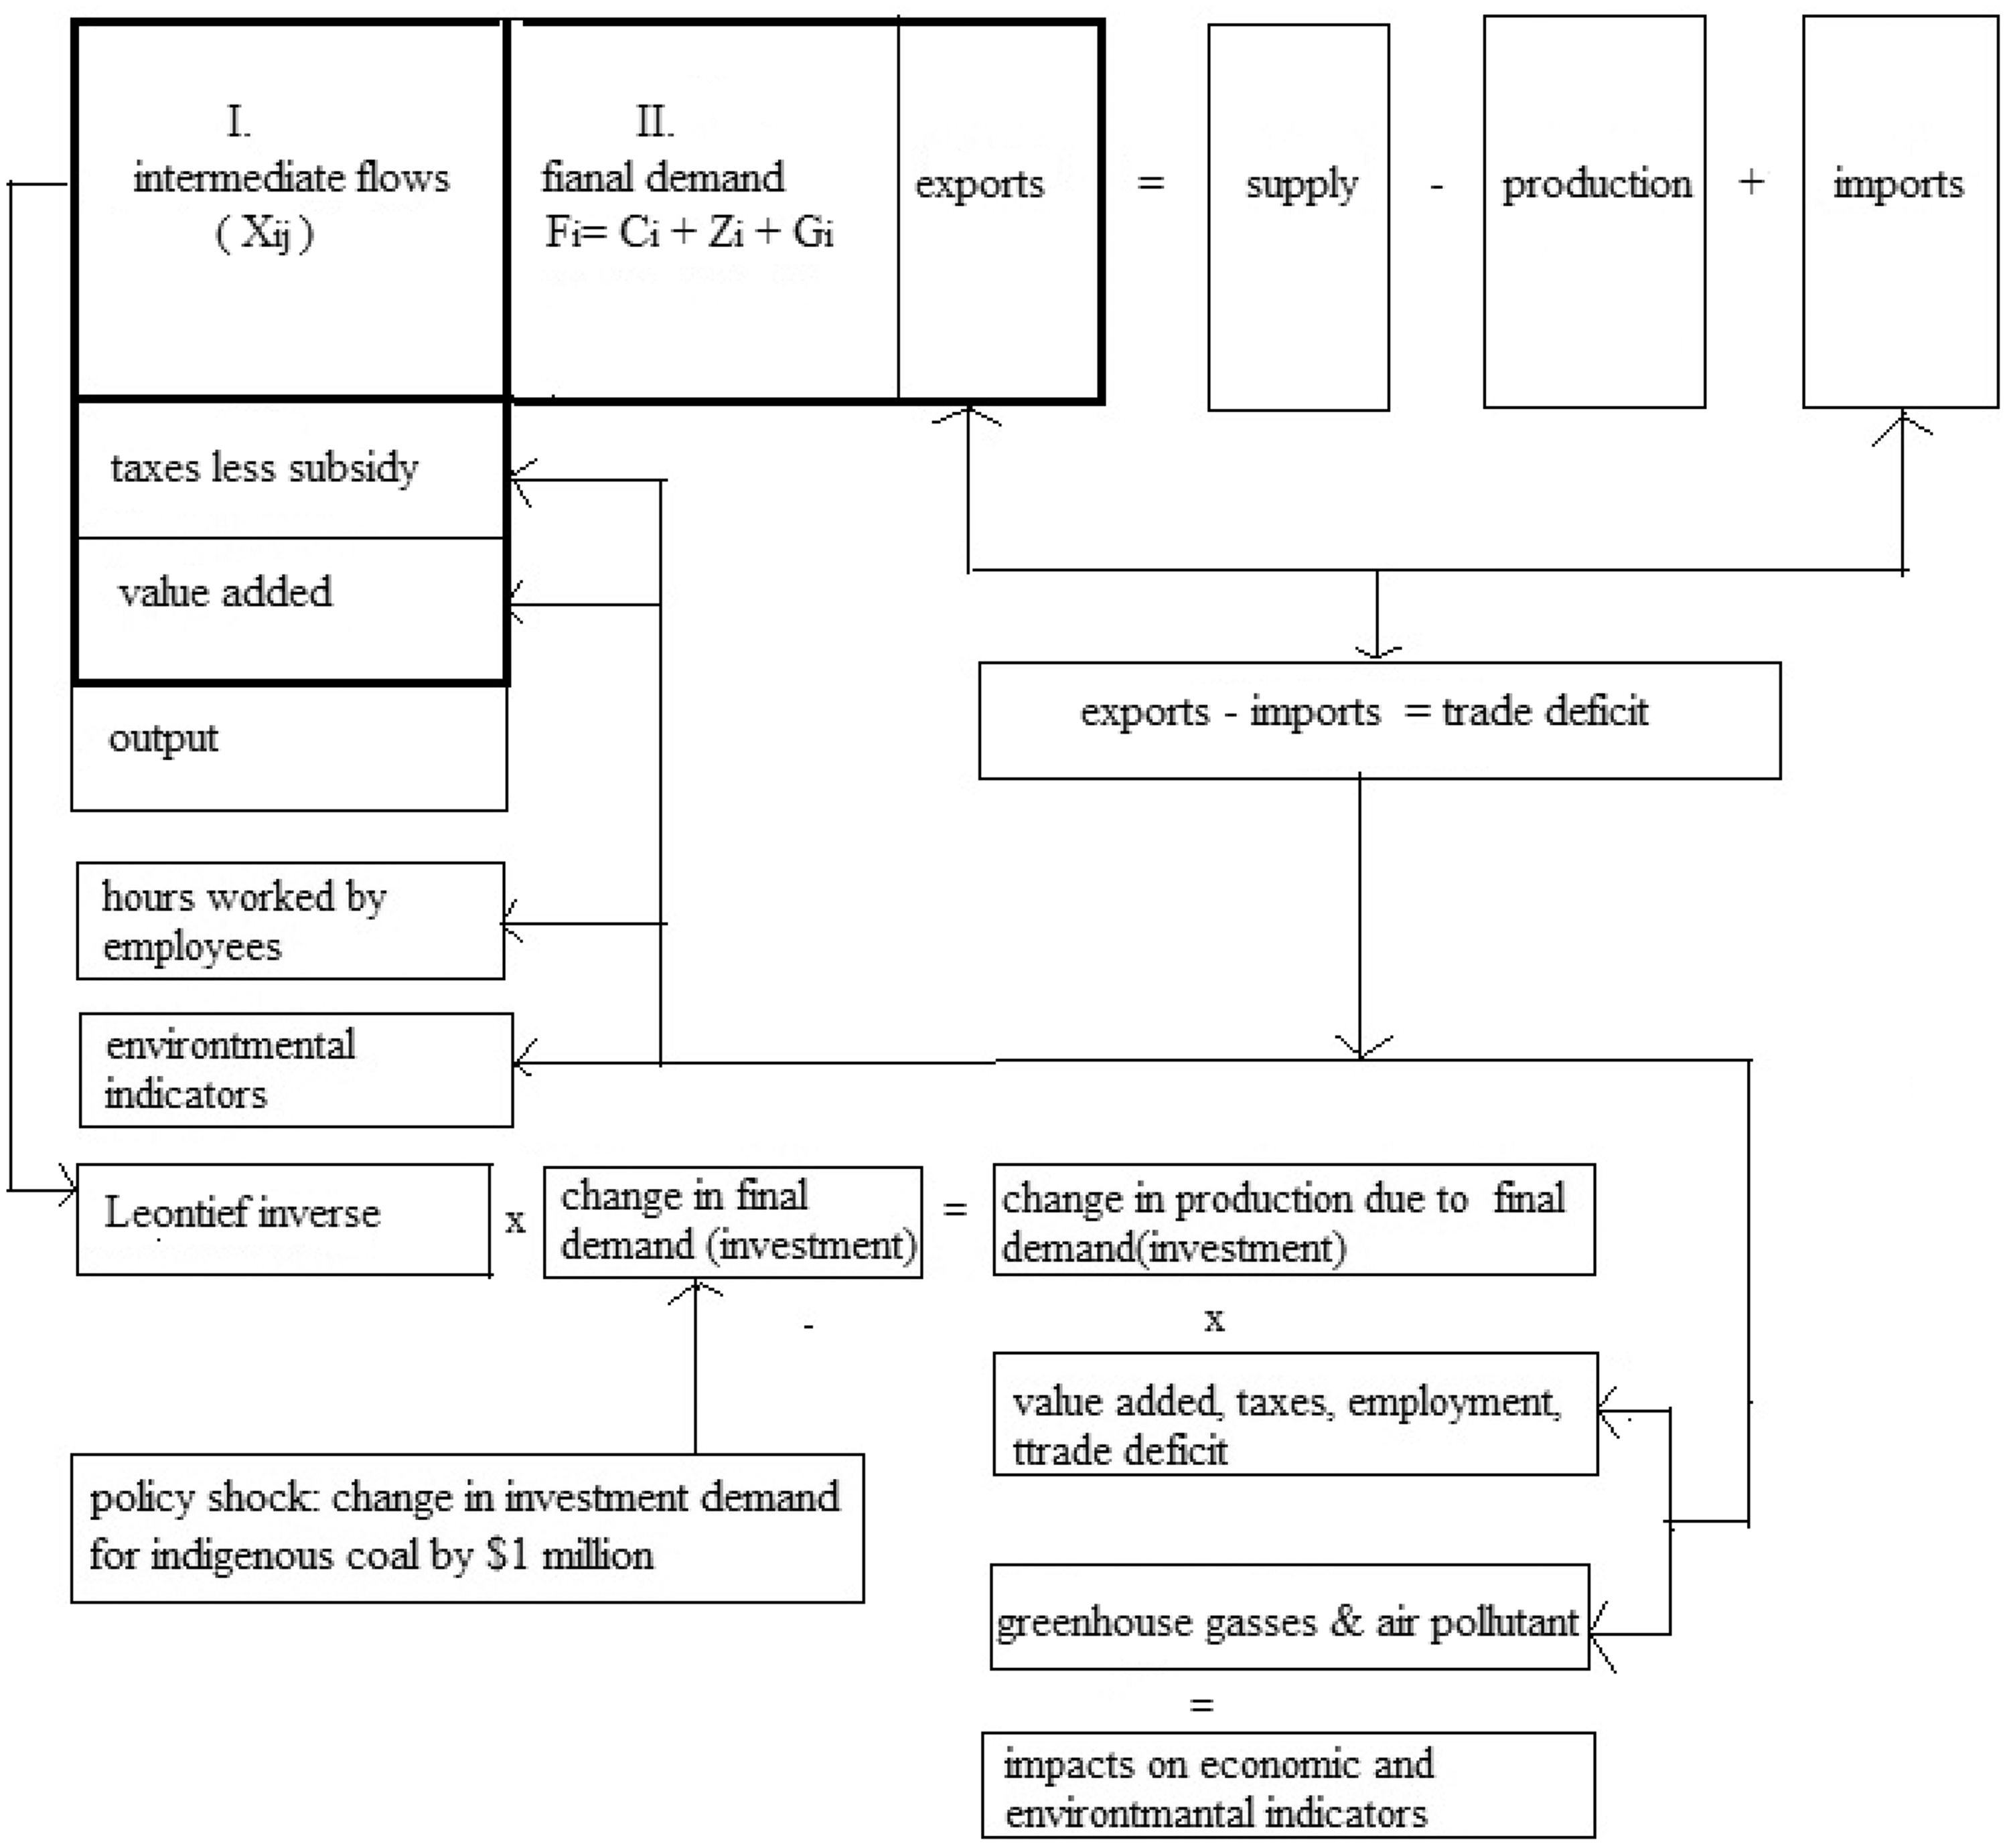
It should be noted that if the total input equals the total output for the production sectors, then the input–output table is balanced. This means that the sum of each column must be equal to the sum of the each row of input–output table. Equation (1) represents the main equation of the input–output method

The comparative static analysis is based on a comparison of the equilibrium output values in the new equilibrium with the old (unchanged) equilibrium output values in the final demand. Before and after situations are only compared and the path of the variable is not considered. Therefore, it is sufficient to take the first difference of equilibrium equation (1)

Economic input–output analysis can be extended by incorporating economic and environmental indicator vector of Bi into equation (2)

Equation (4) is derived by taking first difference of equation (3)

Data and policy scenario
The policy scenario is designed to analyze the economic and environmental effects of increasing indigenous production of coal for power generation on Turkey’s economic sectors. As a policy scenario, the investment demand for indigenous coal production is supposed to increase by $1 million (see Figure 1). As is known, the investment demand is one of the final demands and it is defined as the exogenous variable as in equation (4). When we shock the investment demand for domestic coal production, we can measure the economic and environmental effects of this policy scenario.
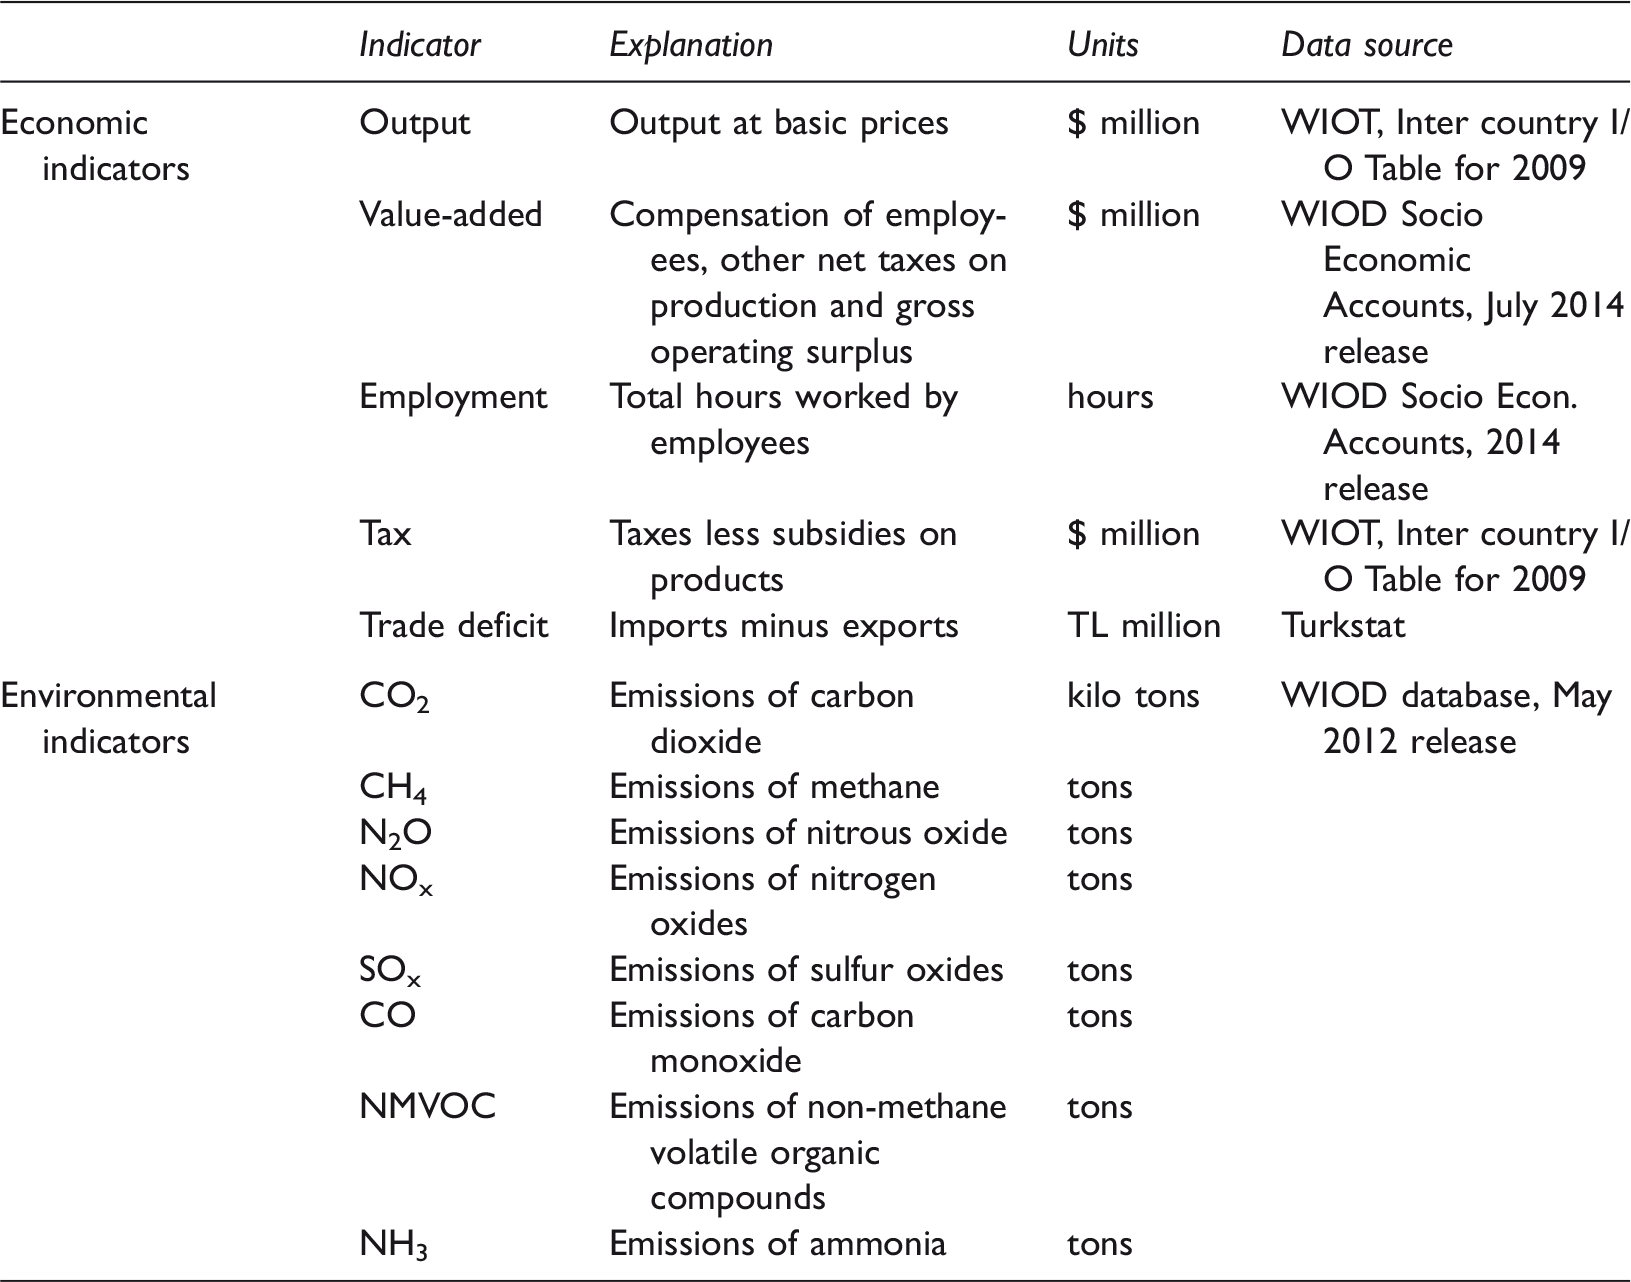
Economic performance is a crucial factor for the possibility of increasing coal production due to the lack of indigenous energy production and thereby trade deficit in Turkish economy. Besides output, four economic indicators are considered for the economic assessment of this policy scenario. These are value-added, taxes less subsidies, trade deficit, and total hours worked by employees.
The environmental impact is evaluated through the potential for global warming due to GHG emissions that are generated from increasing domestic coal share in electricity generation in the context of Turkish energy policy.
Economic and environmental indicators.
At a high aggregated level, this paper involves adding detail to the electricity generation and supply sector of a 35-sector model of the Turkish economy to allow for more detailed economic and environmental analysis of the electricity industry. To do this, in Figure 2, we disaggregate sector entry 17 (“Electricity, Gas and Water Supply”), electricity production, gas and water distribution and supply in the national economic input–output table (35 by 35 sectors) of Turkey into four sectors: electricity generation, electricity transmission and distribution, gas distribution, and water supply. The electricity generation sector is further disaggregated into six sectors as coal-fired, gas-fired, oil-fired, hydro, wind, and other power generations. In addition to disaggregation of the electricity sector, sector entry 2 “Mining and Quarrying” of national economic input–output table (35 by 35 sectors) of Turkey is disaggregated into three sectors as coal mining, coal importing, and oil–gas mining in order to apply policy shock designed as increasing indigenous production of coal. After disaggregation of these sectors (entry 17 and 2 in 35 × 35 sectors of WIOT) we use 45 × 45 sectors of Turkish economy in this analysis.
Disaggregating sector entry 17 (Electricity, Gas and Water Supply) in 35 × 35 IO table of Turkey.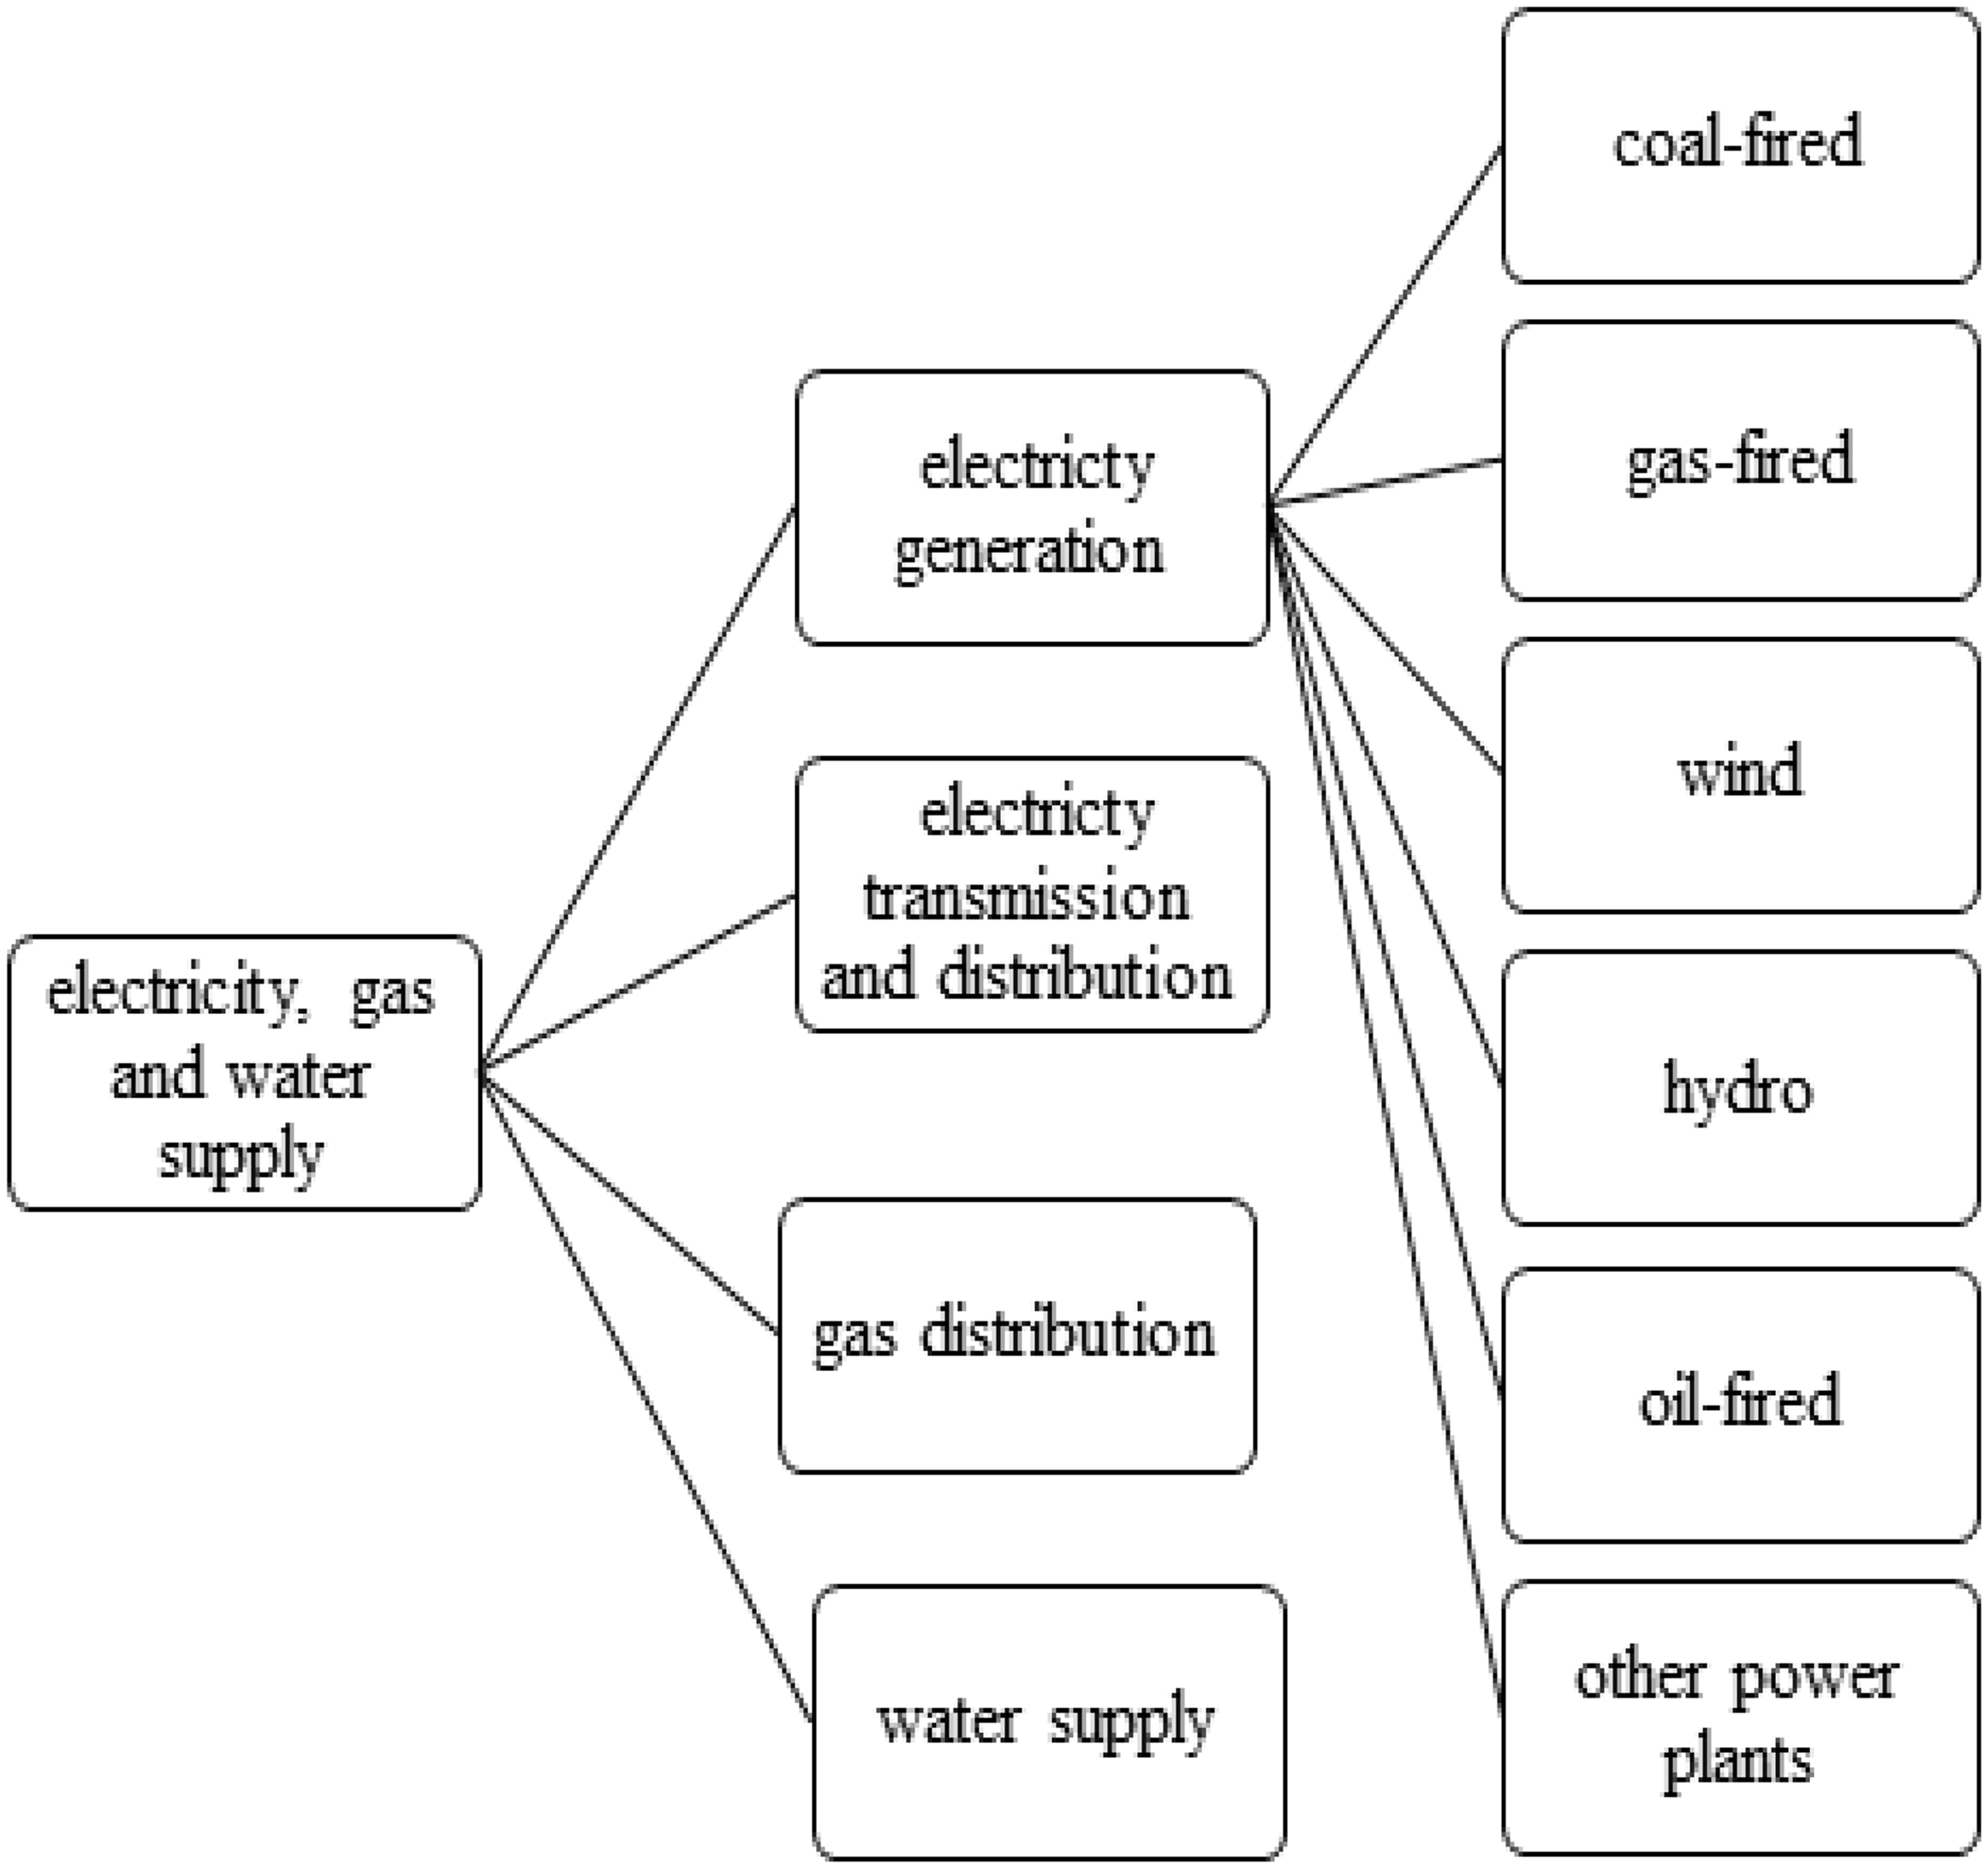
Results and discussion
The results of analysis are presented in the following three subsections based on impacts of more indigenous coal use on economic and environmental indicators. Increasing indigenous production of coal has two interrelated impacts: industry output growth impact and thereby energy impact that induce a change in GHG mainly carbon emission and air pollution level as well.
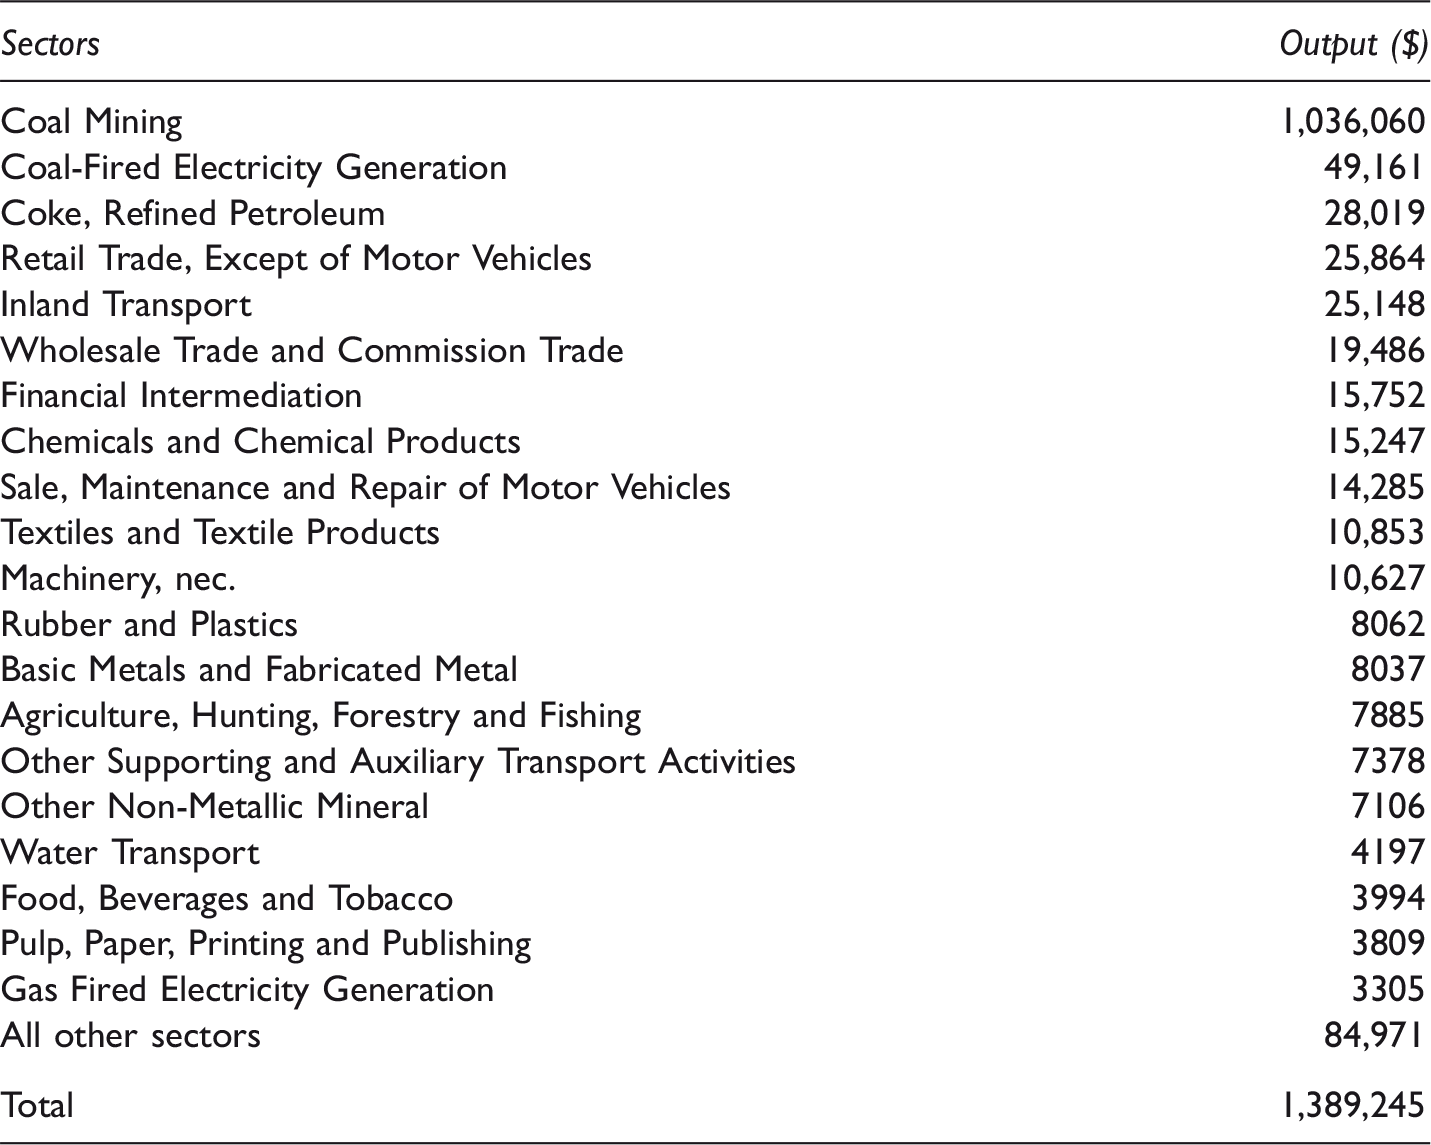
Change in output for $1 million demand for investment of coal.
Economic impacts
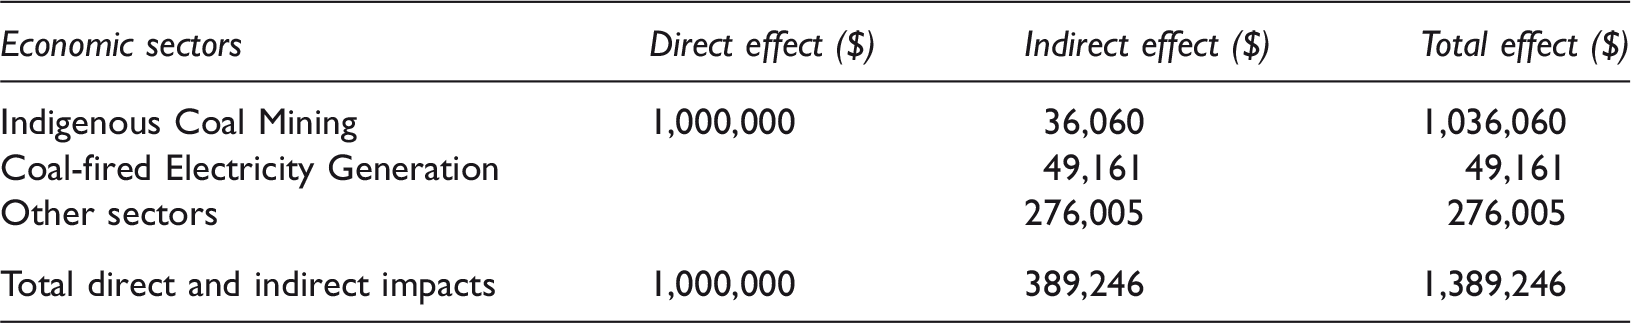
Table 4 indicates the direct and indirect economic contributions of the largest 20 sector (suppliers), within the supply chain of increasing production of coal. According to figures of this table, the $1 million increase in final demand for mining of coal produces the increase in economic output for all sectors of $1,389,241. The largest output occurs in the coal mining sector itself by the amount of $1,036,060. The additional $36,060 of production indicates that coal is used in the production of coal mining itself or by other sectors within supply chain. Note that the change in Gross Domestic Product (GDP) as a result would be only $1 million, since GDP measures only changes in final output, and not all purchases of intermediate goods.
The second largest activity occurs in “Coal-fired Electricity Generation” sector by amount of $49,161 since “Coal Mining” sector is the direct suppliers to this sector. It is also a direct supplier to the “Coke and Refined Petroleum” sector. Following top sectors such as “Retail Trade, Except of Motor Vehicles”, “Inland Transport”, “Wholesale Trade and Commission Trade”, and “Financial Intermediation” sectors are the services sectors of the Turkish economy. These sectors are followed by other manufacturing sectors such as “Chemicals and Chemical Products”, “Textile and Textile Products”, “Machinery, nec.”, “Rubber and Plastics”, and “Basic Metals and Fabricated Metal”.
Change in economic indicators of sectors due to $1 million increase in demand for investment of coal.
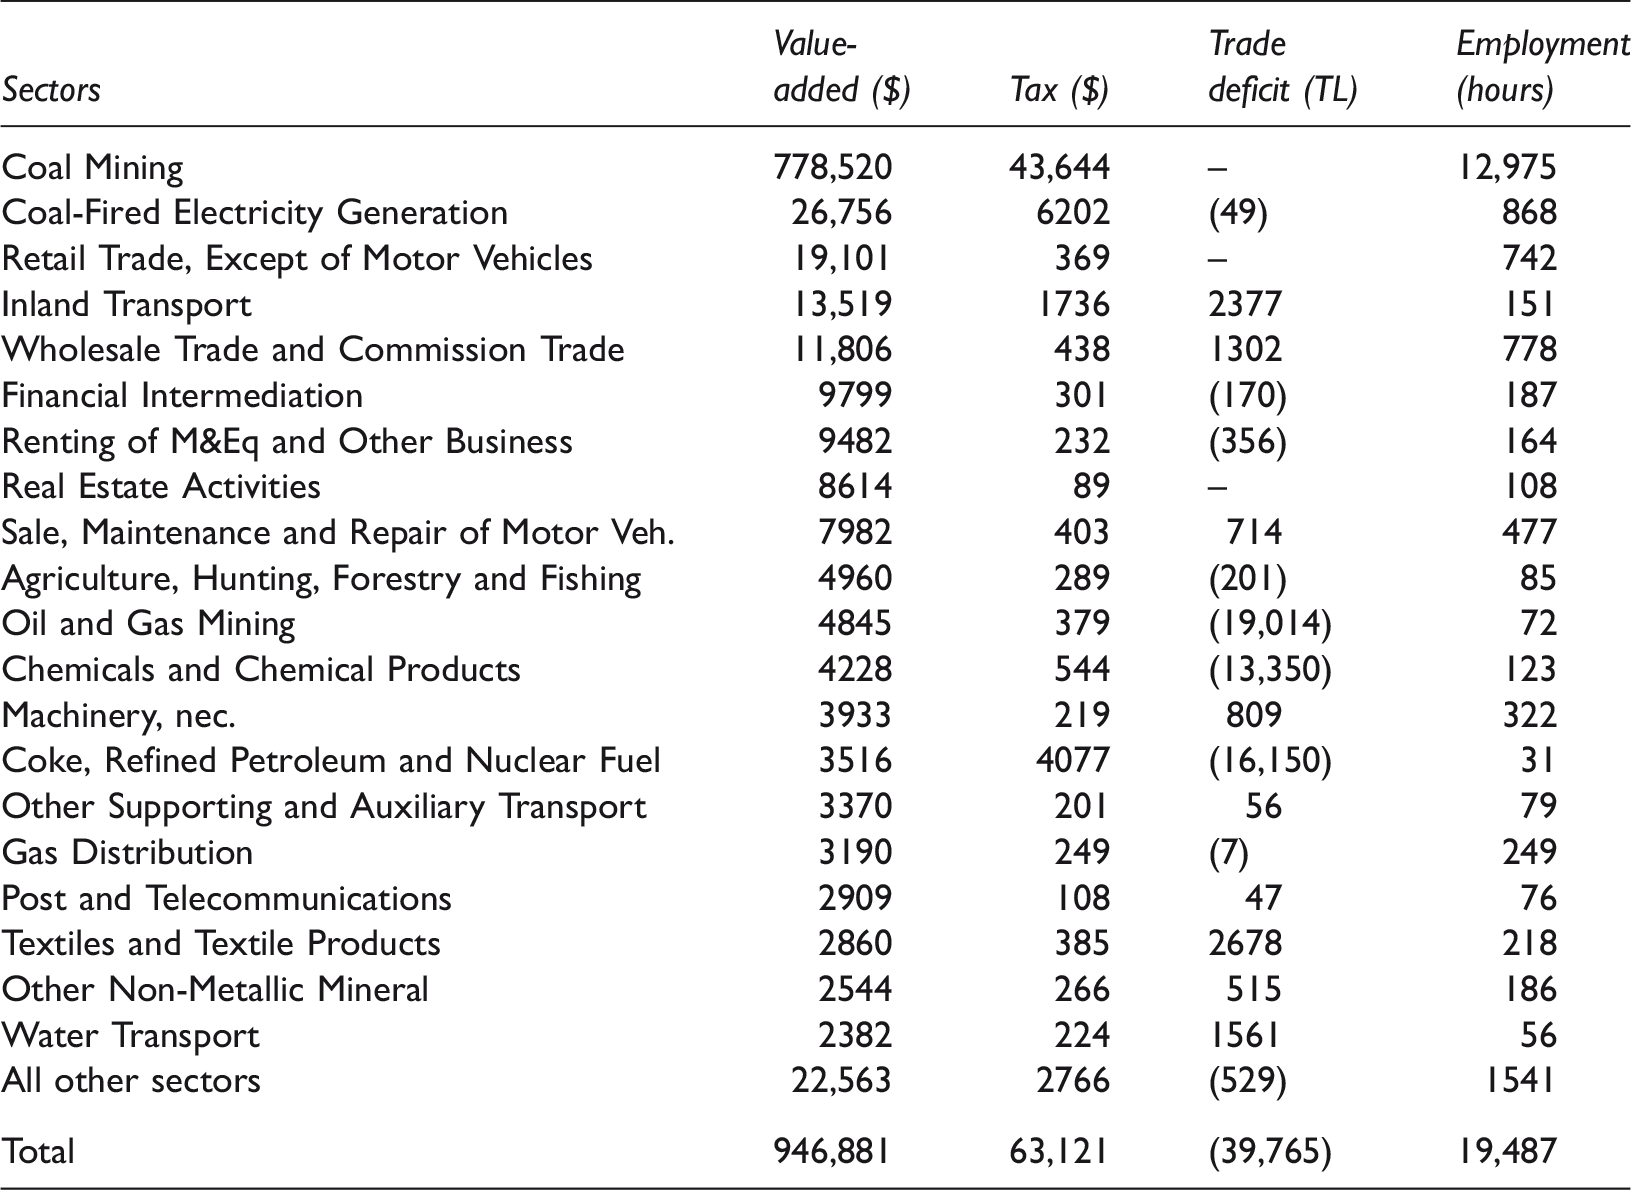
Value-added is the income for both labor and capital and it is considered as a main economic indicator since it contributes to the social welfare of households and represents the compensation of employees and owner of capital including wages and rents (Wiedmann et al., 2009). The value-added generated by each industrial sector is in line with the output of sector. Therefore, relying on analysis findings, the “Coal Mining” and “Coal-Fired Electricity Generation” sectors have the highest value of value-added compared with other manufacture sectors. Among the top suppliers, service sectors including “Retail Trade”, “Wholesale Trade”, “Financial Intermediation”, “Renting of Machinery and Equipment and Other Business”, and “Inland Transport” provide the highest contributions to total income generated by sectors.
Taxes less subsidies on products are taken in this analysis as a positive economic indicator, because taxes are the major sources of the government revenues and these revenue are used for financing of public expenditure including public health, education, transportation, and various infrastructures (Foran et al., 2005). Taxes generated by each sector are given in third column of Table 5. The sectors that have the highest government tax revenues are linked to the “Coal-Fired Electricity Generation”, “Coke, Refined Petroleum”, and “Inland Transport” sectors. A closer look at the tax revenues generated by each sectors, “Coke, Refined Petroleum” and “Inland Transport”, represents the sectors with the highest total tax generation due to the high special consumption tax.
As for employment effects, an increase in final demand for $1 million in the coal mining sector creates 12,975 hours worked by employees. In total, this change in demand generates 19,487 hours worked by employees. The economic sector that indirectly benefits the most as a result of such an increase in demand are the “Coal-Fired Electricity Generation” with an indirect impact of 868 hours followed by the “Wholesale Trade and Commission Trade” sector with 778 hours and “Retail Trade, Except of Motor Vehicles” sector with 742 hours for indirect jobs. The complete distribution of hours worked by employees is presented in Table 5.
The trade deficit analysis results show that “Oil and Gas mining”, “Coke, Refined Petroleum”, and “Chemical and Chemical Products” have the largest trade deficit rather than other manufacturing sectors due to the higher import multiplier in comparison with these sectors. “Oil and Gas Mining” sector is responsible for nearly half of total trade deficit. Although the increase in demand for investment in coal mining gives rise to an increase in output and employment of energy intensive manufacturing sectors, it can be argued that the changing structure of the economic growth mainly relies on imports of energy resources. Reliance on imports of energy resources leads to an increased trade deficit that adversely affects the sustainability of economic development. In response, policy makers have decided to use domestic coal resources instead.
“Textiles and Textile Products” sector has the largest trade deficit improvement and this sector is followed by “Inland Transport”, “Water Transport”, and “Wholesale Trade and Commission Trade”, respectively. These sectors also contribute the most to the economic growth rate of Turkish economy (Aşıcı, 2015).
Environmental impacts
This section seeks to explore whether the possible increase in production of coal will have any significant effect on GHG and air emission growth rate in Turkey’s economic sectors. It is well known that carbon emission and air pollution are closely related to coal consumption. Even though these emissions are associated with all emitting activities, including current production, capital formation, and household and government consumption, this paper only takes industry production into account in the context of policy scenario.
Coal mining and coal fueling of power station and industrial processes can cause major environmental damage. Coal plants are the Turkeys’ top source of carbon dioxide (CO2) emissions, the primary cause of global warming. CO2 emissions are at unacceptable levels especially for the Coal-Fired Electricity Generation sector. This type of electricity generation emits 1000 g CO2 per kWh, while Gas Fired Electricity emits about 500–600 g.
Coal is responsible for numerous environmental hazards throughout the entire fuel cycle, from global warming, to burning, to mining, and to disposal of waste products. Burning the coal creates some of the most harmful effects. In addition to contributing to global warming with significant CO2 emissions, coal plants also emit the following pollutants: sulfur dioxide which produces acid rain and nitrogen oxides which is a key contributor to ozone and respiratory illnesses. 5
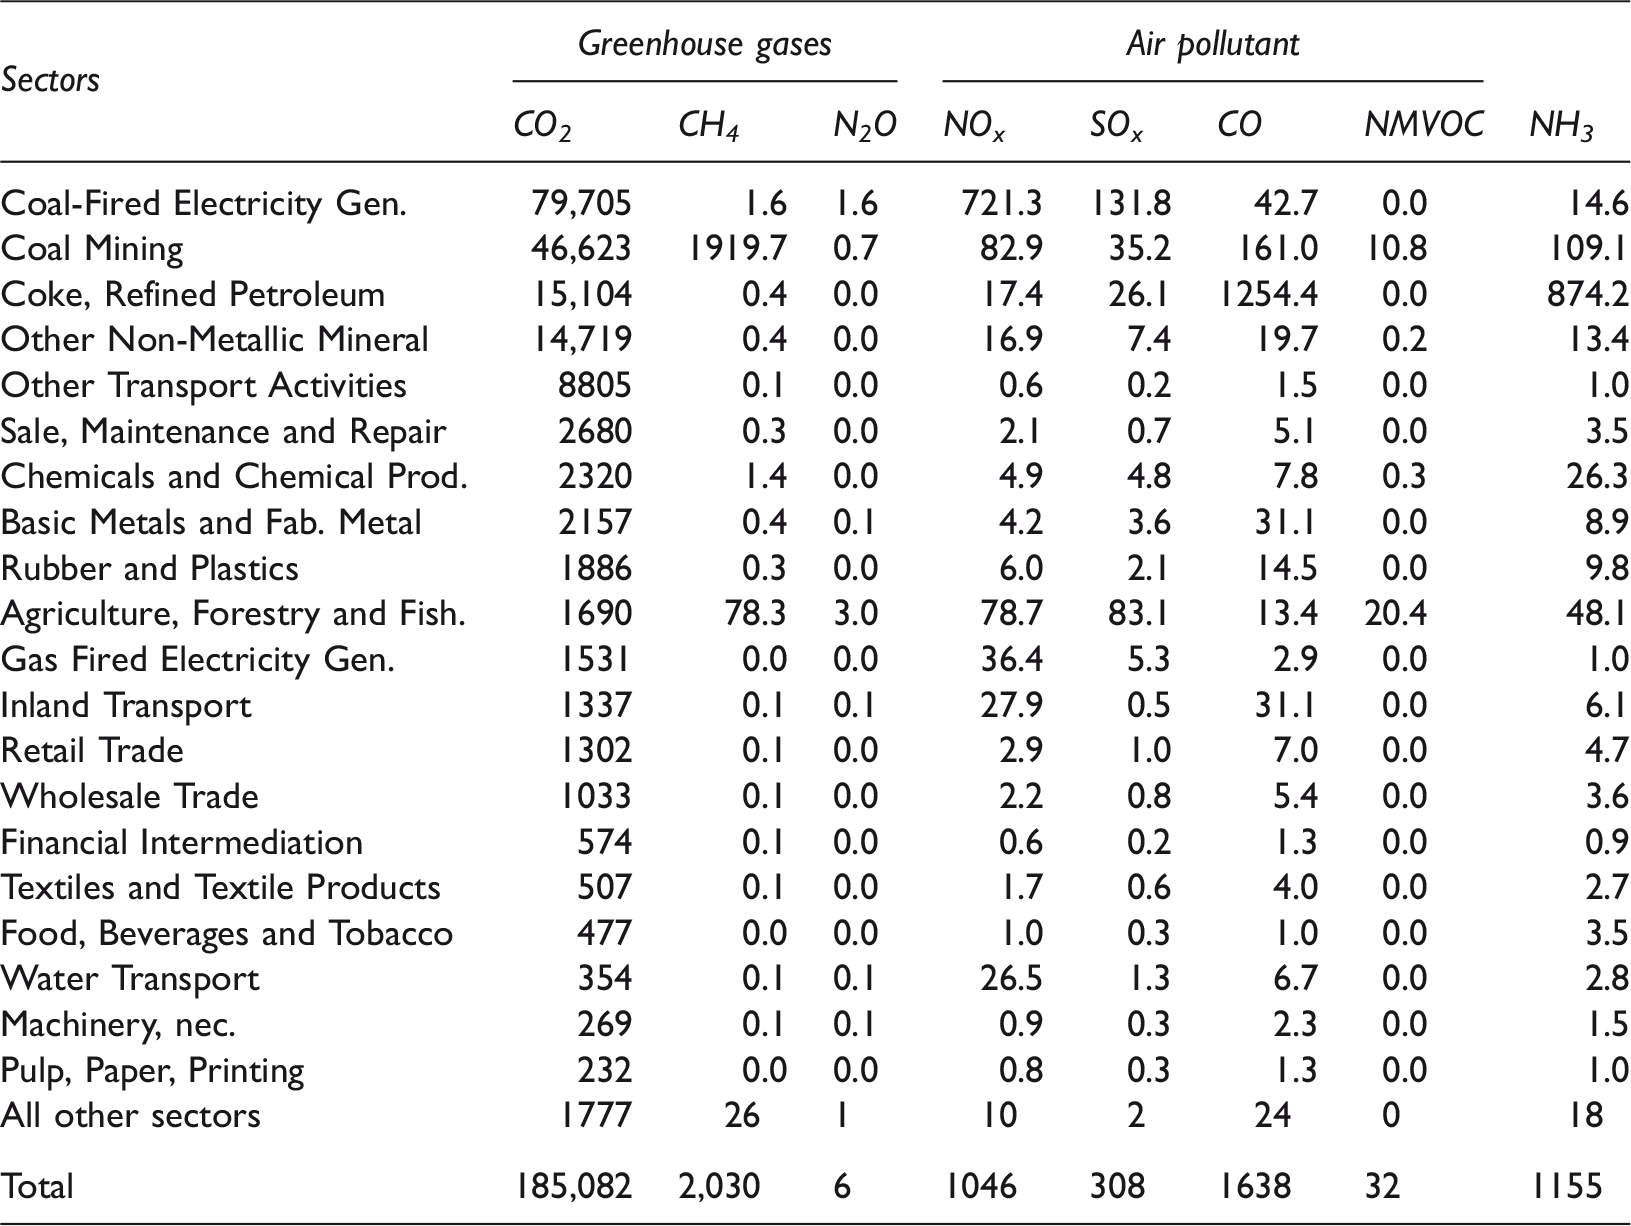
As a general indicator of environmental impact, GHGs (CO2, methane, and nitrous oxide) and air emissions (nitrogen oxides, sulfur oxide, carbon monoxide, and non-methane volatile organic compounds) supply chain pollutants for this analysis are given in Table 6 sorted by CO2 emission as descending. The results of policy scenario indicate that the $1 million increase in demand for investment in coal mining sector give rise to release CO2 by amount of 185,082 kg in total. As expected, the largest CO2 emission with 49,161 kg occur in Coal-Fired Electricity Generation sector. The Coal-Fired Electricity Generation sector is followed by the other major energy intensive manufacturing industry sectors such as “Coal Mining”, “Coke and Refined Petroleum”, “Other Non-Metallic Mineral”, and “Other Transport Activities”.
It is estimated that a total of 2,030 kg methane emission and it is said that coal mining is methane-intensive sector of supply chain. The main nitrous oxide emitters are industries such as “Agriculture, Forestry and Fishing “ and “Coal-Fired Electricity Generation” and all sectors emit 6 kg nitrous oxide.
The sectors “Coal-Fired Electricity Generation” and “Agriculture, Hunting, Forestry” are on the top of the list of nitrogen oxide and sulfur oxide emissions. The total of nitrogen oxides and sulfur oxides are 1,046 kg and 308 kg, respectively. As for carbon monoxide emission, “Coke and Refined Petroleum” sector has the largest amount of carbon monoxide emissions among the sectors and the amount of emission of carbon monoxide emissions from all sectors is 1,638 kg. “Coal Mining” and “Agriculture, Forestry and Fishing” sectors only have non-methane volatile organic compounds emissions. “Coke and Refined Petroleum”, “Coal Mining”, and “Agriculture, Forestry and Fishing” sectors are found to have the largest contributions to total ammonia emissions.
In line with the rules set by the Intergovernmental Panel on Climate Change, GHG emissions are expressed in terms of CO2-equivalents (CO2-e), which are calculated as a weighted sum of various gas emissions by using gas-specific global warming potentials of 1 (CO2), 21 (CH4), 310 (N2O).
6
Hence, according to the result of analysis, total CO2-equivalents (kg CO2-e) is calculated as;

Discussion
In this section, we can discuss the results of analysis to evaluate coal-related activities as an industry. These are Coal Mining and Coal-Fired Electricity Generation sectors. We can conduct comparative analyses in which we give the same amount of exogenous shock (increase in final demand for investment). We use the positive shock amount of $1 million given to the indigenous coal mining sector to evaluate the response of Turkey’s economic sectors.
Change in the amount of environmental indicators of sectors due to $1 million increase in demand for investment in coal mining.
Direct and indirect impact of $1 million investment in coal mining sector.
We can discuss a number of economic and environmental indicators of coal-related sectors by using graphical method. Spider diagram approach is used in this analysis as graphical method. The “spider” diagram (Figures 3 and 4) is a diagram where all indicators are presented on a log scale.
Spider diagram for coal mining sector. Spider diagram for coal-fired electricity generation sector.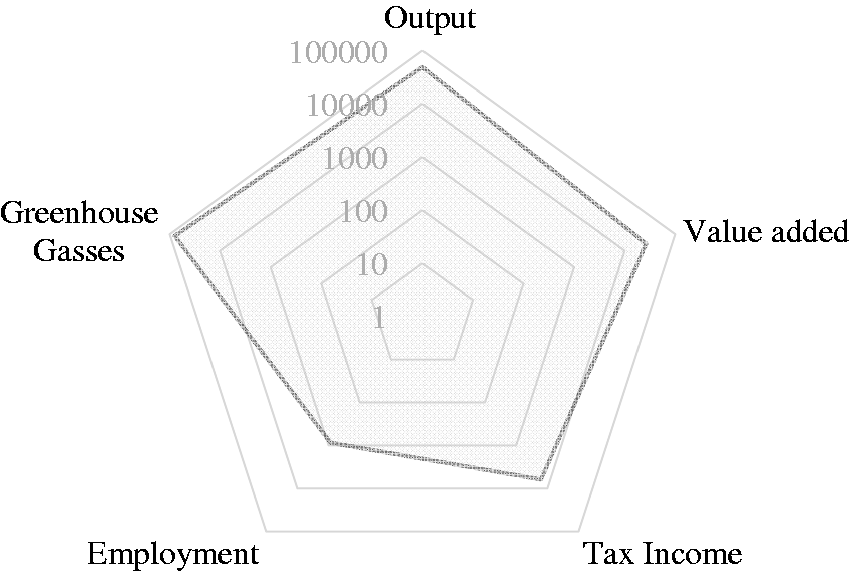
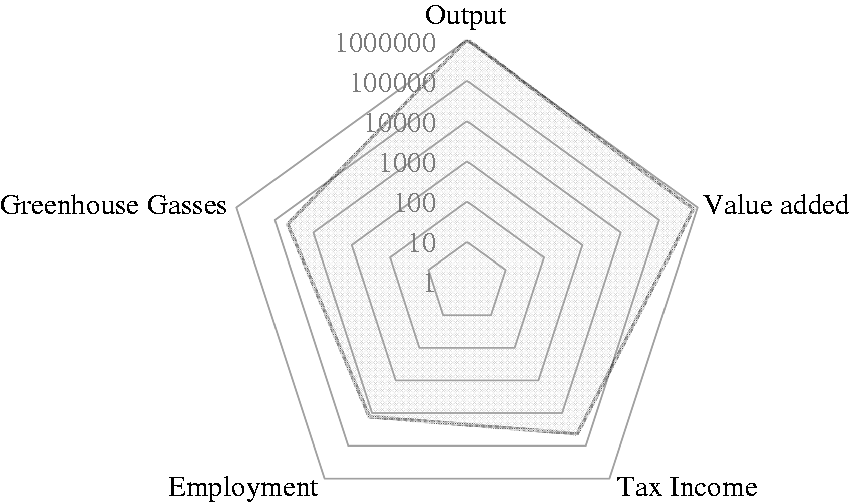
The Coal Mining and Coal-Fired Electricity Generation sectors portray a number of expected issues such as high output and value-added associated high CO2 emissions as shown in Figures 3 and 4. It also shows bad outcomes for the environmental indicators of GHGs but good outcomes for the economic indicators of employment generation and tax income.
Conclusion and policy recommendation
It is certain that extending the traditional input–output analysis by combining economic and environmental indicators in physical and monetary units has provided a consistent tool for analyzing energy, economy, and environment interactions at sectoral levels. The analysis has proved to be adequate for the evaluation of greater coal use on economic and environmental indicators in prospective policy scenario. The findings indicate that the $1 million increase in final demand for investment for indigenous coal produces an increase in economic output for all sectors of $1,389,241 and the increase in total GHGs 229,572 of CO2-equivalents (kg CO2-e), 1354 kg of nitrogen and sulfur oxide, and 1608 kg of carbon monoxide as well.
The results of this research show the complexity of making decisions in the electricity generation sector, where there are multiple sustainability criteria for each and different preferences. Comparing the electricity generation technologies, domestic coal (lignite) power is the highest economic sustainability for three (value-added, employment, tax income) of the four economic impacts but it is the least environmentally sustainability for four (CO2, N2O, NOx and SOx) of the eight environmental indicators. The results also show that in such cases often the “best” solution is not available and that trade-off is necessary to determine the “most sustainable” option.
Based on the results from this study, the following policy recommendations can be made to improve the sustainability of the electricity sector in Turkey. Turkey has an important potential for a variety of renewable energy sources such as solar, wind, geothermal, bioenergy, and hydropower. The use of renewable electricity sources as an alternative to fossil fuels is of great importance for Turkey to increase both supply security and reduce the environmental impact of the electricity sector. For this reason, the government should diversify its energy mix to include mainly solar-powered, offshore wind, as well as encouraging increased share of renewable energy in the mix of electricity production.
Although the results of this study demonstrate that lignite is the least sustainable option in the sustainability of electricity generation, the current government policy of the Turkish Government is to increase the production of electricity from lignite to increase electricity supply. The only exception is that if the main energy driver is energy security, the sustainability performance of existing lignite plants should be improved.
Footnotes
Declaration of conflicting interests
The author(s) declared no potential conflicts of interest with respect to the research, authorship, and/or publication of this article.
Funding
The author(s) received no financial support for the research, authorship, and/or publication of this article.