
Abstract
Carbon footprint is defined as the amount of greenhouse gases generated during the whole lifetime or within a specific boundary of a product. This study measured the average carbon footprint of some common cotton knitwear T-shirts, polo shirts, and fleece jackets during production using CCalC2 software. Energy and water consumption data were taken as the study's input, while direct and indirect emissions were not specified. The results show the amount of carbon dioxide emitted at different stages of knitwear production. Cotton processing and yarn spinning resulted in relatively high carbon dioxide emissions, while wet treatment gave similar results. Fleece jacket production gave high amounts of emitted carbon dioxide due to its complex fabric structure and high fabric weight, while T-shirts gave the lowest amount of the fabrics tested.
Introduction
Knitting is a fabric manufacturing technique where the fabric is made by the intermeshing of loops. 1 Knit fabrics are of two types, warp knit and weft knit.1,2 But according to the Textile Institute, knitwear is the term that is applied to weft knit garments. 3 Weft knit fabrics are used for making T-shirts, polo shirts, jackets, sweaters, cardigans, underwear, and so forth, that are known as knitwear. These products have become one of the leading components of modern fashion trends. The demand for knitwear has risen significantly worldwide.
Bangladesh is a leading knitwear exporter in recent years. Bangladesh earned 15.19 billion US$ in FY 2018-19 by exporting knitwear. 4 Like other textile products, knitwear production also has high global warming potential. By definition, global warming results from greenhouse gas emissions caused by human activities.5-7 Determining the carbon footprint is a good option for evaluating greenhouse gas emissions. 8 The carbon footprint is the measure of greenhouse gas emissions during the lifetime of, or within a specific boundary of, a product or service.6,8-10 Carbon footprint assessment can help to determine the impact of a product on the environment.8,11
Greenhouse gases include carbon dioxide (CO2), methane (CH4), and chlorofluorocarbons (CFCs). Generally, the emission of CO2 has the most severe effect because of the huge quantity produced. Almost all activities related to different types of machinery release CO2. So, along with other processes, the textile product production process also, directly and indirectly, produces a lot of CO2. CO2 production starts from fiber cultivation (natural fibers) or fiber production (synthetic fibers) and continues until the end of the final product's lifespan. The calculated carbon footprint can be quite interesting, as results suggest that being produced naturally doesn't always mean that natural fibers’ carbon footprint would be less than the synthetic fibers’ carbon footprint. This depends on many factors, including cultivation, processing technique, the end product's longevity, caring techniques, and so forth. When the fiber is used in the production of yarn, fabric, or garments, then the emission of greenhouse gases by all machinery types is included in the calculation. The production of the power required to run the machines is also a source of CO2 emissions. Also, to calculate the carbon footprint, it is essential to fix a system boundary within which the calculation can be done. Generally, textile products have four different life cycle stages: production, transportation and distribution, use, and disposal. 12
It is essential to select whether all stages would be taken into account when calculating the carbon footprint. If not, then the stages which would be included in the calculation have to be specified.
The carbon footprint of cotton textiles has been researched for the last decade or so. Researchers have used various techniques to evaluate the CO2 emission of cotton outerwear. Baydar et al. assessed the life cycle of cotton textile products in Turkey. 13 They compared the carbon footprint of eco T-shirt (dyed by using a green dyeing process) and conventional T-shirt manufacturing, as well as the rest of the life cycle. They included fiber cultivation, fabric and garment manufacturing, storing, and use of the final products in their calculation. They found that fiber cultivation, yarn production, wet treatment, and use of the final product caused the greatest amounts of CO2 emissions. Wang et al. studied the carbon footprint of a pure cotton shirt in China. 8 They did not specify the different production stages involved in the industry; instead, they determined the total CO2 emissions during cotton cultivation and from the process of making the shirt from cotton fiber, transportation, and the use phase of the final product. They found that cotton cultivation and garment production caused the greatest amount of CO2 emissions, with the industrial processes having the greatest effect. Moazzem et al. studied and compared the environmental impact of cotton and polyester knit shirts, and woolen knit sweaters.12,14 They showed that fiber cultivation or production, wet treatment of the fabric, and use on the consumers’ end had the greatest impact. Among three different fibers, wool processing caused the greatest amount of greenhouse gas emissions, while cotton had the least impact. The polyester spinning process resulted in the least impact, and wool spinning had the greatest. Li et al. studied the carbon footprint of a cotton T-shirt and polo shirt. 15 They did their study on only garment manufacturing processes. They found that the polo shirt caused greater CO2 emissions than T-shirt production. Among the different garment industry operations, sewing gave the greatest CO2 emissions, while the ironing process followed close behind. There have been other studies as well, but few have been done on pure cotton knit products.
The present study focuses on CO2 emissions at various production stages of some common knitwear T-shirts, polo shirts, and fleece jackets made in Bangladesh. Only the results of production stages from fiber cultivation to final product packaging are shown. The results for use of the final product and disposal stages were not included in this study.
Materials and Methods
This study has taken a bottom-up assessment system approach. In this system, assessment was done from start to finish, and the carbon footprint was assessed for each process in between. This was done to better assess the results of the various stages of the production process. This process also compared the results of various stages to determine the impact of various processes on carbon footprint assessment. 8
Goal and Scope
This study provides information on the environmental impact of the previously described common knitwear production in Bangladesh. This was done by calculating the carbon footprint of various knit fabric production stages and then knitwear production from knit fabric. The process started with fiber cultivation. This study is mainly based on energy consumption during the production stages. Water consumption was also accounted for to some extent. The carbon footprint up to the point where the knitwear was dispatched to distributors was calculated during various production stages, and the sum of the results is shown in this study. This study helps to identify the stages that emit the greatest amount of CO2 so that remedial measures can be taken to further reduce the carbon footprint in the future.
System Boundary of the Study
This study's system boundary starts from fiber cultivation to fabric production, knitwear production, and finishing before being dispatched to the retailer. This study's functional unit was a T-shirt of 150 g total mass, a polo shirt of 250 g, and a fleece jacket of 400 g, all of which were medium size. The amount of CO2 emission (kg) was calculated for a single T-shirt, polo shirt, and fleece jacket production. The system boundary is shown in Fig. 1.
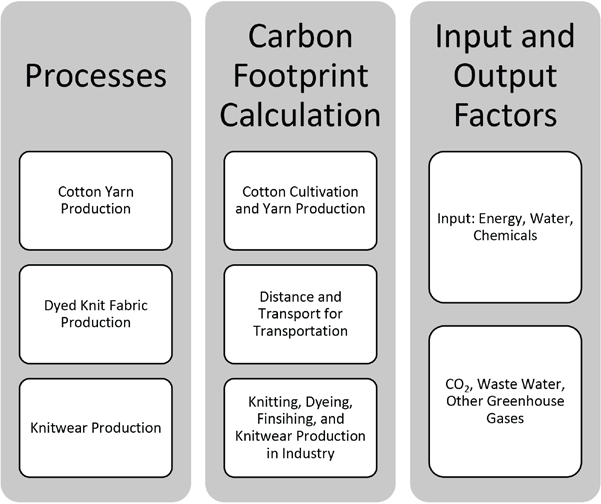
System boundary for carbon footprint calculation.
This study was mainly focused on energy consumption for fabric and knitwear production. Transportation of yarn to the fabric industry includes only transportation via trucks for a specific distance from the spinning plant to the fabric plant. Fabric production includes knitting, pretreatment, and dyeing and finishing treatment of the produced fabrics. Knitwear production includes basic operations such as cutting, sewing, inspection, and packaging operations. Table I shows processes within and out of the system boundary.
System Boundary of This Study
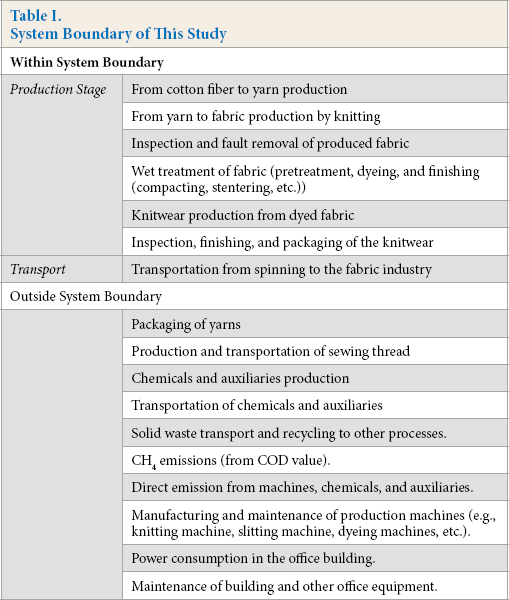
The main output of this study is CO2 and wastewater. Wastewater comes from several wet processes during fabric production, including pretreatment, dyeing, and fabric finishing treatments.
Knitwear Manufacturing Overview
The process flow diagram for knitwear production is shown in Fig. 2. This whole process involves fiber cultivation and yarn production from cotton fiber, while fabric industries start their operations from the creeling of packages for knitting. After knitting, the fabrics are taken for inspection and storage or direct delivery to the dyeing and finishing section after inspection. After pretreatment, dyeing takes place. Apart from singeing, all dyeing and washing take place in the same dyeing machine. Pretreatments involve singeing, scouring, and bleaching. Singeing is done to remove protruding fibers from the fabric surface. 16 It is generally done by burning those fibers. Scouring is done to remove waxy material from the fiber, and bleaching destroys the fiber's unwanted coloring material to get completely colorless or white fabric. 16 The fabrics then are finished with the compactor and stenter, brushing machine, sueding machine, and so forth. These machines help to give the fabrics the desired dimension and gsm (grams per square meter). Stentering is essential for fabrics that require thermal or other special treatment. Brushing and sueding are essential for the fleece jacket. The sueding process increases fabric surface smoothness by cutting all the fibers on the fabric surface to a fixed length, while the brushing process cuts and brushes the loops of fleece fabric. These two processes are irrelevant to T-shirt production. So, the processes vary with fabric type, fabric structure, and knitwear type.1,2,17,18
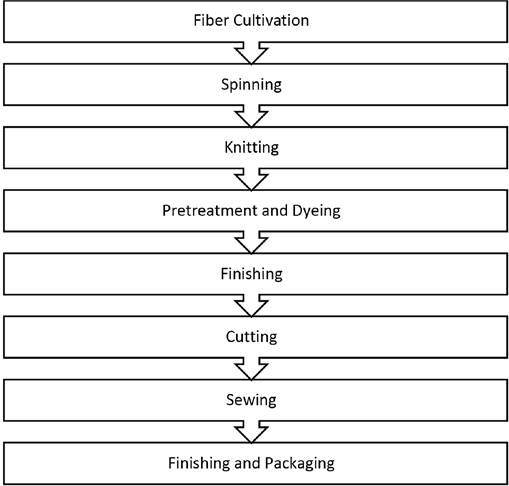
Process flow diagram of cotton T-shirt manufacturing.
Methodology and Impact Assessment
In this study, the carbon footprint calculation of various knitwear production scenarios was done using CCalC2 software (University of Manchester). Moazzem et al. used this software successfully in their research. 12 The ISO/TS 14607-2013 method of carbon footprint (CFP) calculation has been followed, but this process involves garment use, which has not been calculated in this study.
The whole calculation has been done based on the collected data from several knitting industries of Bangladesh. The data collection was based mainly on energy consumption during various phases of the production system. The database provided by the software was used without any modification when data was not collected from industry, mainly due to a lack of reliable data that could be used for Bangladeshi garment industries and other sectors. But since Bangladesh uses foreign machinery (mainly European) for almost every important operation, data for different types of machinery in terms of CO2 emissions during operation were calculated based on the standards for European machinery (data from database). Data processing was done using the CCalC2 software with its default database, and with the Ecoinvent database provided with the software. The Ecoinvent database is a compliant data source for the LCI (life cycle inventory) analysis on the market.
The T-shirt, polo shirt, and fleece jacket knitwear studied were all single jersey fabrics (made by using a single set of needles,1,17 but the fabric structures were different from each other. The T-shirt was made of fabric that contained only knit stitches, the polo shirt contained tuck and knit stitches, while the fleece contained knit, tuck, and miss stitches. 17 Different stitches were also responsible for increasing the fabric weight, as tuck and miss stitches make fabrics heavier. 19 Using different types of stitches affects the fabric production rate, for which the carbon footprint values will be affected as well.
Energy consumption was calculated from the data collected from industries where the main source of energy was electricity. The required amount of electricity for producing the specific amount of material in a stage was calculated, and the amount of CO2 emissions produced by use of that electricity was calculated using the CCalC2 software.
Garment industries use two sources of electricity: the national grid and small natural gas plants situated inside the industries. The primary source of electricity for the national grid in Bangladesh is natural gas. 20 For calculating the amount of CO2 emissions produced by the power station, the Ecoinvent database was used. Most electricity in Bangladesh is produced using a combination of gas and steam turbines, 20 for which the CO2 emission was calculated. For calculating the amount of CO2 emissions from small plants situated inside the industries run using natural gas, the Ecoinvent database was used. Natural gas is also used for running the boiler in industries and the amount of CO2 emission from the boiler was also calculated using the Eco-invent database.
CO2 emissions from harvesting cotton to yarn production was calculated using the textile part of the Ecoinvent global database, so no data was collected for this part of the process. CO2 emission for transporting the yarn from the yarn manufacturing plant to the knit composite plant (where fabrics are knitted from yarns; the fabrics are then dyed, finished, and after that, knitwear are produced from those fabrics in the same plant or within the same boundary) by truck was calculated using the CCalC2 database. Water consumption data was also used along with energy consumption. No data for calculating CO2 emissions during storage and daily use in the lifetime of the garment were used in this research. CO2 emissions during wastewater treatment and dumping of the waste was calculated using the CCalC2 database.
Results
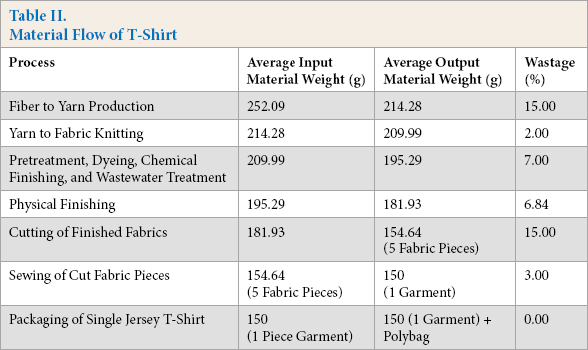
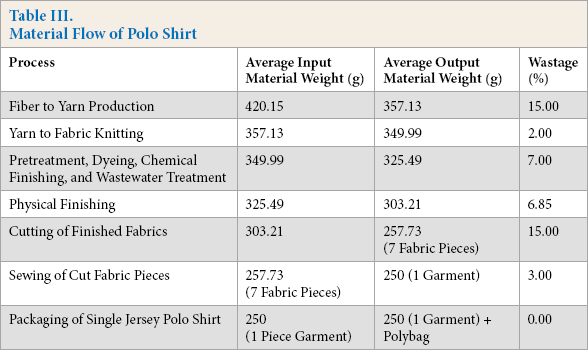
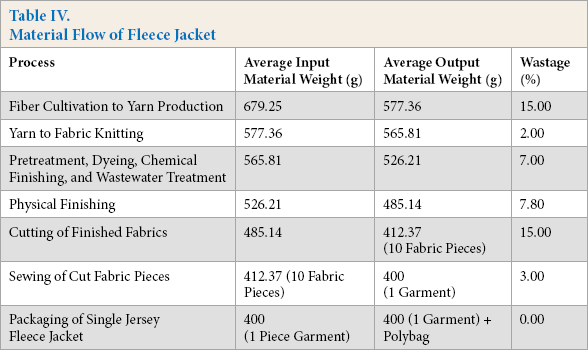
For making a garment from fiber, it is required to go through several processes in which quite a lot of material gets wasted. So, if a garment of 200 g is to be made, the initial amount of fiber would need to be a lot greater than 200 g. For this study, the average possible waste was considered for each type of knitwear selected for this study. Since knitted fabrics are generally measured in weight rather than length, the garments considered were based on the final product weight for a T-shirt of 150 g, a polo shirt of 250 g, and a fleece jacket of 400 g. Tables II–IV show the material flow from fiber cultivation to garment production (using empirical data collected from garment industries in Bangladesh) based on weight by considering the average possible waste for each type.
Material Flow of T-Shirt
Material Flow of Polo Shirt
Material Flow of Fleece Jacket
The data given above were used in the software CCaLC2 as functional units for calculating the carbon footprint or, more specifically, emission of CO2 for each functional unit of various knitwear. These values were put against the required energy input to calculate the carbon footprint. At the same time, the energy required for wastewater treatment in the wet treatment stage was also calculated. Fig. 3 shows the carbon footprint of the above-mentioned knitwear at different stages of production.
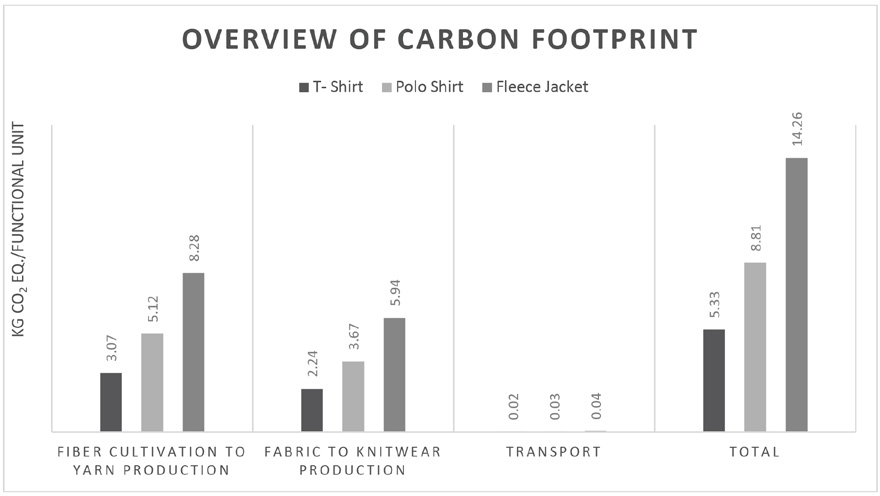
Comparison of carbon footprint of various knitwear.
The results show that CO2 emissions increased gradually from T-shirt to polo shirt to fleece jacket due to the gradual increment of garment weight. The same trend is found in all stages. The first stage consists of fiber cultivation and yarn production from the fiber. Cotton fiber is not very environmentally friendly. 19 Cotton production is not high if grown without additional agricultural chemicals. 13 Emission of CO2 and other greenhouse gases during cotton cultivation includes both direct (e.g., emissions due to use of fertilizer and pesticide and energy consumption) and indirect (e.g., energy consumption during pre-plowing, seeding, irrigation, and harvesting) emissions.8,21
Cotton plants take up a lot of water in comparison to other plants. It consumes 1% to 6% of the world's freshwater during growth, which is excessively high. 13 In fact, for 1 kg of cotton lint (raw cotton 3 ), 10,000-17,000 L of freshwater is required. This can be reduced to about 7000 L by drip irrigation, which is also not environmentally friendly and causes quite a bit of CO2 emissions.22-24 Cotton needs special soil management due to its inability to extract enough nutrition from the soil itself for producing better quality cotton. 25 The soil management system feeds nitrogen, phosphorus, potassium, and other important minerals to the soil. 13 For cotton fiber, 100-180 kg/ha of nitrogen, 20-60 kg/ha of phosphorus, and 50-80 kg/ha of potassium are recommended, which are huge compared to other plants.13,23 Cotton also needs the application of insecticides and herbicides in large quantities.23,26 About 80% of cotton around the world is grown using this process. 13 These processes cause the emission of a massive amount of CO2 and other greenhouse gases. Next, the collected fibers are sent to the yarn industry.
The yarn spinning process consists of several processes and machinery. The fibers go through ginning, opening, mixing, carding, drawing, doubling, and spinning. 27 Operations taking place in the blowroom include carding, drawing, combing, and use of speed frame, ring frame, and winding machines.28,29 The electricity used to run these machines leads to CO2 emissions. Yarn production from fiber cultivation has shown quite a large amount of CO2 emissions, among which, the yarn production from fiber lint or staple fiber is the most significant source of CO2 emission (Fig. 3). For this study, the type of yarn was not specified between carded (contains some short fibers along with regular fiber) or combed (hardly contains any short fibers). 3 Instead, average values were used. But if those two processes were differentiated, combed yarn, for which an extra machine (the comber or combing machine) needs to be used, would cause greater CO2 emissions than carded yarns. 30
The CO2 emission values for these two steps (fiber cultivation, and yarn spinning or production) were taken from the software's Ecoinvent database. It was assumed that the yarns were spun by a yarn spinning industry situated close to the border of Bangladesh and then were transported to the knit composite industry in Bangladesh by road. The possible CO2 emissions were collected for that transportation.
After reaching the knit composite industry, the yarns went through several operations until converted into a packed garment. The carbon footprint of different stages of yarn to garment production (data collected from industries in Bangladesh) is shown in Fig. 4.
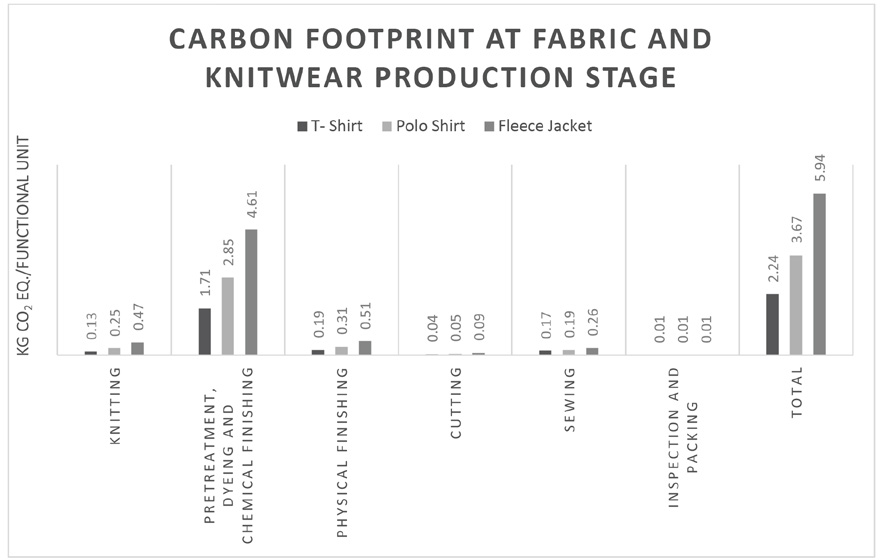
Comparison of carbon footprint at knitting and knitwear production stages for various knitwear.
Here, the CO2 emission values gradually increased again with the increasing material weight from the T-shirt to the polo shirt to the fleece jacket product. However, there are exceptions. Although these fabrics were single jersey fabrics, due to gradual complication of fabric structures in polo shirts and fleece jackets when compared to T-shirts, a gradual reduction in the production rate of polo shirts and fleece jackets led to a slight increase in CO2 emissions. The carbon footprint also includes use of the boiler, the generator as an additional electricity consumption source, and the total energy consumption in the research and development department of the fabric section. The research and development section produces fabrics before bulk production. Those fabrics are not included in the final fabrics, which go to the next level for final production, but the energy consumption in that department was included along with the total energy consumption of the knitting section.
In the next stage, the pretreatment, dyeing, and chemical finishing section, there are several pieces of machinery and different operations that the fabrics go through. These include scouring, bleaching, dyeing, and neutralizing in the wet treatment part. 31 For this study, the fabrics are considered to be solid dyed, which means dyed with only one color. For dyeing, reactive dyes were considered for this study. This did not affect the results because this study doesn't contain any chemical data, since the main focus was on energy and water consumption. The dye category was irrelevant for this study other than for calculating the required amount of water. The wet treatments consume a lot of water, and the chemical containing water is treated in wastewater treatment plants, which also produce solid wastes as landfill. 32 This study did not provide any data for recycling, or water and chemical reuse, since these have not become standard in industry yet. These wet treatments emit a vast amount of CO2, among which the wastewater treatment section causes the greatest amount of emissions, as shown in Fig. 5.
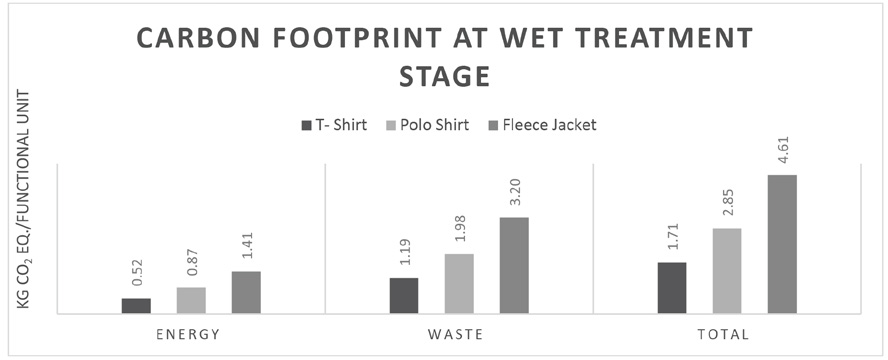
Comparison of carbon footprint at wet treatment stage of various knitwear.
The research and development section's energy consumption, and the textile testing and quality control section of the industry, were included in the wet treatment section's data. The research and development section checks the shade and fastness of dyes, and the testing unit tests both the physical and chemical properties of the fabrics. This study does not include any special wet treatment of the fabrics.
After wet treatment, the fabrics undergo a physical finish-ing unit. In this unit, slitting (from circular to open width fabric), singeing (removal of unwanted fibers from fabric surface), sueding, brushing, and other physical treatments are applied using various machines. These also include sten-ters and compactors used for controlling fabric dimension and the dimensional stability, along with other functions using the stenter machine. Not all of these are mandatory for all types of fabrics. For example, brushing is mandatory for the fleece jacket, but not required for the T-shirt. So, the amount of applied finishing varies with the type of fabric. The number of the processes increases gradually for fabrics from the T-shirt to the fleece jacket, which resulted in comparatively higher CO2 emissions for fleece jacket, then less for the polo shirt, and the least for the T-shirt.
The dyed fabrics then go to the cutting section. In the cutting section, the fabrics are cut according to the shape and size of different knitwear. The fabric structure or type of fabric varies with the cutting speed and efficiency of this section. A basic T-shirt needs five pieces of fabric, while the polo shirt needs seven pieces, and the fleece jacket needs a minimum of ten pieces of fabric. So, the production rate is greatest for the T-shirt, less for the polo shirt, and least for the fleece jacket. This trend results in the greatest CO2 emissions for the fleece jacket and least for the T-shirt. The cutting rate is also the greatest for the T-shirt and the least for fleece jacket.
In the sewing section, the trends were the same as for the cutting section. The sewing rate was lowest for the fleece jacket due to the larger number of fabric pieces to be sewn, a comparatively complicated sewing process, and the need for a greater number of machines than for the T-shirt and polo shirt. Both cutting and sewing sections depend heavily on the garment's weight and the structure, number of pieces, and the required number of machines for making the garment. Energy consumption of the research and development or sample-making section of this part was also included with the cutting and sewing section's data.
The last section was the inspection and packaging section; the production rate remained almost similar for all products in this section. The CO2 emission values also remained the same for all studied knitwear in this research. This depends on the number of garments rather than the type, since the functional unit for all knitwear in this study remained the same.
From fabric to knitwear production, all operations took place in the same industry for this study, so any additional transport (use of a cart, forklift, lift, and so forth) were considered along with the energy consumption for each section; no other transport was required. The transportation data given separately in the chart was only for transporting the yarn to the knit composite industry.
The CCalC2 software also calculated additional results regarding the emission of other greenhouse gases and the knitwear production process's water footprint. The results for different knitwear are given below in Tables V–VII. In these tables, f.u. means functional unit. The functional unit is the specified amount of garment. It is the amount for which CO2 emissions were calculated.
Other Environmental Impacts of T-Shirt Production
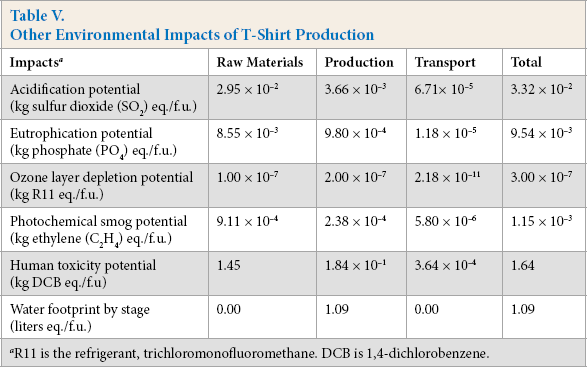
R11 is the refrigerant, trichloromonofluoromethane. DCB is 1,4-dichlorobenzene.
Other Environmental Impacts of Polo Shirt Production
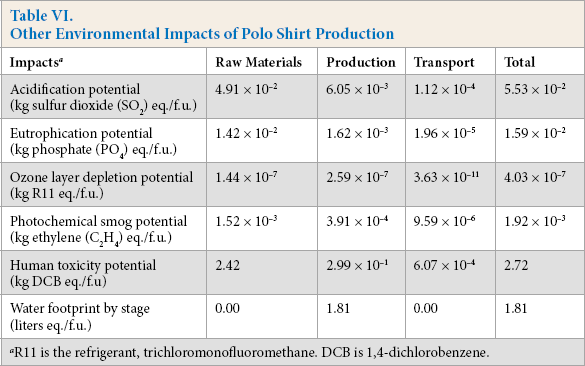
R11 is the refrigerant, trichloromonofluoromethane. DCB is 1,4-dichlorobenzene.
Other Environmental Impacts of Fleece Jacket Production
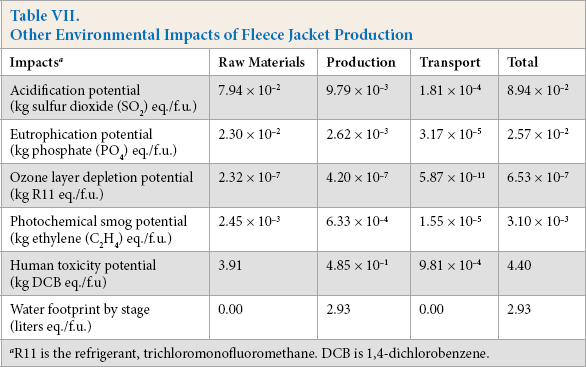
R11 is the refrigerant, trichloromonofluoromethane. DCB is 1,4-dichlorobenzene.
The above results show the same trend which has been seen in the results of the CO2 emissions for the three types of garments considered.
Discussion
From the previous analysis, a few important points that had the most influence on the carbon footprint of the products were found. The carbon footprint was greatly affected by the fabric structure. Fabric structures for the specified garments in this study are quite different, although all these are all single jersey fabrics (made using a single set of needle). Generally, T-shirts contain only knit loops, polo shirts contain tuck loops along with the knit loops, and fleece jackets contain knit, tuck, and miss loops.1,2 Actually, weft-knit fabrics (used to make the specified garments in this study) can be made using all three types of these stitches or loops. Fig. 6 shows tuck and miss stitches.
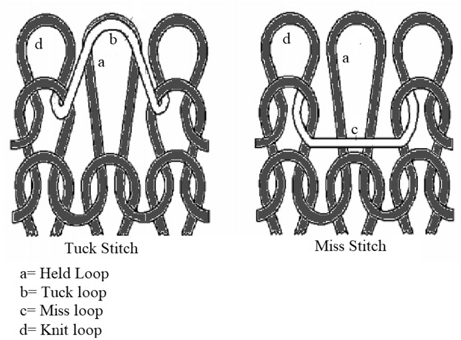
Tuck and miss stitch.
All weft-knit fabrics undergo shrinkage or relaxation after being withdrawn from the machine to release the tension under which the fabrics are made. When a fabric contains only knit stitches, that fabric tends to shrink in the horizontal direction because the loops are made in this direction. When tuck loops are introduced, the fabrics shrink comparatively less in the horizontal direction due to having more than one loop at a place, while shrinkage does take place significantly in the vertical direction due to withstanding more tension by the held loops, which are extended for more than one knitting cycle. making the fabrics wider but thicker.19,33
Even though T-shirts and polo shirts are similar types of fabrics that undergo similar treatments in the wet processing and finishing sections, there are some differences in fabric production. It is due to the presence of tuck loops. Machines are run at the highest possible rpms (revolutions per minute) for making fabrics with knit stitches only, while it is difficult to run the machine at the same rpm for fabrics containing tuck stitches. When making held and tuck loops, the yarn tension needs to be controlled with greater care to produce the required fabric properties. These fabrics are made on the same machine with slight adjustments and settings. For example, the machine ran at 22 rpm when making fabrics for T-shirts (yarn count was 28 Ne and the fabrics contained only knit loops). In comparison, the same machine with the same yarn could be run at a maximum of 18 rpm when making fabric for polo shirts (according to the collected factory data). The production rate was also different. For T-shirts, the production of a machine running at the above-mentioned settings produced about 190 kg fabrics per 12 h, while for polo shirts, the production was 140-145 kg per 12 h. Fabric gsm was higher for fabrics of polo shirts (∼200-220) than the fabrics of T-shirts (∼150-160). The fabrics used to make T-shirts and polo shirts were similar apart from the stitches, giving the fabrics different appearance and properties compared to the fabrics contained by T-shirts, which were made by only using knit stitches.
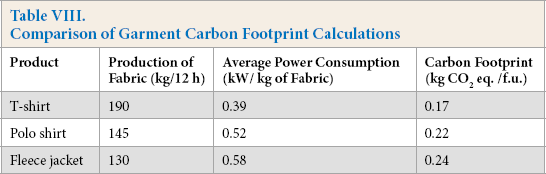
Fabrics for fleece jackets have to undergo more operations in the finishing section (e.g., brushing) than fabrics for T-shirts and polo shirts, which greatly affects the carbon footprint. Generally speaking, these fabrics are made by using similar principals and types of machinery. Machines for making fabrics of fleece jackets were also almost identical, except for a few differences (the yarn feeding points and different lengths of loops in the structure). The fleece jacket needed all three types of loops in the structure. Miss loops behave more like a tuck loop than a knit loop. So, fleece jacket fabrics, having all stitches in the structure and of different loop lengths (length of yarn in a loop), are sensitive to yarn tension, which needs to be adjusted with great care (the loop length was kept similar for whole fabrics in T-shirts and polo shirts) by slowing the relative machine speed. Therefore, the fabric structure affected fabric production, which had its effect on carbon footprint calculation, along with the fabric weight. Table VIII shows the average power consumption (in kw) for machines to make the fabrics in this study, along with the possible carbon footprint calculation by CCaLC2 software. Here, only the energy consumption of the machine is shown, while other energy consumptions, such as direct input gas consumption by machinery during processing, are not included. As the above table shows that, the carbon footprint was higher for fabrics with lesser production. Hence, the fabric structure has a significant impact on the carbon footprint, but it might not be as visible as it can be in this section.
Comparison of Garment Carbon Footprint Calculations
Garment Fabric Weight
The main focus in the carbon footprint analysis was on energy consumption based on the fabric weight. The calculation was based on energy consumption per garment unit for the three types under study, including the energy consumption for producing or processing a unit weight of yarn, fabric, and garment at different stages. The difference in carbon footprint between the production of the three garments was primarily the result of the difference in the weight of the final products. The fabric of the polo shirt was comparatively heavier than the T-shirt even when same yarn and machine settings were used. Also, the polo shirt contained more fabrics in its structure. For example, polo shirts contained a pocket that T-shirts did not have, also resulting in more cutting and sewing operations. Tat's why energy consumption increased for polo shirts compared to T-shirts.
Fabrics for the fleece jacket were a bit different as it contained three sets of yarns of three different loop lengths (three thread fleece). All yarns were cotton while keeping the resulted count of those yarns as similar to the other two garments as possible, but the resulting fabric was different in terms of structure, weight, and appearance. The fabric structure's complexity reduced its production rate, which affected the carbon footprint as discussed previously. These fabrics also needed to undergo more finishing treatments (e.g., raising and brushing), and needed more fabric pieces (such as a hood), resulting in more energy consumption and CO2 emission during production compared to the other two products. Tat's why heavier fabrics or garments resulted in more CO2 emissions, according to this study.
Garment Type
Garment types have a significant impact on the carbon footprint of the final product. For example, this study considered garments with various types of fabric. The fabric structure has a considerable impact on fabric weight, productivity, and the final product's carbon footprint. On the other hand, various types of garments need different finishing, cutting, and sewing facilities, as mentioned earlier. Also, different types of garments have different styles, for which the number of fabric pieces required for making the garment varies a lot. Garment design is an essential factor that has a significant impact on the final product's carbon footprint.
Recommendations
This study was done to find out the quantity of CO2 emissions under boundary conditions from commonly-used cotton garment production methods from the fiber to the garment. This study has found that knitting, pretreatment, dyeing, and finishing (chemical and physical) sections have contributed to most carbon dioxide emissions, and among these processes, the pretreatment and chemical finishing process contribute the greatest. The focus was on energy and water consumption. The results found in this study are mainly related to energy consumption by the machines during operations. Although the wastewater treatment section was considered, the impacts of individual chemicals on carbon footprint were not studied here. Based on this study, machine energy consumption cannot be changed greatly because of the impact of fabric structure on productivity. Using modern machinery that consume less power per unit of production is one recommended solution.
The carbon footprint of yarn production was taken from the database provided with the software in this study. Many factors can affect the carbon footprint resulting from yarn production. Fiber size, fiber type, drafting ratio, twist per inch, and so forth can be varied to vary the production rate and yarn properties. These can have a significant effect on the carbon footprint of the final yarn product, and the rate of fabric production, as well as garment production, may also be affected.
In the case of pretreatment, dyeing, and finishing, a few recommendations can be made such as using a waterless or a less water-consuming dyeing process, minimizing salt and water consumption using enzymatic processing in fabric preparation, using biodegradable organic salts for fixation and exhaustion, and by modifying the surface of cotton fabrics to reduce the volume of the effluent and total dissolved solids.34,35 Using the least amount of chemicals is also recommended. Other than these, not many other recommendations can be made based on this study to reduce the final product's carbon footprint.
Conclusion
Greenhouse gases have been affecting our environment adversely for a long time, especially since the beginning of industrialization. This study attempted to find out the effects of some common knitwear production on the environment in terms of CO2 and other greenhouse gas emissions. The results showed that complex and heavy fabric structures were responsible for a greater amount of CO2 emissions due to more resource consumption and the complexity of knitwear manufacture. This study has focused mainly on energy and water consumption in different processes, while many data have been excluded, such as direct emission from machines, people, and other operations. Also, as cotton fibers are not grown in Bangladesh, the data were collected from the global database provided with the software used in his study. This study has been done only on single jersey fabrics, but future studies can also be done on double jersey fabrics (produced with two sets of needles), used to make a sweaters and other knitwear for cold weather. The results of these studies can reveal the contribution of different operations during knitwear production, from which the most damaging processes can be identified, leading to further research to find ways to reduce or eliminate the damage.