
Abstract
The cracking process in Longmaxi formation shale was experimentally studied during uniaxial compressive loading. Both the evolution of the three-dimensional fracture network and the micromechanics of failure in the layered shale were examined as a function of the inclination angle of the bedding plane. To visualize the cracking process, the test devices presented here used an industrial X-ray CT scanner that enabled scanning during the uniaxial compressive loading. Scanning electron microscopy and environmental scanning electron microscopy imaging techniques were used to observe the microscopic characteristics of fractured surfaces of failed specimens. The combination of these observations clearly illustrated the micromechanics of the failure process in the anisotropic shale. The experimental results suggest that the cracking process could be divided into two stages under uniaxial loading, and the microstructures and bedding planes of the shale played an important role in the cracking process of layered shale. In the first stage of deformation, the cracking mainly occurred as smaller microcracks (such as intergranular, microcracks), and the propagation of the newly formed microcracks was controlled by the bedding plane of the shale specimen. The microscopic imaging study showed that the microscopic damage was mainly dominated by microtensile fractures under uniaxial compression. In the second stage, with the increase in loading, the extensive development and coalescence of the microcracks led to the formation of complex fracture networks. The complexity of the fracture networks was related to the microstructure of the sample. The coalescence of the microcracks could be divided into three levels in the spatial scale, and the coalescence patterns included both tensile and shear patterns.
Introduction
In recent years, the mechanical behavior of shale has drawn significant attention. This is mainly due to the increased interest in the exploitation of shale gas and shale oil. Due to the shale’s ultralow permeability and porosity, the horizontal wells and hydraulic fracturing of two key technologies have been developed to stimulate reservoir volumes to create complex artificial fracture networks (Maxwell, 2011). Both the hydraulic fracturing and the stability of the borehole walls are the key issues that restrict the commercial development of shale gas (Wen et al., 2014; Xie et al., 2016; Yu et al., 2017; Zeynali et al., 2012). However, so far, the formation mechanism of complex fracture networks and well wall stability have not been fully understood. An understanding of the cracking process in shale is essential for achieving enhanced hydraulic fracturing and better stability of the shale gas well.
Rock has heterogeneous microstructures with a variety of preexisting or stress-induced defects, such as grain boundaries, pores, cracks, bedding planes, and minerals. The rock failure process is a macroscopic catastrophic process that occurs due to the accumulation of the propagation and the coalescence of microcracks (Kazerani, 2013; Li and Tang, 2015). Under compressive stress conditions, the preexisting microdefects induced the local tensile stress concentration, which create tensile microcracks that propagate and coalesce into macroscopic cracks (Lan et al., 2010; Lockner et al., 1992). Microscopic observations have also shown that most of these microcracks starting at grain scale are tensile which is the primary mechanism of fracture in rock materials (Blair et al.,1998; Brace et al., 1966; Duan et al., 2014; Fairhurst and Cook, 1966; Fonseka et al., 1985; Gallagher et al., 1974; Hallbauer et al., 1973; Kazerani, 2013).
Anisotropy is one of the most striking features of shale, which were attributed to the preferred orientation arrangement of its mineral grains and micro or macrocracks (Cho et al., 2012; Gao et al., 2015; Heng et al., 2015). The failure of shale is more complex than is often assumed; anisotropy is a critical factor for controlling its failure modes and failure process (Amann et al., 2011; Bienawski et al., 1967; Corkum and Martin, 2007; Jaeger, 1960; Niandou et al., 1997; Tien et al., 2006). Niandou et al. (1997) showed that fracturing occurred along bedding planes for loading orientations of β = 15–60° (the angle between the bedding plane and the direction of major principal) and across bedding planes for high loading orientations of β = 60–90° at both high and low confining pressures. For load orientations of β = 0–15°, fracturing along the bedding planes occurred at low confining pressures and fracture across bedding planes occurred at high confining pressures. In the macro-scale, stress–strain curves were thought to be the most important mechanical property (Niandou et al., 1997). Corkum and Martin (2007) subdivided the typical stress–strain behavior of shale under unconfined compression into five regions, that is microcrack closure, linear elastic deformation, onset of crack initiation, unstable crack growth, postpeak (Corkum and Martin, 2007). Amann et al. (2011) developed a conceptual model which hypothesized that cracks initiate in stiffer layers and then propagate to the boundary of softer layers and coalesced due to shear cracks. In contrast, to this model (Amann et al., 2011), Tien et al. (2006) showed that cracking initiated in the weaker layer at low bedding plane angles (Tien et al., 2006). Many studies have been conducted to investigate the faulting phenomenon of rock, and a variety of analysis methods have been applied, such as optical microscope, scanning electron microscopy (SEM), acoustic emission (AE), micro-computed tomography (CT) scanning (Cała et al., 2016; Kawakata et al., 1999; Li et al., 2017; Liang et al., 2012; Sufian and Russell, 2013; Wu et al., 2017; Yang et al., 2016). The AE technique can monitor the occurrence and location of cracking events, of real-time acoustic velocity mapping. Many researchers have applied this technique to the study of the rupture process. Wu et al. studied the shale failure process and spatial distribution of fractures using AE monitoring. Li et al. (2017) performed the AE tests on shale samples, to monitor the response of the anisotropic wave velocity and fracture behavior to elevated stress (Li et al., 2017).
In the recent years, X-ray microCT has become a powerful tool to nondestructively characterize, visualize, and quantify the internal structure of rock materials. In particular, it has been effective at studying deformation processes. X-ray microCT provides 3D imaging, achieves high spatial resolutions at scales down to the micron level, and marks the density contrast between rock-forming minerals and void space. Increasing numbers of researchers have been using X-ray imaging to study the fracture processes of rocks (Cnudde and Boone, 2013; Jaccobs and cnudde, 2009; Ketcham et al., 2010; Ma and Chen, 2014; Mukunokia et al., 2014). Cala et al. (2016) used X-ray CT scanners to discuss the connection between the mechanical parameters, the geometry of the failure mechanism, and the structural as well as textural features of shale sample. Yang et al. (2016) studied the fracture propagation at high temperatures using a high-resolution X-ray CT scanner. In most rock mechanical testing devices, the internal structures developed during deformation are only observed after the failure, and detailed maps of cracks and pore structure evolution, just before or after rupture, remain speculative (Yang et al., 2016). Raynaud et al. (2012) developed an X-ray transparent triaxial cell that was incorporated in a medical X-ray scanner, which can regularly scan the porosity evolution during mechanical loading (Raynaud et al., 2012). Mukunoki developed a test system that utilized an industrial X-ray CT scanner, which enabled scanning during mechanical bending tests (MuKunoki et al., 2014).
The objective of this study is to explore the cracking process of Longmaxi shale. To study the cracking process of the samples, X-ray CT scans were obtained during uniaxial compressive loading. 3D fracture network of shale specimens were generated based on CT images using software for 3D reconstructions. The evolving of the fracture network was observed and quantified. In this study, we paid particular attention to various fracture network obtained at different bedding plane angles (β = 0°, 45°, 90°). Finally, the micromechanism of the cracking process of the shale specimens was discussed using SEM/environmental scanning electron microscopy (ESEM) observations of the fault surface and 3D fracture networks.
Methods
Characteristics of the shale material
Petrophysical properties of the testing shale.
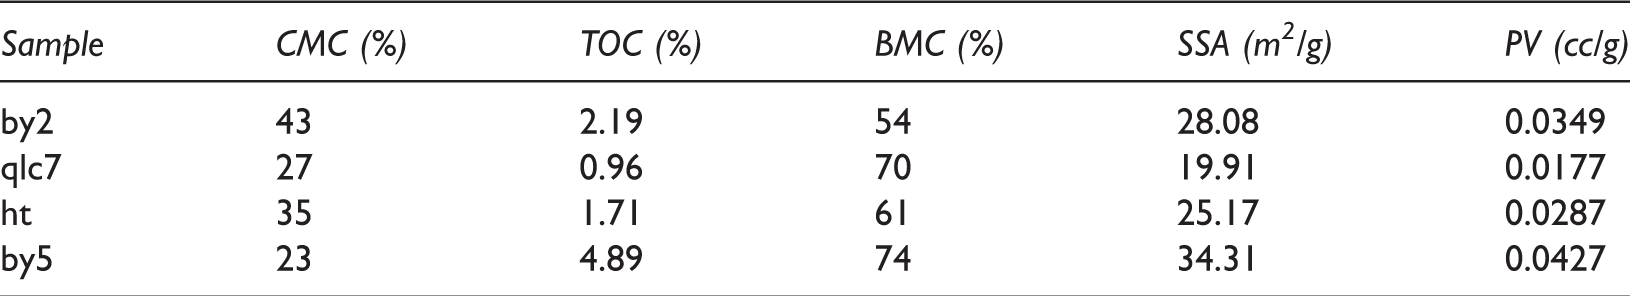
BMC: brittleness mineral content; CMC: clay mineral content; PV: BET pore volume; SSA: BET specific surface area; TOC: total organic content.
It is well known that the microscopic heterogeneous nature of organic-rich shale arises from the textural complexity and variation of its mineralogical composition. Fracturing and coupled processes in shale are largely controlled by its microstructure. Due to the high degree of heterogeneity of shale at different scales, its microstructure characterization required different multiscale visual imaging techniques (Figure 2). The shale formation was studied via SEM, transmission electron microscopy, and optical microscopy.
Thin sections of the shale specimens (Figure 1(a) and (d)) exhibited bedding planes in the vertical plane. The degree of development of the sample foliation was quite different. The layers of a few samples were not developed, except for the samples by2 (Figure 1(a)) and qlc7. Figure 1(b) and (e) shows SEM images of the microstructures of the shale specimens. The samples had not only complex mineral compositions but also many organic matter pores, interparticle pores, intraparticle cracks, and microcracks (Figure 1(b) and (c)). Figure 1(d) and (e) shows a series of microcracks oriented approximately parallel to bedding plane. These microcracks tended to increase the compliance in the direction perpendicular to the bedding place and were also responsible for the initial nonlinear mechanical behavior. Figure 1(f) shows the shale also revealed strong heterogeneous at the nanometer scale, which also affects the nonlinear mechanical behavior of shale.
Microstructural characteristics of the shale. Sample loading method and its specifications. Stress–strain response of the shale under unconfined compressive loading.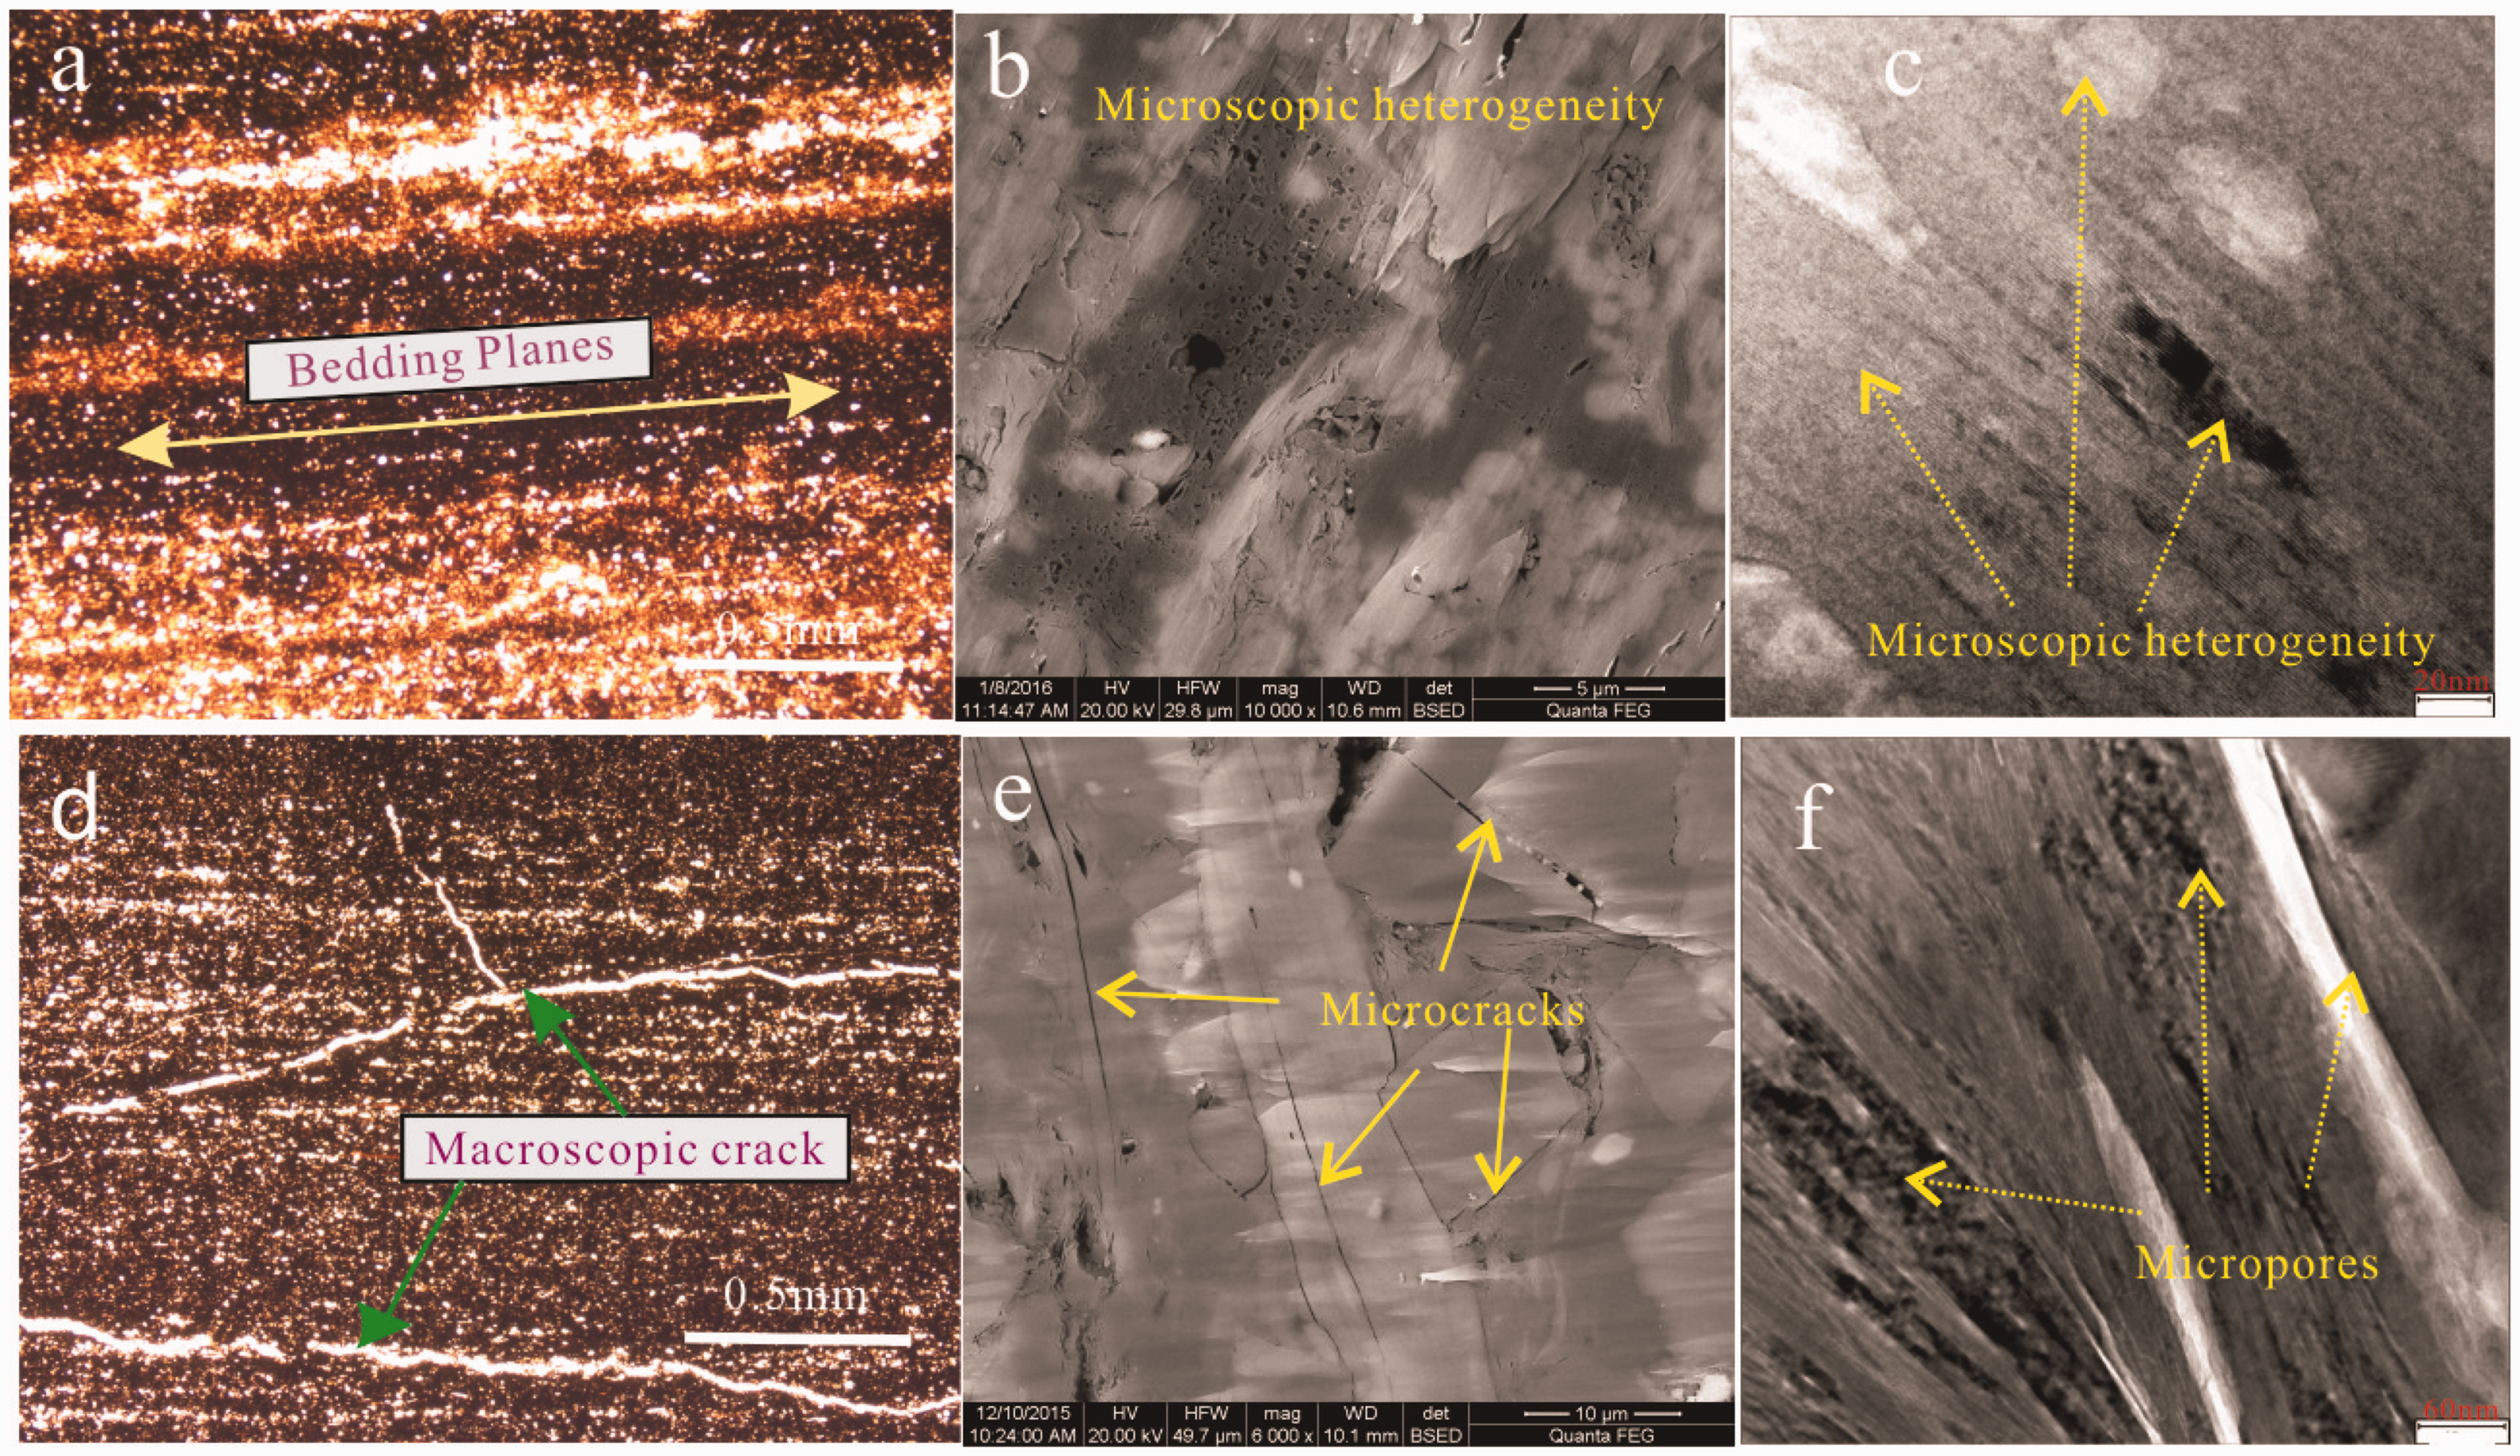
Experimental apparatus and experimental procedure
X-ray microCT system
The X-ray microCT system used for the present study was an Xradia 510 Versa 3D X-ray microscope system. The Xradia 510 Versa can achieve a 0.7 µm true spatial resolution with a minimum achievable voxel size of 70 nm. The system is located within the Key Laboratory of Shale Oil & Gas, Chinese Academy of Geological Sciences. The microCT system includes the following: (1) an acquisition computer; (2) a reconstruction computer; and (3) a shielded cabinet, which houses a uniaxial compression apparatus, a 240 kV microfocused X-ray tube, an X-ray detector array coupled to a 1024 × 1024 pixel charge-coupled device sensor, and a 5-axis computer numerical control rotation stage to position the object to be scanned.
The loading apparatus used in this study was housed within the Xradia 510, and the specimens were scanned at each deformation level using the X-ray CT scanner without unloading. The uniaxial compression apparatus is practically the same as the conventional system. The uniaxial compression tests discussed here were performed using dry specimens.
Experimental procedure
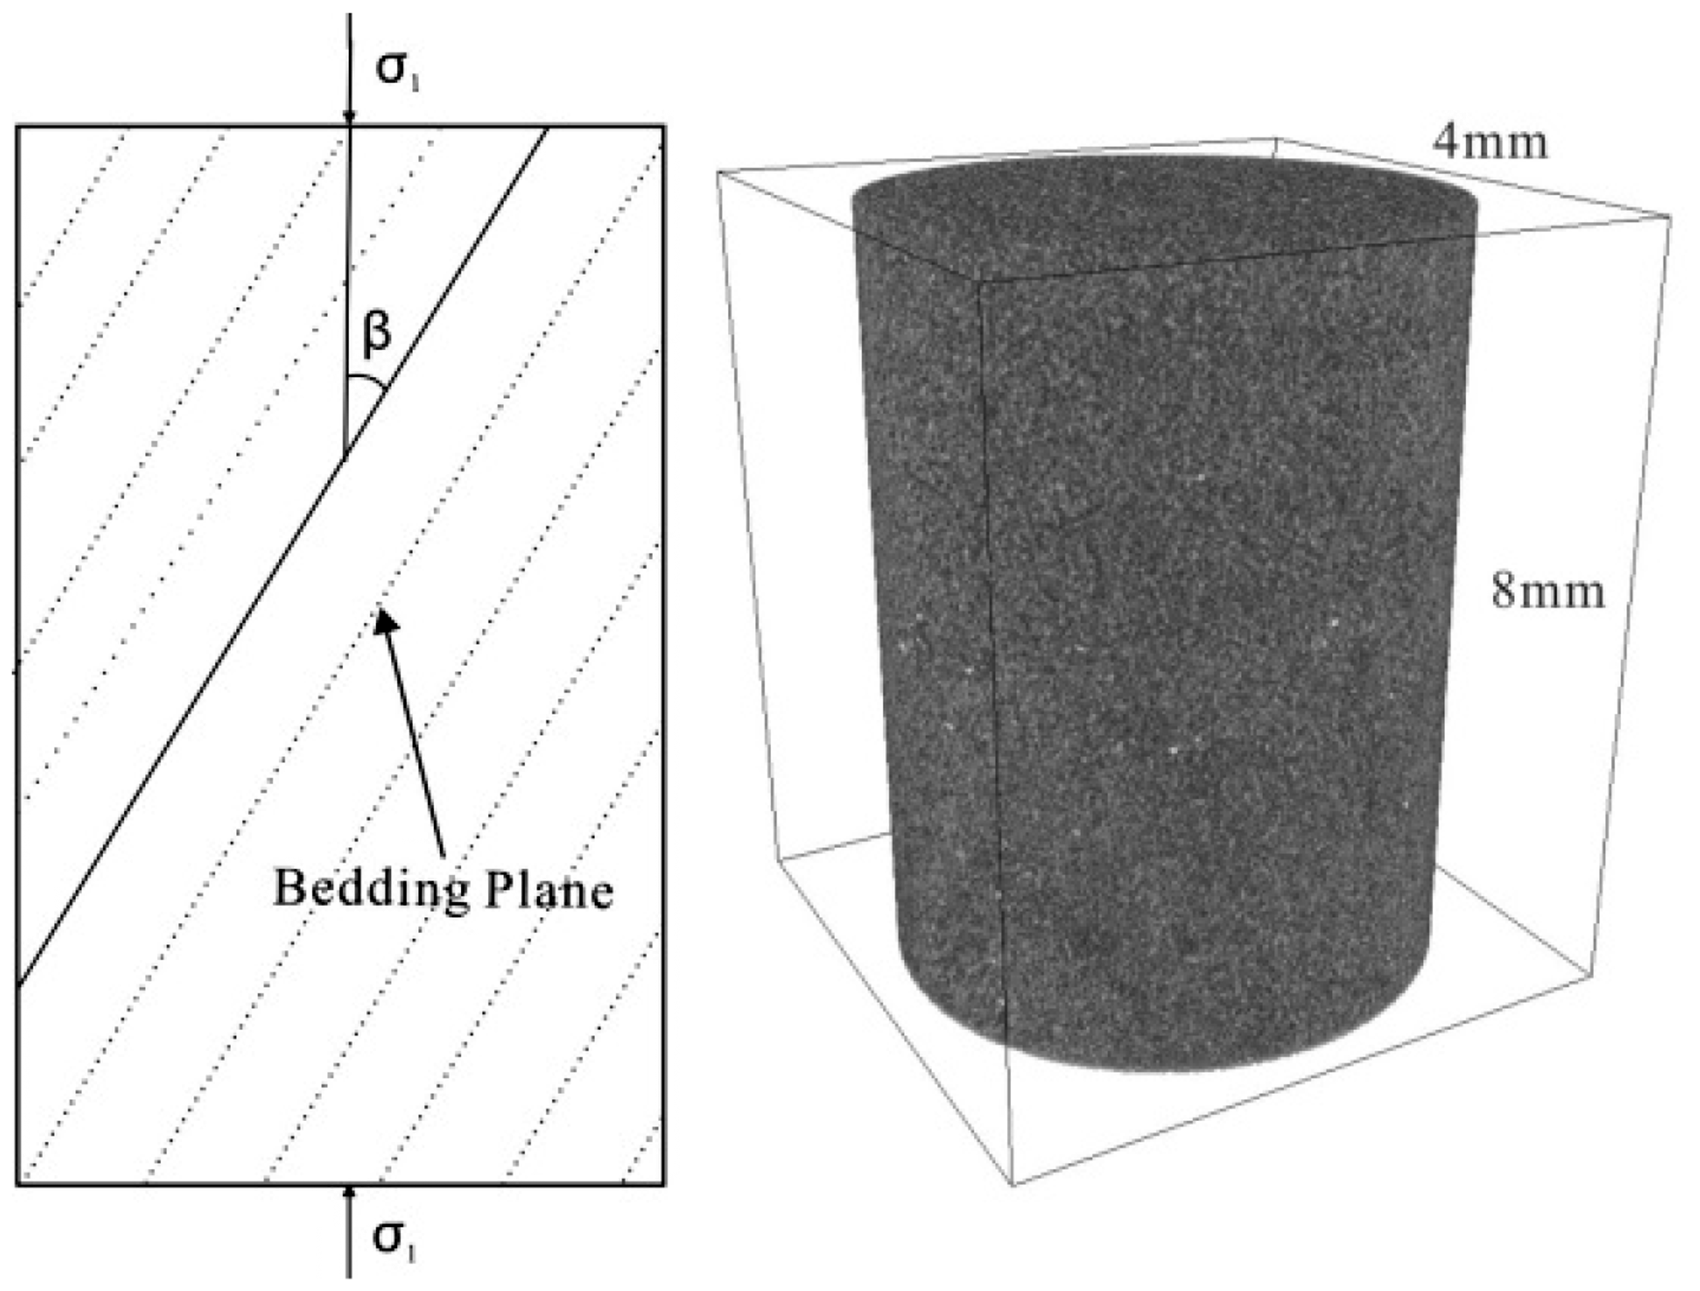
To obtain the highest magnification and clearest CT scan images, the sample diameters needed to be as small as possible. The rock specimens were 4 mm in diameter and 8 mm high. The ends of the core were polished and cast in lubricant prior to clamping to avoid eccentric loading. The shale samples were drilled from blocks in three direction (Figure 2), oriented at β = 0°, 45°, and 90° (bedding plane angles) with respect to the bedding plane orientation. Two samples were prepared for 0°; the other two were prepared for 45°and 90°, respectively. To predict the scanning position, two identical cylinders were taken from the same sample, one of which was used for uniaxial compression to obtain a stress–strain curve without CT scanning; the other was subjected to CT scanning. The number of scans and the positions were based on the stress–strain curve determined using the first cylinder.
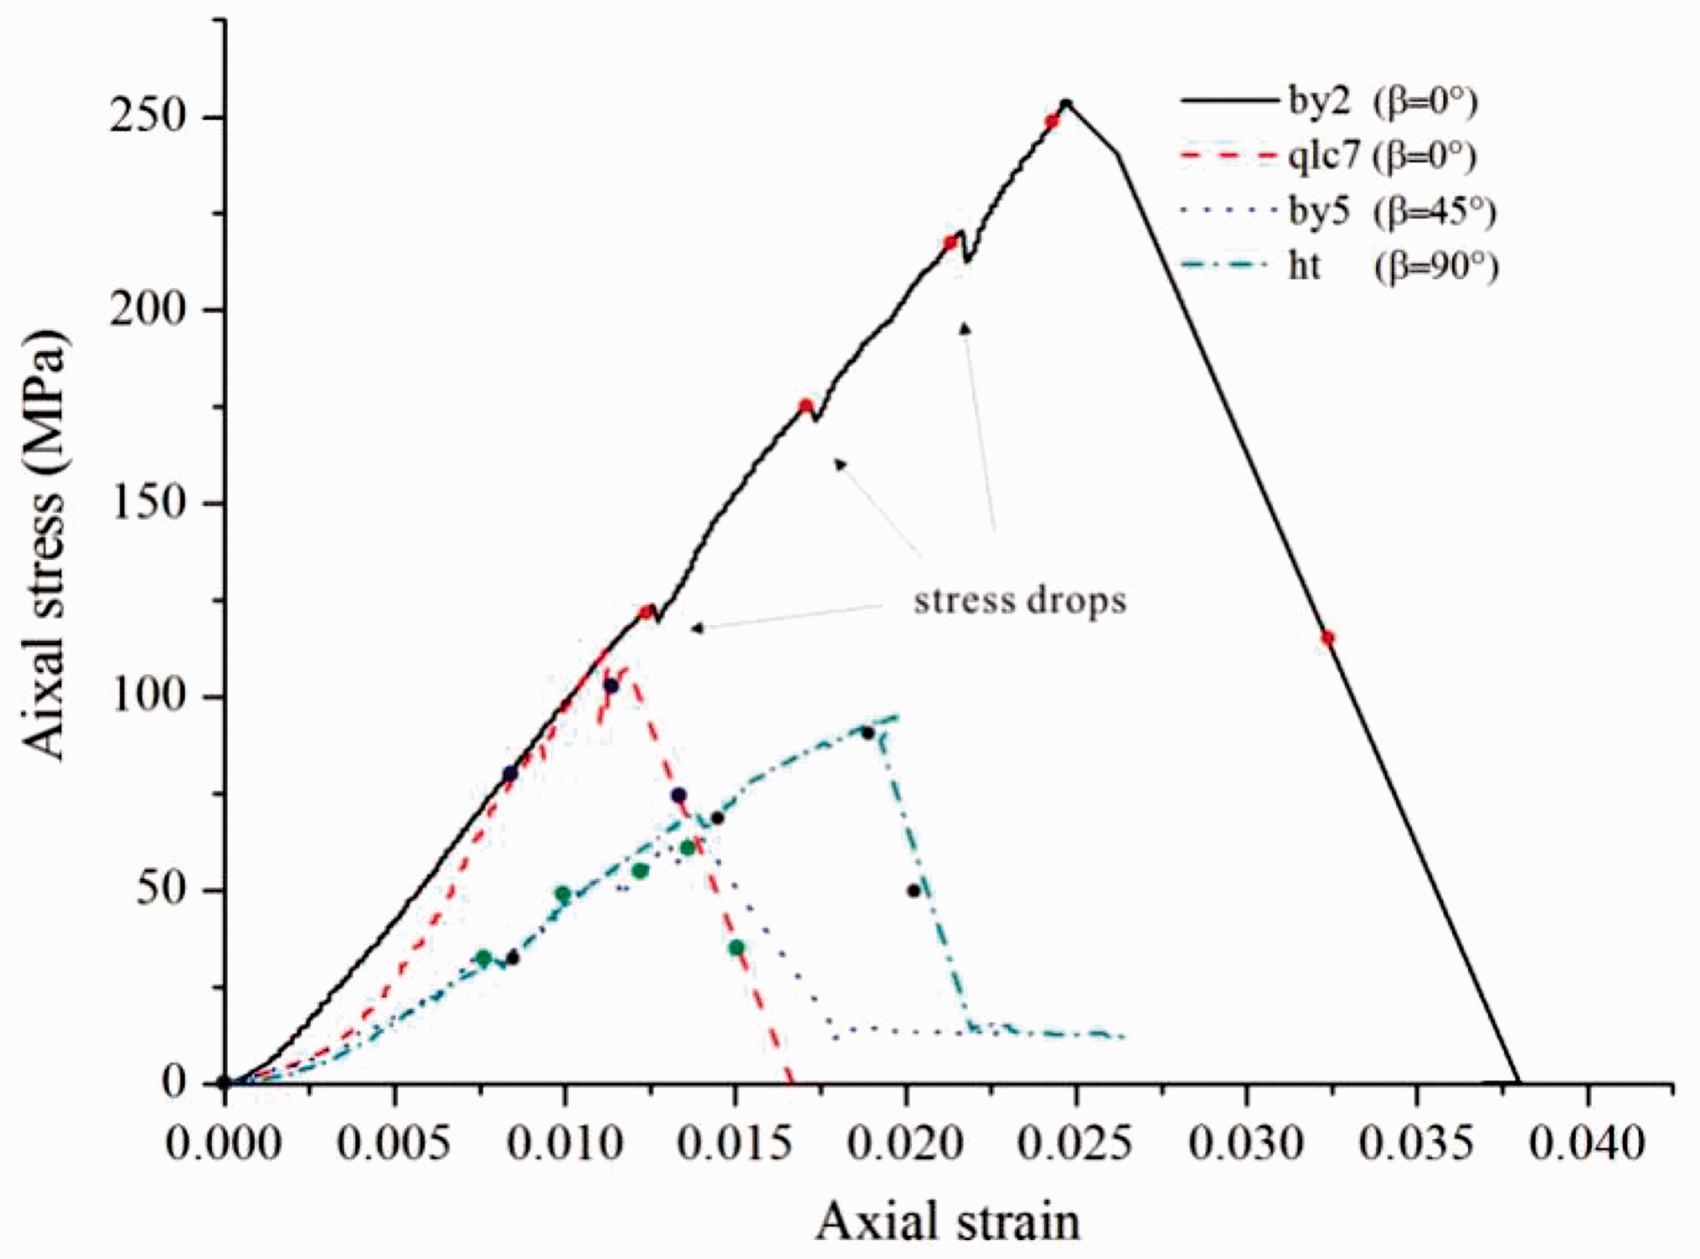
For these experiments, the working voltage and current used from the X-ray generator were 90 kV and 89 µA, respectively. Horizontal cross-sections were scanned at every 13 µm, and their images were saved in the tiff. file format. All of the horizontal cross-sections were stacked into a 3D image by overlapping neighboring cross-sections with a thickness of 13 µm. Each 3D image dataset consisted of approximately 600 microCT slide images (1024 × 1024 pixels) with 16-bit gray levels. The initial scan was carried out under a very small clamping load, and the last scan was conducted after failure. The other scans were carried out at key moments throughout the tests, which were marked by stress drops in loading curve (Figure 3). To study the microscopic characteristics of the microcracks, sample by5 and a small area inside the sample (a 400 µm diameter and 600 µm long cylindrical area) were subjected to fine scanning, and the working voltage and current used were 70 kV and 86 mA, respectively.
The loading was strain controlled with a load rate of 30 µm/min, which corresponded to a quite low strain rate (0.00375%/min for an 8 mm high specimen).
SEM/ESEM analytical experiments were carried out in the Key Laboratory of Shale Oil & Gas, Chinese Academy of Geological Sciences, Beijing, using a high-resolution SEM (SU8010). SU8010 is a cold-field emission SEM instrument with high resolution. The ESEM equipment involved in this study included an FEI Quanta 600 field-emission gun with a resolution of 1.5 nm for both the low-vacuum and ESEM modes and an accompanying voltage up to 30 kV. Our focus was to study the development of the microscopic crack systems to reveal the fracture mechanisms of the specimens.
MicroCT image analysis
The grayscale images were obtained using CT scanning, and the gray images were processed (noise reduction, filtering, smoothing, and segmentation). Segmentation was conducted to identify the pores and minerals in the images. We mainly used the threshold segmentation method. Because the color of the pores in the image was deeper than the color of the mineral, we could easily segment the pore network structure from the gray image (Ketcham et al., 2010). The mean gray-value method (Glasbey, 1993) was adopted to obtain objective threshold values. The 3D images were analyzed using Avizo software. Avizo software is the latest product launch from VSG made specifically for earth geology, materials science, and CAE engineering calculations, and it is a powerful visualization software (https://en.wikipedia.org/wiki/Avizo_(software)). By using Avizo, 3D fracture networks were reconstructed for four specimens to capture complete images of the fracture network and to reduce artifacts in the vertical cross-sections.
Results and discussions
Mechanical characteristics and fracture evolution
Stress–strain curves and failure load
Figure 3 shows the stress–strain relationships of the shale samples under unconfined compressive loading. The scanning positions are marked on the curve with different dots. Distinct stress drops were observed several times in the stress–strain curves under uniaxial compression, which were attributed to the heterogeneous rock compositions and microstructures of the samples or to microcrack initiation and propagation. The anisotropic rock compression was significantly affected by the existence of the bedding plane. Similarly, the failure load was closely related to the loading orientation angle (Figure 4). Figure 4 shows shale specimens that exhibited a maximum failure load at β = 0° or at 90°, and they exhibited the minimum failure load at β = 45°. The failure load at β = 90° was slightly lower than that at β = 0°. The failure load of sample by2 was much larger than that of sample qlc7, which had the same bedding plane angle. This may have been due to the differences in their mineralogy and microstructure. Qlc7 had a higher brittle mineral content, but its specific surface area and pore volume were smaller than those of by2 (Table 1).
Failure load versus bedding plane angle determined from the unconfined compression tests.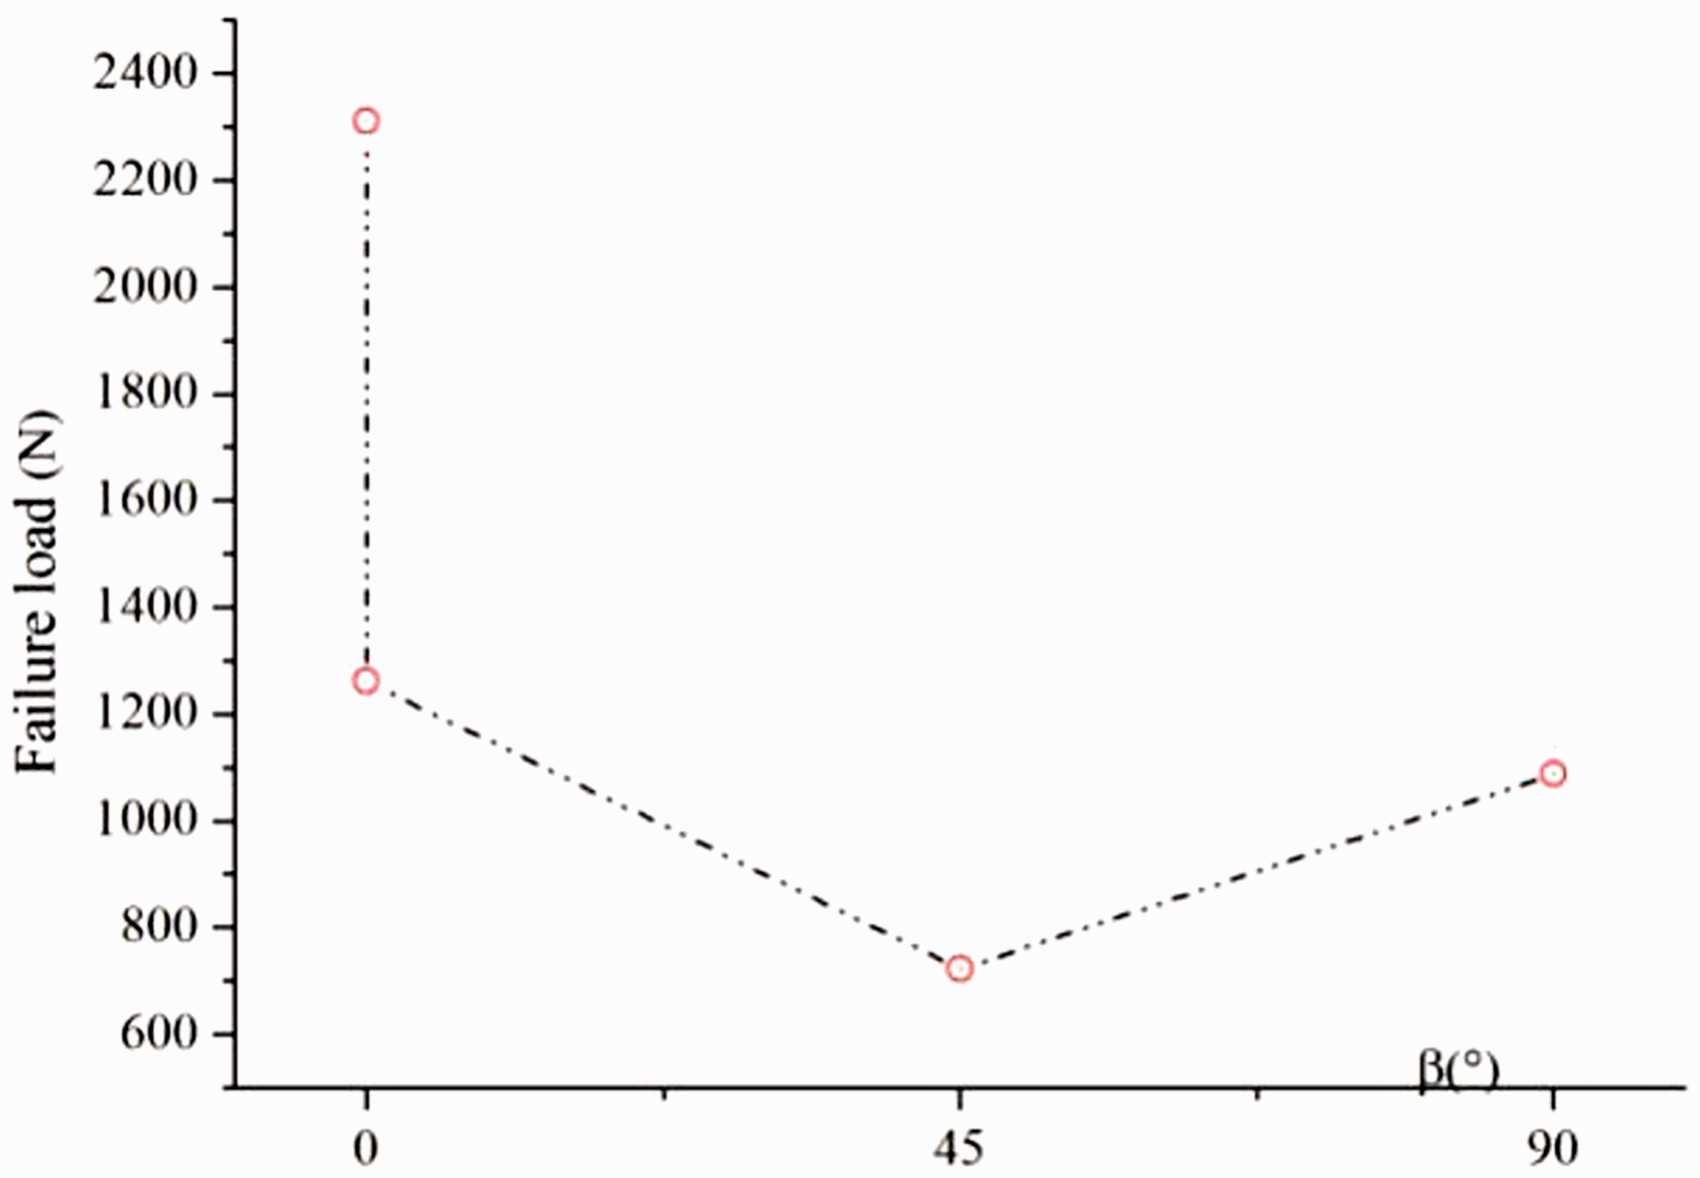
The observed u-shaped trend in the failure load versus the bedding plane angle, with a minimum failure load at a 45° bedding plane direction, has been shown for other anisotropic materials. Since the layered shale consisted both soft layers and stiff layers, it was expected that the response at high bedding plane inclinations (β = 90°) would be softer yet stronger. This is because shale deformation is dominated by the soft layers, but the failure of the strong layers dominates the strength. In contrast, at low bedding plane inclinations (β = 0°) the stiff layers dominated the deformation, and failure along the weak layers occurred at lower stresses.
3D fracture network of layered shale
Figure 5 shows the 3D fracture networks of four shale specimens at different deformation stages, which were generated based on the X-ray tomography images. From the evolution of the 3D fractured network, the failure process of the shale could be divided into two stages: during stage 1, before the occurrence of the macroscopic cracks, the initiation and propagation of the microcracks initiating from the preexisting microcracks on a variety of scales comprised the dominant deformation processes of the shale samples. During stage 2, the occurrence of the macroscopic cracks dominated the rock deformation.
Images of the 3D fracture network of the shale samples at different deformation stages.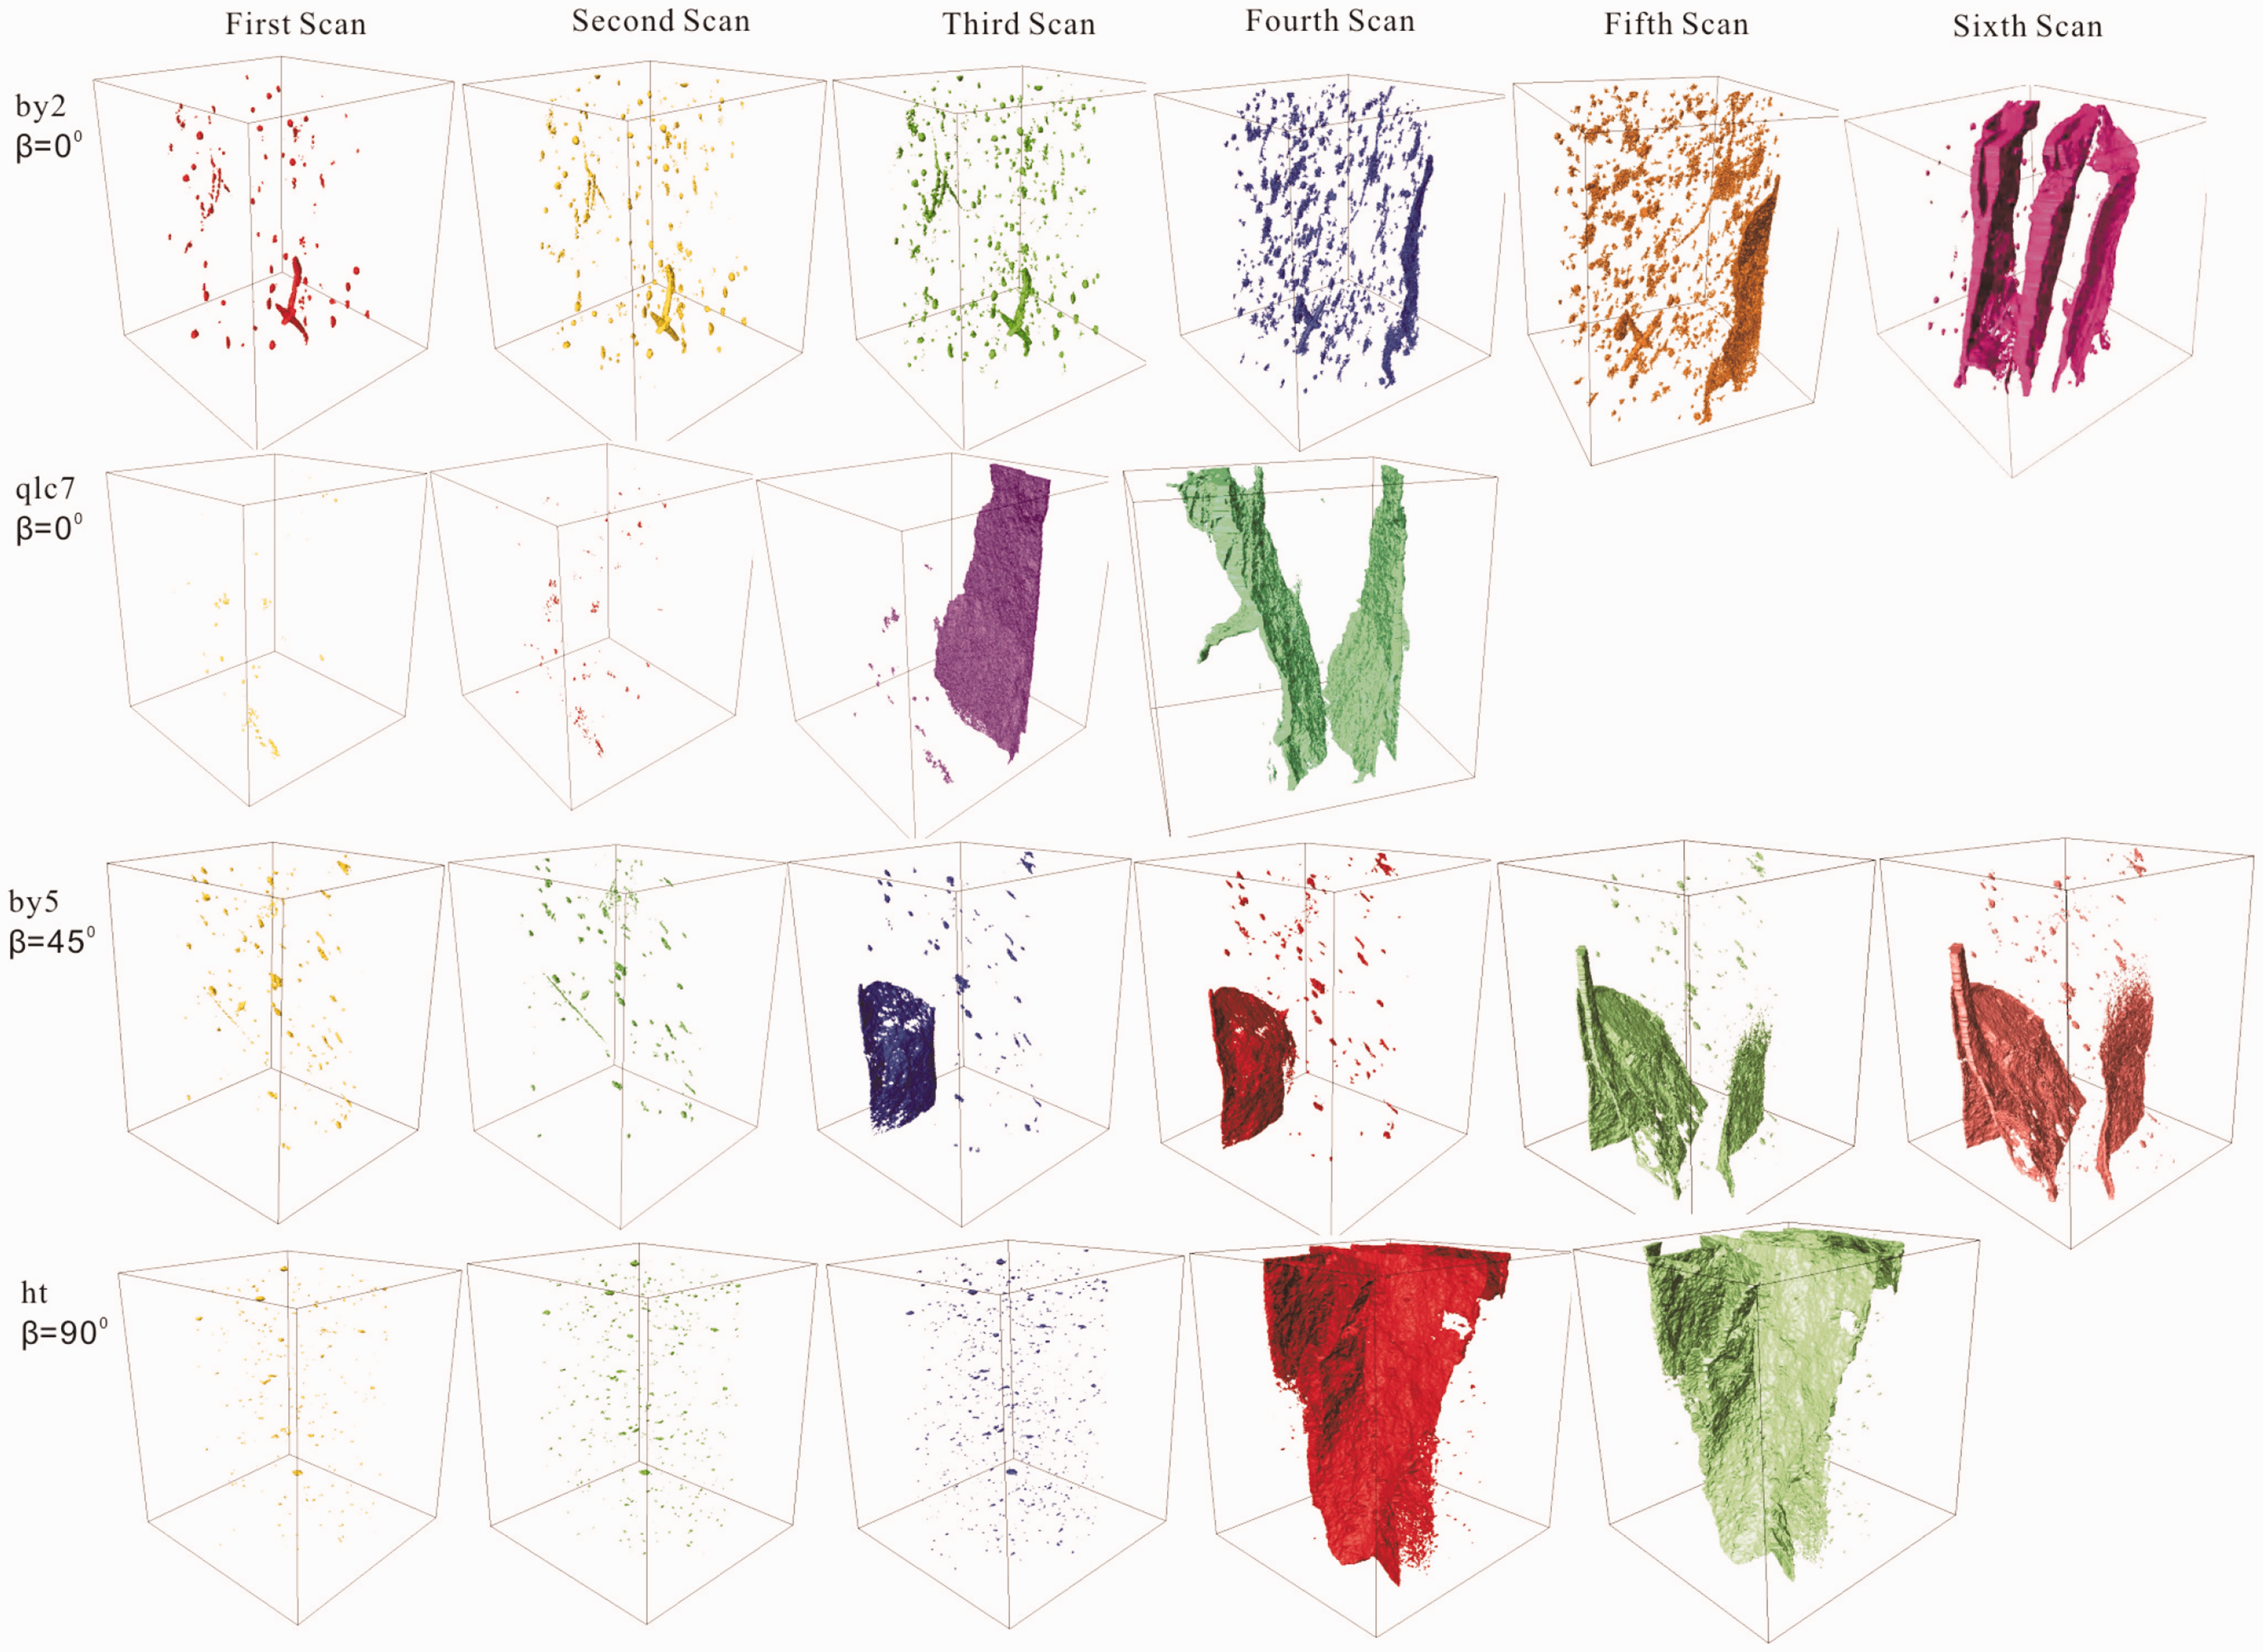
The first column images of the 3D fracture network, which were obtained in the absence of the load, exhibited numerous preexisting cracks in each specimen (Figure 5). The number of cracks in sample qlc7 was significantly lower than that of the other three samples. Most of the preexisting cracks that were developed along the bedding plane were either original cracks formed during diagenesis processes or induced during drilling, stress relaxation, specimen preparation, or shrinkage. For the second set of 3D images, new cracks were formed under compressive stress conditions, and the density of cracks increased. However, the preexisting cracks were not lengthened. For the third set of 3D images (for both samples by2 and ht), new cracks were generated. During stage 1, the generation of new cracks was dominated by bedding planes. The preexisting cracks remained nearly unchanged under uniaxial compression loading. This suggests that there was no clear relationship between the new and preexisting fractures. Microcracks from the nano to micrometer scale are widely known to affect the physical properties of shale. The microcracks of the shale samples were too fine to be observed in the X-ray CT images. Hence, the preexisting cracks in the first set of scan images (Figure 5) did not include these microcracks, indicating that cracking during stage 1 appeared to produce smaller cracks, such as intergranular microcracks.
Continued loading induced not only comprehensive microcracking, but also coalescence of the unconnected microcracks. Figure 5 shows that the first macroscopic cracks appeared in the side areas of the samples (by2, qlc7, and by5), while a complex fracture network was quickly formed in the sample ht. The density of the cracks continued to increase, indicating that new cracks continued to generate, and the preexisting cracks continued to propagate and coalesce as the load increased (Figure 5, by2 and by5). After the peak load was reached, a very slight increase in the applied loading rapidly led to the formation of a fracture network. The macroscopic failure surface was stepped at a typical inclination of 70°–90° from the horizontal, which was interpreted as a shear surface. Macrocracks cross from one bedding plane to another, ultimately resulting in an irregular fracture. This result occurred because the orientation of the bedding planes was not completely constant and could locally vary by a few degrees. The first macrocracks of by5 started along the bedding plane and then coalesced into a vertical crack. The macroscopic fractures of sample by2 occurred approximately parallel to the bedding planes, indicating that the bedding structure played an important role in the deformation and fracture behavior of the shale samples. Compared with the other three samples, the number of preexisting cracks of qlc7 is significantly less than that of other three samples, and the specific surface area of the sample qlc7 is minimal, this leads to a reduction in the complexity of the fracture network. It indicates that the complexity of the fracture network is related to the preexisting cracks and may be more closely related to the microstructure of shale specimen.
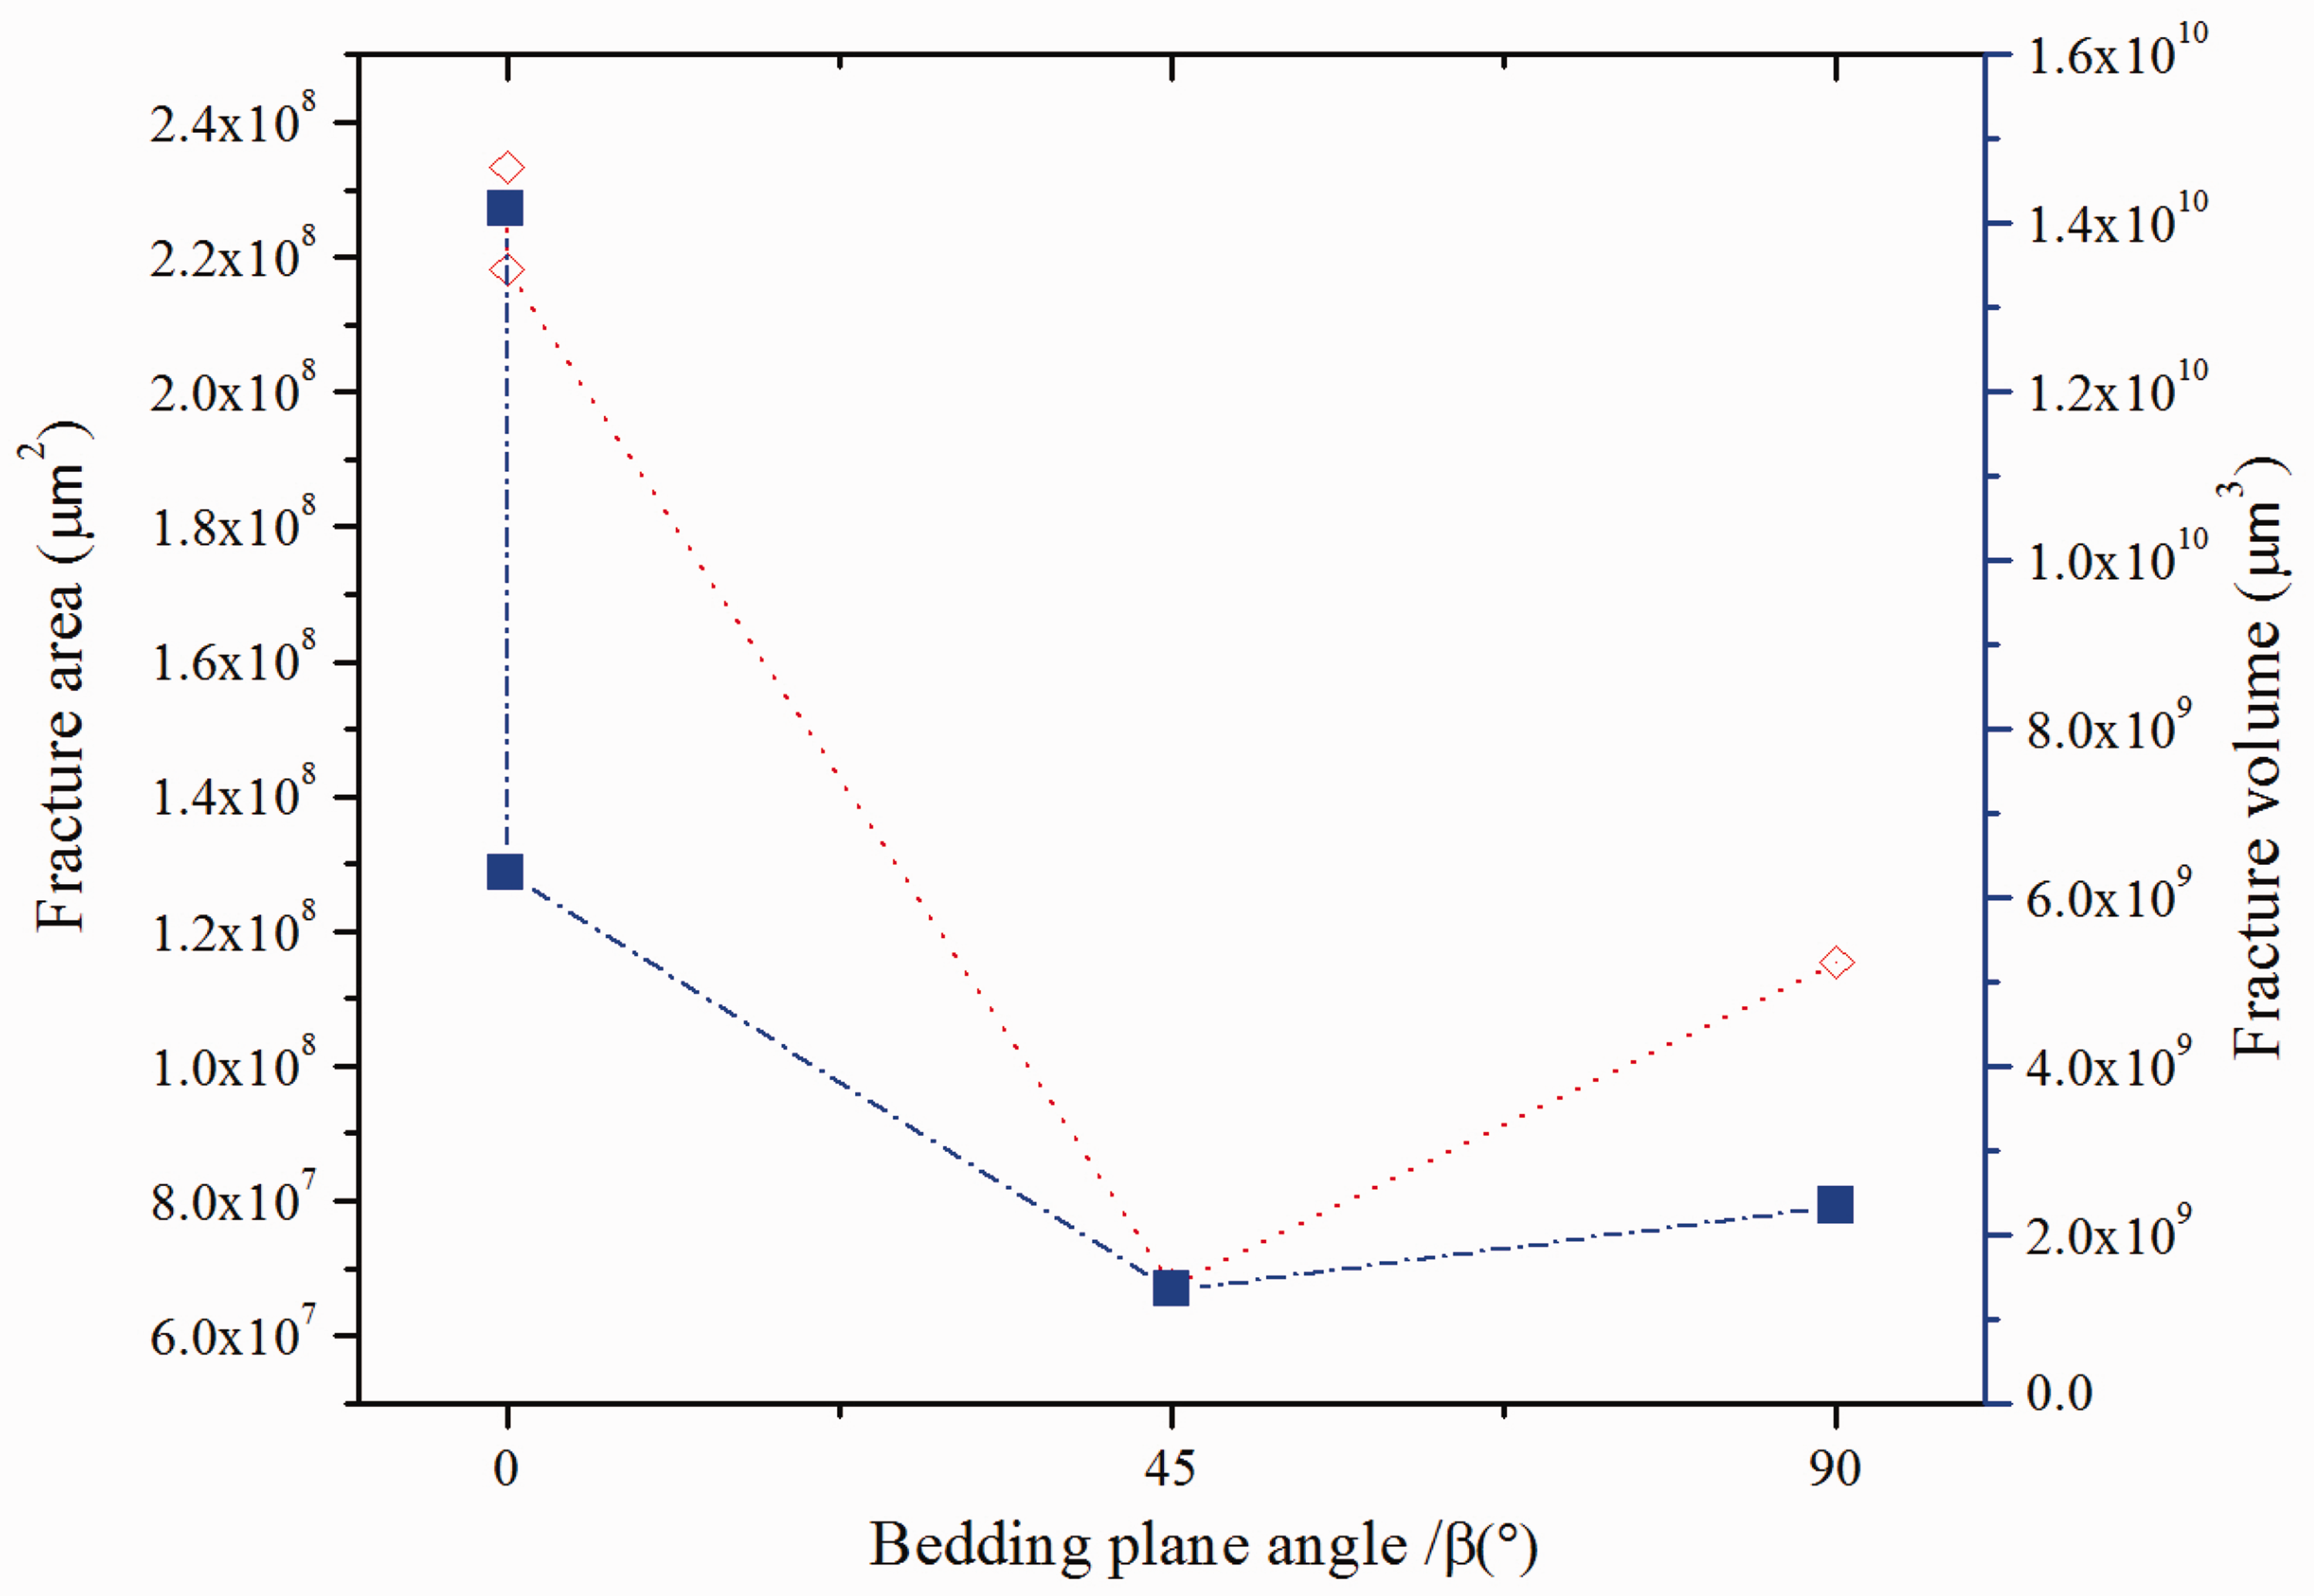
Figure 6 shows the change in the fracture volume and fracture area with the increase in load. We can see that the fracture volume and fracture area increased with the strengthening of the deformation. Before the occurrence of macroscopic cracks, the fracture volume and fracture area in the sample stable grew with the increasing load. The growth rate of the fracture volume and fracture area was low and was the lowest at β = 45°. The initiation and propagation of fractures occur evenly in the shale (Figure 5). The macroscopic cracking led to a sharp increase in the fracture volume and fracture area; both qlc7 and ht exhibited the fastest growth. The preexisting fracture volume of the four samples descended in the following order: by2, by5, ht, and qlc7; the total volume of the fracture network descended in the following order: by2, ht, qlc7, and by5. The minimum fracture area and fracture volume were observed at an approximately 45° loading orientation (Figure 7). This may be because most microcracks became closed under compressive conditions, indicating that the total volume and total area of the fracture network were greatly affected by the bedding plane angle. Compared with the other three samples, the crack network of sample qlc7 had the lowest degree of complexity, possibly because sample qlc7 had the smallest specific surface area (Table 1) and micro and nanocracks were not developed. These results indicate that the degree of complexity of the fracture network was affected by the microstructure of the shale sample.
Changes in the fracture volume and fracture area at different deformation stages or scan points. Summary of the fracture volume and fracture area at different bedding angles.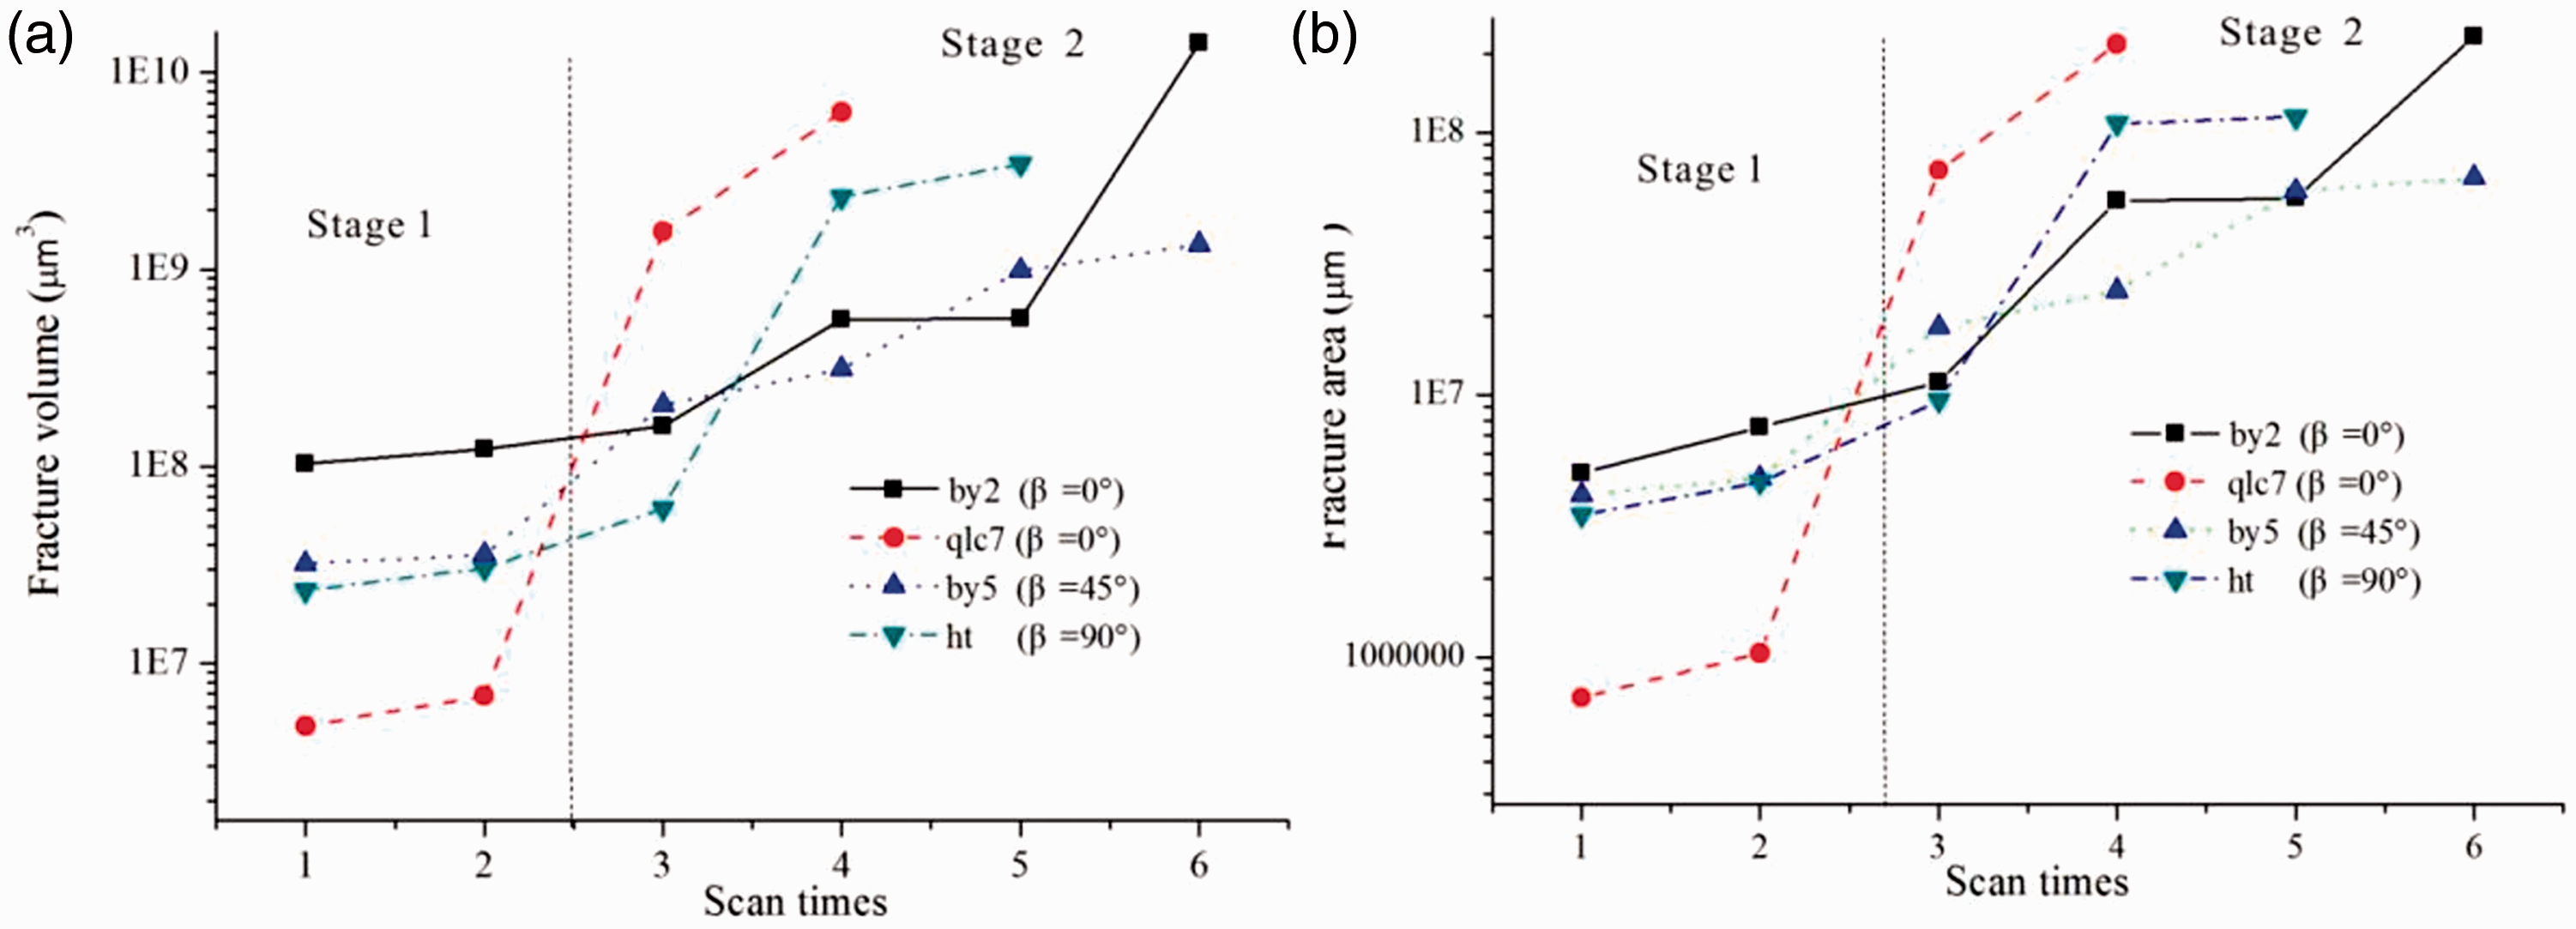
To investigate the possible effects of the microstructures on the crack propagation of shale, X-ray fine scanning was performed on the failed specimens (by5 and its inner small area) (Figure 8). Compared with Figure 5, Figure 8(a) shows that the crack network of the by5 sample was more complex, and its microcracks were more developed. Due to the ability of pyrite to strongly absorb X-rays, bright pots appeared in the CT images (Figure 8(a) marked in yellow). The pyrite grains were scattered or formed aggregates. The pyrite nodules prevented propagation of the microcracks or changed the crack formation direction, while the fine grains did not have any effect on the microcrack growth (Figure 8, yellow pots). It has been reported that in shale, pyrite particles affect the crack growth by acting as nuclei or incumbrances (Debecker and Vervoort 2009; Kobchenko et al., 2011). The dominant geometry of the fracture process is not definitively correlated with the structure and bulk content of the pyrite within shale (Cała et al., 2016). Under compressive conditions, the shale samples formed cracks, and the microscopic pore structure changed. The density of the micropores and microcracks was high near the dominant cracks (Figure 8(b)) and decreased as the distance increased from the central dominant cracks. Figure 9(d) shows that the local pore fracture network of sample by5 was always well networked. The quantitative analysis shows that the porosity was 14.88% (Figure 8(b)).
Three-dimensional fracture network of by5 (the cracks are marked in green and pyrite grains are marked in yellow); (b)–(d) X-ray CT image, vertical cross-section image, and horizontal image (the cylinders are approximately 400 µm in diameter and 600 µm high); (e)–(g) 3D pore fracture network, vertical image, and horizontal image (the fractures are marked in orange and pores are marked in blue). CT: computed tomography. SEM images of the surface of the rock fragments from shale specimens. SEM: scanning electron microscopy.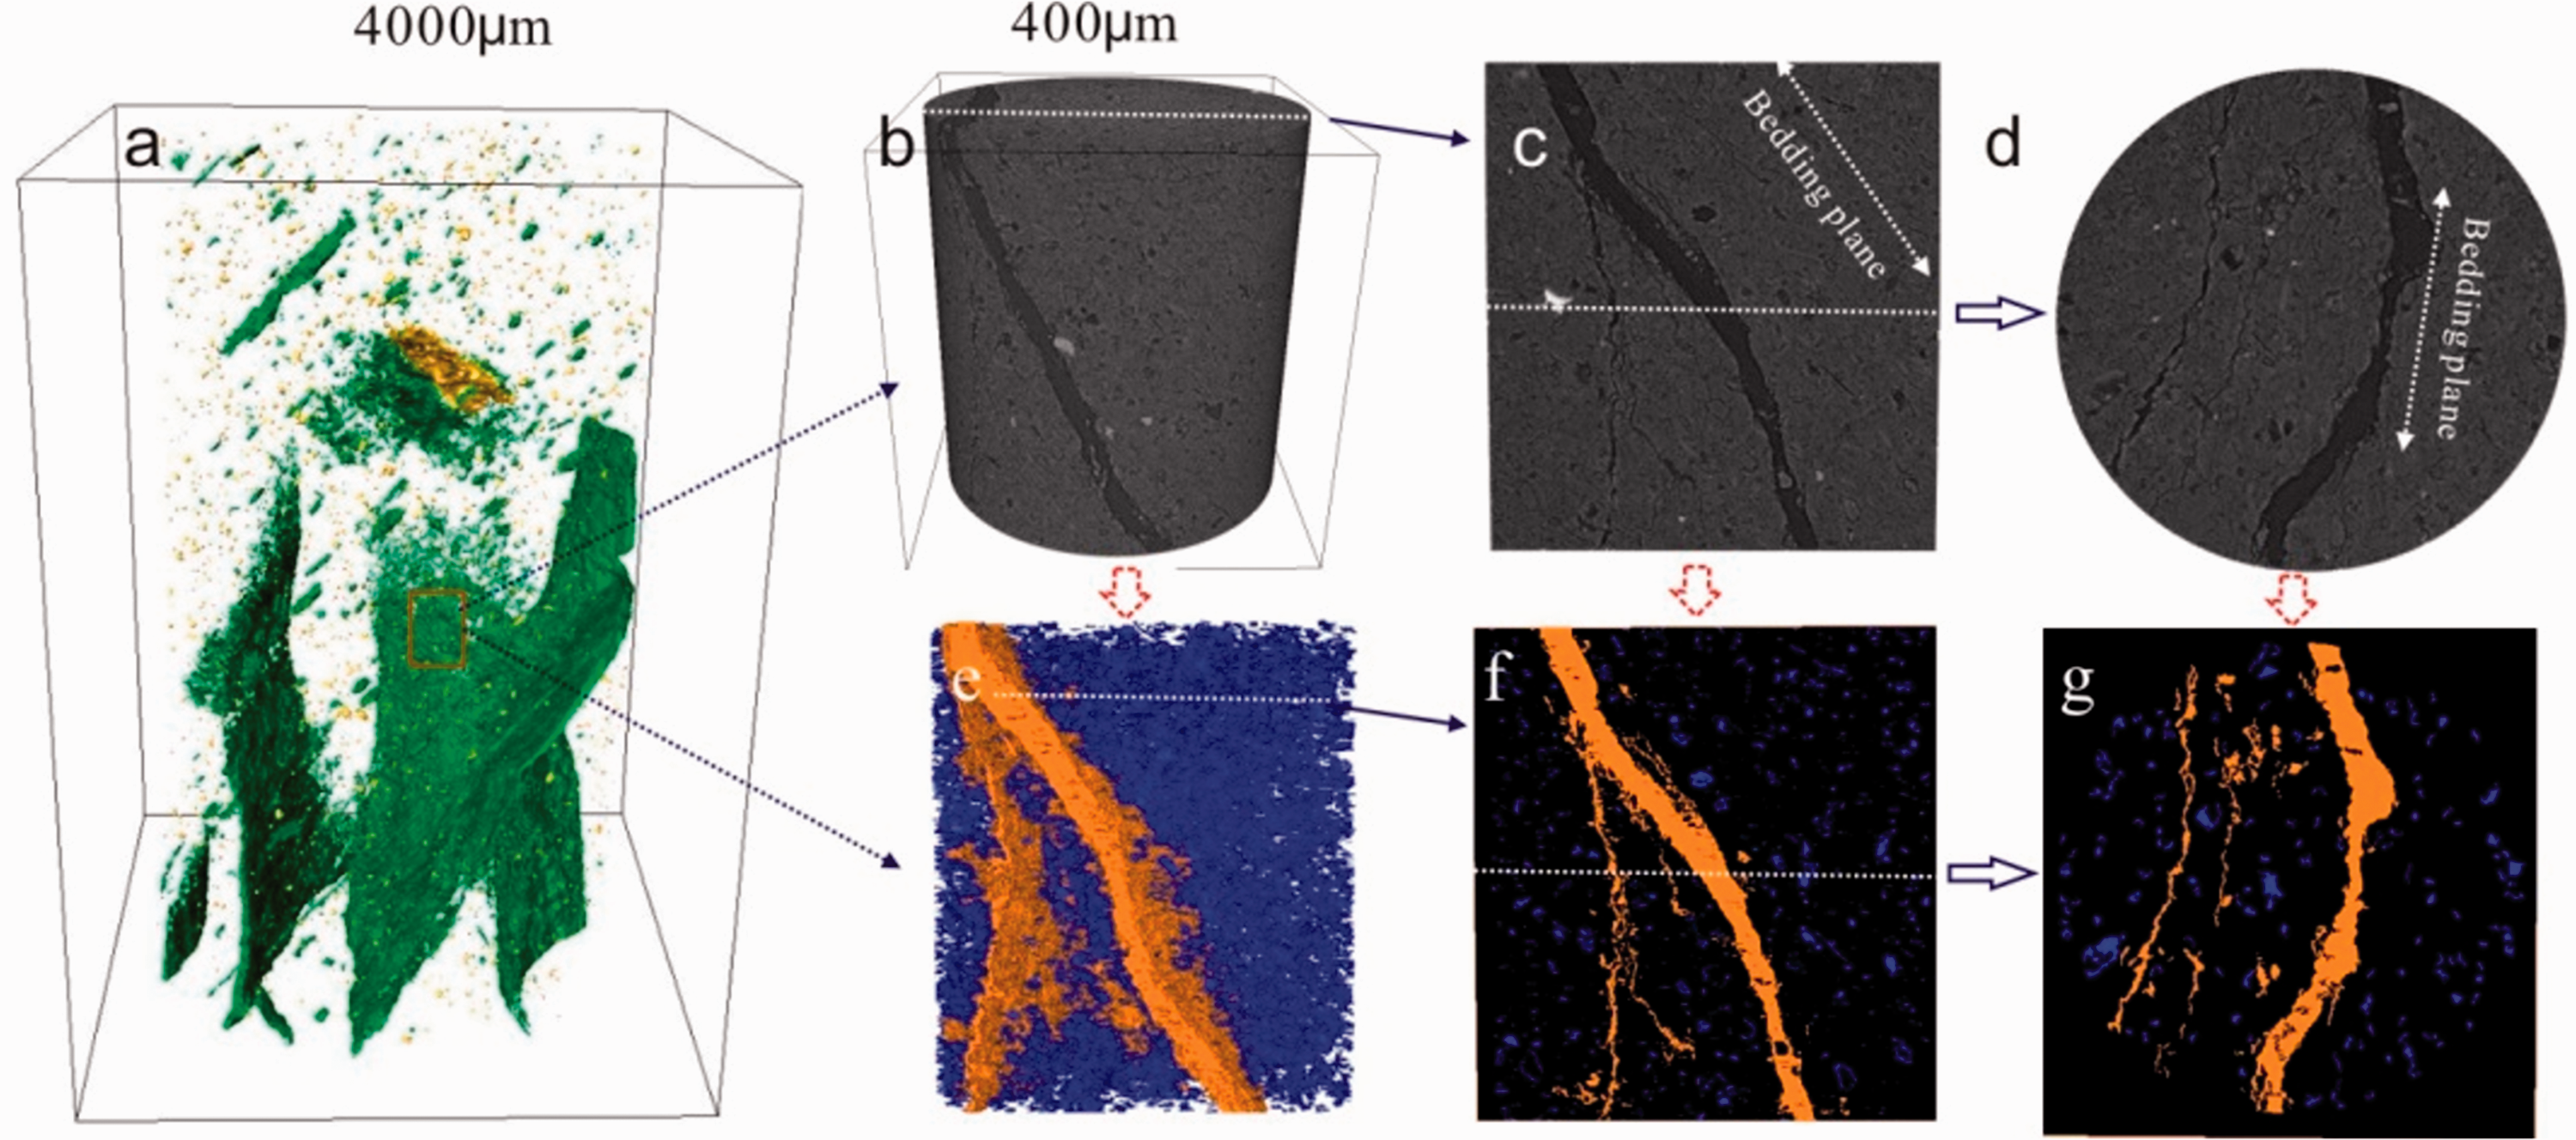
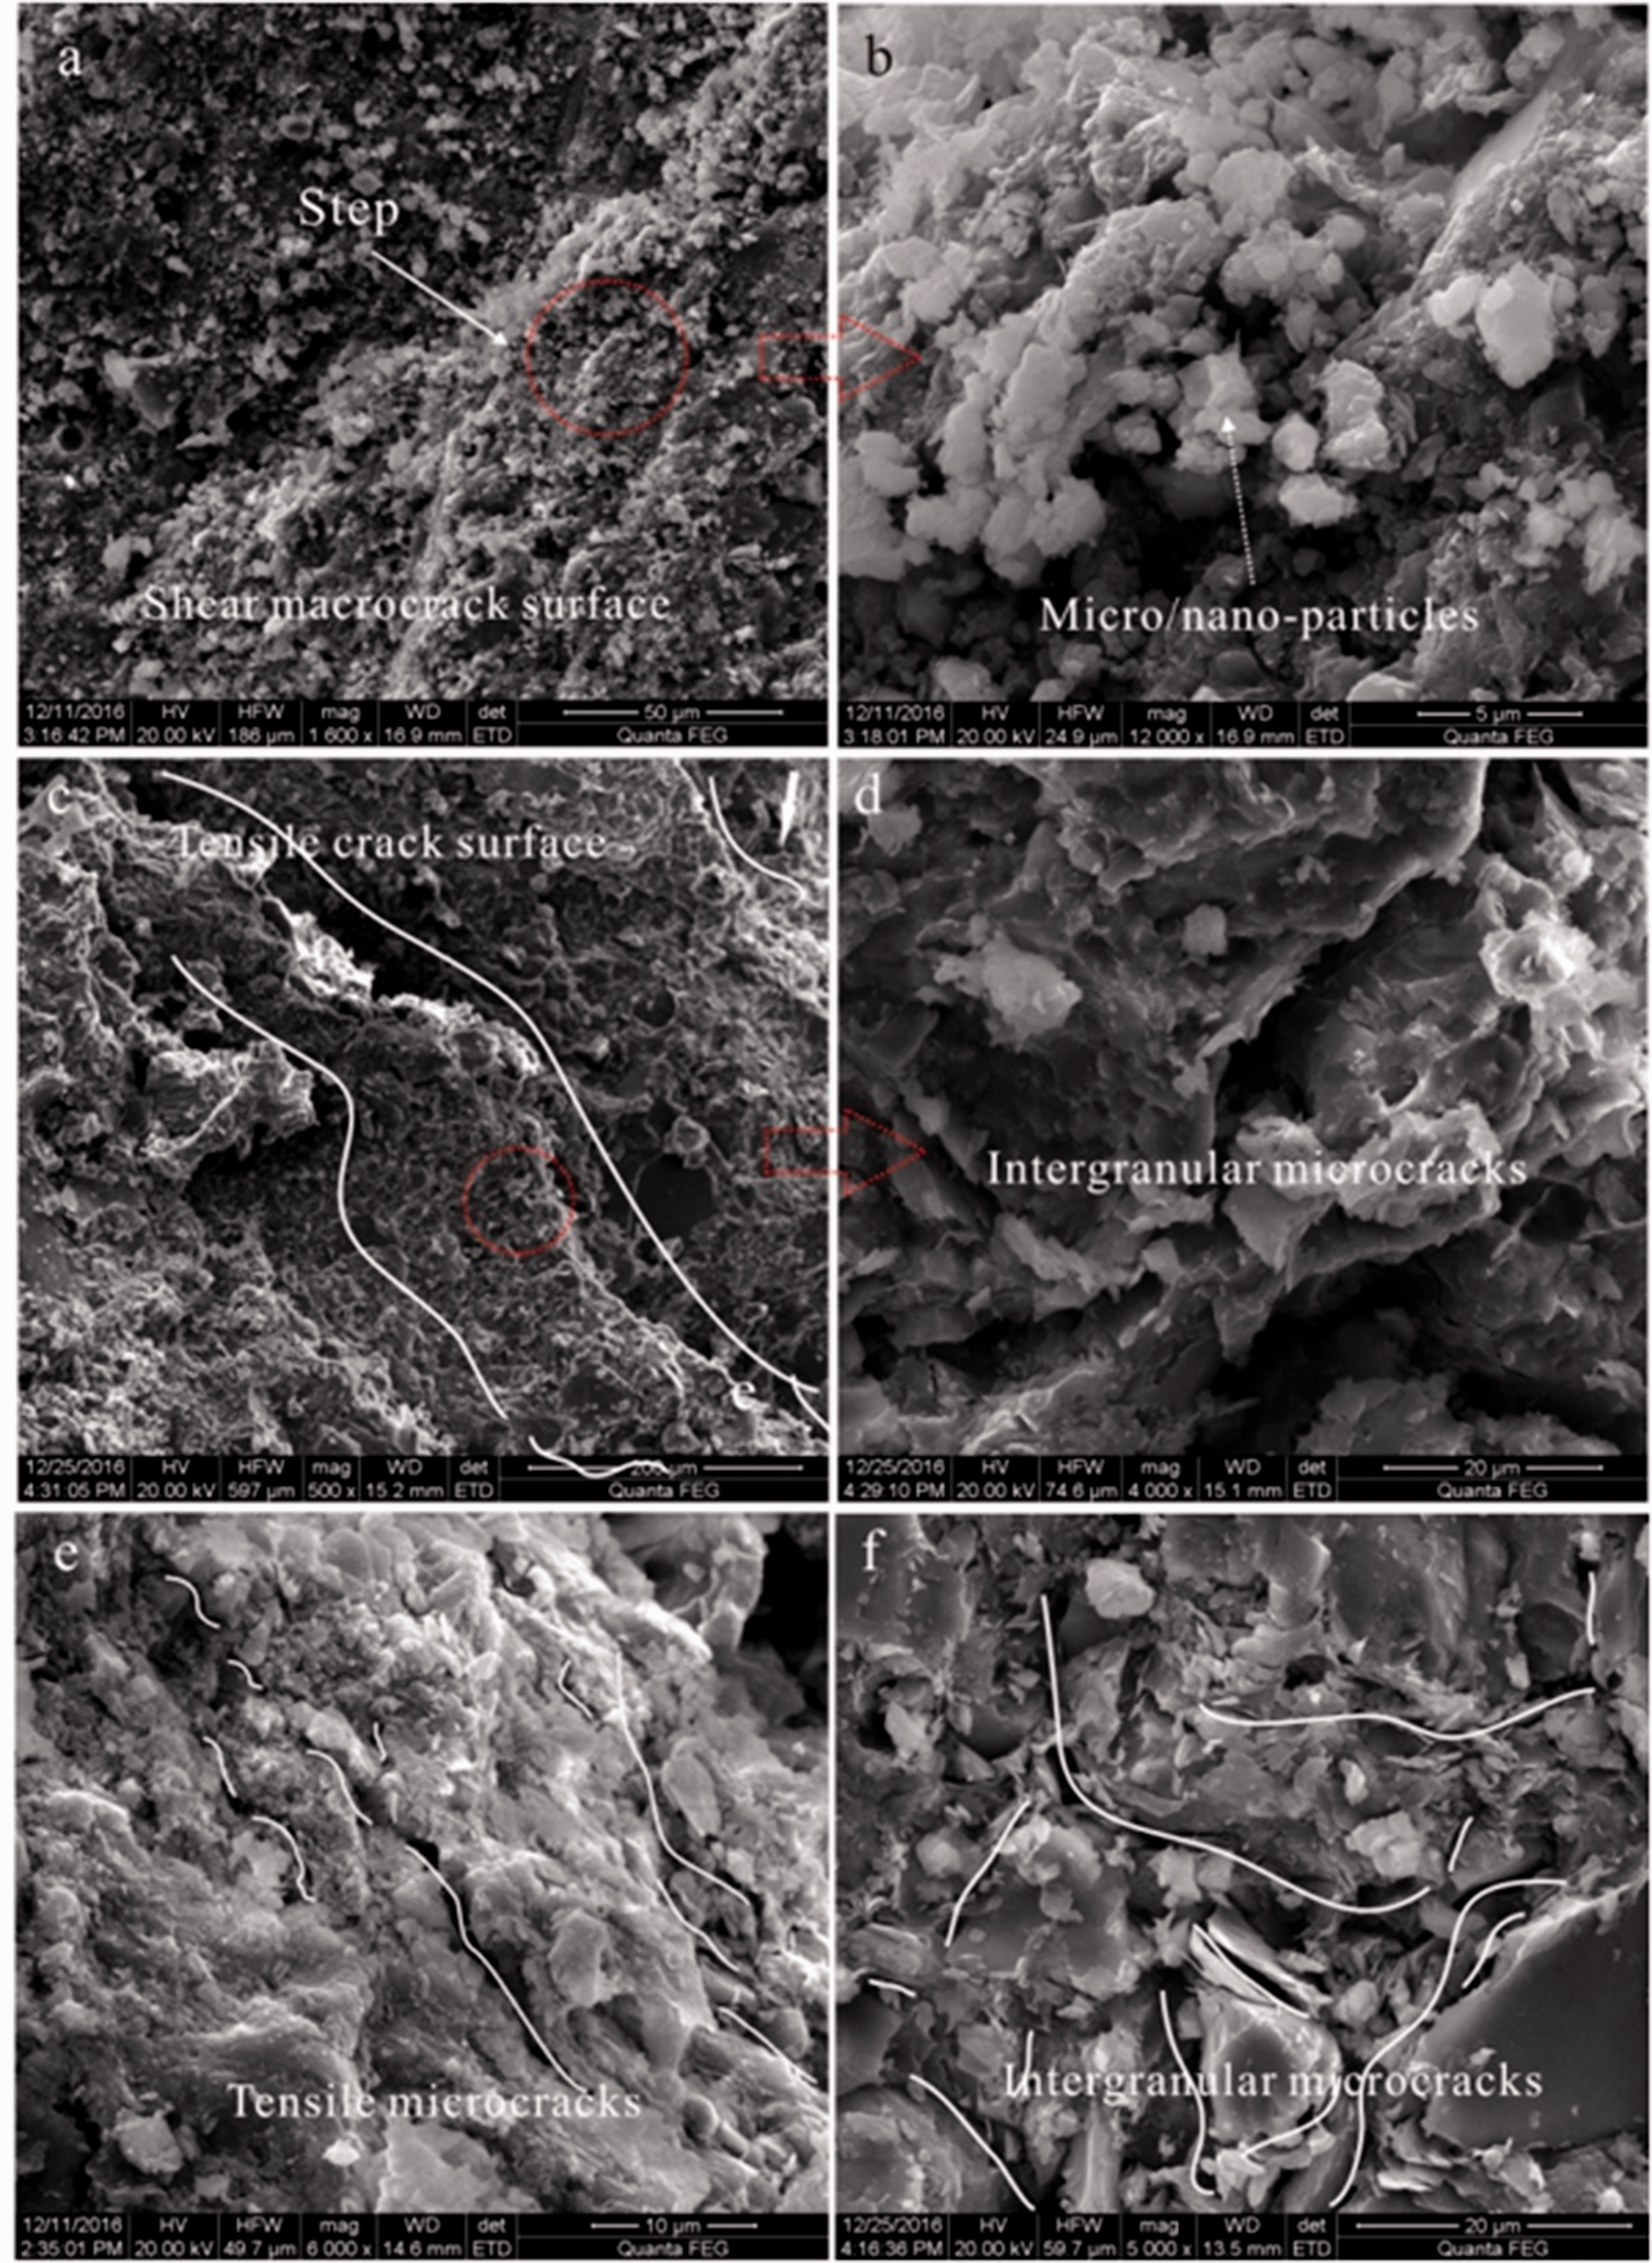
Figure 8(c) to (f) shows that the newly formed microcracks did not absolutely coincide with the bedding plane of the sample and the geometry of the microcrack plane was very complex. Sufian and Russell (2013) suggested that the microstructures of shale samples, such as their pore size distribution, shape characteristics, and orientation distribution, change during loading (Sufian and Russell, 2013). These results indicated that the initiation and propagation of microcracks are influenced by the presence of microstructures in specimens. Under compressive conditions, the heterogeneous microstructures of the rocks induced inhomogeneity in the stress distribution at the grain scale. The cracking process was closely related to the microstructures of the specimens.
Micromechanism of the failure process
Microscopic observations of fractures
SEM micrographs of the fracture surfaces of the failed Longmaxi shale specimens tested under uniaxial compressive loading are shown in Figure 9. The observation of the failed specimens using SEM showed that the massive amounts of micro/nano-particles and scratches were produced on the surface of the macroscopic cracks (Figure 9(a) and (b)) indicating that most of the macroscopic cracks were shear cracks. Figure 9(c) and (d) presents SEM images of the tensile crack. Microscopic observations of the failed specimens indicated that macroscopic tensile cracks were generated along the bedding planes, but the number was small. The number of macro-tensile cracks was less than that of the shear cracks, and the macro-tensile crack did not penetrate through the entire sample. A large number of observations showed that most of the microcracks were tensile. The density of the tensile microcracks was greatest near the macroscopic shear fractures (Figure 9(e)), which decreased as the distance from the central dominant cracks increased. In actually, various types of microcracks were developed during compressive loading, such as tensile microcracks, mixture microcracks, and shear microcracks. Figure 9(f) shows a complex micro crack network in the stiff layer of sample qlc7. Breakage and cleavage mostly occurred in the cementations of mineral grains, almost all grain boundaries cracked along their entire length. These results indicate that not all microcracks were tensile under the compressive stress conditions.
Due to the sheet structures of their clay platelets, minerals and pore spaces in shale have a strong preferred orientation within the bedding plane. Microcracks are also most often observed parallel to the weak plane. However, some microcrack families can also be oriented perpendicular to the bedding plane. The initiation and propagation of the microcracks was associated with the bedding plane angle (Audrey et al., 2016). When the inclination of the bedding plane of the shale was 0°, more microcracks were involved in initiation and propagation. The microcracks parallel to the bedding underwent shear slipping at an inclination of 45°, and tensile microcracks were generated in the vicinity of their tips. At an angle of 90°, the microcracks perpendicular to the bedding plane, as well as a large number of intergranular cracks, underwent tensile expansion, indicating that as the bedding planes became more aligned with the direction of the maximum compressive stress the microcrack initiation propagated more frequently along the bedding planes.
Crack coalescence
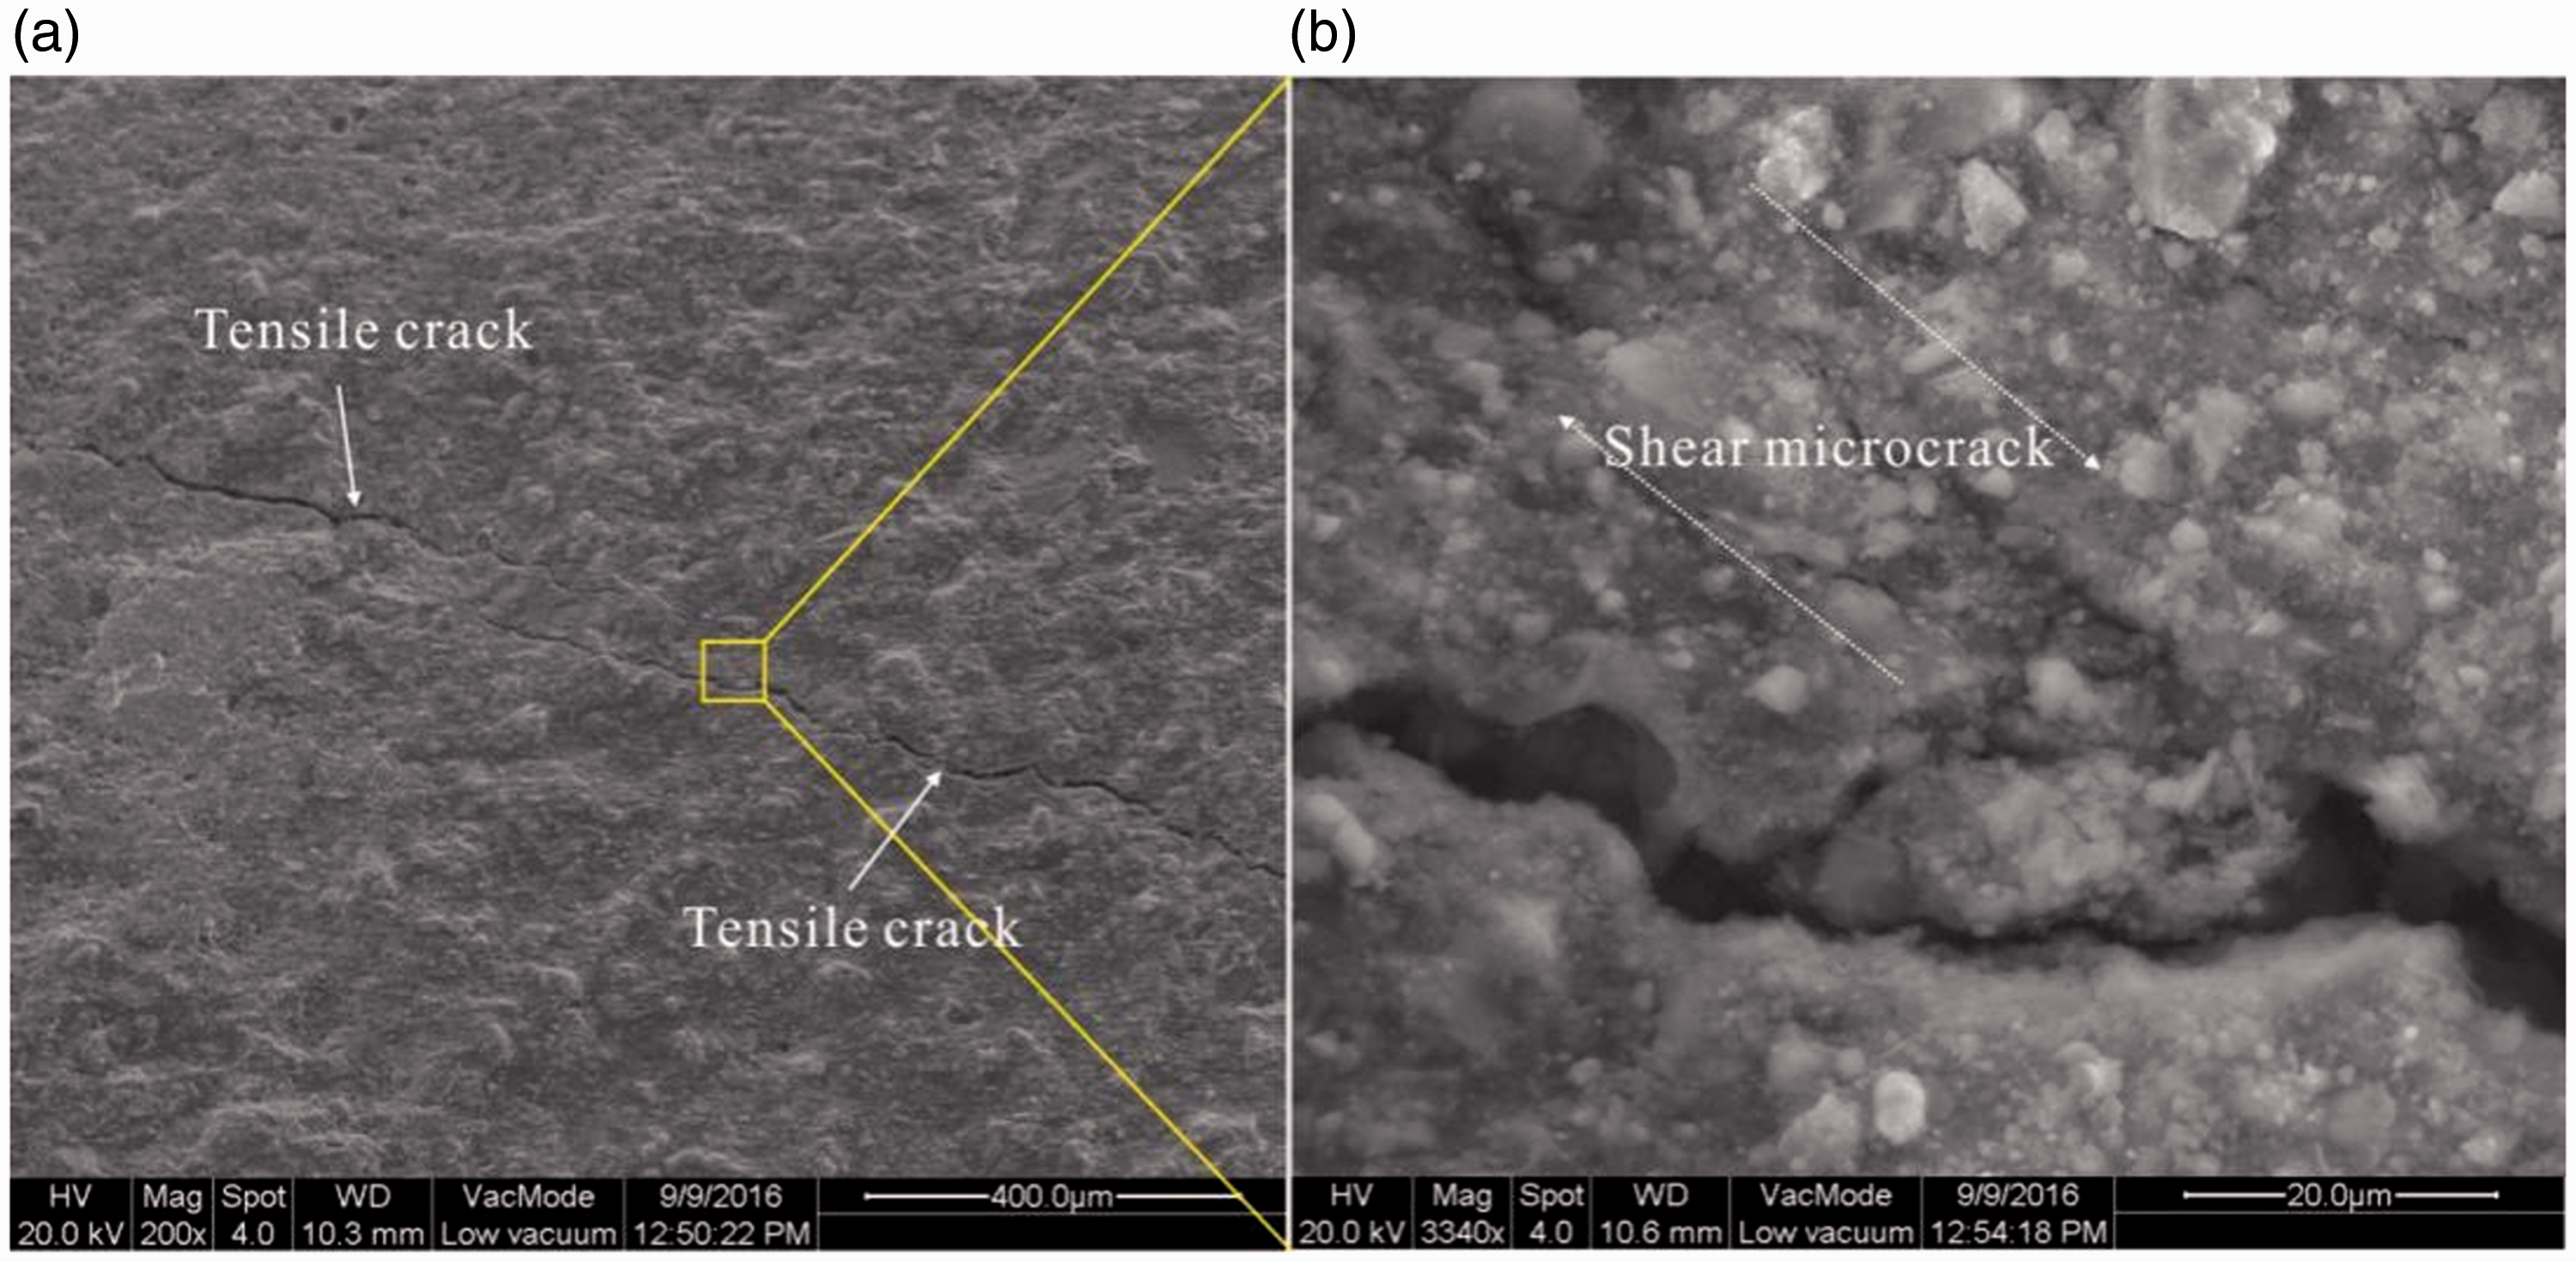
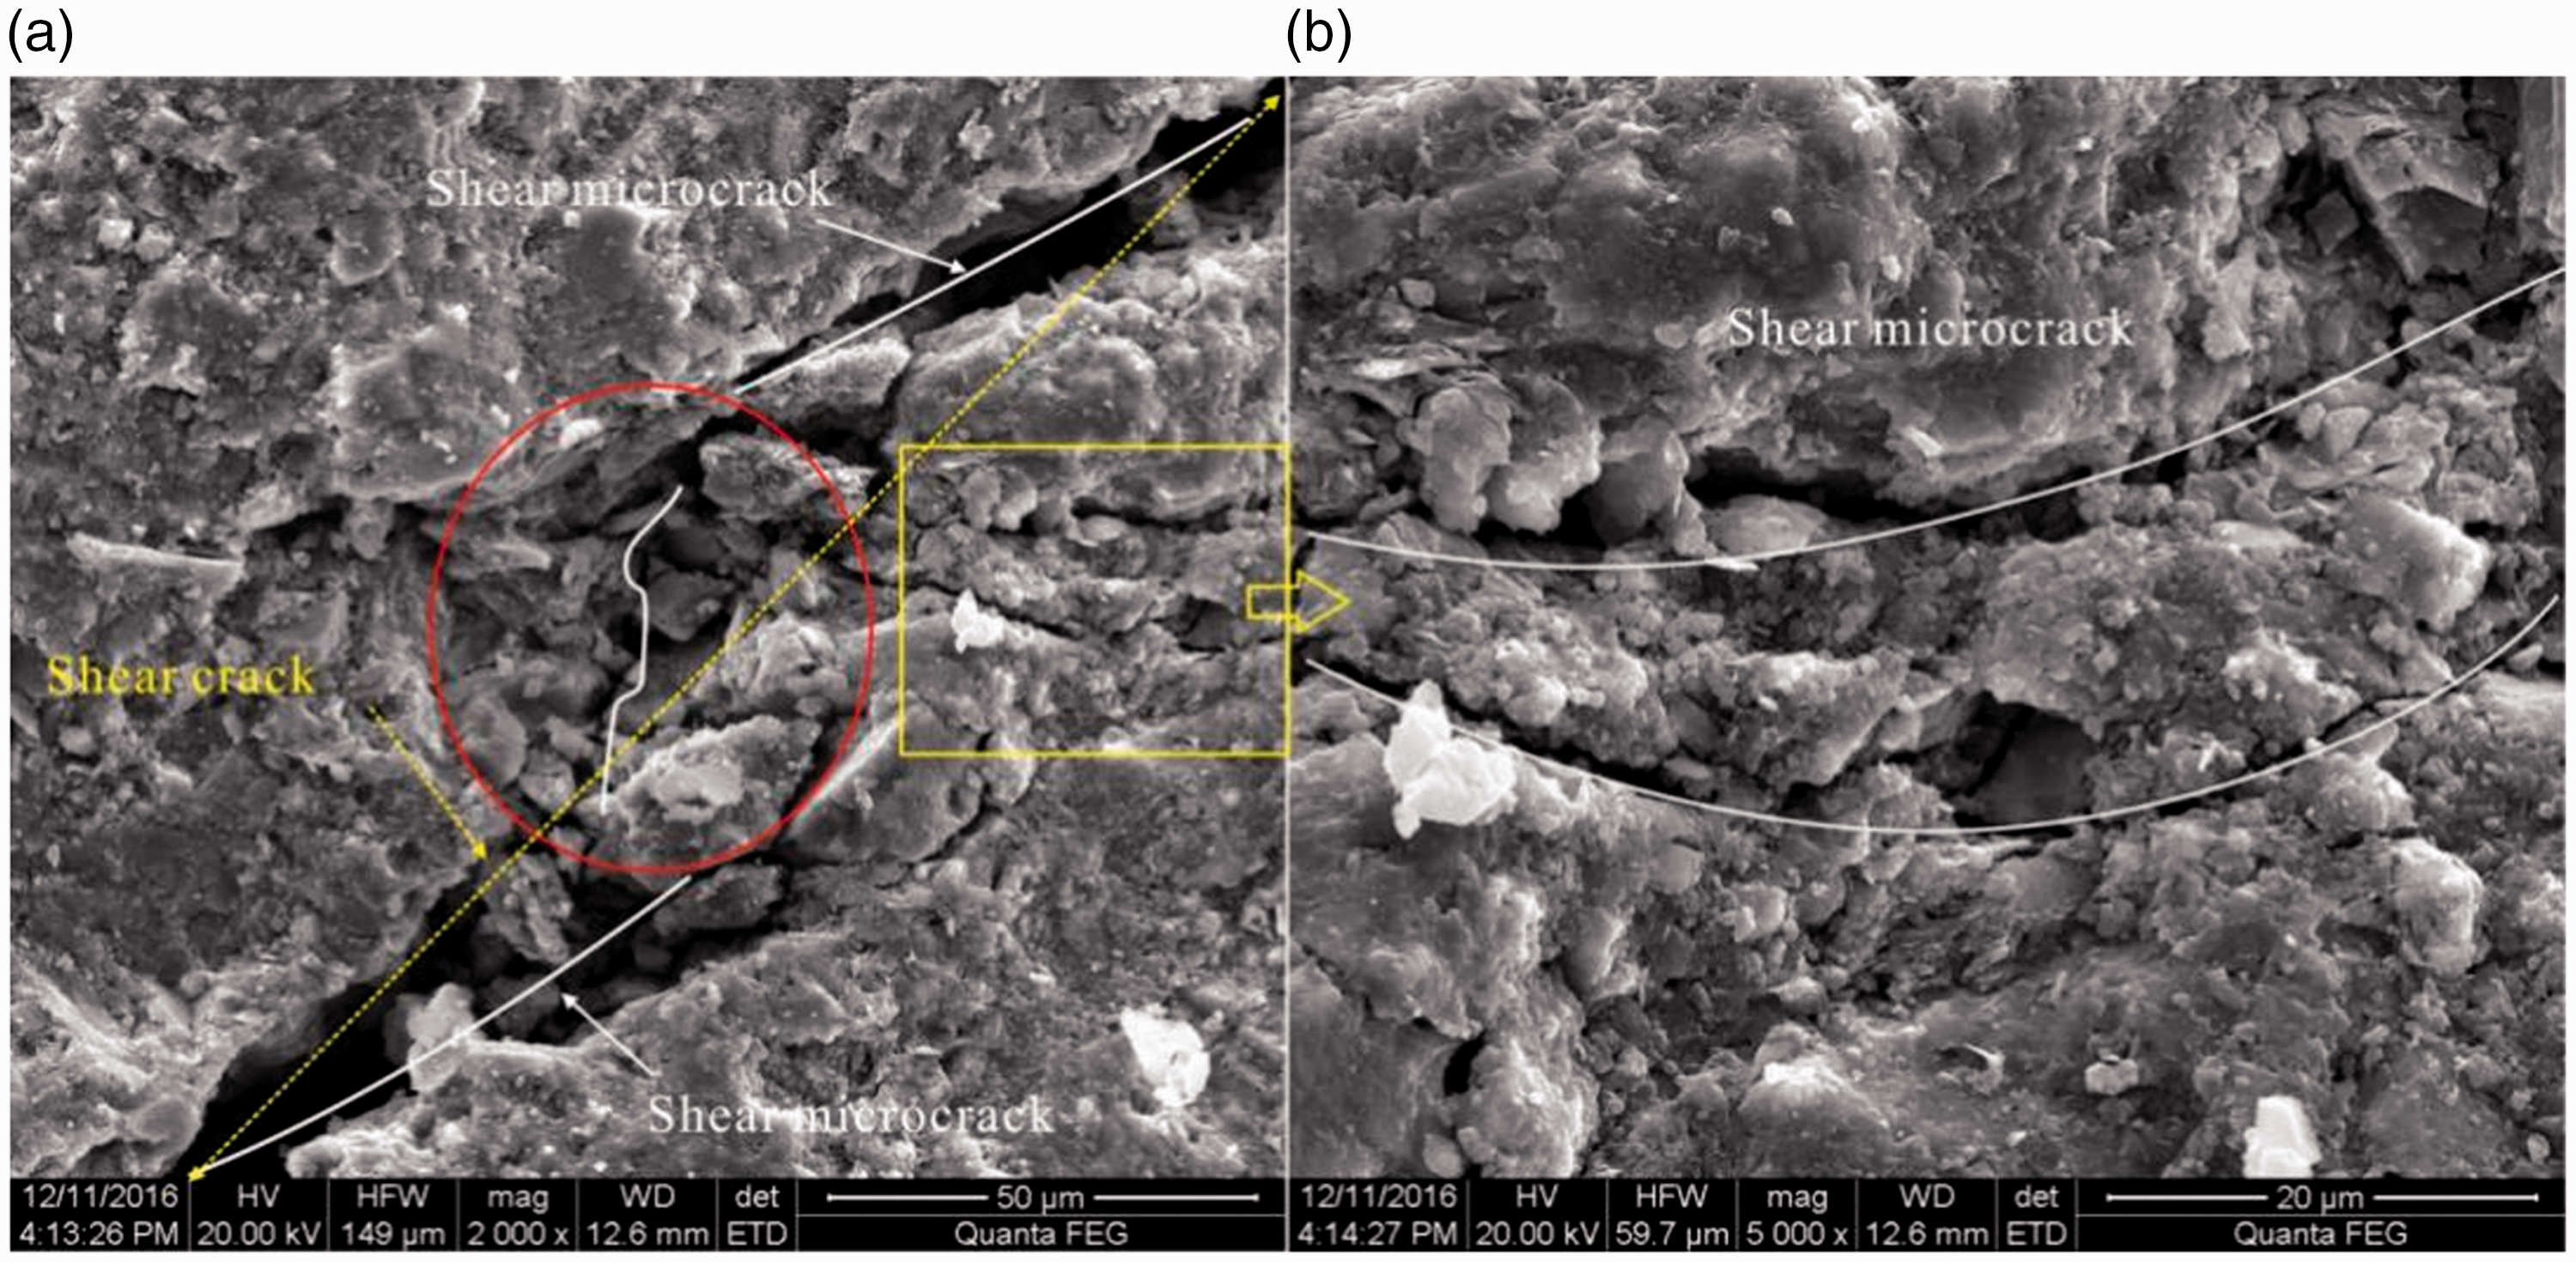
The propagation and coalescence of microcracks caused the rock failure and nonlinear mechanical behavior. The failure mechanism of the rocks strongly depended on the crack coalescence pattern between the preexisting defects (Morgan et al., 2013; Wong et al., 2001). The crack coalescence occurred at different stages of deformation. The crack coalescence occurred at different spatial scales and was heavily influenced by the strength anisotropy at different stages of deformation. On the grain scale, a pair of adjacent intergranular microcracks would dominate the process of coalescence during the initial stage of deformation. The coalescence was tensile with a lower value of coalescence stress and formed smaller linear cracks along the bedding plane. With the increase in the loading, the length and area of the linear cracks increased. This kind of coalescence extensively developed within the rock. At a slightly larger scale, the crack coalescence was categorized into two types: (i) The tensile coalescence typically began with a linear crack, which consisted of two adjacent intergranular fractures that, in some cases, could be seen propagating from one intergranular fracture to the other. The linear microcracks occurred along a straight line and expanded diffusively into larger microcracks (Figure 10(b)). (ii) Shear coalescence typically began with diffusion along a linear crack, which was adjacent to but not on a straight line (Figure 11(a)). With the further increase in loading, shear deformation of the microcracks led to the connection of two microcracks (Figure 11(b)). At the rock mass level, the coalescence mode was shear. This type of shear coalescence led to the formation of macroscopic cracks and the overall rupture of the shale sample (Figure 12). The shear coalescence generally led to the breakdown and deformation of the mineral particles, the formation of powdered particles (Figure 9(a) and (b)), and the formation of shear microcracks (Figure 12(b)).
ESEM images of the microcracks: (a) intergranular regions or pores and (b) sublinear tensile microcrack. ESEM: environmental scanning electron microscopy. ESEM images of the cracks and the coalescence patterns of the tensile cracks. ESEM: environmental scanning electron microscopy. SEM images of cracks and the coalescence patterns of the shear cracks. SEM: scanning electron microscopy.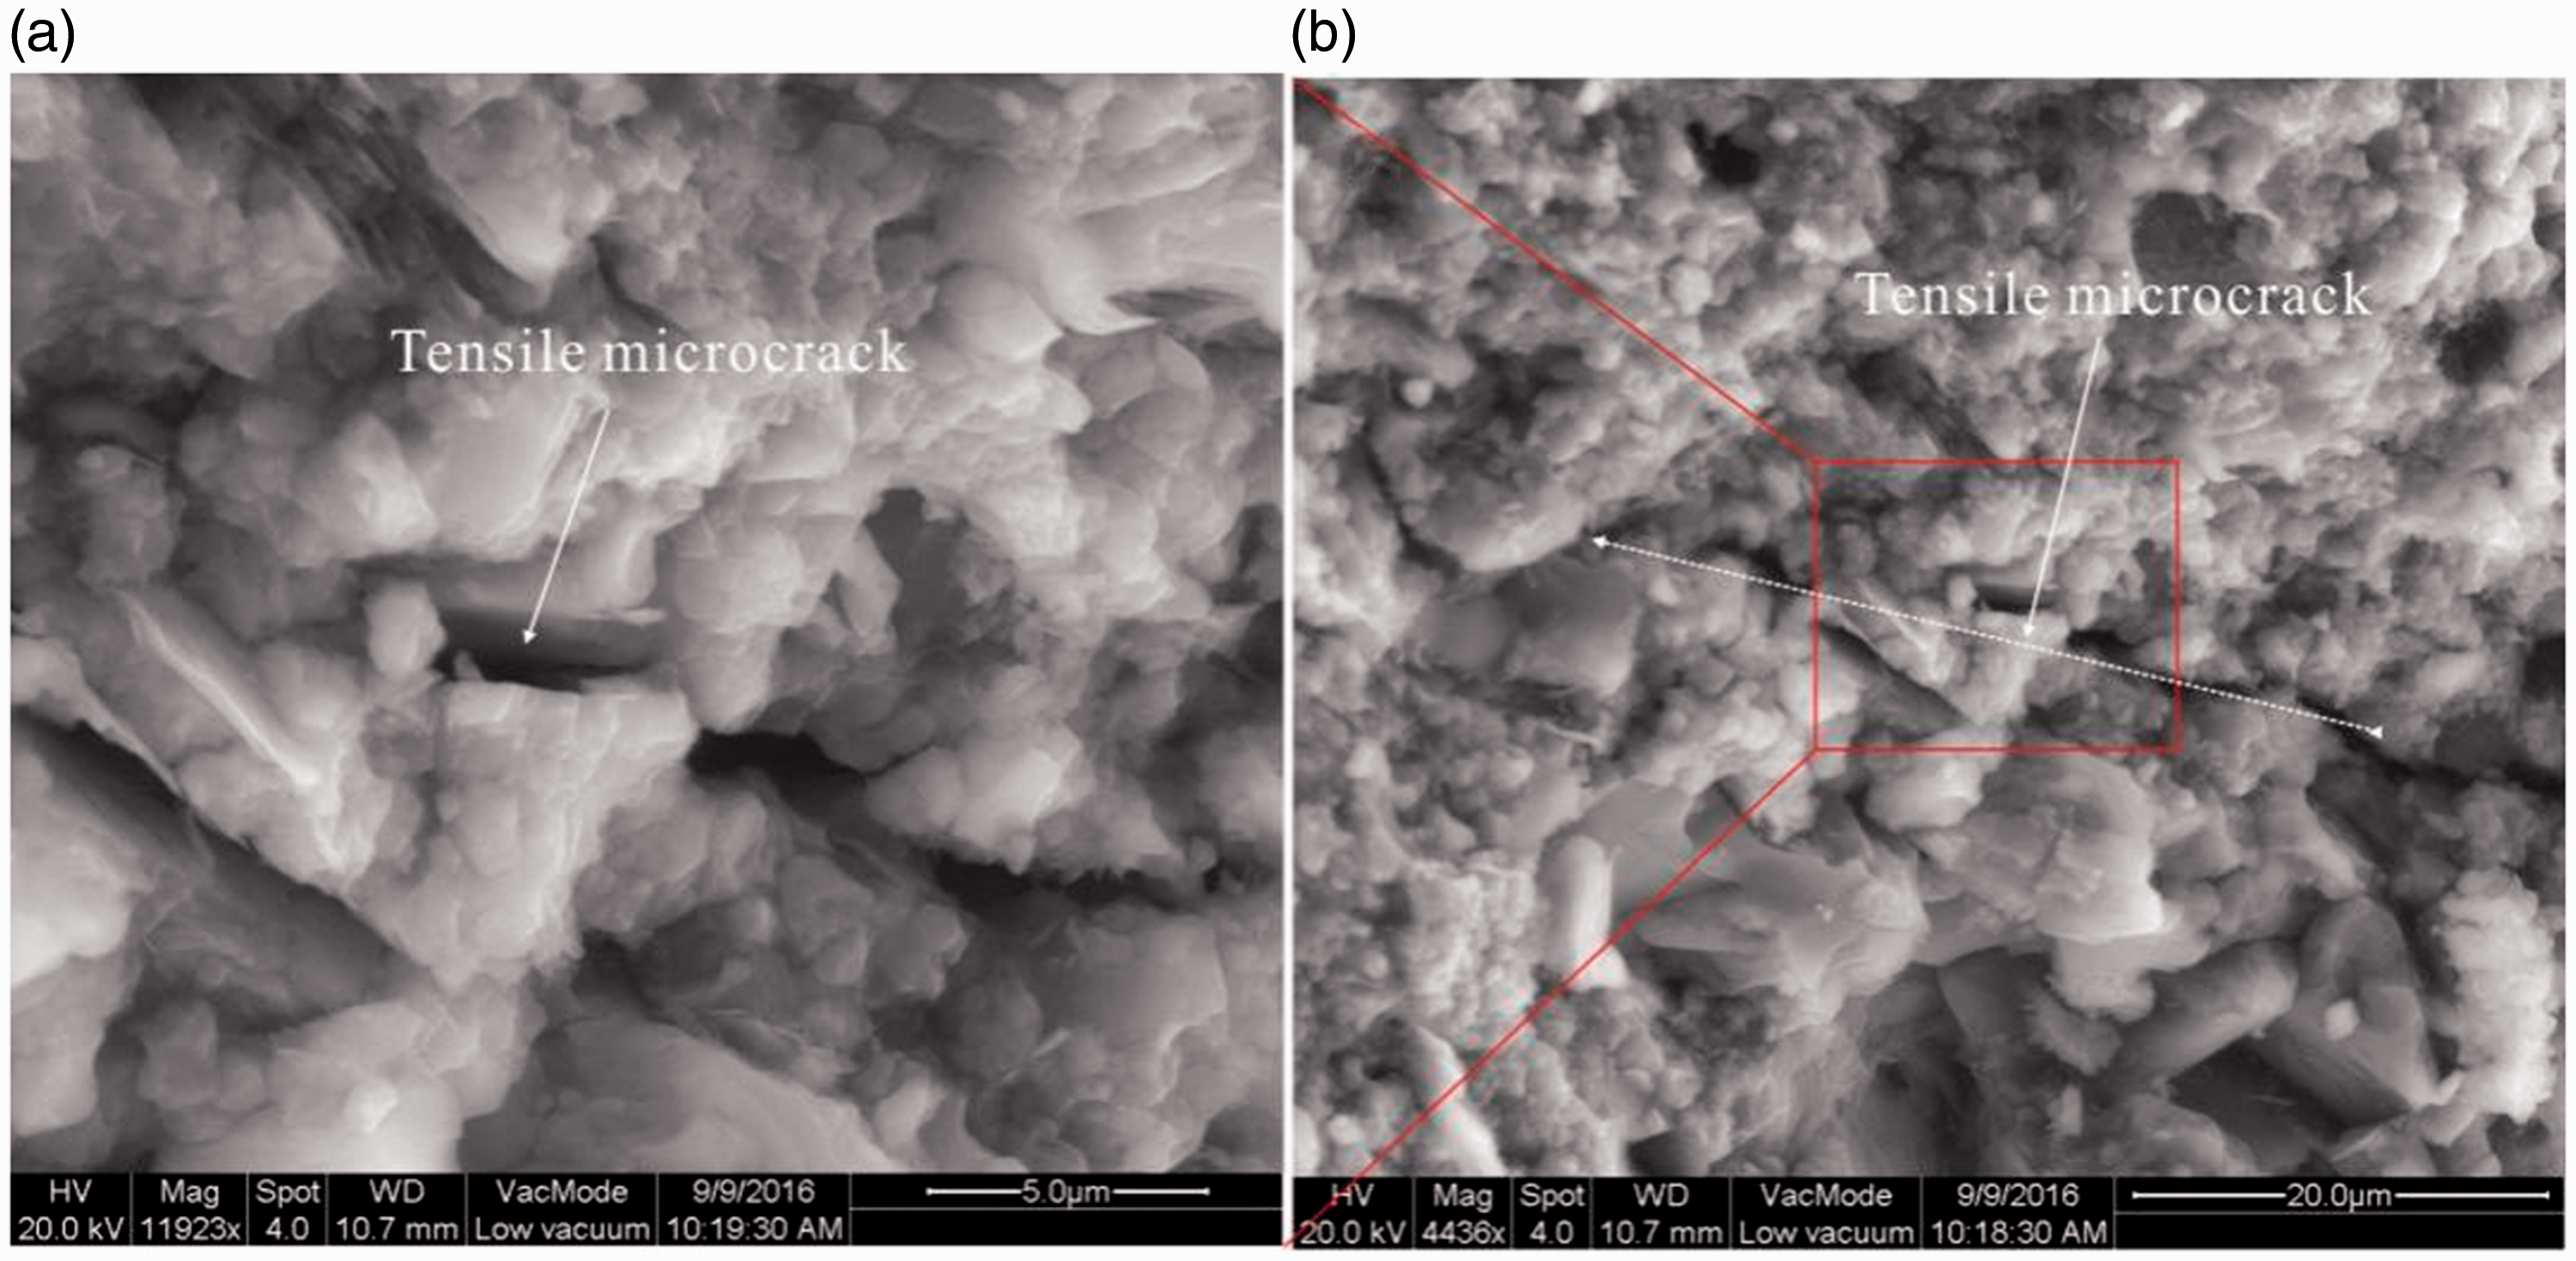
Conclusion
In the present study, a testing device that utilized an X-ray microCT scanner measured layered shale specimens, which enabled scanning during the loading operation of uniaxial compressive tests. SEM/ESEN observation tests were performed on the failed specimens; the main goal was to determine the developmental characteristics of the fracture surface. The main conclusions of this study are as follows:
The use of the uniaxial compressive test apparatus along with the X-ray microCT scanner made it possible to visualize and quantify the cracking process and crack generation in layered shale specimens. The cracking process of the anisotropic shale was significantly affected by the bedding plane angle and microstructure of the shale; the initiation and propagation of the microcracks was controlled by the bedding plane of the shale samples, especially during the initial stages of deformation (stage 1). Quantitative analyses indicated that a decreased failure load was observed along the inclined loading direction with a minimum at a loading direction, as well as a minimum fracture surface and fracture volume in the failed specimens, of approximately 45°. Most of the microcracks were tensile. Tensile cracking that started at the grain scale was the primary mechanism of rupture for the specimens. Most of the cracking occurred before the stress strength appeared to be intergranular. The coalescence patterns included both tensile and shear regions. The crack coalescence occurred at different spatial scales and stages of deformation.
Footnotes
Acknowledgments
We are grateful to Guoliang Li for his help during the X-ray microCT experiments.
Declaration of conflicting interests
The author(s) declared no potential conflicts of interest with respect to the research, authorship, and/or publication of this article.
Funding
The author(s) disclosed receipt of the following financial support for the research, authorship and/or publication of this article: The financial support from the China Geological Survey program (No. 121201104000150006) and National Science Foundation of China (No. 41572123) is gratefully acknowledged.