
Abstract
Ethanol as the promising alternative fuel in Indonesia fights against cost competitiveness with fossil fuel due to low productivity using a conventional batch process. Therefore, the production of ethanol employing continuous fermentation process in which it acquires higher productivity was investigated. The investigation was done using uncontrolled continuous process in the integrated aerobic–anaerobic baffled reactor for 168–340 h at 30℃ and medium pH of 4–5. The substrate of sugarcane molasses–water was varied in three concentrations, i.e. 20, 30, and 45% w/w. The productivity was indicated by ethanol concentration in the effluent stream and sugar to ethanol conversion (fermentation efficiency). The result showed that average ethanol concentration of 20, 30, and 45% molasses was 50.43, 62.70, and 57.17 g/l, respectively. Further, the fermentation efficiencies were 87.2, 80.3, and 46.7% for each of the molasses concentrations. The productivity can be monitored as follows: 1.75 g/l h (20% molasses), 2.31 g/l h (30% molasses), and 2.01 (45% molasses). Additionally, the steadiness of the process for long process duration was observed, and the result showed that the ethanol productivity was raised from 2.31 g/l h (168 h) to 2.71 g/l h (340 h).
Keywords
Introduction
The economic and population growth predicted that the energy demand would continue to increase three times in 2035 (Pirard, 2016). As net oil importer country since 2004, Indonesia crude oil supplies rely strongly on import (Hikam, 2014). This fact is practically unfavorable due to price swing in petroleum process could bring economic instability (Jo, 2014). As a result, the concern to curtail the oils import is continuously growing.
Some alternative renewable fuels have been developed in Indonesia, i.e. bio-gas, syn-gas, bio-diesel, ethanol, etc. However, ethanol has greater potential as one of the most beneficial alternative fuels because of its economic and environmental benefit. Ethanol can be obtained by the fermentation process of sugar from agricultural stocks or carbon-rich industrial waste (e.g. molasses) (Zambare and Christopher, 2012). Indonesia allocates ethanol in the national energy use in 2025 by 5% in line with the effort to reduce oil dependency (Legowo, 2007). Unfortunately, the implementation of ethanol meets a significant obstacle. Because of technology complexity, the average final price of ethanol in Indonesia is about four times the price of gasoline. It is a problem in developing country because people are reluctant to spend more money for a less expensive option is still available (price sensitiveness) (Nguyen and Prince, 1996). Consequently, decreasing ethanol price by optimizing the process becomes critical.
In ethanol production, the election of the fermentation process is essential to define the feasibility of the production. The configuration must provide an ideal condition that leads to high productivity (ethanol yield through high conversion of sugars) with low capital and operating cost. In Indonesia, a batch process is the most utilized technology. The batch process evidently reaches high fermentation efficiency usually 90–95% of theoretical yield with the final ethanol concentration of 10–16% (v/v) (Lin and Tanaka, 2005). However, the batch process is frequently troubled by substrate inhibition or catabolic repression (Çaylak and Sukan, 1998). In catabolic repression, the enzymes are inactivated due to higher sugar concentration in the initial step of the process to cause unbearable osmotic pressure. To mitigate this problem, the control toward sugar concentration inside the reactor comes to be important. It can be achieved by utilizing the semibatch process. In this process, the substrate concentration is maintained low but sufficient to reach high ethanol productivity by continuous addition of sugars and nutrients. However, to achieve this condition, advanced control systems and high-skilled labor are required. It becomes a drawback as it is going to increase the operating and investment cost. Additionally, a significant disadvantage of batch and fed-batch process is long down time between fermentation processes, which result in low overall productivity.
Continuous fermentation process can offer significant benefit in terms of greater productivity (due to long running time and lower downtime), easier maintenance, easier operation control, and lower land requirement (Cardona and Sánchez, 2007). However, this process configuration is less utilized because of low cell density and the difficulty of maintaining high fermentation rate (Cysewski and Wilke, 1978). In continuous process, lower cell density is the result of cells washout because they follow the output product. This condition is undesirable because it decreases productivity directly. Moreover, to replace the lost cells, new culture media is required. Whereas, creating new culture media is time consuming and increases production cost. A possible technology is cell recycle. Portions of the cells in the effluent from the fermenter are separated back using centrifugation, sedimentation, or membrane filtration (Cysewski and Wilke, 1977). In the other problem, the dynamic of fermentation rate is also caused by oxygen concentration. It is reported that low fermentation rate is caused by lack of oxygen. Oxygen can induce fermentation rate by stimulating the growth of Saccharomyces cerevisiae (Cysewski and Wilke, 1976) to maintain cells viability. Thus, proper aeration is essential in the fermentation process.
Addressing two challenges, i.e. cell density and cell viability in this experiment, we developed integrated aerobic–anaerobic baffle reactor (IAABR). IAABR is a modified anaerobic baffle reactor (ABR), which previously known in waste treatment to produce methane (Weiland and Rozzi, 1991). In waste treatment, ABR is known for its ability to disintegrate small particles longitudinally down the reactor (solid retention). The solid retention capability could prevent the decreasing of cell density due to cell washout. Additionally, to maintain cell viability, the aerobic stage is installed in the very first stage of the reactor acting as cell’s regenerator in the case that the cell depletion is found. An extra advantage from IAABR is the existence of baffle would force the liquid creating mixing effect (hydrodynamic). The degree of mixing that occurs within a reactor will strongly influence the extent of contact between substrate and bacteria, thus controlling mass transfer and potential reactor performance (Barber and Stuckey, 1999).
Despite its potential to address ethanol production challenge, there is few working experiment dealing with this reactor to produce ethanol (Cheng et al., 2014). Hence, the objective of this paper is to investigate the performance of IAABR using continuous mode to produce ethanol under various sugar feeding rates. This reactor is also equipped with an aerobic compartment to avoid the depletions of cells.
This experiment used molasses as an established carbon source in ethanol industry. Hence, the process variables can be minimized i.e. IAABR reactor, solely. Further, the result could be directly compared to the existing ethanol plant in Indonesia.
Materials and methods
Yeast strain and inoculum development
Fermiol® (S. cerevisiae strain No DY 7221 DSM collection) was used as a culture starter. It was stored in a cool (5.0–15℃) and dry place. This yeast has the alcohol tolerance of 14% (w/w). Before the experiment started, the microorganism was inoculated through three series of steps. In the first step, 250 ml media that contained 100 g/l Fermiol® was prepared. The composition of media was (in g/l) as follows: yeast extract, 10; glucose, 10; MgSO4, 0.1; NH4Cl, 1.3; CaCl2·H2O, 0.1. The media was sterilized in an autoclave at 121℃ and 1 atm for 30 min. The prepared media was then incubated at 30℃ for 48 h. After 48 h incubation, the starter was adapted to grow in presterilized molasses. This step was developed by transferring the 250 ml media in the previous step to 2250 ml 20% (w/w) molasses solution. The prepared media was then incubated at 30℃ for 48 h. The first and second inoculation steps were incubated using shaker incubator at 100 r/min. For the last step, the S. cerevisiae strains were inoculated into 22.5 l of presterilized 20% (w/w) molasses on the compartment A of the IAABR (Figure 1) equipped with aerator and agitator. The last inoculation also went for 48 h.
Unit of integrated aerobic-anaerobic baffle reactor (IAABR).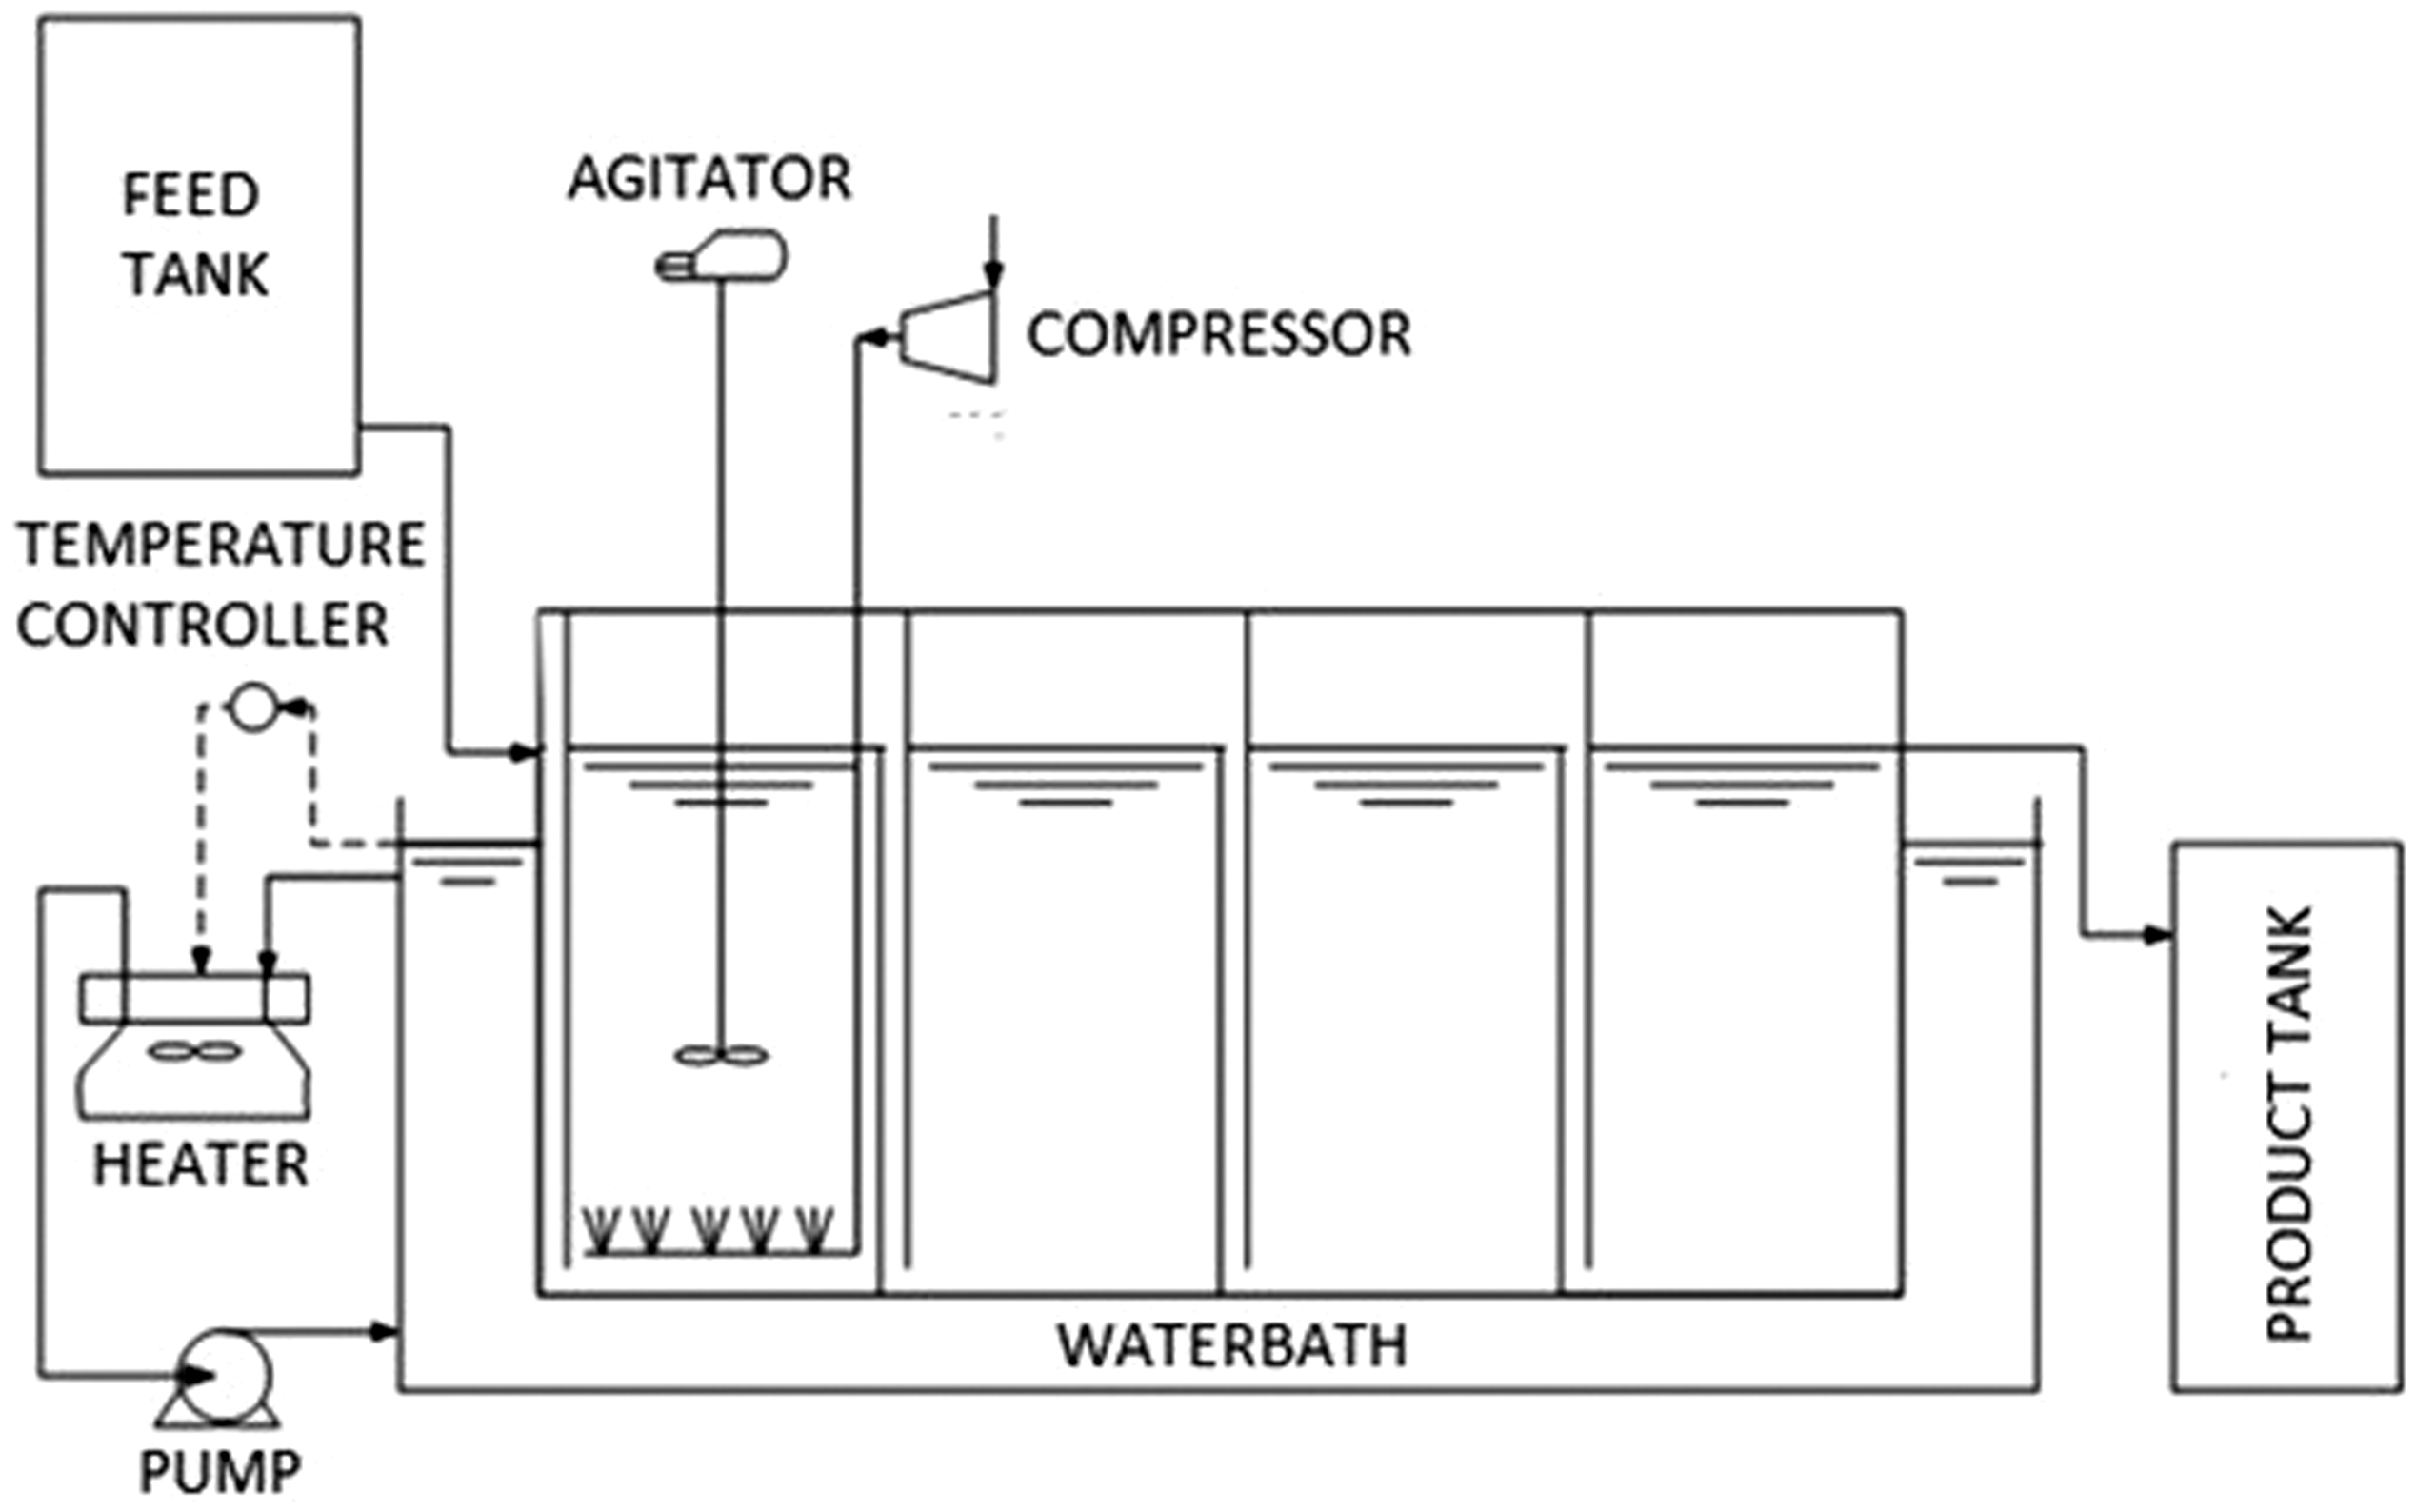
Characteristic of molasses
The cane molasses used in this study were obtained from Bekonang, Sukoharjo regency, Central Java, Indonesia. The cane molasses had initial pH of 6.2 and density of 1361 g/l. The total sugar was 566 g/kg molasses estimated using phenol–sulfuric acid method (DuBois et al., 1956).
Experimental bioreactor profile
The IAABR (Figure 1) consists of the series baffle to force the solution containing substrate and microorganism to flow through the baffle as it passes from the inlet to the outlet. This series of baffle created a space that in this paper we called as compartment. The reactor consists of four compartments each of which has a volume of 25 l so that the total volume of IAABR is 100 l. Aerator and mechanical agitator equip the first compartment (A) which serves as cell supplier for the remaining compartment. The use of agitator in the first one is to maintain good oxygen distribution to ensure successfulness of cell regeneration process. In this experiment, the agitator is set constant at 500 r/min. Additionally, the reactor employs the submersible pump to deliver the feed from feed tank to the reactor and the ¼ in. full port ball valve to control the volumetric feed rate. The reactor is merged in a water-circulated bath to control the fermentation temperature.
Experimental setup
The production of ethanol was first started with the batch process. The reactor was premoistened by alcohol 70% (v/v) as the mean of sterilization. The batch process was started by filling the compartment A with 2.5 l of starter prepared by the method described previously and 22.5 l presterilized 20% (w/w) molasses. This process lasted for 48 h under constant aeration and agitation. Samples were taken during the process to evaluate the residual sugar and cells growth. Afterward, the grown S. cerevisiae was distributed into all of the compartments (A, B, C, and D) by flushing with molasses solution from feed tank. The hydraulic retention time (θ = volume/volumetric rate) for the feed in the reactor was 26.7 h (3.75 l/h). The independent variable of this experiment was the feed molasses concentration, i.e. 20, 30, 45%. The feed molasses concentrations of the corresponding variable were measured to be about 119.56 g/l (10% w/w sugar), 179.34 g/l (17% w/w sugar), and 287.9 g/l (25% w/w sugar), respectively. Sampling was performed at every compartment to estimate residual sugar, cell density, pH, and ethanol concentration.
Assays method
The total sugar concentration was determined according to the phenol–sulfuric acid method (DuBois et al., 1956). Before the analysis, the sample was diluted 1000 times initially to fit the reading range in a spectrophotometer. The sulfuric acid used in this method was 95–98% (Merck). Phenol solution was made by diluting 80 g of phenol in 20 g of distilled water (80% w/w). Precisely, the phenol–sulfuric acid solution was prepared by diluting 2 ml of diluted sample with 0.1 ml phenol and 5 ml of sulfuric acid. The sample was incubated for 30 min, and then the absorbance of each sample was measured at 490 nm using spectrophotometer against the blank sample. The curve calibration was prepared previously with various concentration of glucose (g/l) solution.
The cell density in the liquid was counted in the counting chamber of a hemocytometer using a microscope. An appropriate dilution of the mixture concerning the number of cells to be counted was used. The dilution was in the range of 4–7 times. The calculation was done in multiple times until the standard deviation of data is less than 5%.
The alcohol content was calculated by pycnometer method. The sample was checked at the constant temperature (29℃). The sample was estimated more than once and the variation of data should be less than 2%. The estimated density was calculated from the weight percentage of ethanol and then matched into Table 2.112 “Densities of Aqueous Organic Solution – Ethyl Alcohol” in the Perry’s Chemical Engineer’s Handbook. Additionally, the pH was monitored by pH 700 Benchtop meter (OAKTON Instruments) at the constant temperature (29℃).
Results
The performance of continuous ethanol production in IAABR was investigated in two aspects, i.e. the batch phase and continuous phase. The batch phase was occurring in compartment A during the last inoculum development for a continuous process.
Batch phase
The aim of the batch phase was to develop yeast inoculum, which is ready to perform fermentation process continuously. It involved adapting the yeasts to molasses medium and growing the cell’s density which was suitable for 100 l working volume of the IAABR. The batch phase fermentation was done in 25 l working volume in the compartment A and using 30% (w/w) molasses medium incubated at a constant aeration and agitation. Figure 2 shows the batch phase profiles of residual sugar and cell density. The obtained parameter in the batch phase is displayed in Table 1.
Profile of residual sugar and cell density during batch phase. The batch phase data.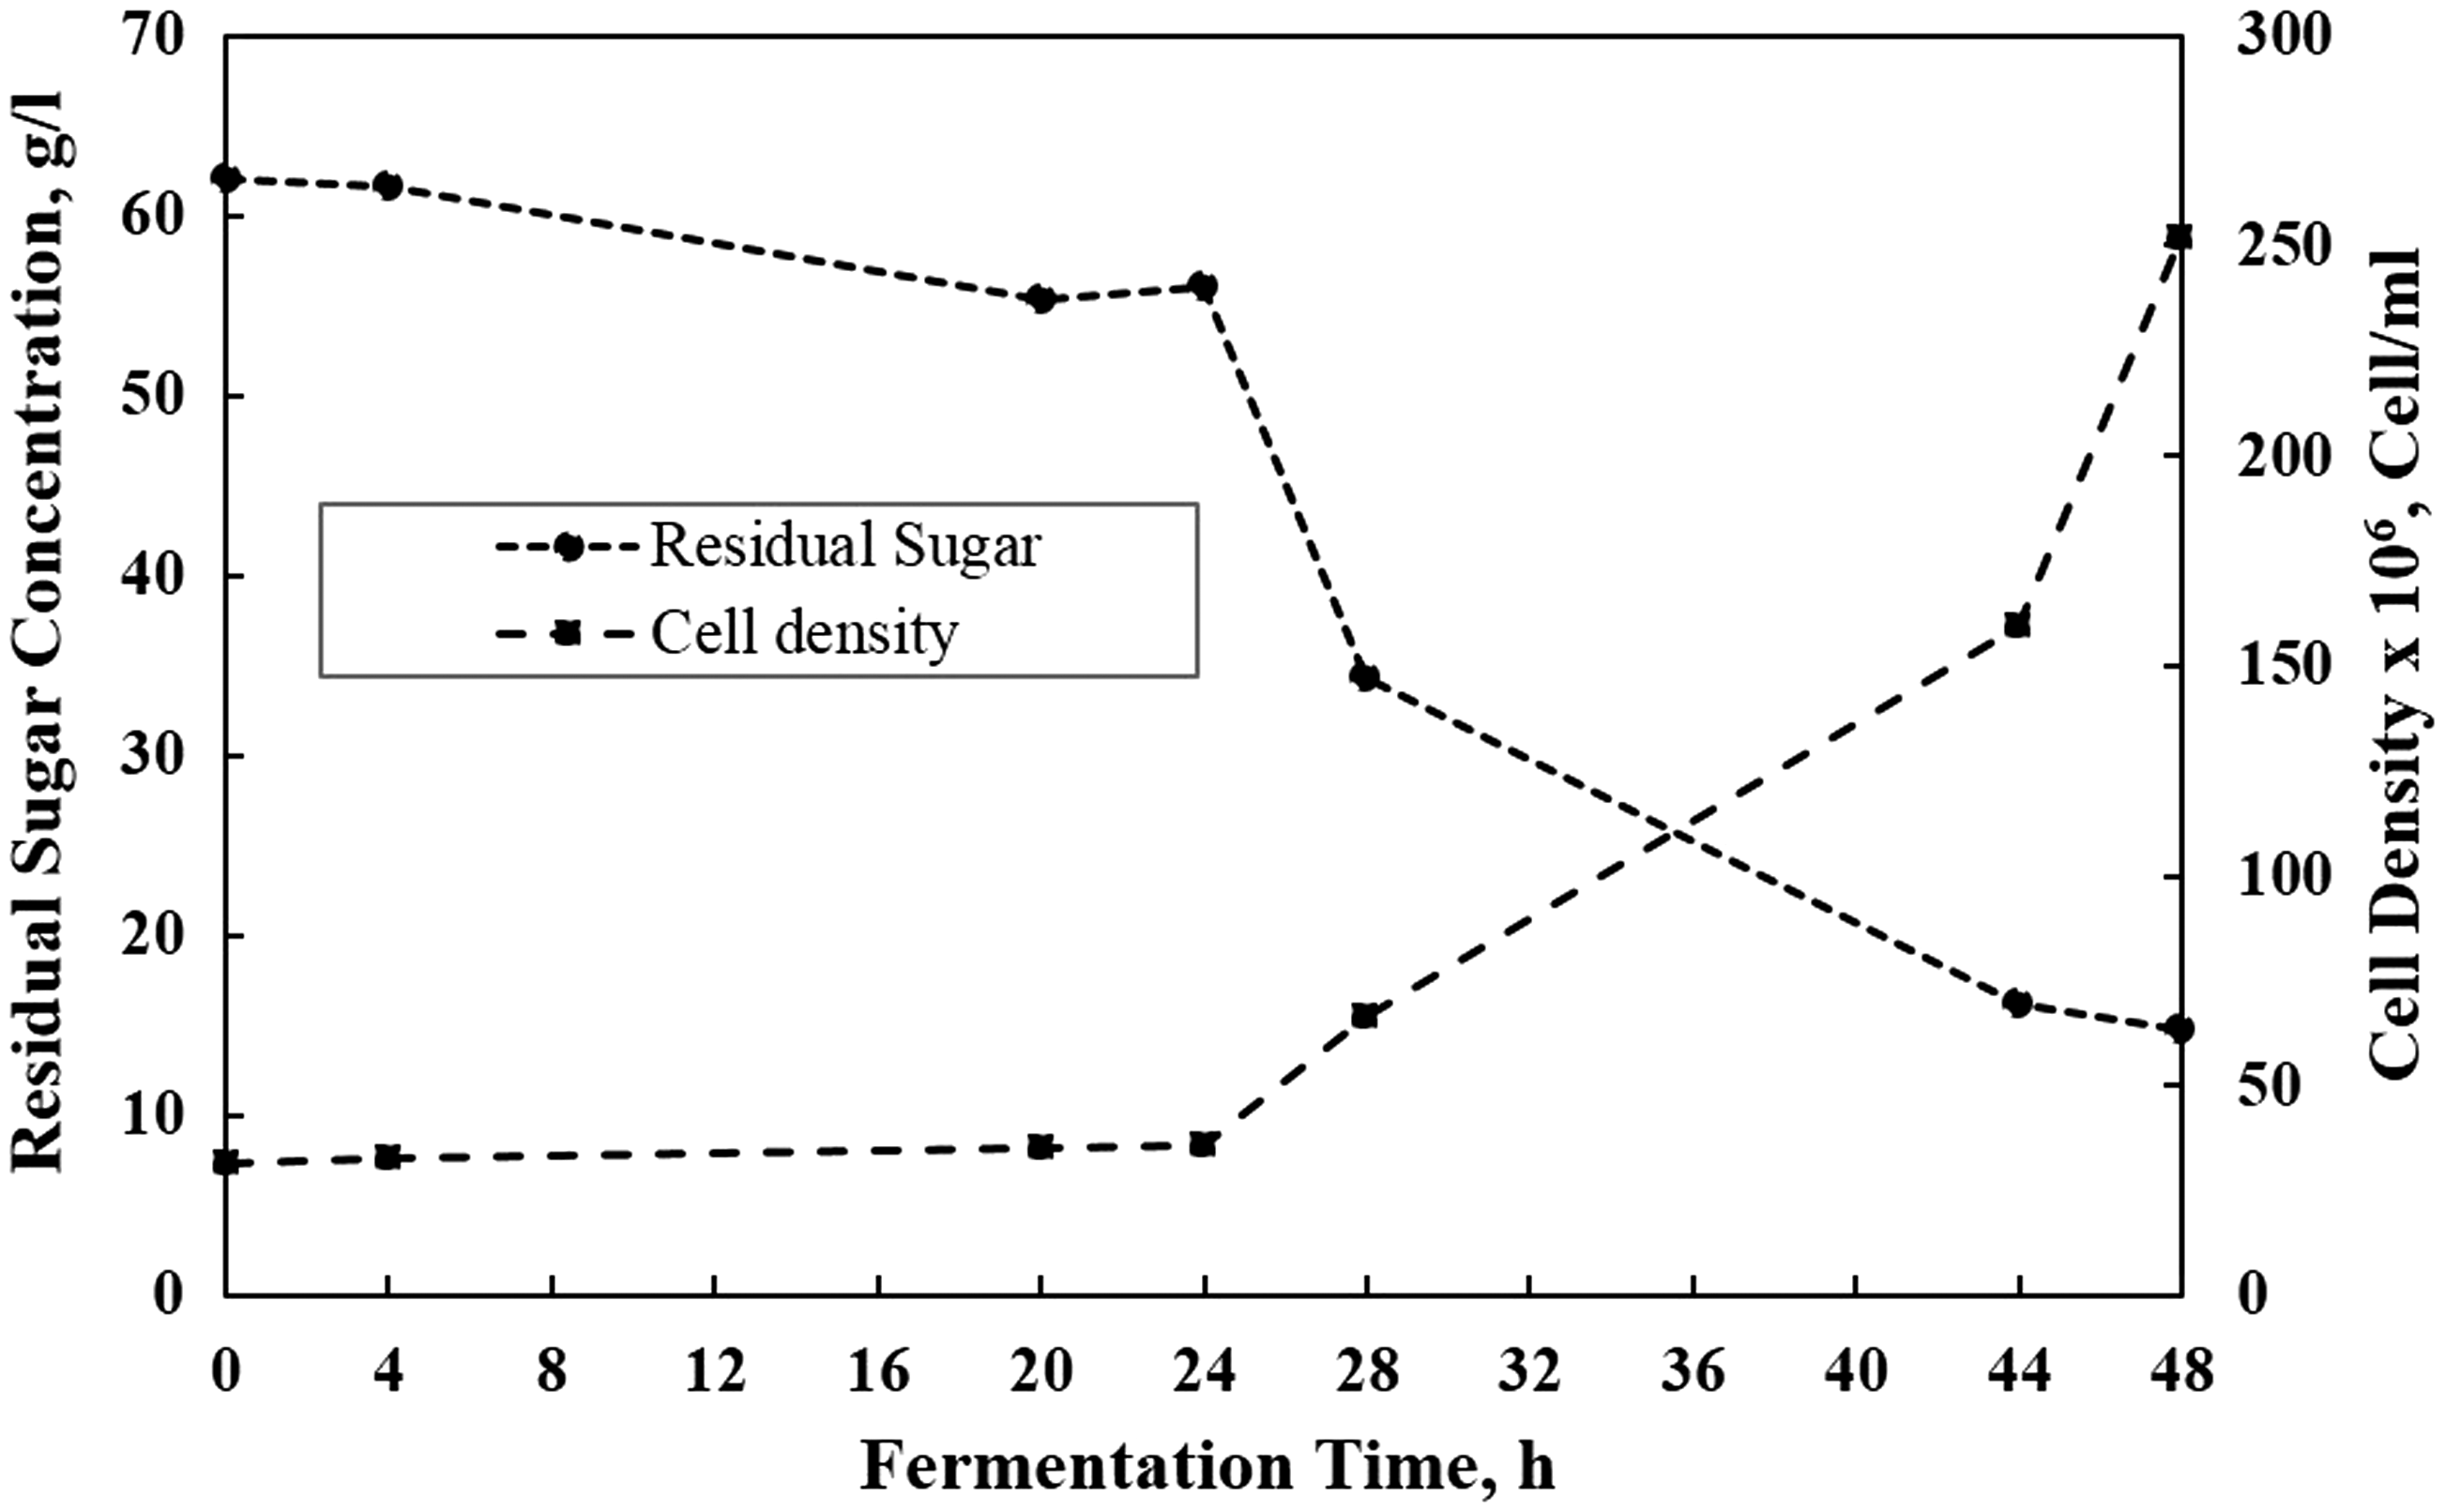
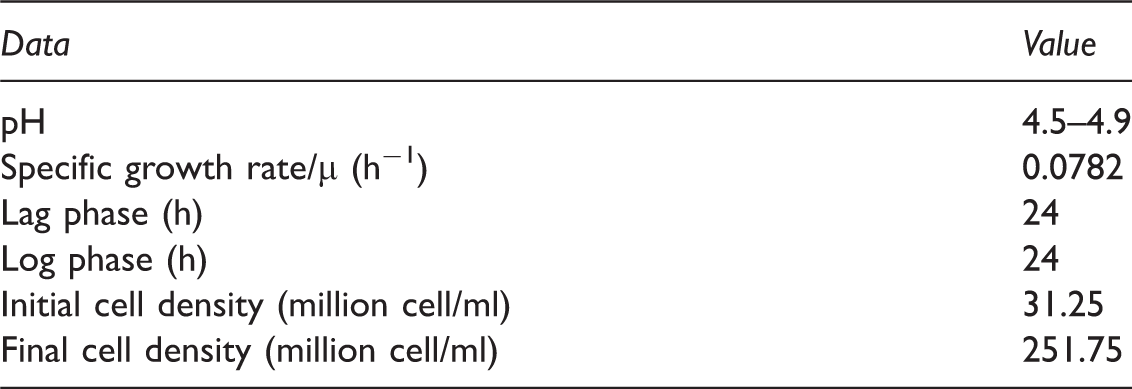
The lag phase duration is in a relationship with the adaptation performance of S. cerevisiae. In this case, the lag phase lasted for about 24 h (Figure 2). During this moment, the cell’s density was relatively constant or growing very slowly from 31 × 106 to 35 × 106 cells/ml, while the residual sugar decreased from 62 to 56 g/l. This behavior was showing the adaptation activity of yeast in a new environment.
The yeast started to grow significantly above 24 h of incubation time and reached 25 × 107 cells/ml. Consequently, the residual sugar also decreased significantly, i.e. from 56 to 14.8 g/l. By the end of the batch phase, the residual sugar of 14.8 g/l was still high enough. However, the batch process was terminated and immediately changed to the continuous process. The termination of the process was done to avoid the stationary phase to begin and let the yeast cells remained in the logarithmic phase. The yeast culture in logarithmic phase was suitable for inoculum in the continuous production process of the ethanol. We avoided the yeast at stationary phase due to two reasons, i.e. (1) the initial step of continuous phase was high sugar medium flushing and (2) the yeast cells took a longer time to adjust to higher sugar concentration due to its metabolism readjustment (Bailey and Ollis, 1977).
Continuous phase
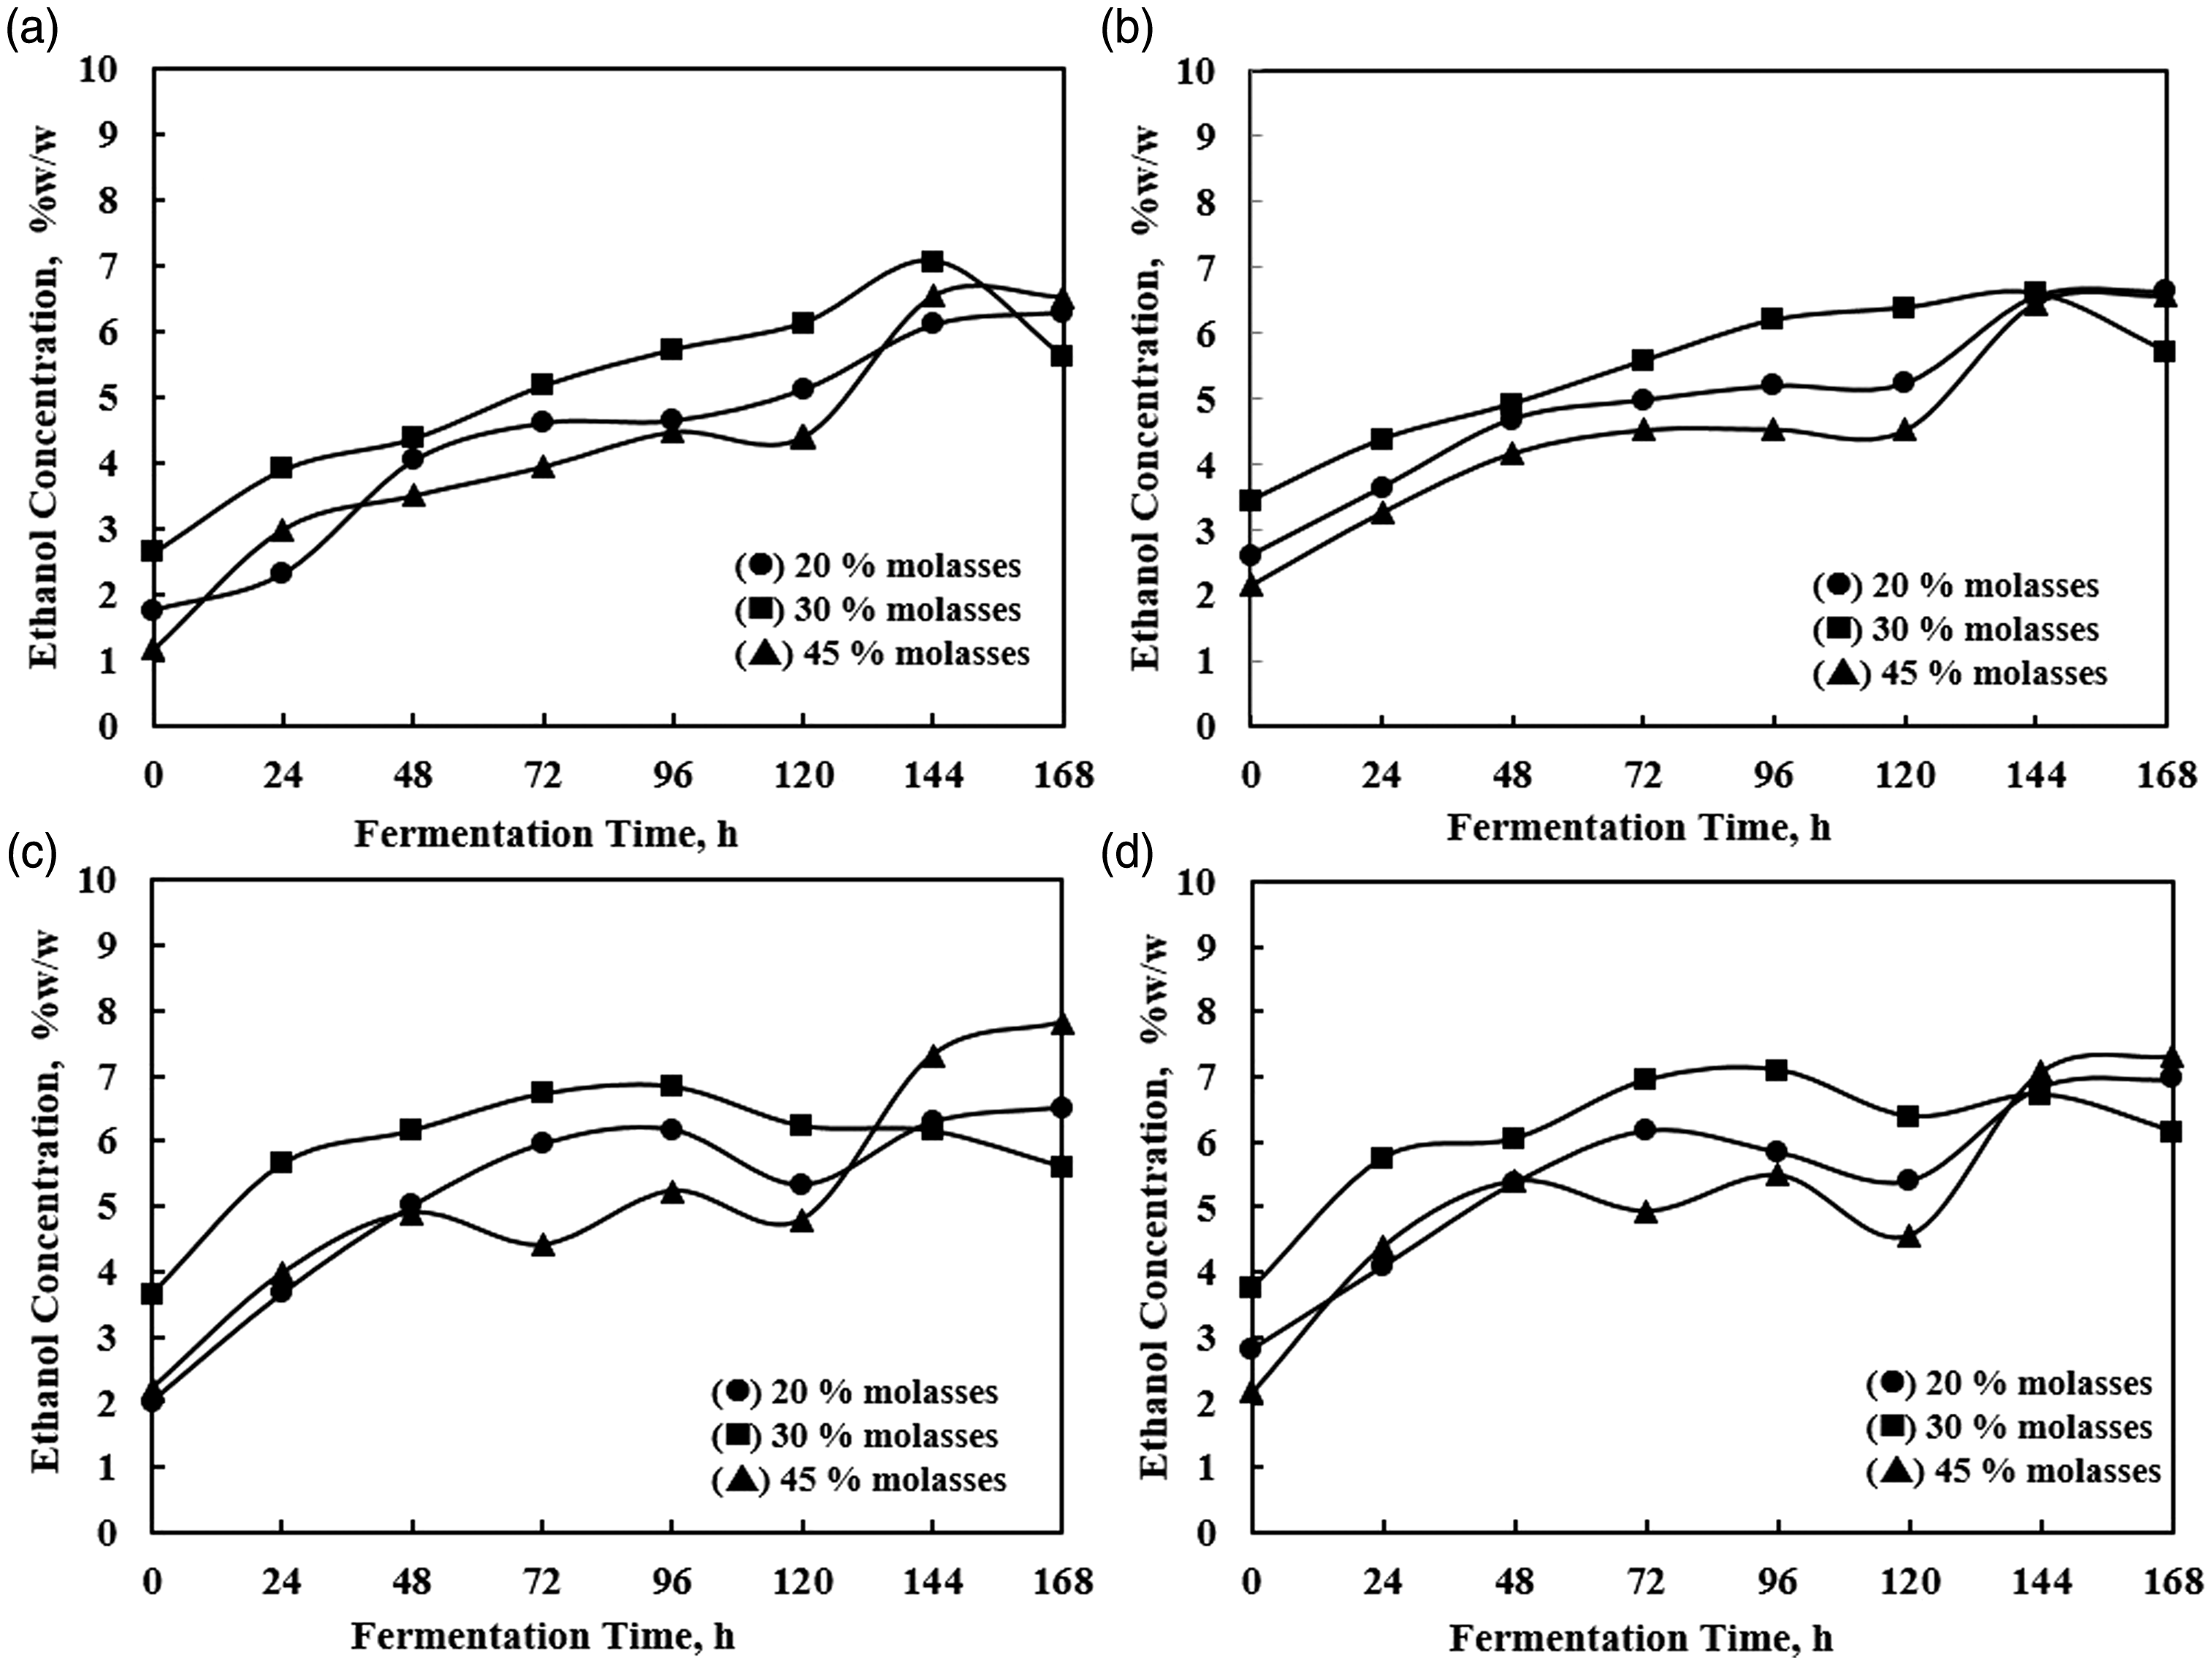
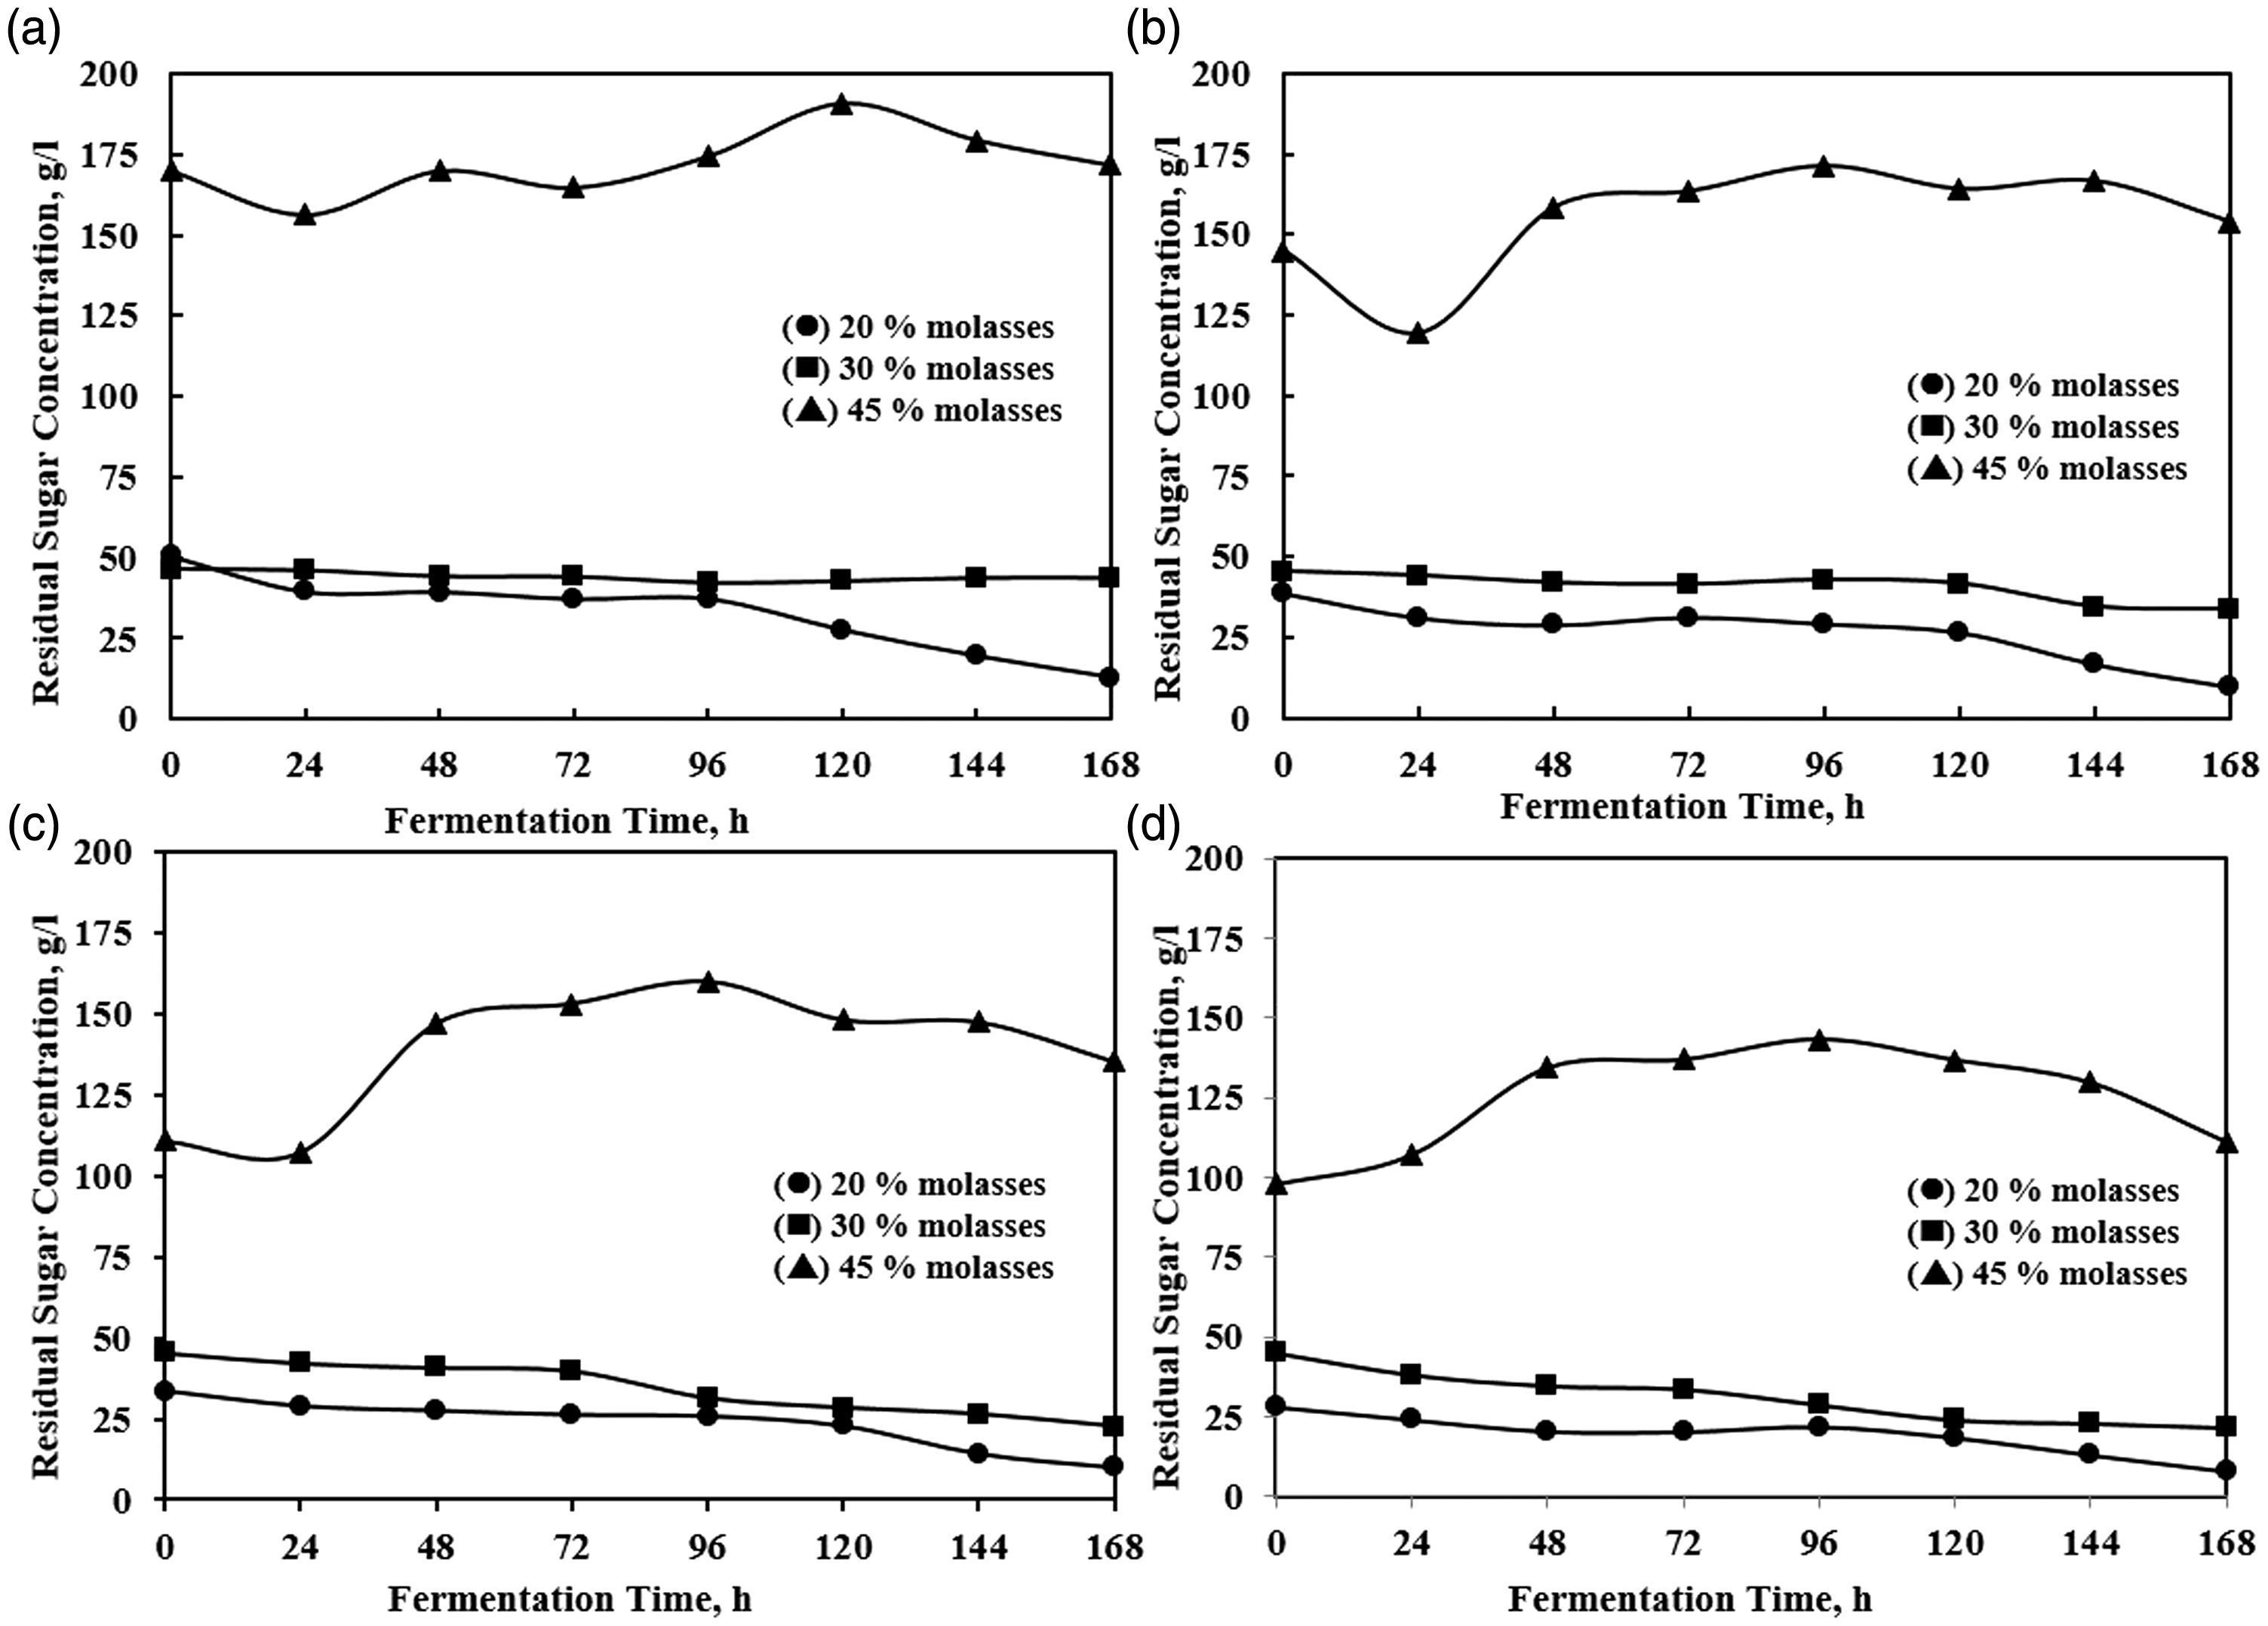
Continuous phase was initiated at 48 h of batch phase by flushing the molasses media to the reactor. It was intended to distribute cells into the four compartments of A, B, C, and D. The density of yeast cells, residual sugar, and ethanol production was observed during the continuous process. They are shown in Figure 3 (the cell density), Figure 4 (the ethanol concentration), and Figure 5 (the residual sugar).
The cell density in the compartments A, B, C, and D during continuous phase. The ethanol concentration (%w/w) in the compartments A, B, C, and D during continuous phase. The residual sugar concentration (g/l) in the compartments A, B, C, and D during continuous phase.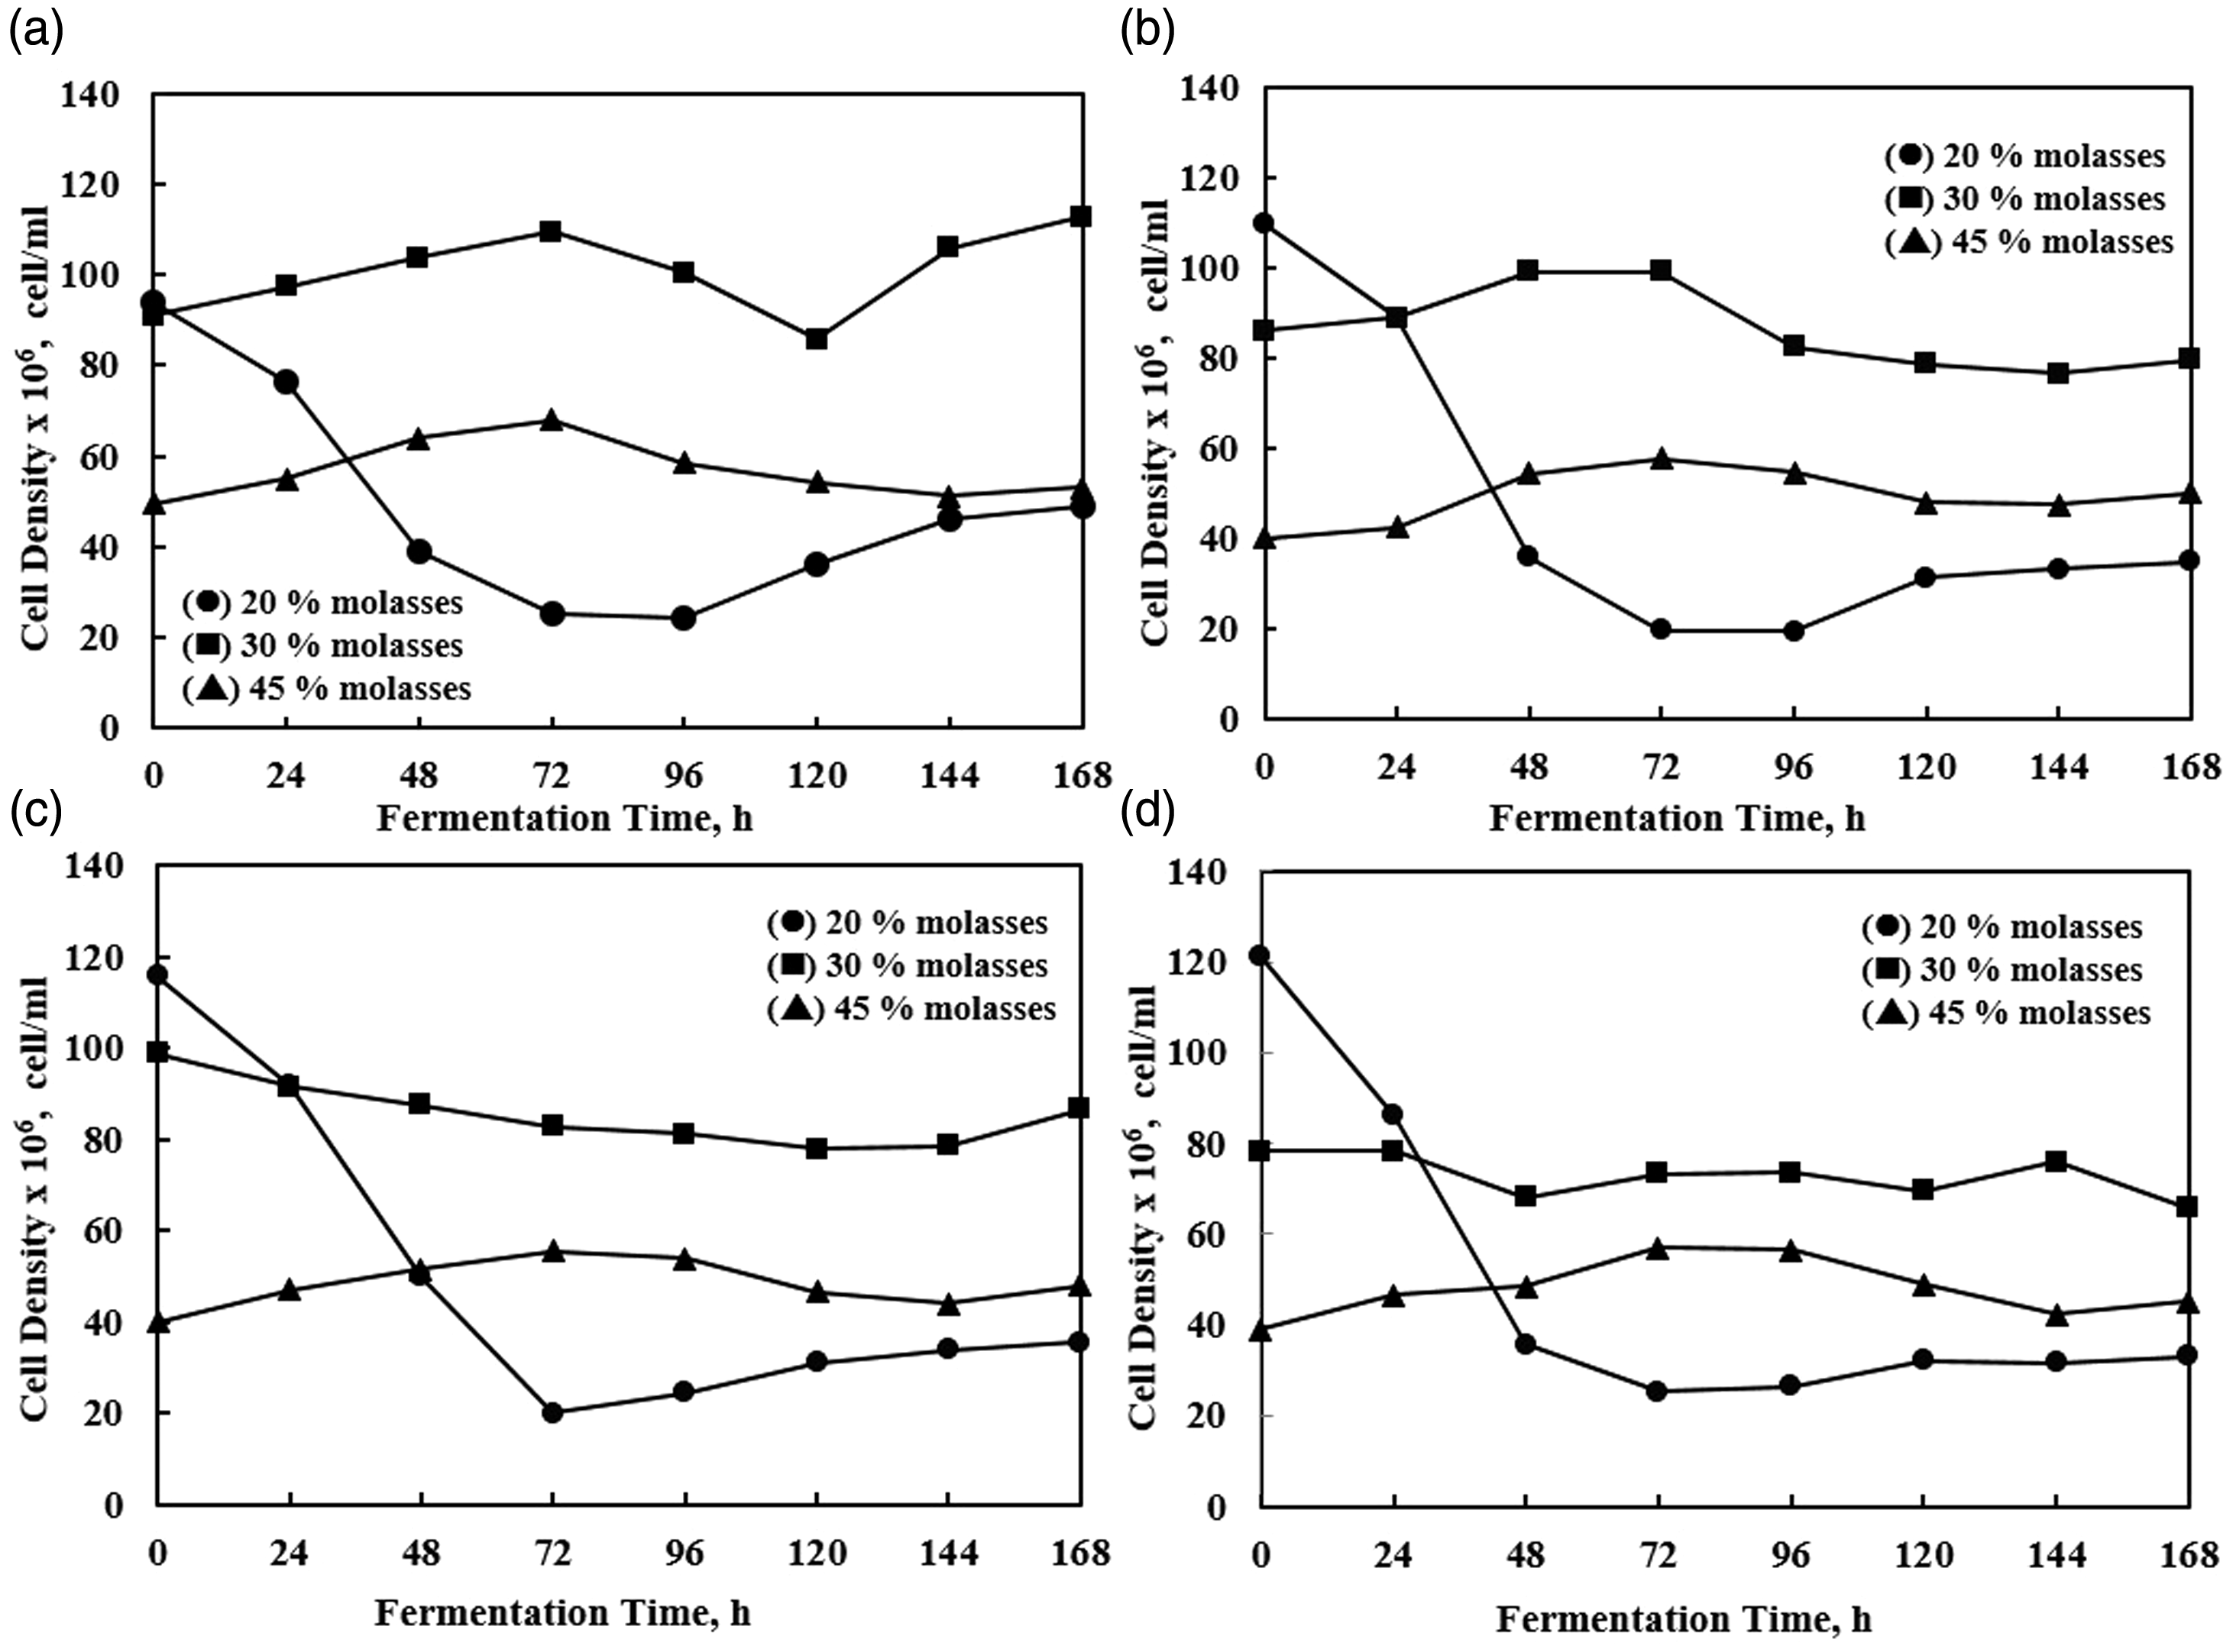
The different cell density at the initial process occurred due to the irregularity of flushing process. The intense agitation was done during the flushing process to ensure regularities and homogeneity of solution before flowing to the succeeding compartment. Figure 3 shows that the yeast cells can adapt well in the fermentation media. The pattern of cell density during the process was relatively constant (approaching steady-state operation), particularly for 30 and 45% molasses variable in which no significant changes were observed during 168 h. On the other hand, the cell density using 20% molasses medium showed a substantial decrease in the first 48 h continuous phase. Further, the cell densities in 45% molasses medium were less than 30% molasses medium, that is the possibilities of substrate inhibition happened in 45% molasses medium. Another indication of the inhibition was observed from lower ethanol concentration obtained.
The ethanol production under different feed sugar concentration showed the result of the nearly constant trend (steady-state approach production) in the compartment C and D. The ethanol concentration was noticeably increased since the beginning of the continuous phase. Afterward, the trend shows a meaningless change. However, the ethanol production trends still increase during the process in compartments A and B. The variable of 30% molasses medium gives a slightly better result on ethanol concentration out of another variable.
The profile of residual sugar is not showing steady-state process yet. The process with feeding sugar of 20 and 30% molasses media has a similar trending profile. It decreases slightly and gradually along all of the compartments, an evident that prolonging the residence time will improve sugar consumption. A different trending pattern of residual sugar has been obtained in the process with the feeding sugar of 45% molasses media. It tends to increase gradually in all of the compartments. The observation shows that the sugar feed variation had an influence on residual sugar consumptions and trends.
An alcoholic solution has a disinfectant effect to microbial. The effect is affected by ethanol concentration and exposure time. Based on the reason, the durability of yeast cell in an alcoholic media was investigated using 30% molasses media under extended fermentation process for about 340 h (Figure 6). The profiles of yeast cell in all compartments are steady. The viable yeast survives along the extended time and only slight increase was observed. Additionally, the ethanol production also enhanced from compartment A to compartment D in such a way from the first 168 h. While, the residual sugar decreased gradually from compartment A to compartment D. It can be highlighted that the overall result showed the condition with no significant change.
The durability test for 340 h process using 30% molasses feed.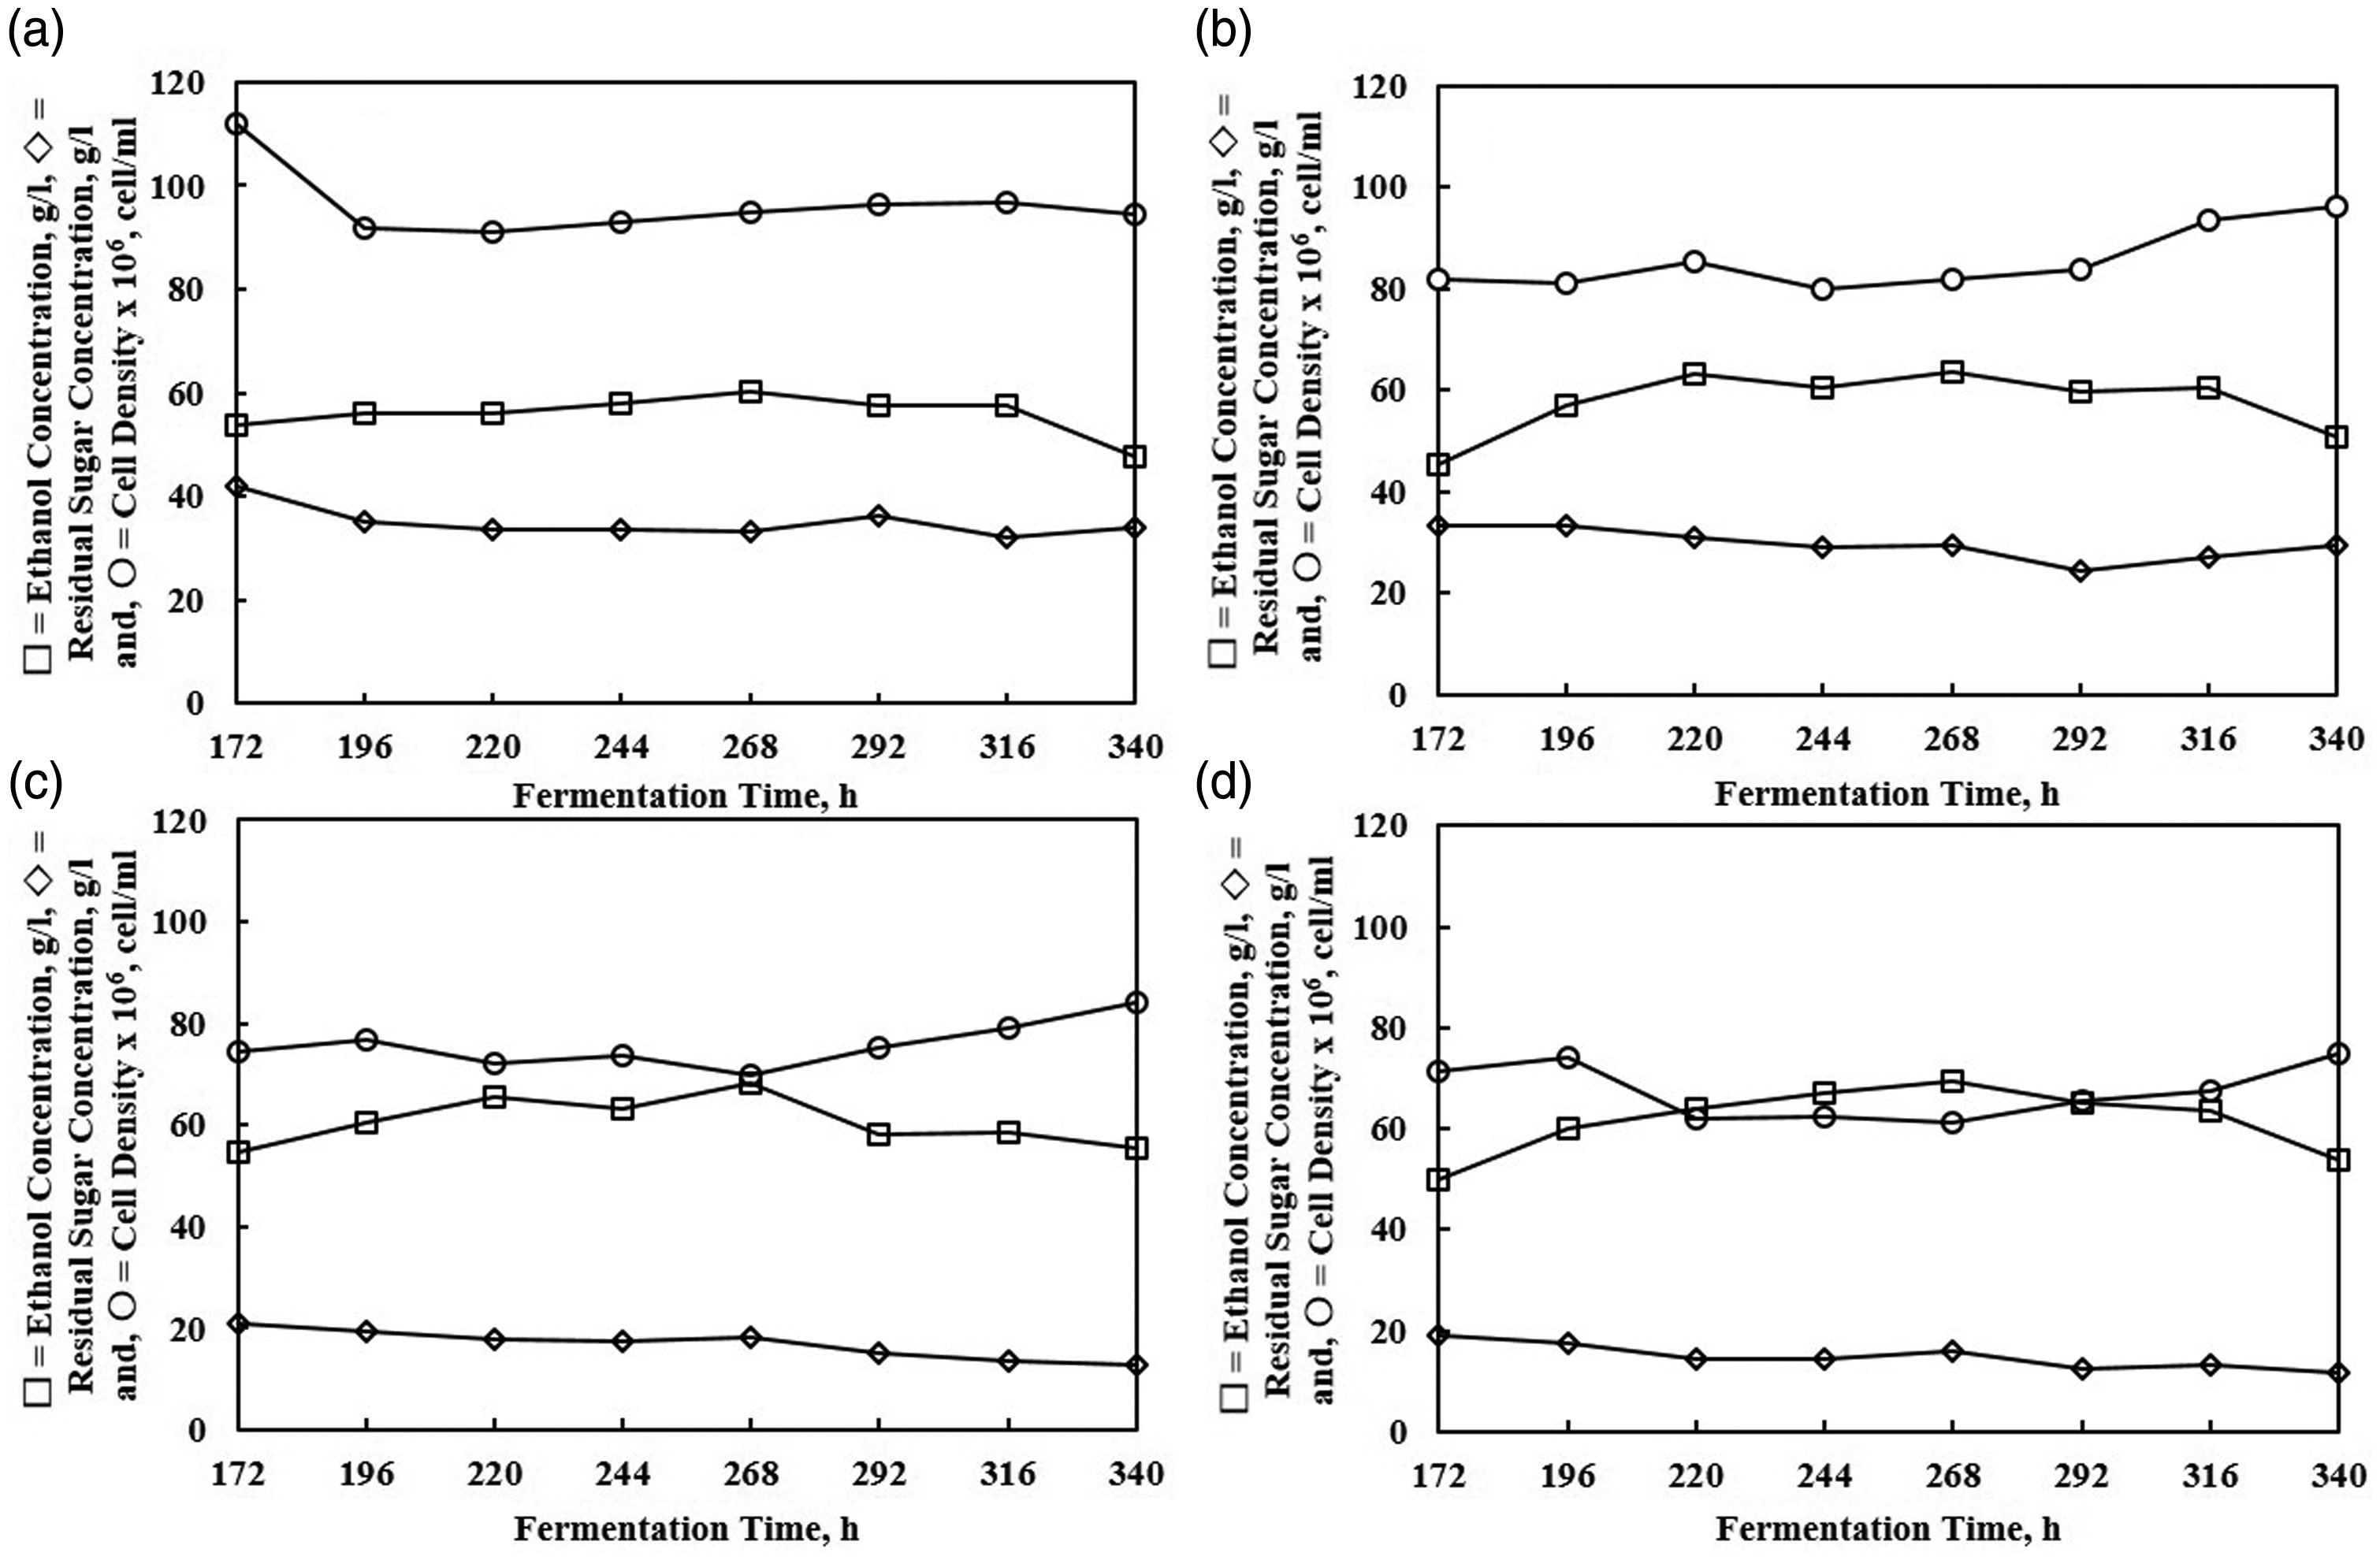
Figure 7 shows the sugar loading shock behavior for the continuous process. In this process, the feed is introduced continuously and possibly unfixed (there must be a deviation from time to time), unlike the batch process in which the feed variation is absent (since no additional input). The uncertainty of feed concentration may affect the process holistically. Therefore, the shock loading test was done to gain more information about the phenomena. The sugar loading shock was done after 404 h process (represented in Figure 7 with dotted vertical lines) from the initial feed of 30% and suddenly changed to 40% (w/w) molasses.
The sugar loading shock test from 30% to 40% (w/w) molasses feed. The shocked load started at 404 h. (a) shows the profile of sugar concentration; (b) shows the profile of ethanol concentration; (c) shows the profile of cell density.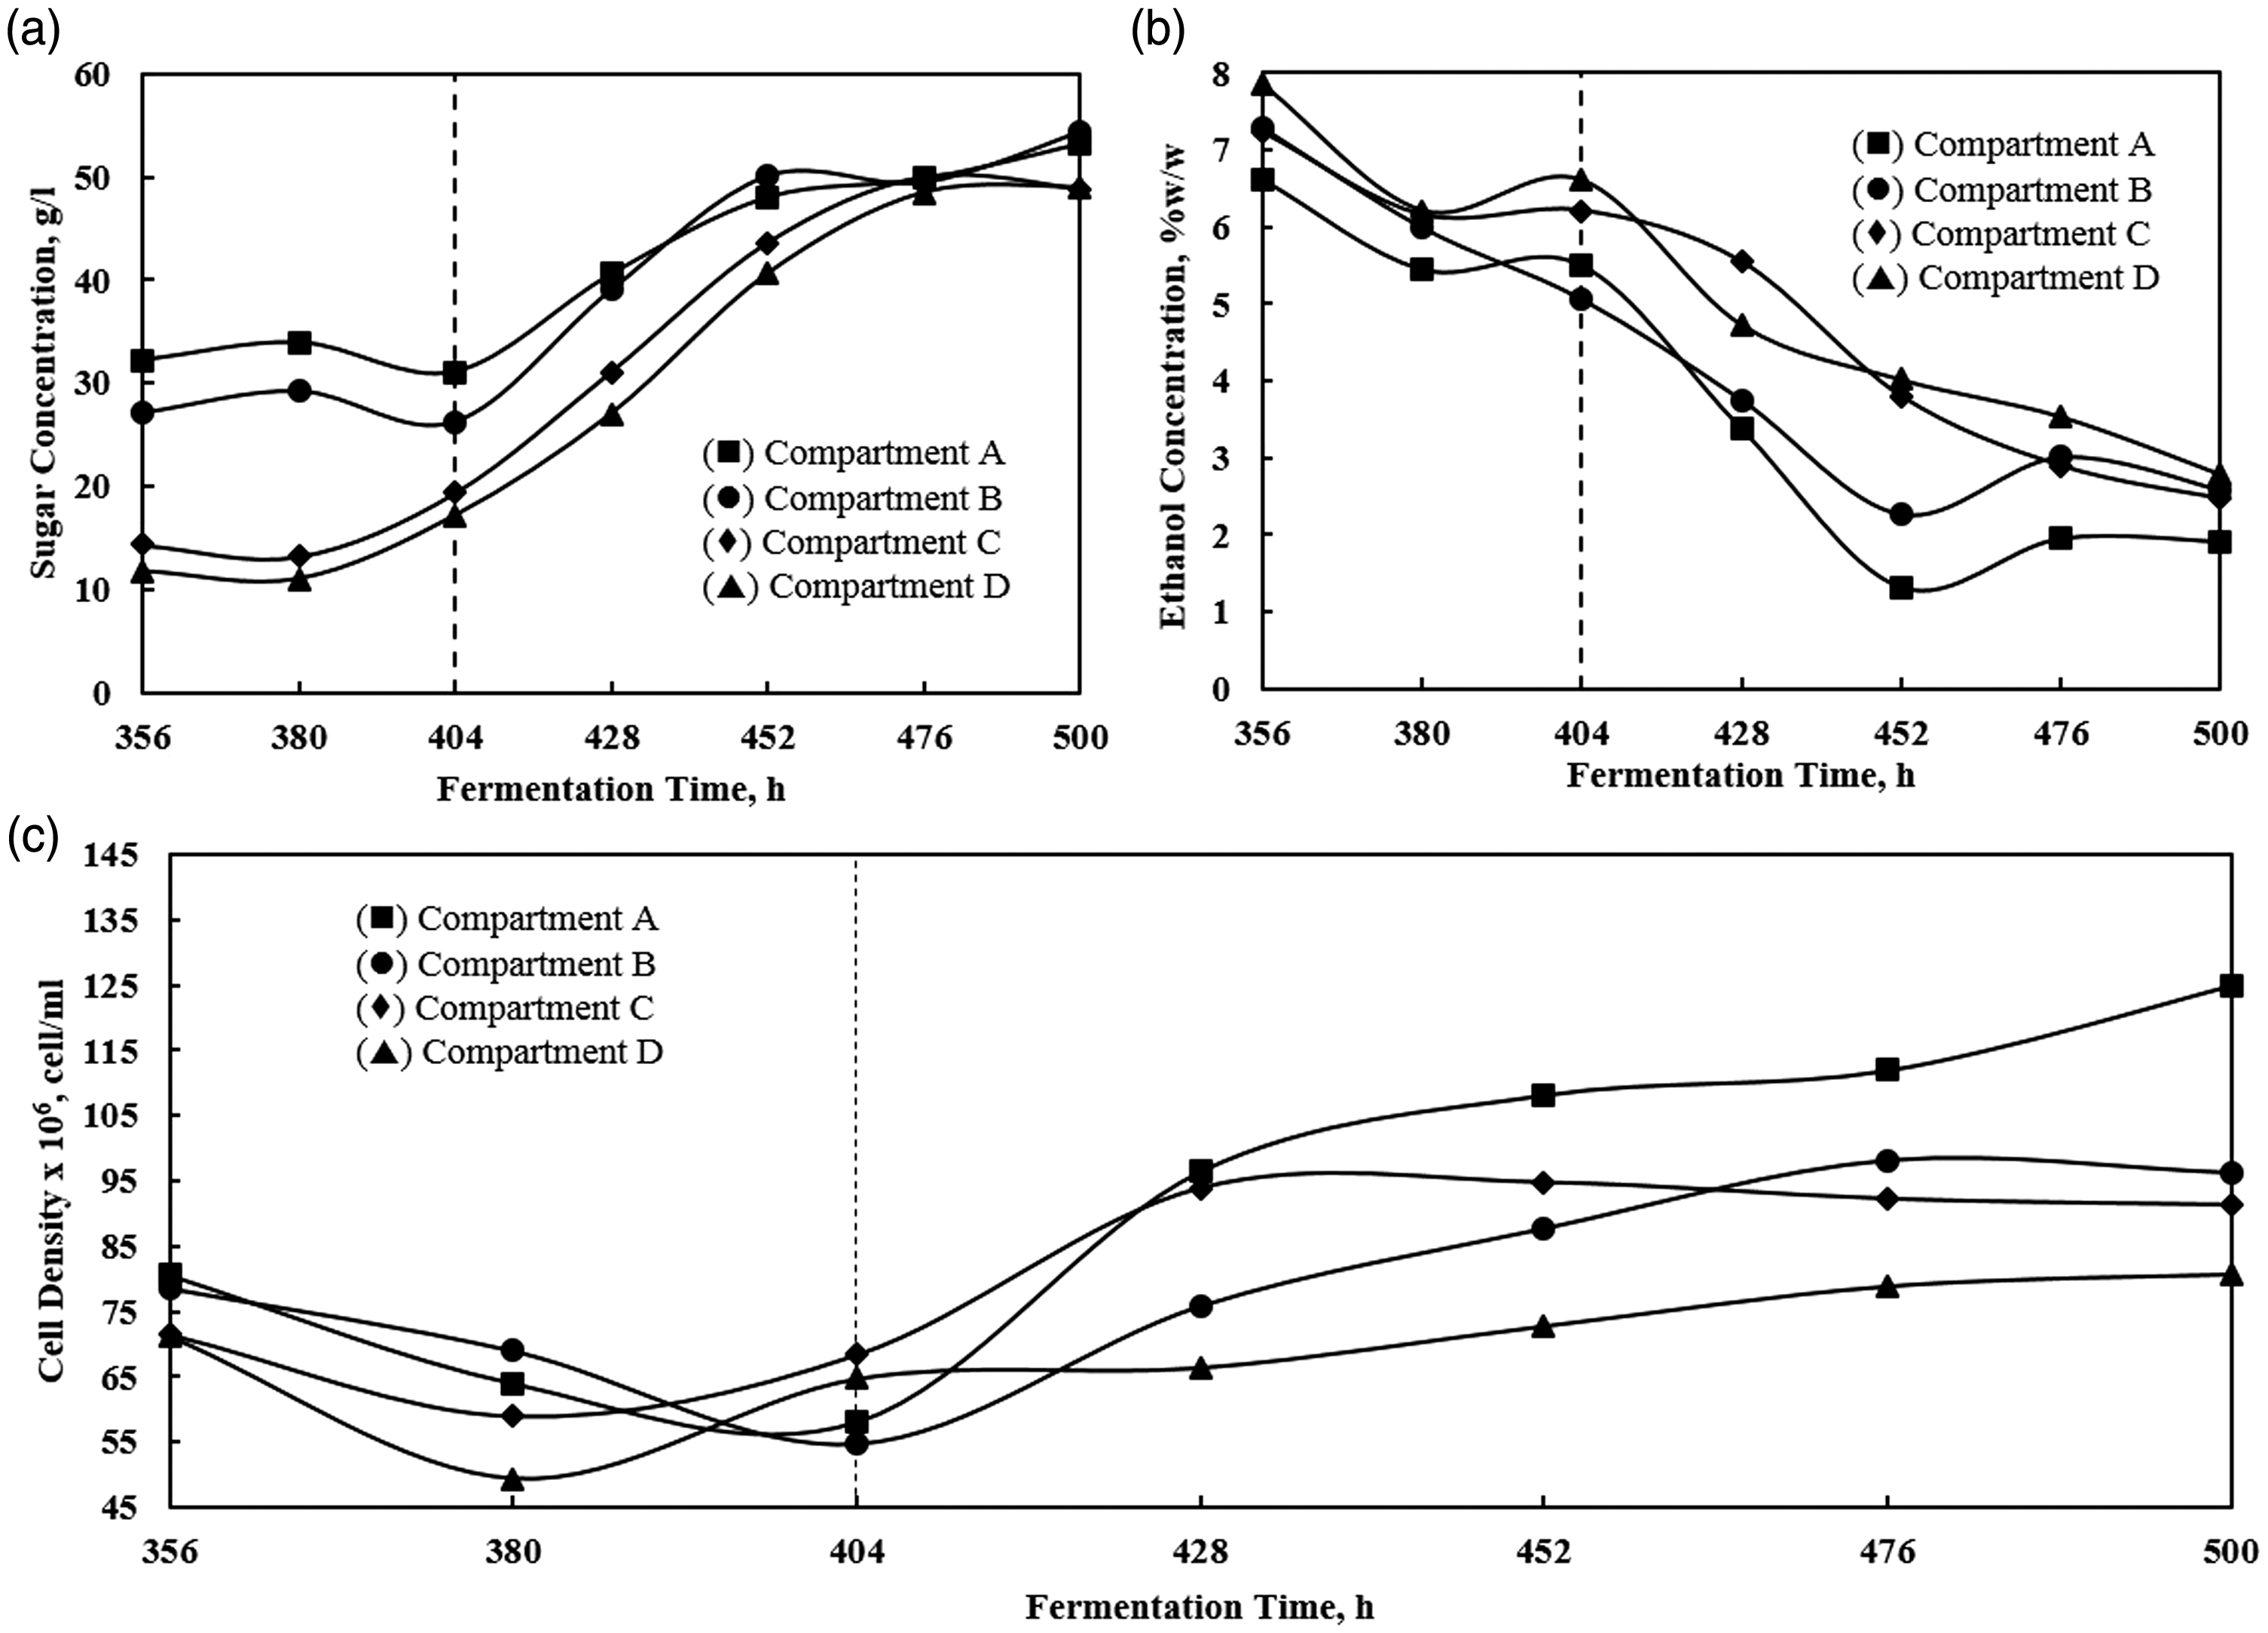
The sugar concentration in all compartments increased steadily at 404 h and above (Figure 7(a)). It turned to be steady at 452 h where all compartments showed quite similar value. The ethanol concentration decreased evenly in all compartments. In the last compartment, the initial ethanol concentration was 8% (w/w) and fell to 2% by the end of the test (Figure 7(b)). In the other hand, the cell density showed a slight rise.
Discussion
Briefly, the ethanol production was unaffected by the variation of sugar concentration during the process. In contrast, the sugar variation affected the cell’s density. Therefore, despite having same initial cell’s density, the final cell’s density varied related to the substrate concentration.
IAABR was reliable securing the stability of process for 168 h fermentation, even up to 340 h durability test. The advantage of using IAABR was self-mixing effect acquired by the installed baffle and produced gas during the process. This baffle could give the slow flow of media having a dispersion effect to homogenize cell and sugar concentration throughout the IAABR. The CO2 gas will help the yeast to have updraft movement (Barber and Stuckey, 1999). Additionally, the baffle also creates the yeast cells within the reactor dragged to the floor of the reactor and the washout cells could be minimized. From the experiments, regardless of feed sugar concentration, the profile of yeast population was showing an approximated steady-state condition.
Average yeast cells density during continuous phase.
Note: The present value is expressed by million cells/ml.
Final productivity of all variables.
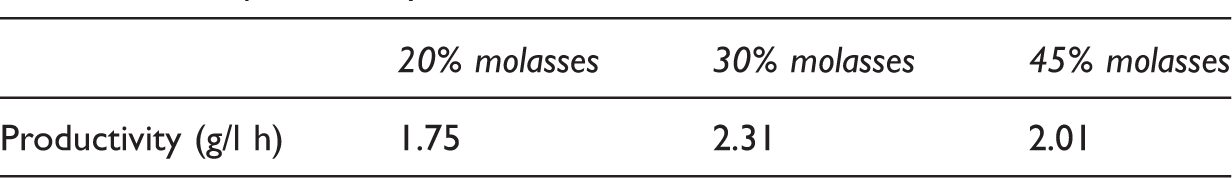
Dilution rate: 0.0375 h−1.
Further, the difference in the cell density was obtained due to various sugar concentrations in the feeding stream. As previously stated, the medium with 30% molasses gave the highest cell population and relatively stable until to 168 h up to 340 h. In comparison, the 20% molasses media gave lower cell density (Figure 3). It is most likely due to nutrient availability, as we may notice in Figure 5, only a few residual sugar remain in all compartments. It means that most sugars were consumed. The concentration of 20% molasses was insufficient for the cell to generate denser population. The nutrient scarcity may induce competition that will result in yeast cells depletion. This phenomenon was shown by the dropped cell density in the early 48 h of the continuous process at 20% molasses feeding. After 48 h running, the cell density was relatively constant in the range of 30–28 million cells/ml (Table 2).
Some researchers informed the influencing acidity (pH) toward the cells growth. Reported by Liu et al. (2015), pH 2.75 can affect yeast growth and fermentation in contrast with pH 3–4.5. Using 20% molasses feed, the value of pH was in the range of 4.0–4.7 and its trend was gradually reduced until the end of the process. The 30% molasses feed resulted in the pH range of 4.3–4.7; however, the trend was steadier in comparison with 20% molasses (Figure 8). This result proved that the level of pH might influence the activity of the cell. Decreasing pH may be due to ethanol concentration and other by-product creation, i.e. acetic acid (Pampulha and Loureiro-Dias, 1989). In these experiments, the advantage of continuous fermentation was the introduction of medium feeding could control pH medium inside the reactor.
The pH during fermentation process for 20 and 30% molasses.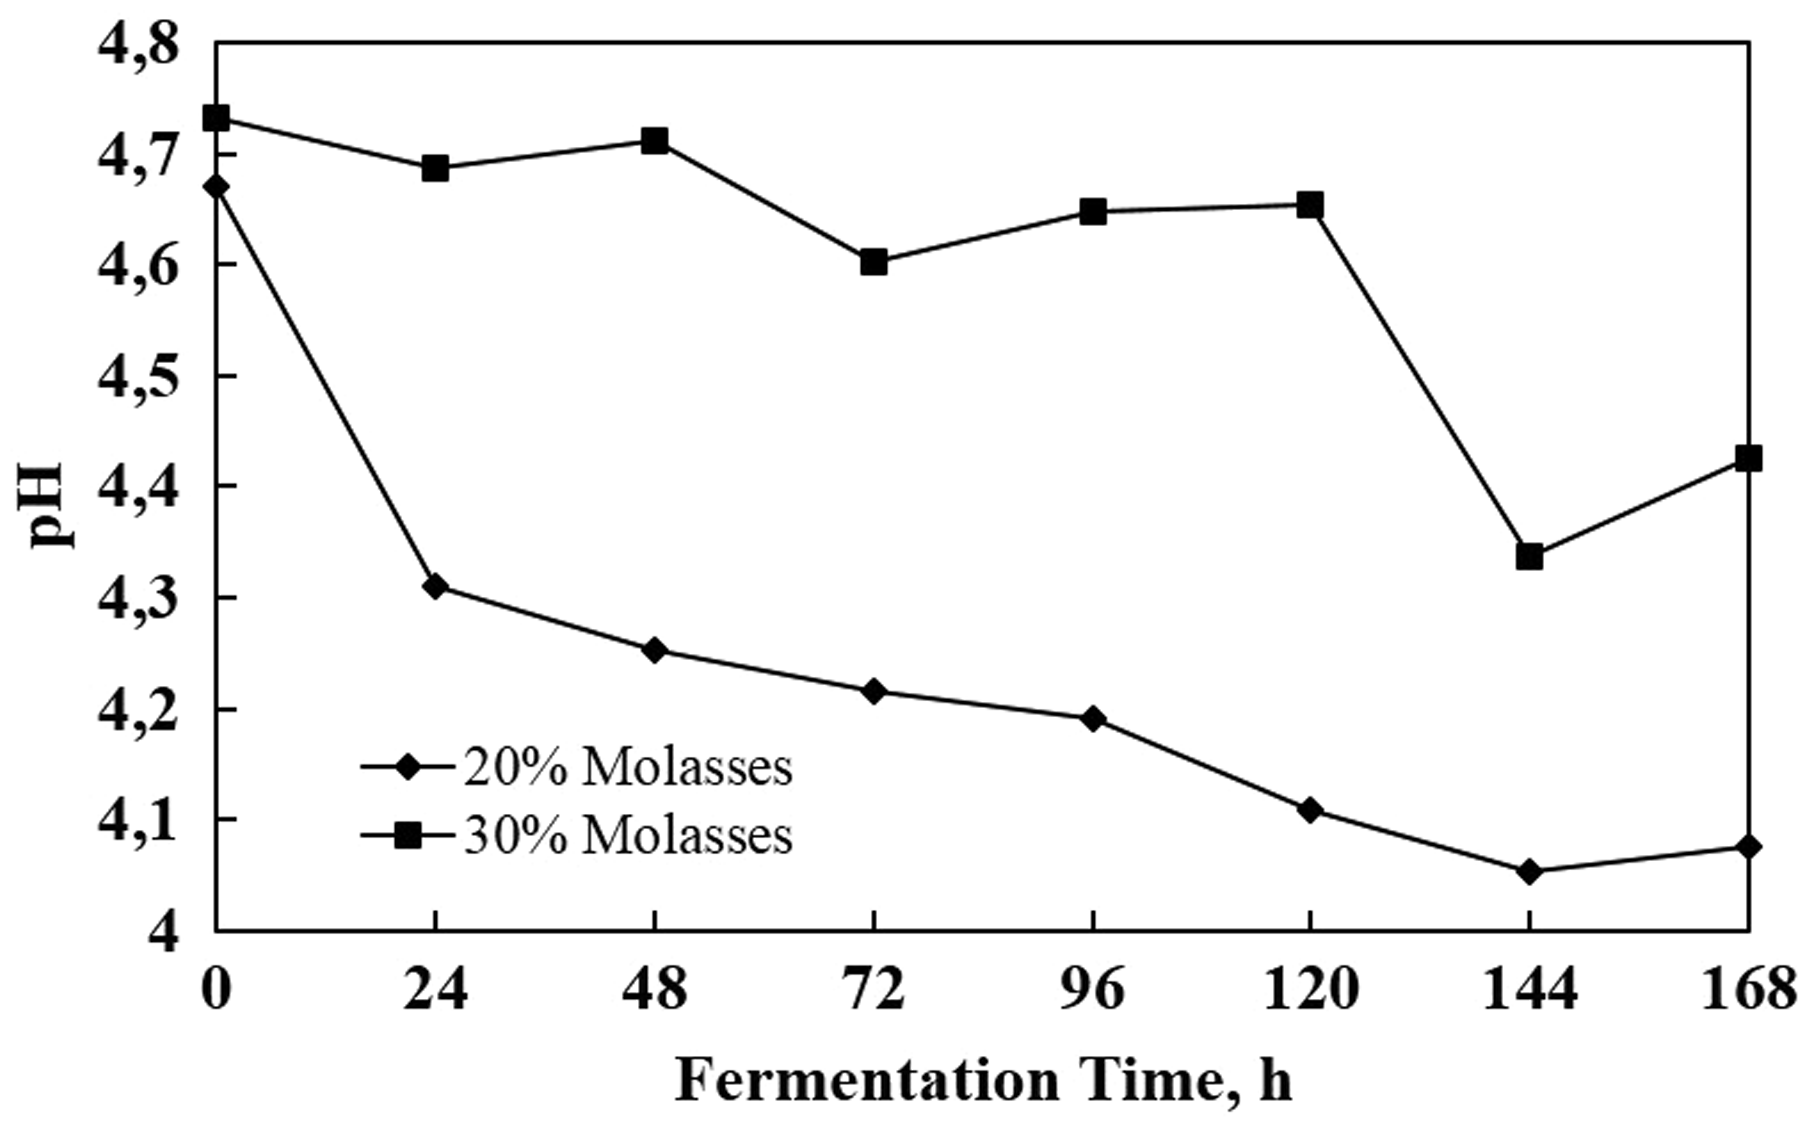
The yeasts in 20% molasses experienced nutrient scarcity; however, under sufficient nutrient condition, i.e. 45%, the cell density was also lower than that using 30% molasses. Additionally, the residual sugar inside the reactor was higher compared to another variable (Figure 5). Higher sugar concentration was reported to have cell inhibition phenomena (Fernández-López et al., 2011). Reported in Lin et al. (2012), the glucose concentration of 300 g/l or more has the high inhibitory effect on the activity of cells. In this experiment, using 45% molasses containing 287.9 g/l, this inhibition effect also occurred similarly.
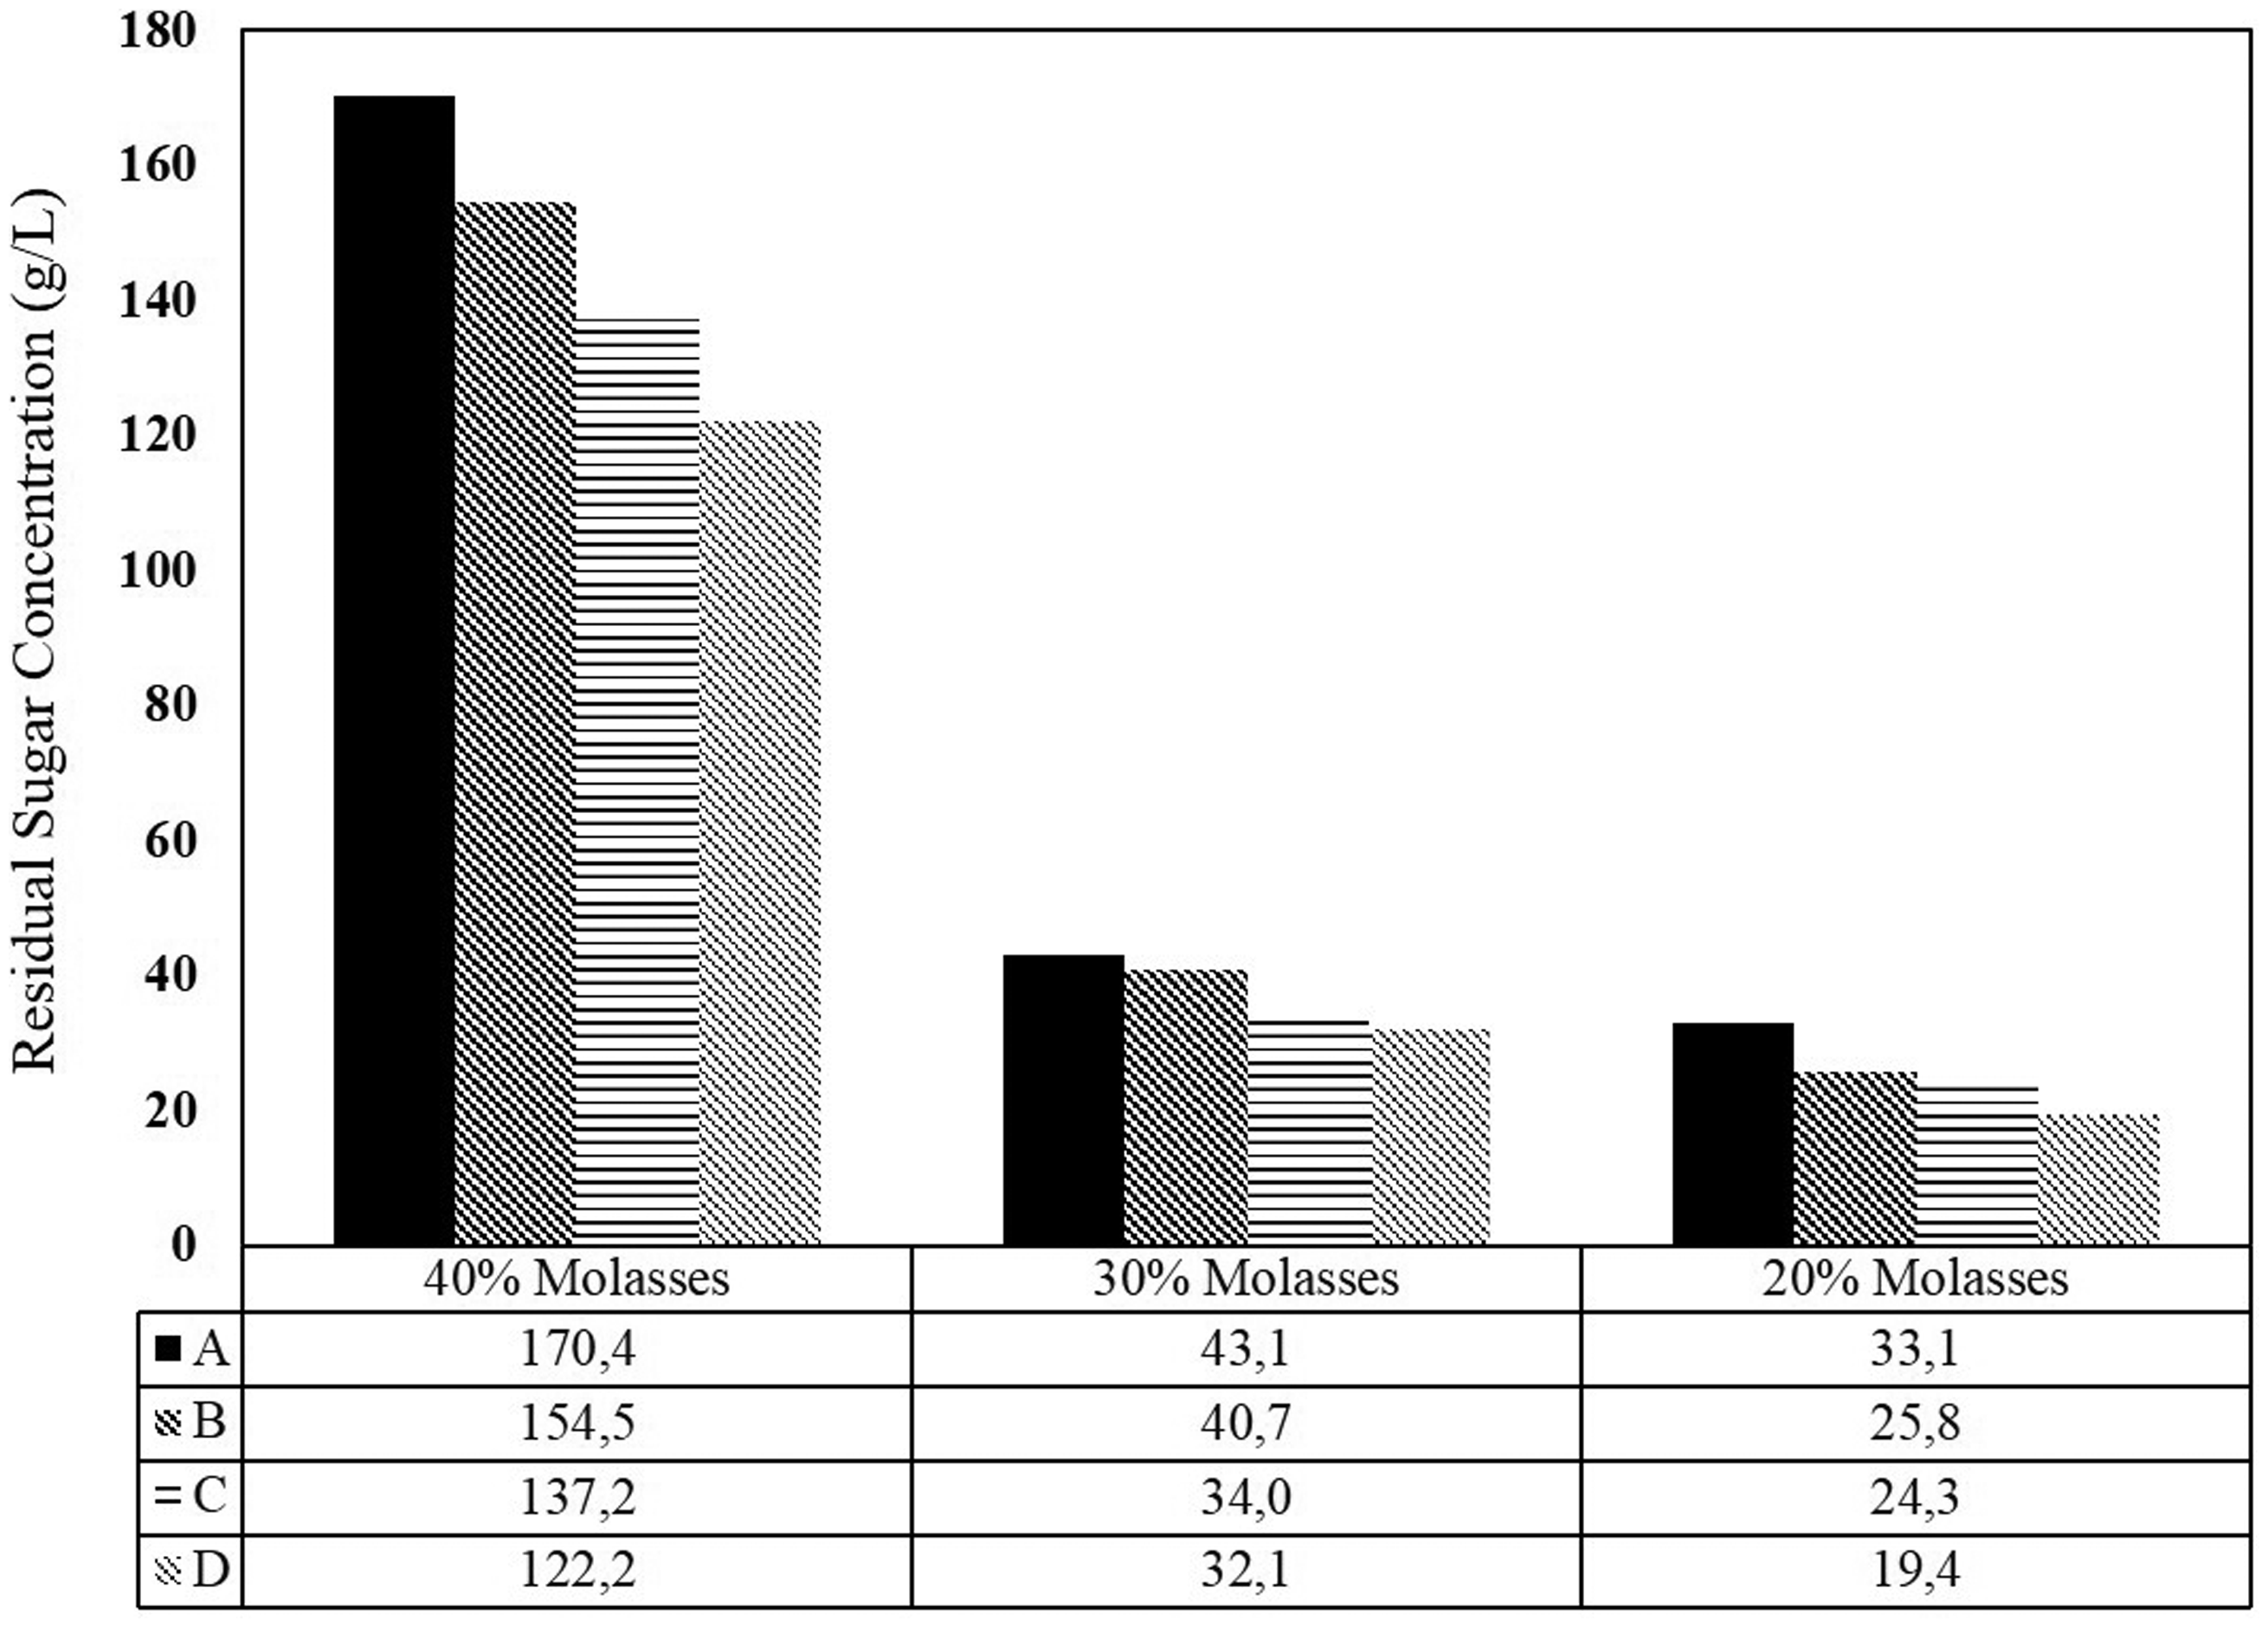
The feed molasses concentration also affected the ethanol production (Figure 4). For 20% molasses, the average overall productivity and the ethanol concentration is monitored at 1.75 g/l.h and 50.43 g/l, respectively. The increasing to 30% molasses, those values tend to increase at 2.31 g/l.h and 62.70 g/l. However, further increase in the amount of nutrient decreases the productivity. As mentioned before that using 45% molasses feed solution had already inhibited the cells activity. Thus, the productivity also declined. The productivity of fermentation using 45% molasses solution was at the level of 2.01 g/l h and 57.17 g/l ethanol. It is also observed that the concentration of ethanol increased gradually from compartment A to compartment D (Figure 9). Thus, it is apparently proven that four compartments in series have the ability in improving ethanol production. In reverse, Figure 10 shows that prolonging residence time also improves sugar consumption (sugar gradually decrease from compartment A to D).
The average value of ethanol concentration (g/l) during 168 h fermentation showing decrease trend over all variables. The average value of residual sugar concentration (g/l) during 168 h fermentation showing decrease trend over all variables.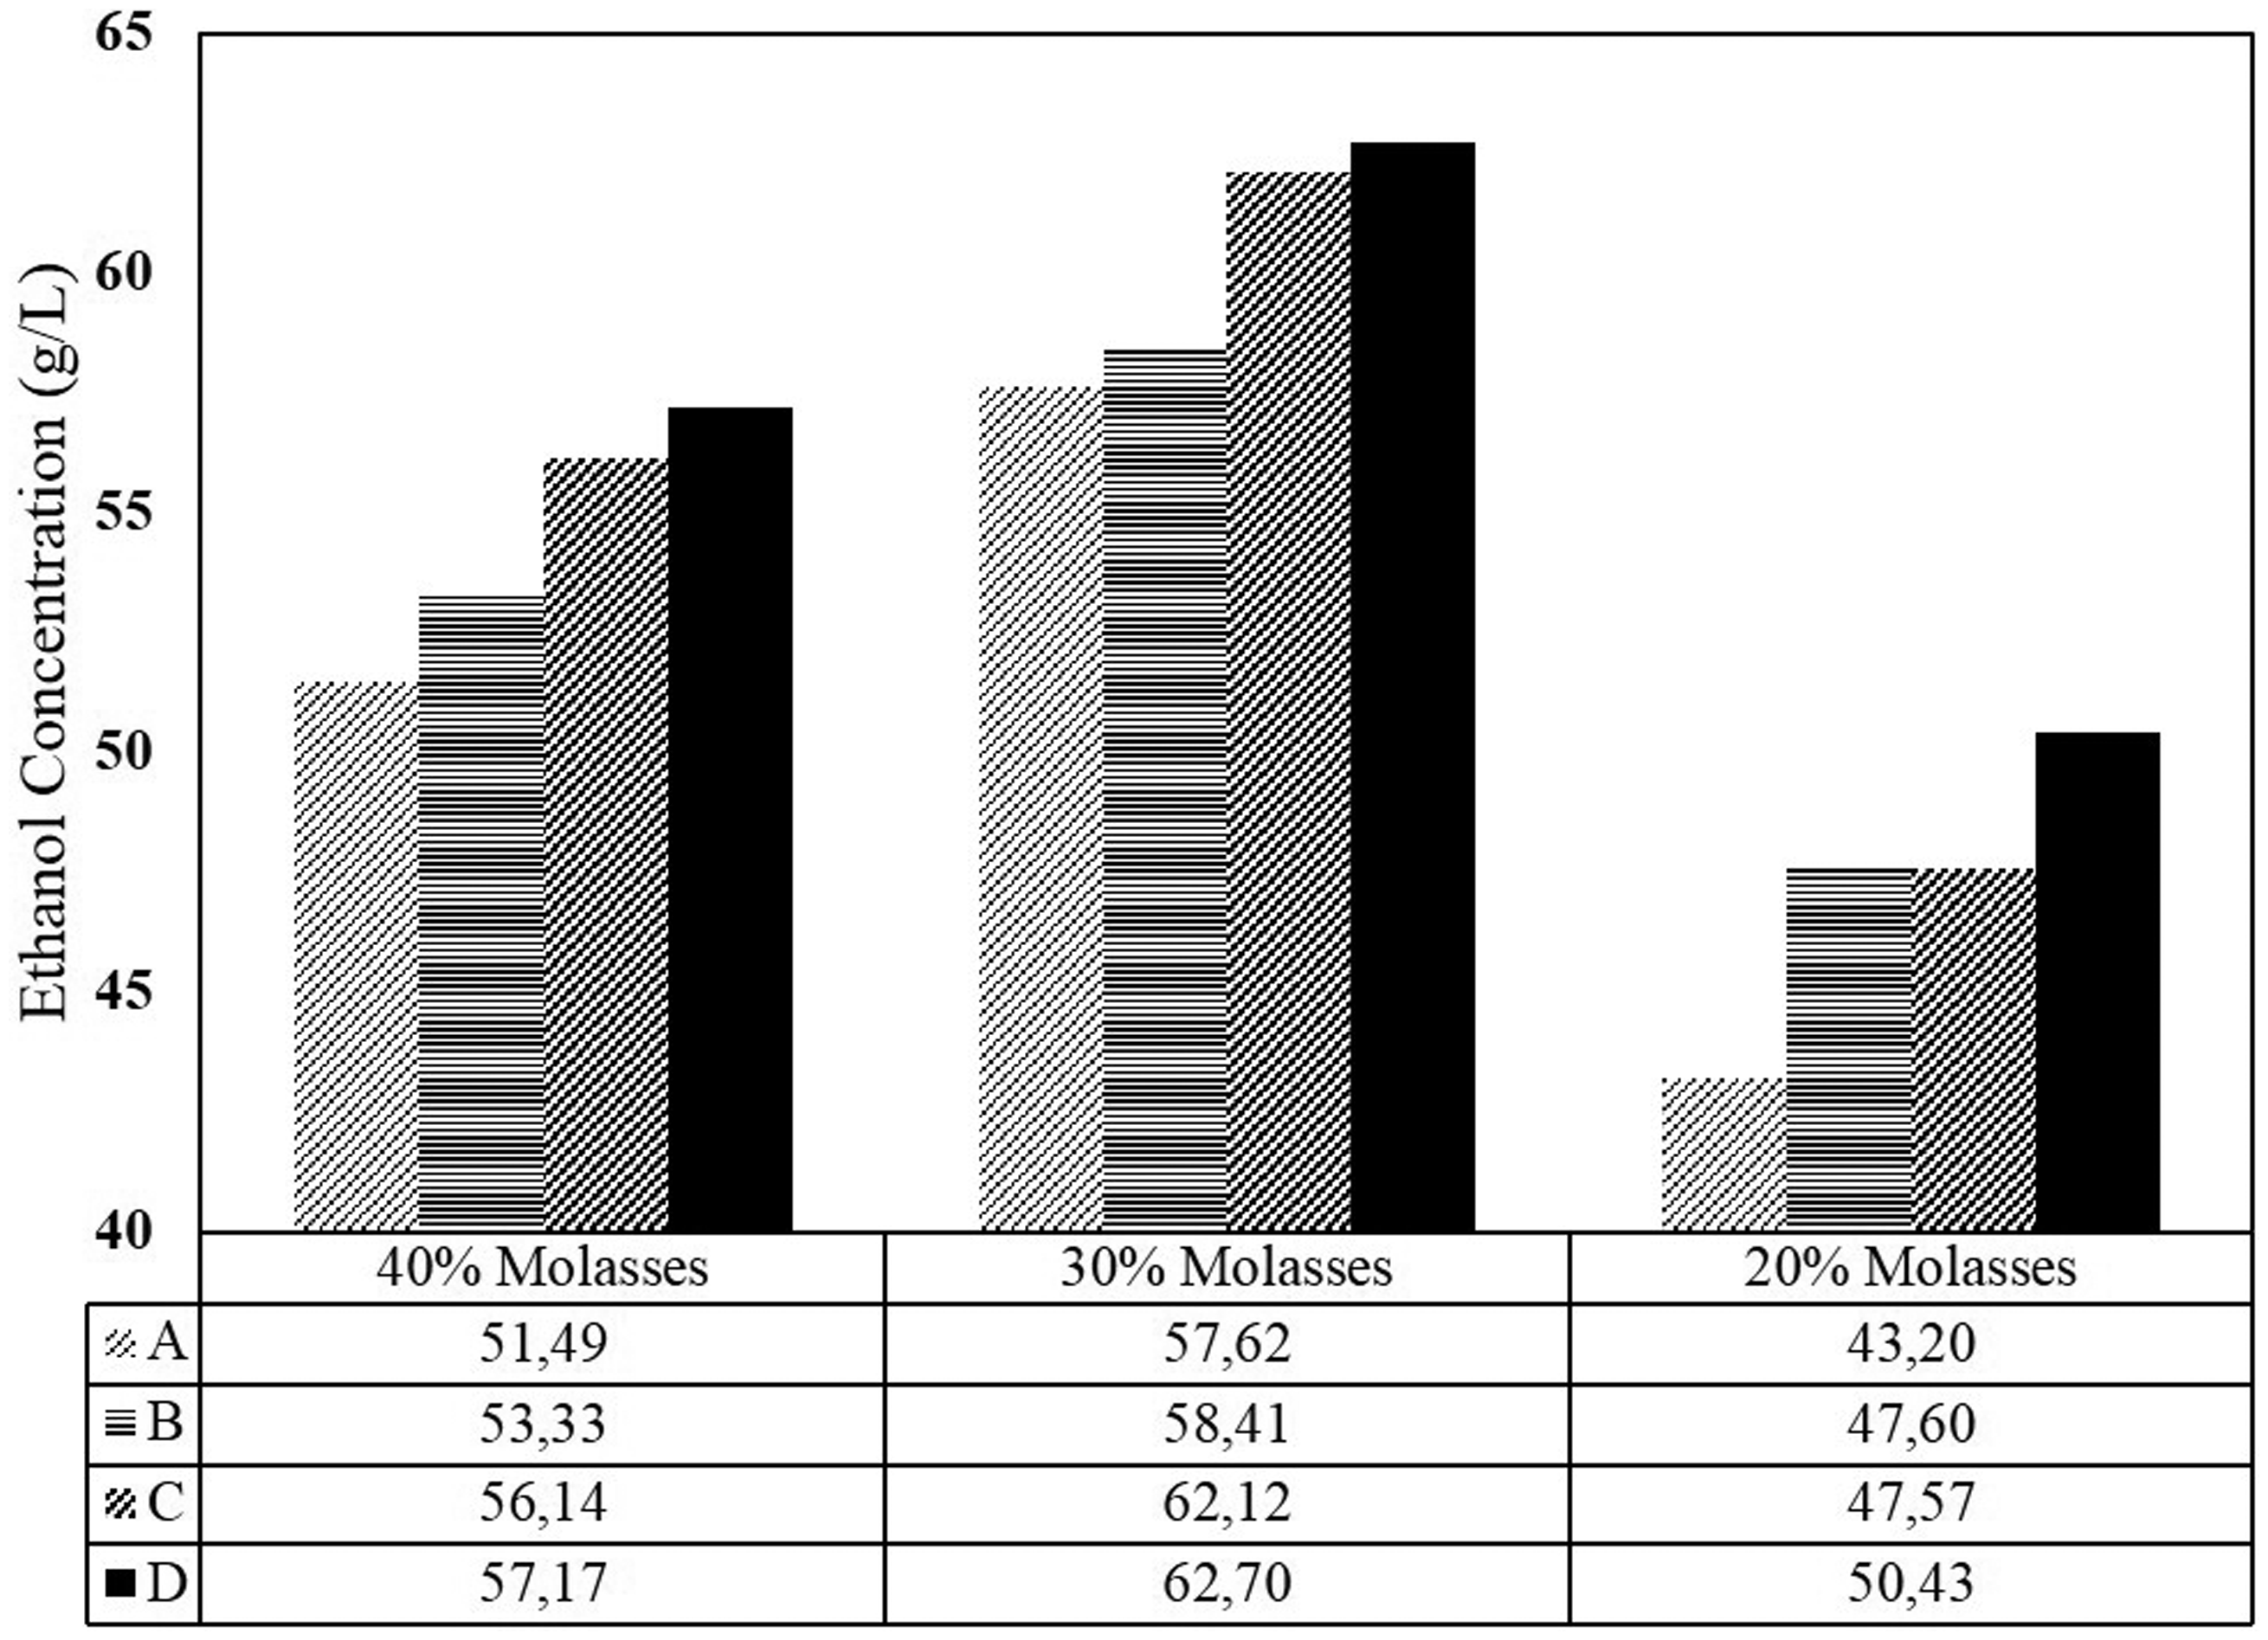
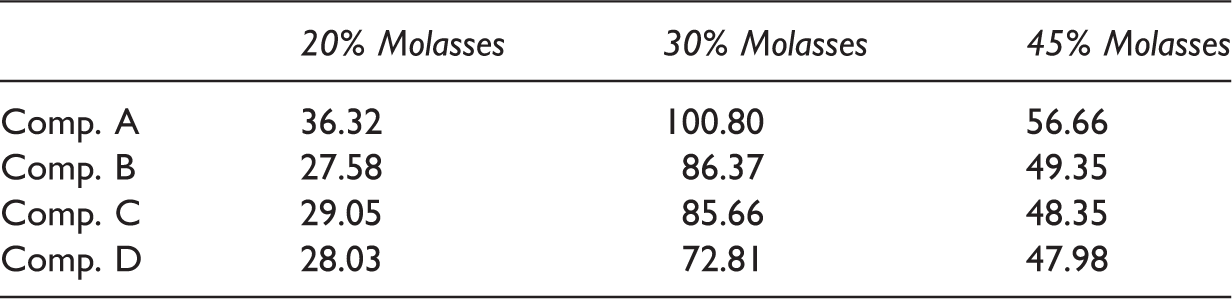
Additionally, for evaluating the yeast activity, three parameters are estimated, i.e. the sugar consumption, ethanol yield and fermentation efficiency (Figure 11). Unless there is no substrate inhibition (in this experiment caused by sugar concentration), the sugar was consumed high relatively (83.8% and 82.1%). However, It is only 63.1% sugar consumed when the molasses concentration was 45%. Concerning that the raw material is the defining factor in product prices, this condition must be avoided. Based on overall performance, the 20% molasses feed gives higher ethanol yield and fermentation efficiency.
The comparison of overall sugar uptake, ethanol/sugar yield, and fermentation efficiency for all feed molasses concentration.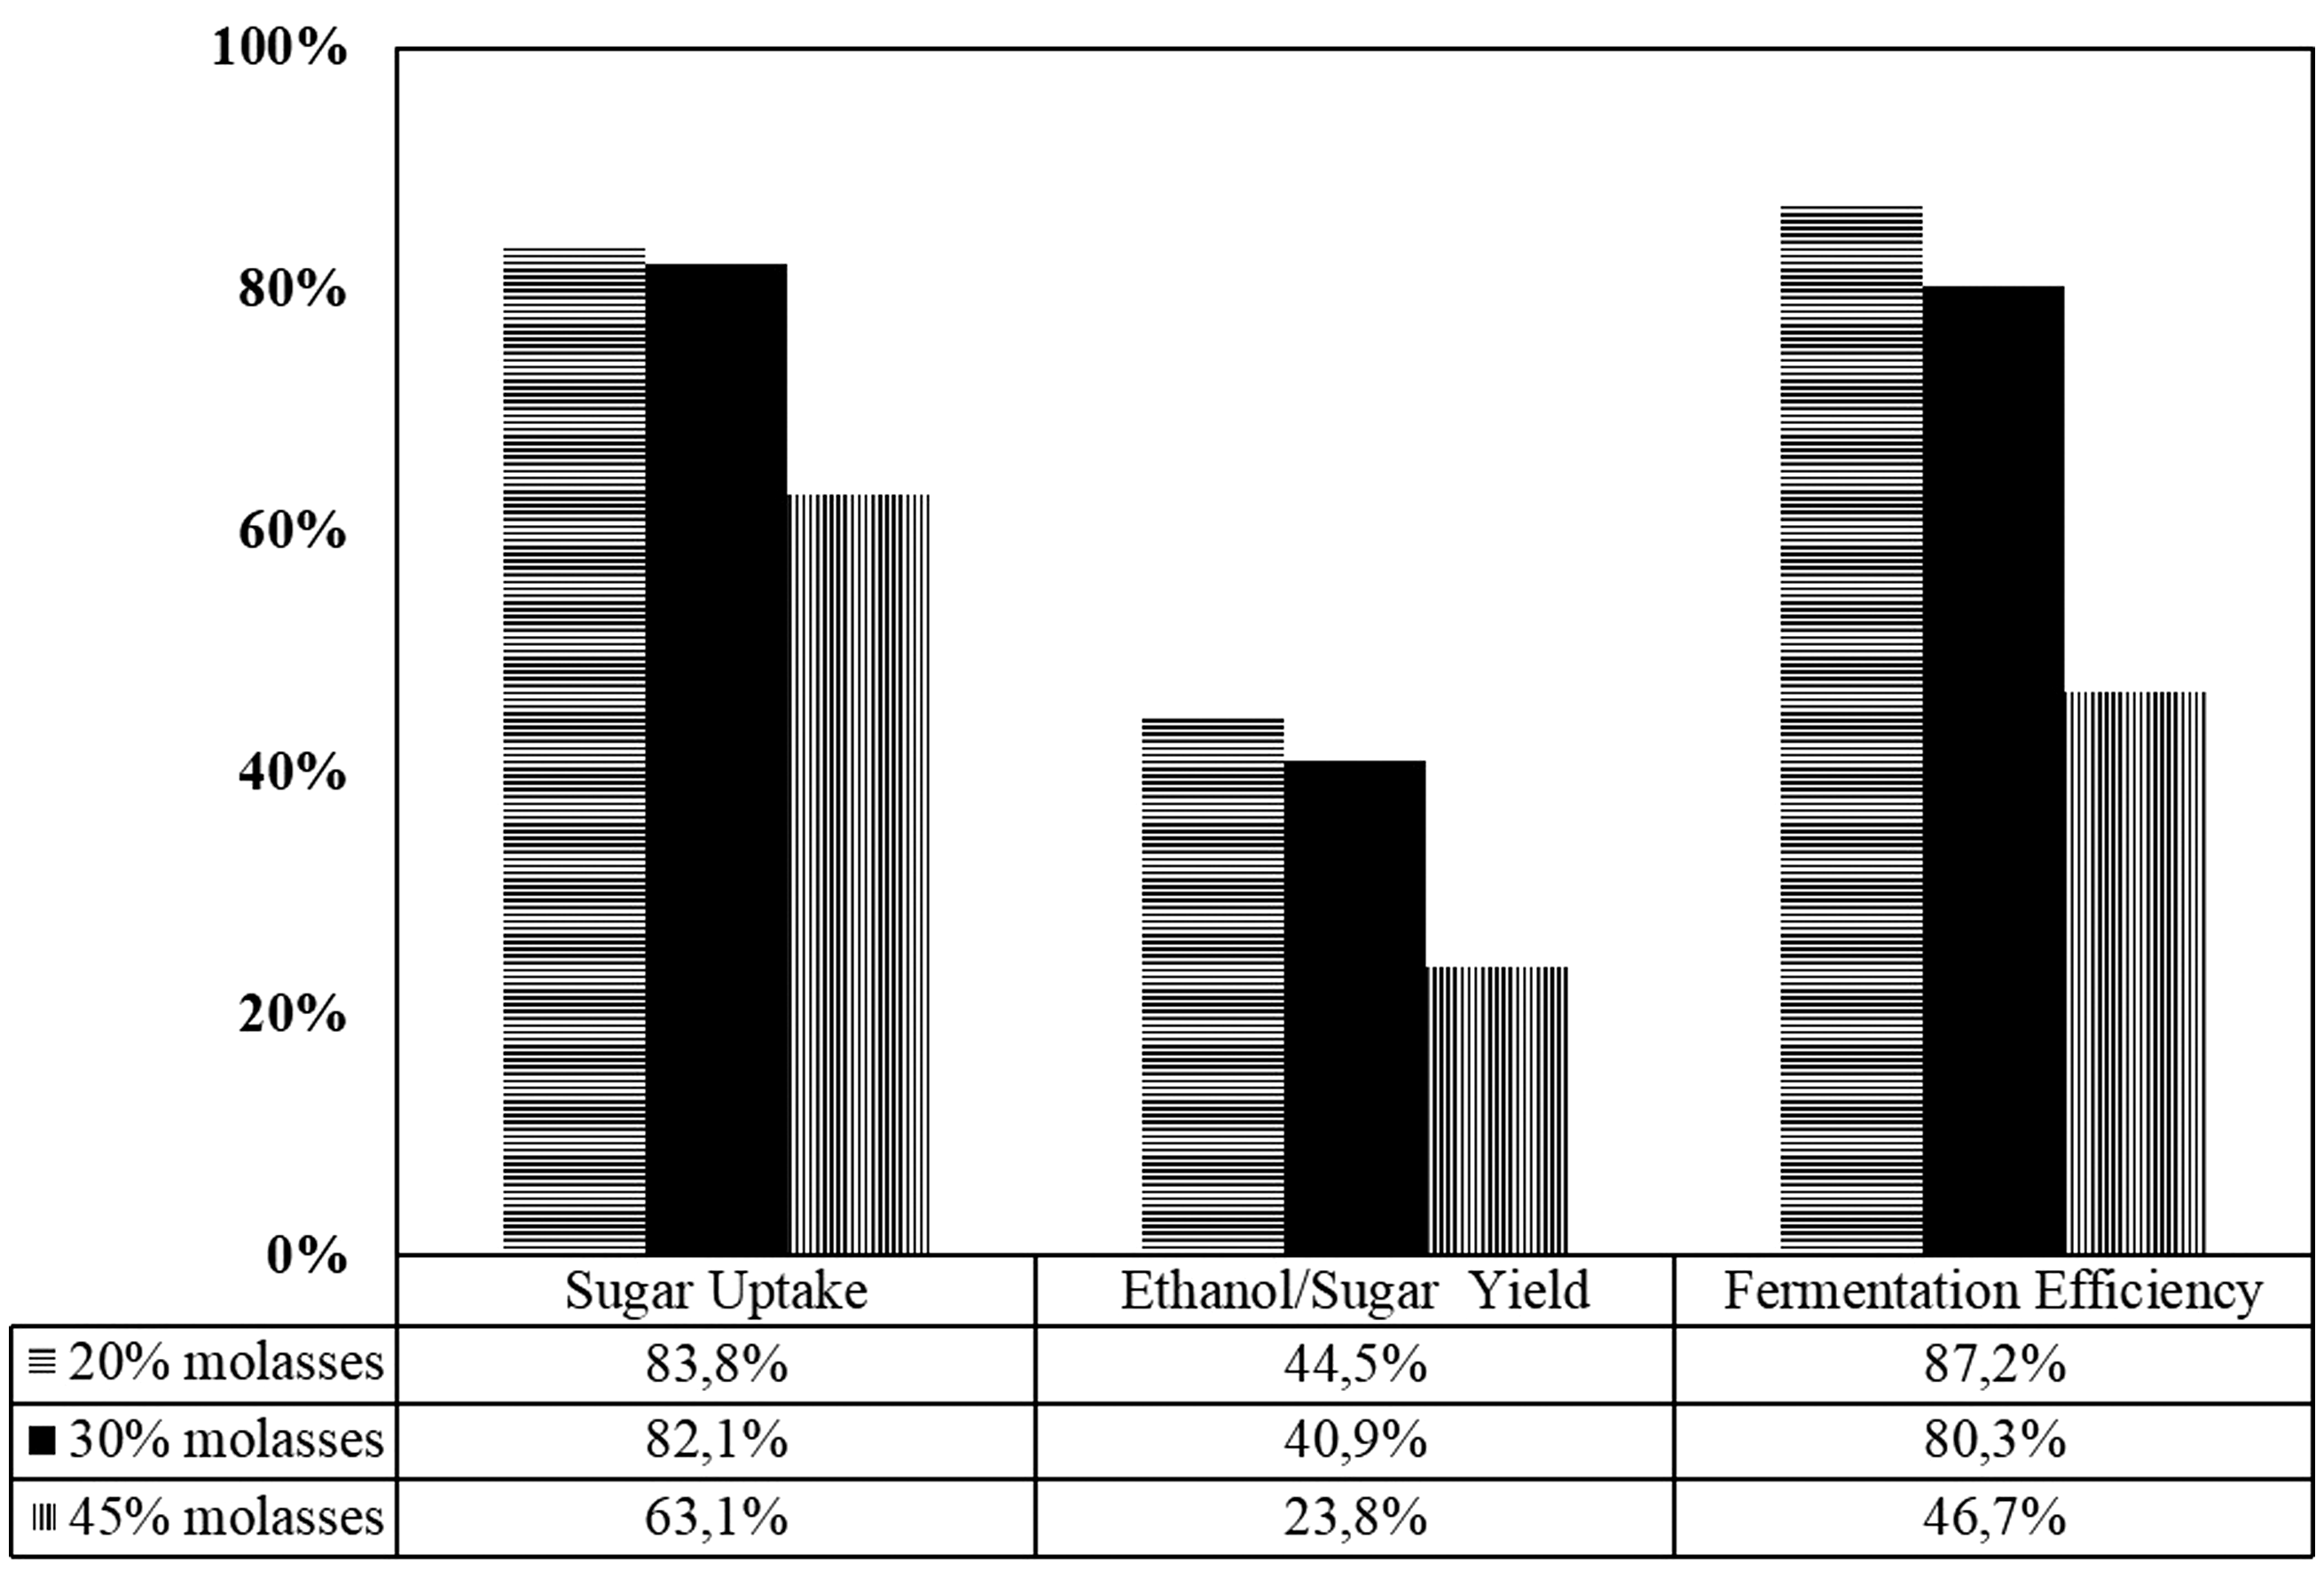
In extended fermentation mode for 340 h period, the productivity also observed to increase (Figure 12). The final productivity was 2.713 g/l h (72.34 g/l). This value was monitored stable until the end of fermentation time. The cells were still able to maintain their performance not only in their reaction activity but also in their viability (no density loss was observed during the process, see Figure 6). This process environment is better compared to the previous research (Tang et al., 2010) that found a decrease in cell viability for the long fermentation process. It is favorable in many cases, i.e. (1) saving time for reculture the yeasts cells that directly affected productivity; (2) in the cell recycle using a filter (Radocaj and Diosady, 2014), no filter is required to maintain cell density. Moreover, in cell recycle, it was observed that the cell productivity is reduced after the cell was reused again (Westman and Franzén, 2015). In this experiment, however, the productivity increased because the working yeast cells were always regenerated to maintain its age. It is the advantage of having an integrated aerobic–anaerobic process in one reactor.
The productivity of 168 and 340 h fermentation using 30% molasses feed.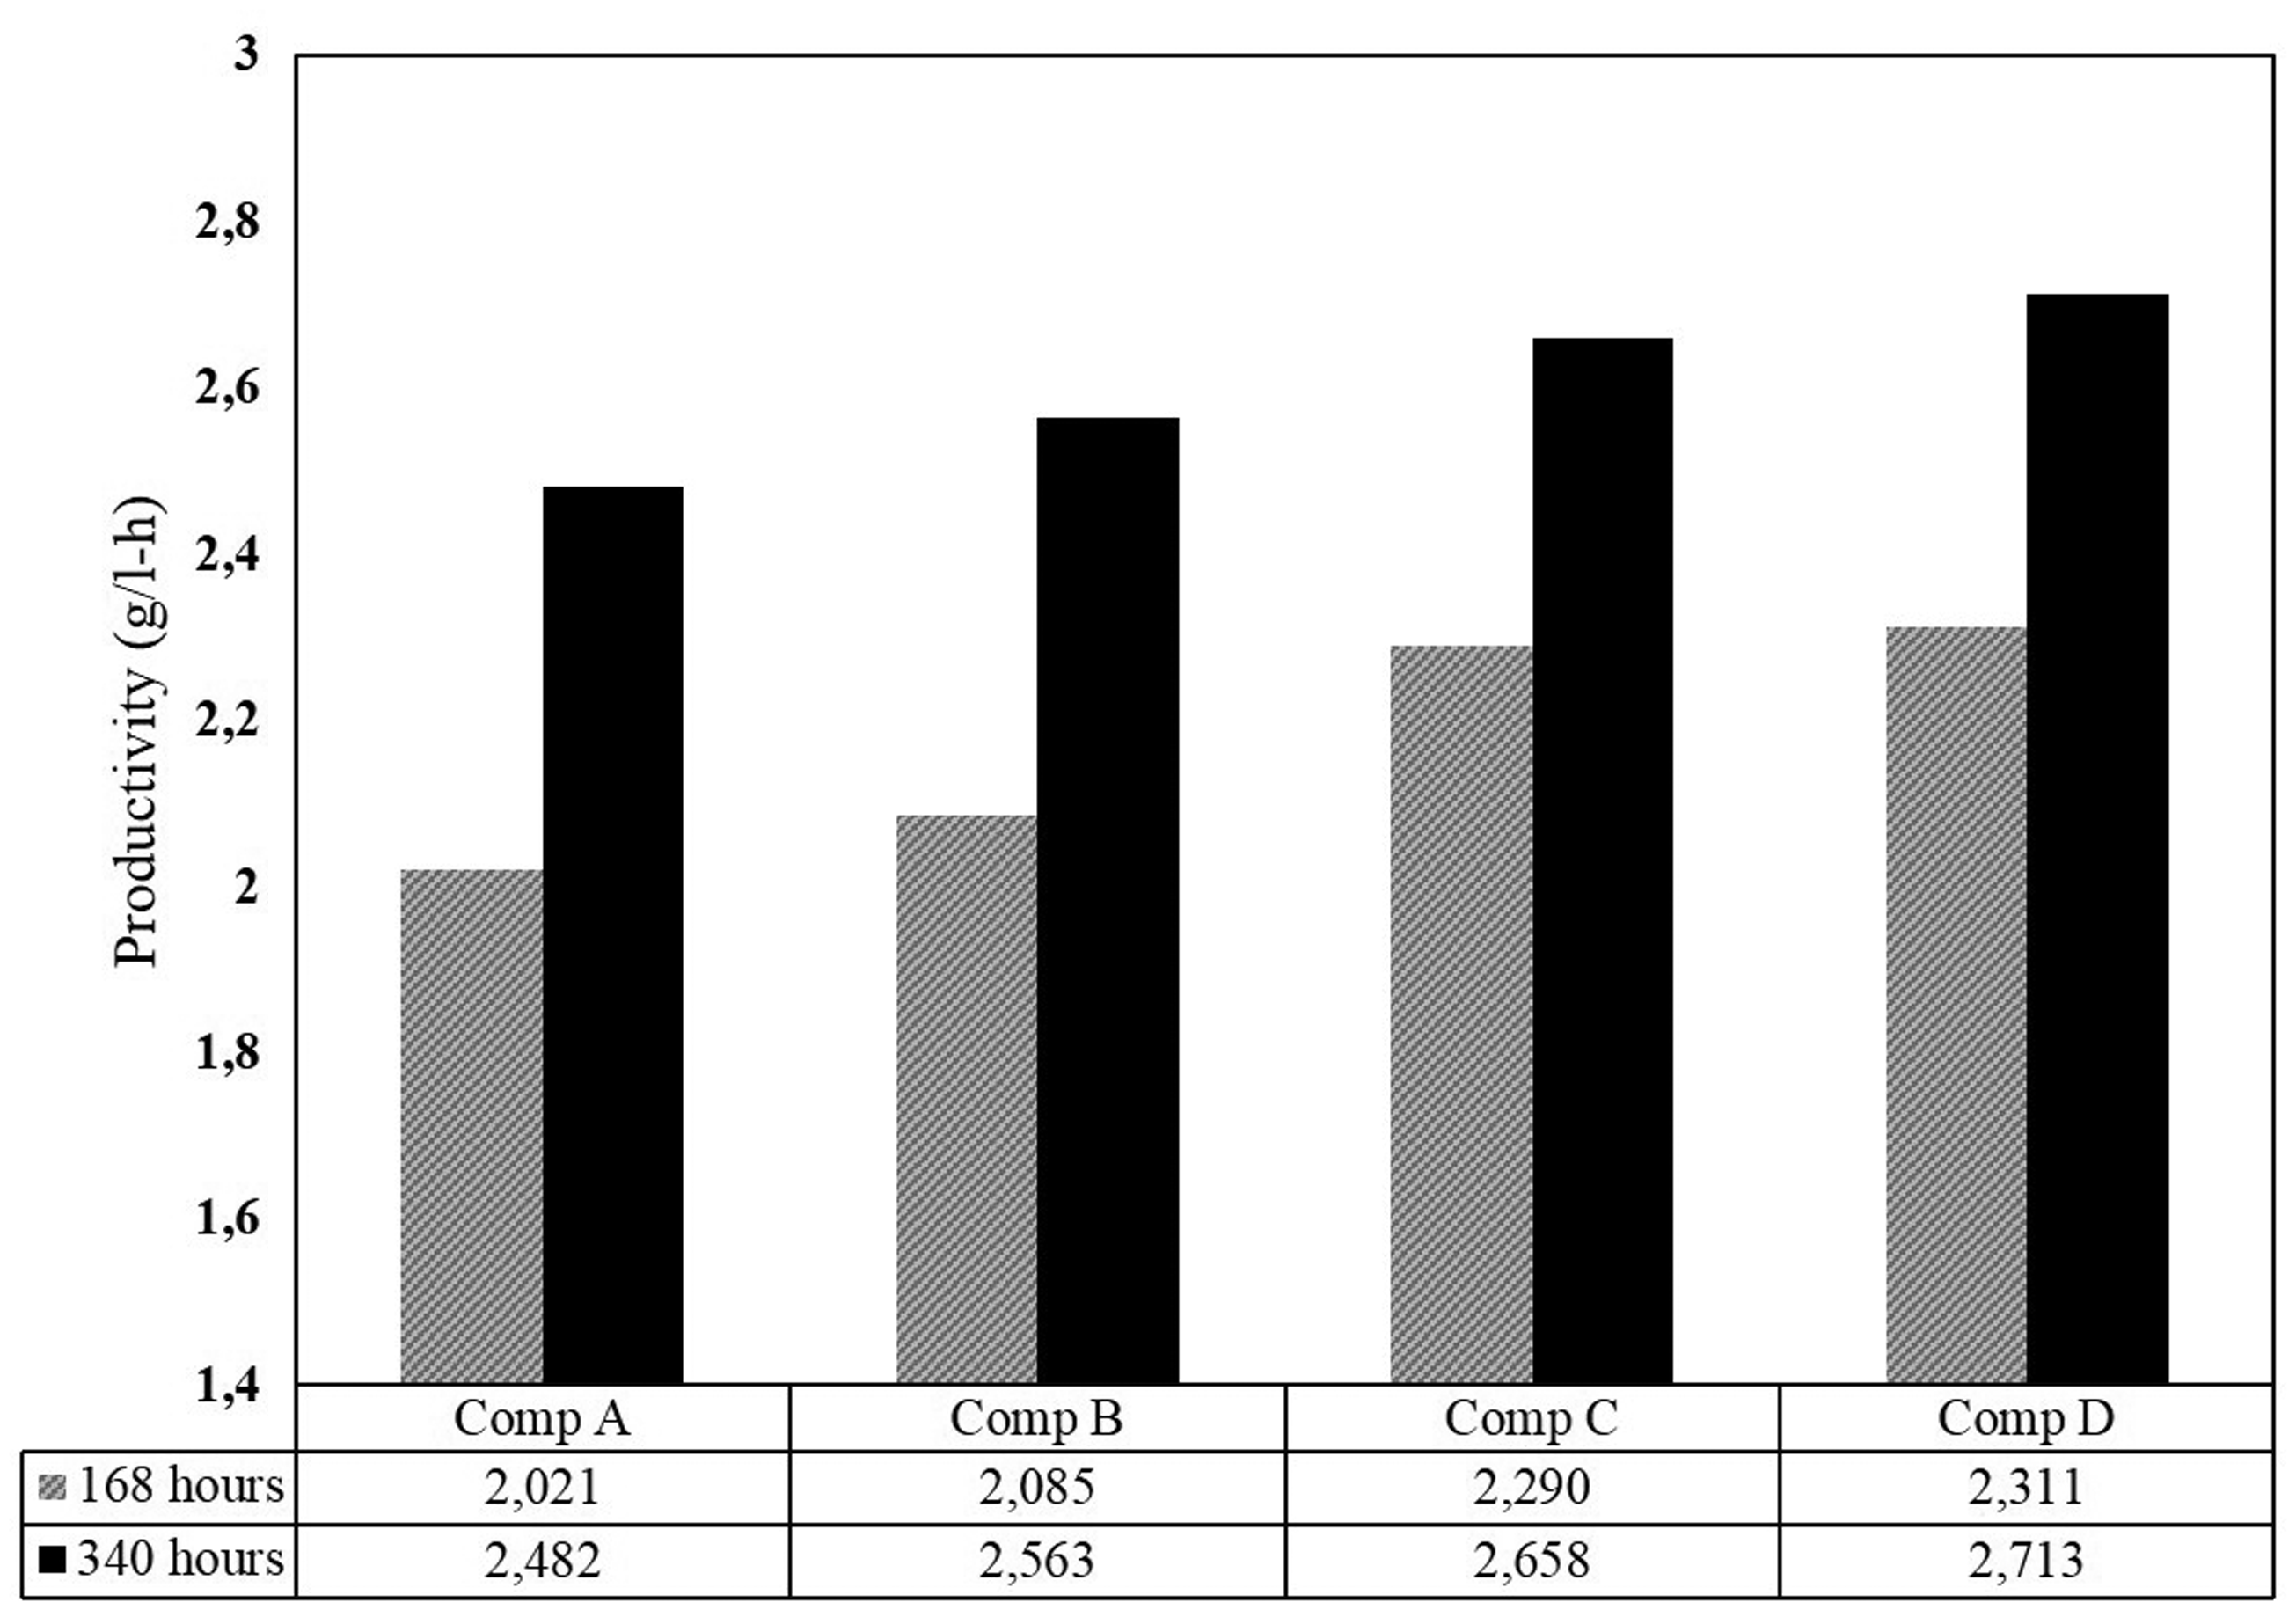
In loading shock test (Figure 7), the increase of sugar concentration in the feed was consistent with the concentration at the reactor. Moreover, after 452 h, the sugar in compartment A was as high as the output sugar in the compartment D. By this condition, there would be two possibilities that could explain it. First, no sugar uptake was done by the cell because the cell was no longer viable. Second, if the cell was still viable, then, the rate of consumption was lesser than the rate of sugar supply thus creating sugar accumulation inside the reactor. Figure 7(c) inferred that the cell would likely still be viable since the number of growing cell was still detected. Thus, the second option could explain better about the loading shock condition. However, if the evident showed that the cell was still viable, why the ethanol concentration decreased (Figure 7(b)). A possible answer was that sugar accumulation resulted in metabolism change to produce more cells other than ethanol as adaptation mechanism. It could happen if the cells inside the reactor were predominantly young cells. Figure 7(a) proved the activity of cells rises by increase in population, thus the cells inside the reactor were most likely young cells regenerated from compartment A. Therefore, it can be inferred that sudden change in process condition was unfavorable since it can change the metabolism pathway of cell that may result in decrease in ethanol productivity. As seen in Figure 7(b), the ethanol concentration decreases significantly from 8% to 2%wt.
Comparison of batch fermentation process.
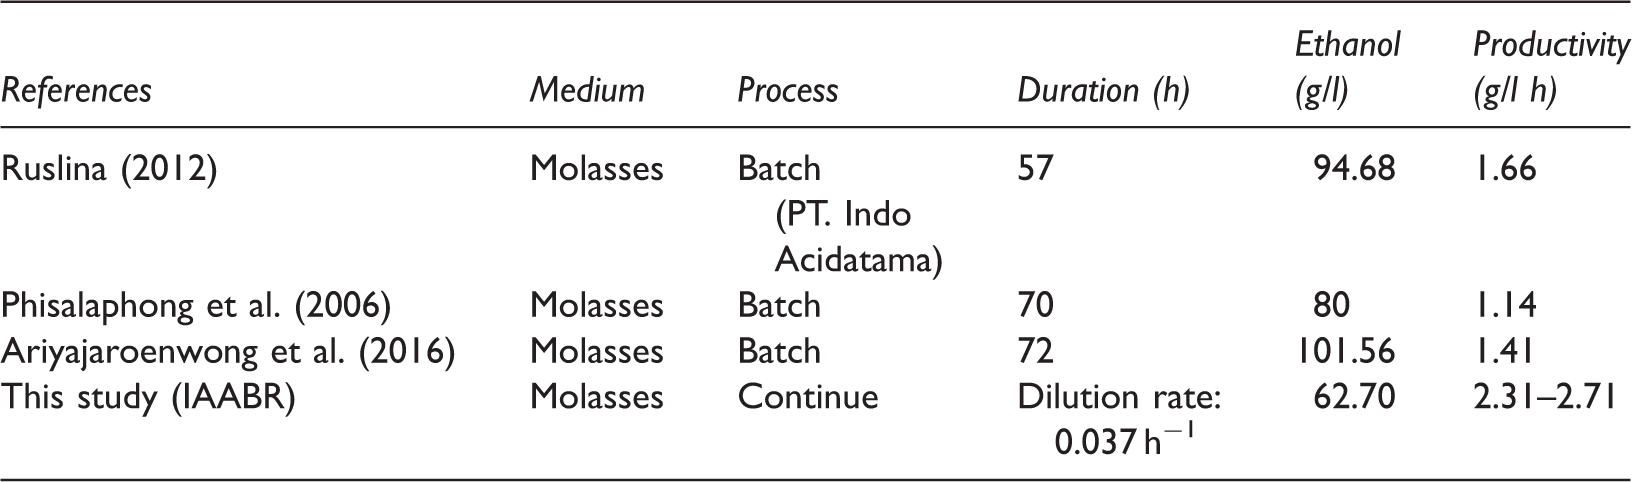
IAABR: integrated aerobic–anaerobic baffle reactor.
Conclusions
The IAABR as a continuous fermentation has been successfully producing ethanol from sugar cane molasses. We report the performance of IAABR under various sugars loading indicated by sugar to ethanol efficiency, ethanol concentration, and ethanol productivity.
The highest ethanol concentration was 62.70 g l achieved using 30% molasses for 168 h of fermentation. The productivity was also showing the highest value at 2.31 g/l h for that configuration. The ethanol concentration gradually increased from the compartment A to the compartment D. The highest fermentation efficiency was 87.2% acquired by 20% molasses. It is also seen that substrate inhibition occurred using 45% molasses resulted in the downgrade of fermentation efficiency to only 46.7%.
This investigation showed that IAABR could maintain the stability of fermentation for a long time. The effluent stream exhibits improved productivity from 2.31 g/l h (for 168 h) to 2.71 g/l h (for 340 h). Yeast density loss was unobserved during this process. The ethanol concentration decreased when it was treated by the shock loading test. Thus, the process parameter must be maintained to avoid the depletion of ethanol productivity.
The IAABR is a simple reactor design and stable without any control. The production capacity increased three times, and the productivity enhanced 1.4 times. However, it was occurred the depletion efficiency in the continuous system (IAABR) compared to the batch system. Generally, the IAABR has a prospect as the most beneficial for mass production scale of ethanol. The total cost (capital cost, maintenance cost, operational cost, etc.) of the IAABR is lower than that of the batch process. Thus, the price of ethanol can be reduced and could be an alternative energy competing on price with gasoline.
Footnotes
Declaration of conflicting interests
The author(s) declared no potential conflicts of interest with respect to the research, authorship, and/or publication of this article.
Funding
The author(s) disclosed receipt of the following financial support for the research, authorship, and/or publication of this article: The author acknowledge the financial support from Indonesia Government through The Ministry of Research Technology and Higher Education by scheme of PUPT research in 2016.