
Abstract
Structural investigations of Eocene coal from foreland basin of central Nepal Himalaya were subjected to attenuated total reflection Fourier transform infrared spectroscopy, X-ray diffraction, high-resolution transmission electron microscopy and scanning electron microscopy to study their chemical and structural characteristics. The attenuated total reflection Fourier transform infrared spectroscopy data show that the less matured coal sample (sub-bituminous) has more aliphatic moieties, whereas the relatively more matured (bituminous) coal samples contain higher fractions of poly-aromatic moieties and saturated long-chain hydrocarbons. Fourier transform infrared spectroscopy spectra reveals the presence of stretching vibrations of aliphatic –CH, –CH2 and –CH3 absorptions, –OH bonds, C=C and –CH of aromatic structures and C=O stretching vibrations of carbonyl groups. X-ray diffraction indicates the presence of crystalline carbon having turbostratic structure along with some highly disordered amorphous carbon while high-resolution transmission electron microscopy study shows the formation of carbon nanostructures of 1.73–8.03 nm size and nominal areas in the range of 11–14 nm2. Single-wall nanotubes of 12.67–36.23 nm diameters were also formed. The nominal size of the single-wall nanotubes is in the range of 16–20 nm. The presence of micro-pores, micro-fissures and micro-cracks were revealed in the scanning electron microscopy study.
Introduction
The heterogeneity of coal, consisting of macerals and minerals, reflects varied depositional environment and the nature of the organic precursors (Gupta, 2007; Singh et al., 2013a, 2013b). The structural characteristics of coal are more important and useful in predicting and controlling its effects on the chemical reactivity during combustion, pyrolysis, liquefaction and gasification processes (Singh et al., 2015a; Sonibare et al., 2010). The chemical, physical and structural characteristics of coal may vary depending on the environment of the paleomire. These are of paramount importance for understanding its potential utilization and often challenging to coal scientists and engineers (Gupta, 2007; Hattingh et al., 2013). A number of new analytical techniques have come-up, which include attenuated total reflection Fourier transform infrared spectroscopy (ATR-FTIR), X-ray diffraction, high-resolution transmission electron microscopy (HR-TEM) and scanning electron microscopy (SEM), and are useful in studying these coal characteristics (Everson et al., 2013; Hower et al., 2007; Lu et al., 2001; Mathews and Sharma, 2012; Painter and Snyder, 1980; Sharma et al., 1999, 2000; Supaluknari et al., 1990; Tran et al., 2008; Van Niekerk et al., 2008).
FTIR spectroscopy is extensively used for the study of molecular structures of coal (Painter et al., 2012; Solomon and Carangelo, 1982, 1988) and provides important information on the function of organic compounds (Orrego-Ruiz et al., 2011). It helps in assigning the particular bands to various functional groups (Li et al., 2007; Painter et al., 2012; Solomon and Carangelo, 1988; Stuart, 2005) such as the aromatic or aliphatic nature of a CH bond as well as an organic or inorganic nature of a hydroxyl (OH) bond (Singh et al., 2015b). XRD is a non-destructive method used for understanding the structural characteristics of carbonaceous materials (Iwashita and Inagaki, 1993; Lu et al., 2001). The X-ray intensities of coal (Iwashita and Inagaki, 1993; Lu et al., 2001; Maity, 2006) can determine the aromaticity (fa), interlayer spacing of the crystalline structure (d002) and crystallite sizes (La, Lc). HR-TEM and SEM are widely accepted techniques for the characterization of carbon nanomaterials, including nanoballs and nanotubes, and help in understanding the surface microstructures in coal (Aqel et al., 2012; Dosodia et al., 2009; Pan et al., 2016; Qiu et al., 2002; Tian et al., 2004; Velasco-Santos et al., 2003; Wang et al., 2006; Zelenskii et al., 2012).
Study of carbon nanotubes (CNTs) is being given more impetus by the coal scientists (Iijima, 1991; Kroto et al., 1985; Monthioux and Kuznetsov, 2006). Owing to their unique structure and properties, CNTs have wide applications in computer science, microscopy, telecommunications, nanomechanics, biological sciences, catalysis, chemical sciences and electronics (Dosodia et al., 2009; Qiu et al., 2002; Yu et al., 2003). Coal is the cheapest and abundantly available carbon source that can be used for such purpose (Awasthi et al., 2015).
In Nepal Himalaya, the occurrence of coal is reported from Quaternary, Miocene, Eocene and Cretaceous horizons. The Quaternary lignite occurs in Kathmandu valley, the Miocene coal in Siwalik sub-Himalaya, the Eocene coal in western and central Nepal and the early Cretaceous coal in eastern Nepal (Aryal, 2000; ESCAP, 1993). Due to thin coal seams (1.1–3.5 m), complicated geology and a lack of systematic investigation, the coal mining in Nepal is not well organized. The Department of Mines and Geology (DMG) of Nepal has reported the occurrence of coal seams in Palpa district of central region of Nepal. However, the chemical and structural characteristics of these coals have not been studied systematically (Aryal et al., 1997; Paudyal and Sah, 2004; Sakai, 1991; Sharma et al., 1999).
In this paper, the ATR-FTIR, XRD, HR-TEM and SEM techniques have been used to study the chemical and structural characteristics of sub-bituminous to bituminous coal samples from central Nepal Himalaya. The study would help in identifying the potential utilization of these coal resources.
Geological setting
The coalfields of the foreland basin are distributed in Surkhet-Dang (western), Palpa (central) and Barahachhetra (Eastern) regions of the Nepal Himalaya (Aryal, 2000); Nepal lies in the central region of the Indian subcontinent (Figure 1(a)). Jhadewa coalfield is located in the central region of Palpa district, mid-western Nepal (Figure 1(a) and (b)). The coal-bearing strata occurs within the Bhainskati Formation of Eocene period (Sakai, 1983) which is shown in the lithostratigraphic column (Figure 1(b)). The Bhainskati Formation, which conformably overlies the Amile Formation and underlies the Dumri Formation (Neupane et al., 2017), largely consists of coal, shale, dark muddy limestone and hematite beds (Sakai, 1989). The coalfields bounded by a number of folds and small scale faults. Presently, there are seven active coal mining sites which produce 5–6 tons of coal per day. The coal-bearing horizon is highly sheared with imbricate faulting. However, the coal seems are fairly tabular and continuous.
(a) Geological map around Jhadewa coalfield (modified after Sakai, 1983) showing the location of coal field. (b) Lithostratigraphic column of the investigated region (after Neupane et al., 2017). Jahadewa coalfield is located on the upper section of Bhainskati Formation.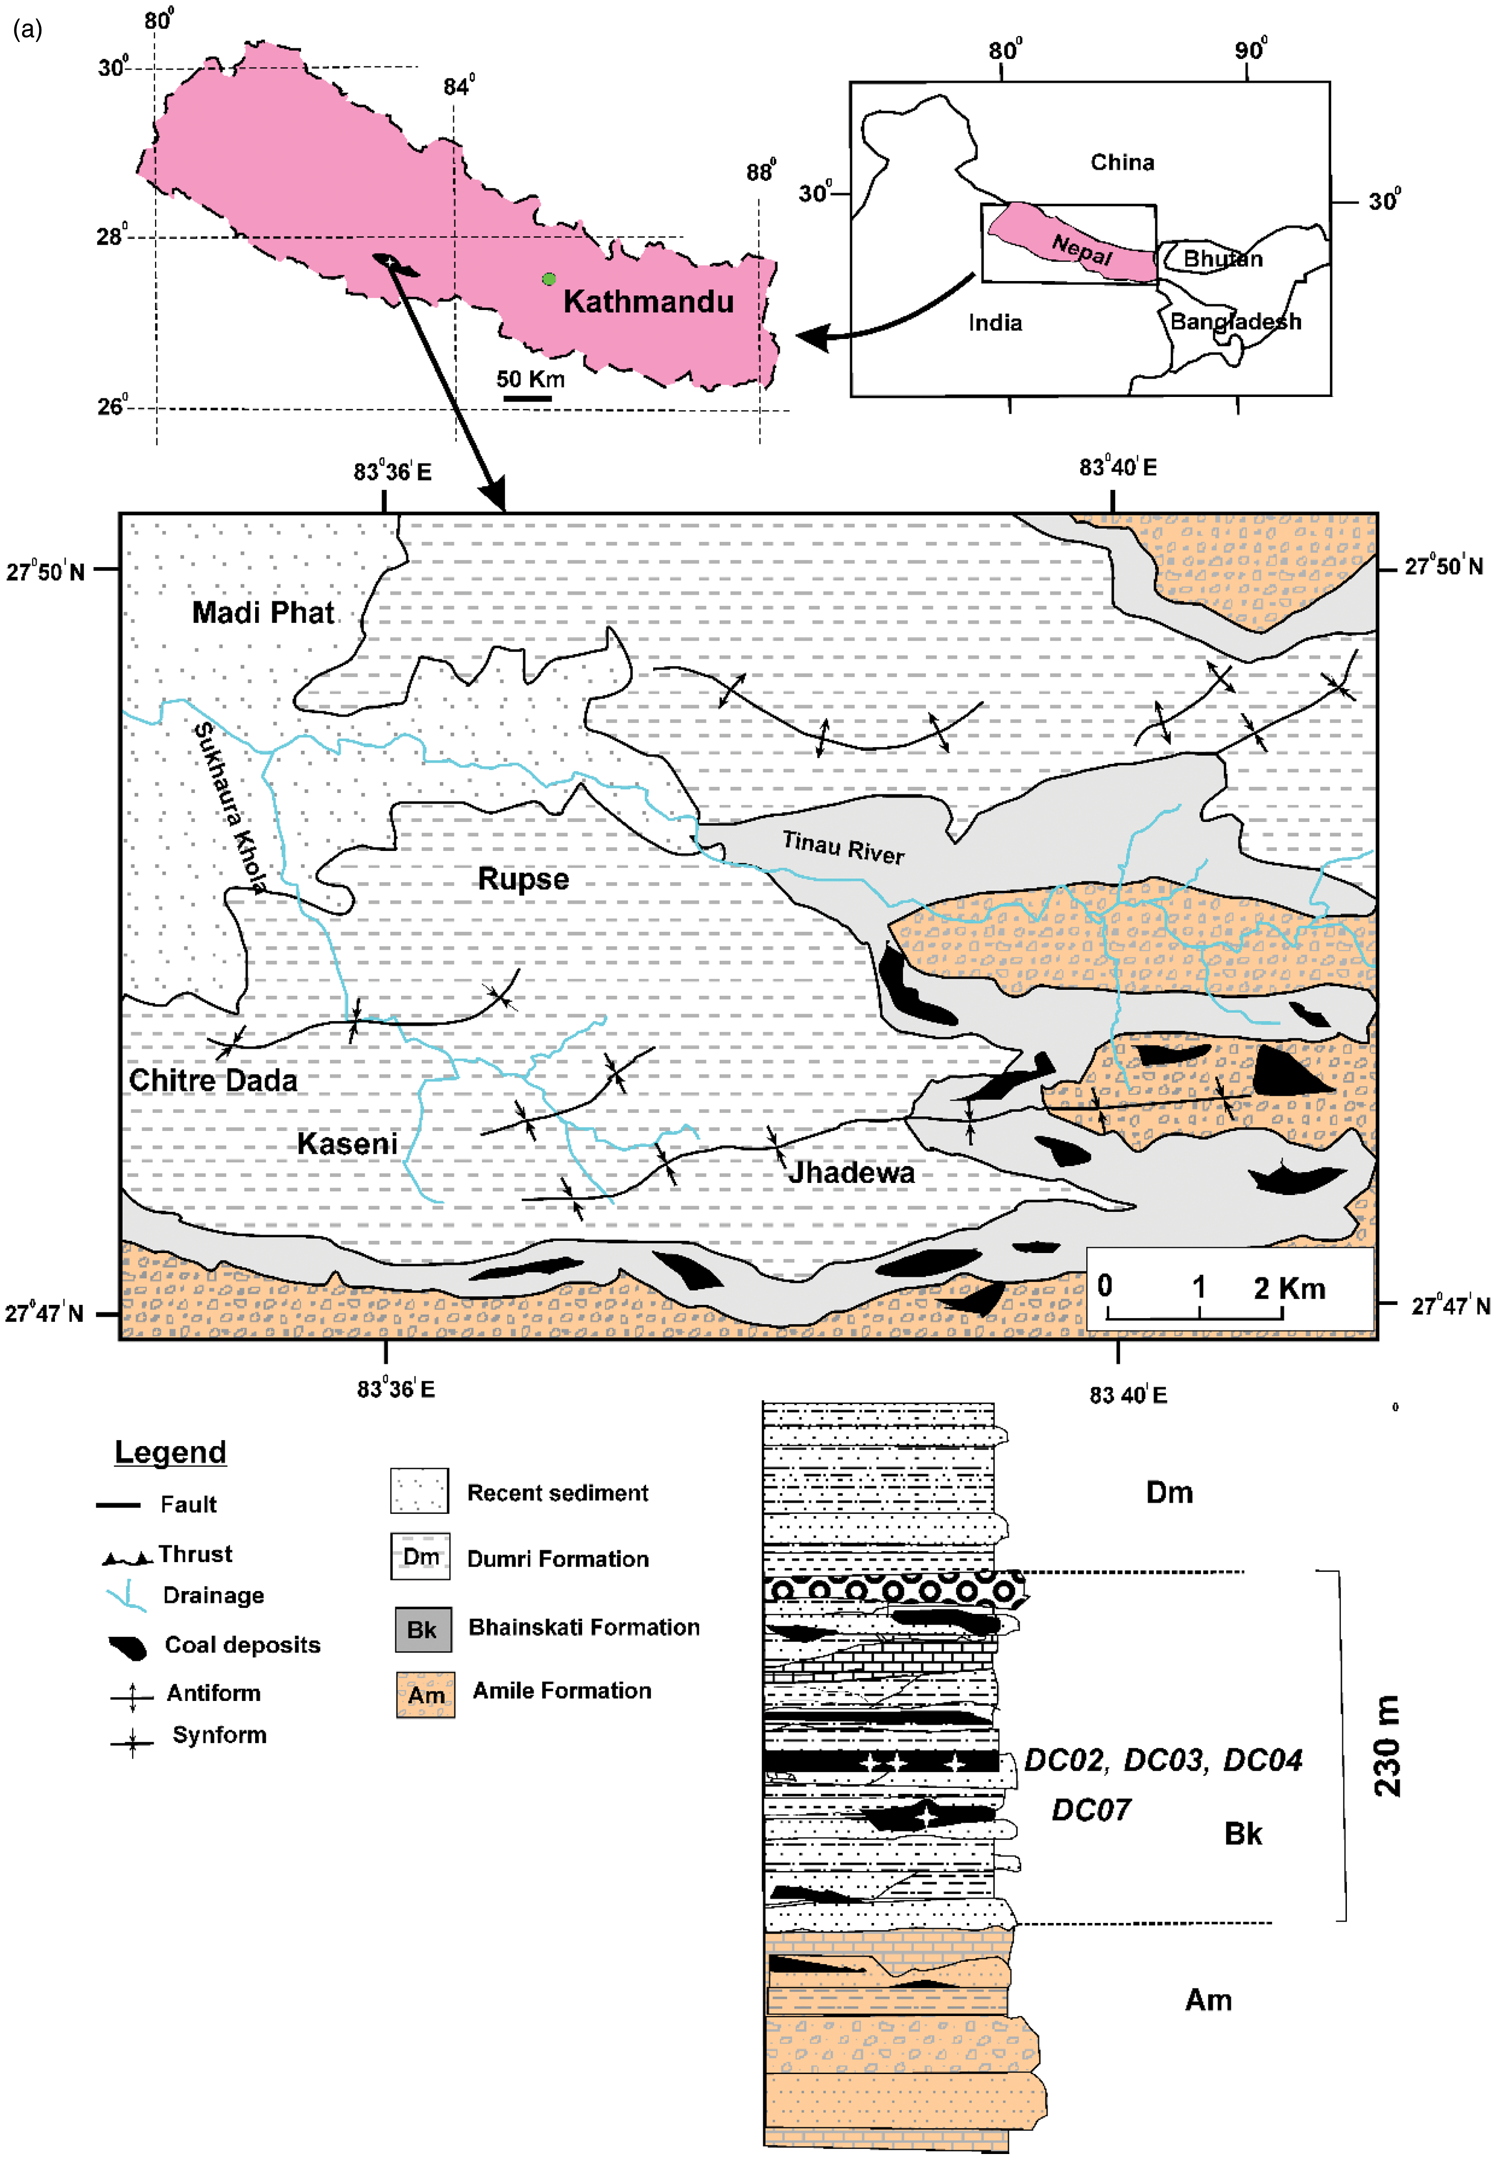
Method of study
Samples and sample preparation
The coal samples were collected from the working face of Jhadewa coalfield of Palpa District, central Nepal. The collected coal samples (∼1 kg per samples) were smashed and sieved to a size fraction of 0.074–0.2 mm for proximate analysis, according to the ISO 11760 standard.
Experimental methods
Petrographic analysis
Four coal samples were crushed, reduced to −18 mesh size for petrographic analysis. Samples for organic petrography were prepared by polishing the particulate mount and the analysis was carried out under Axioskop-2 plus biological microscope. The vitrinite reflectance measurements were carried out on collotelinite maceral using a MPV-SP microscope photometer.
The ultimate analysis (C, H, N, S and O) was performed using a Vario EL-III Analyzer. The proximate analysis was carried out in the same laboratory using oven and muffle furnace as per BIS, 2003. For organic carbon content, the samples were treated with hydrochloric acid to remove the carbonates. The analysis was carried out using a Leco carbon-sulfur analyzer.
Fourier transform infrared spectroscopy
FTIR spectroscopy techniques elucidate the functional groups present in coal (Coates, 2000; Speight, 1994; Van Niekerk et al., 2008). The FTIR spectra and peak assignments provide semi-quantitative and quantitative data (Mastalerz and Bustin, 1993; Orrego et al., 2010; Painter et al., 1987; Xuguang, 2005). The FTIR spectra of raw coal and heated coal (at 350℃ on oven) samples were recorded over a range of 500–4000 cm−1 at resolution of 4 cm−1 on a Bruker VERTEX 70.
X-ray diffraction analysis
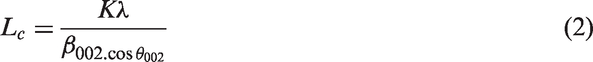
The X-ray diffraction spectra were obtained in an X-ray diffractometer (Bruker AXS D8) with Cu Kα radiation (40 Kv, 40 mA) in the angular range of 10°–80° (2θ) with 0.02° step interval and a scanning rate of 3° per minute. An Origin-pro software was used for deconvolution of the diffractograms in 2θ region of 15°–32°. The broad peak in this range is fitted to two Gaussian peaks at approximately 20° and 26°, namely, the γ-band and the d002 band, respectively. The d002 band indicates spacing of aromatic ring layers, while γ reflects the packing distance of saturated structures (Dosodia et al., 2009). The average carbon crystallite lattice parameters, namely, the inter-layer spacing (d002), crystallite height (Lc), crystallite diameter (La) and average number of aromatic layers per carbon crystallite (Nave), were determined using the empirical Bragg’s and Scherrer equations (Equation (1) to (5)) (Iwashita et al., 2004; Lu et al., 2001; Okolo, 2010; Roberts et al., 2015; Van Niekerk et al., 2008)


The f
a
of the studied coal samples was determined using equation (5) as shown above. Coal rank was determined from the peak intensities (I) at position 20° and 26° using following equation (6) (Yoshizawa et al., 2002)

High-resolution transmission electron microscopy
For the HR-TEM, approximately 5 g of air dried coal sample was thoroughly crushed and mixed with an alkali mixture (1:1 ratio of NaOH and KOH); this was carefully carried out in a dehumidifier chamber to minimize moisture absorption (Das et al., 2016). The mixture of retort with the coal and alkali mixture was inserted into the furnace of a quartz fixed-bed reactor (19-mm internal diameter), with a temperature programming system in an inert atmosphere, heated up to 350℃ and kept at this temperature for 1 h (Das et al., 2016). The coal sample was obtained after the retort was removed and cooled. The HR-TEM images of the coal samples acquired with the transmittance electron microscope (TEM; JEOL-12 EX, resolution: 0.23 Å, accelerating voltage: 60–120 kV) were used for this characterization. Image analyses were performed on the HR-TEM micrographs using the ‘Image-J’ program (software version 1.47) to calculate the size of the nanoparticles (Burger et al., 2009).
Scanning electron microscopy
Chips were taken out from the selected coal samples and were examined under a Hitachi S-480 high-performance computer-controlled SEM. Before subjecting the coal samples to SEM study, the coal chips were coated with gold to make them conductive.
Results and discussion
Chemical and petrographic structure
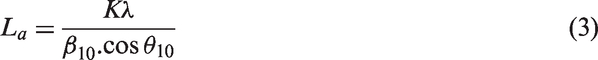
Proximate and ultimate analyses of coal samples along with sample location.
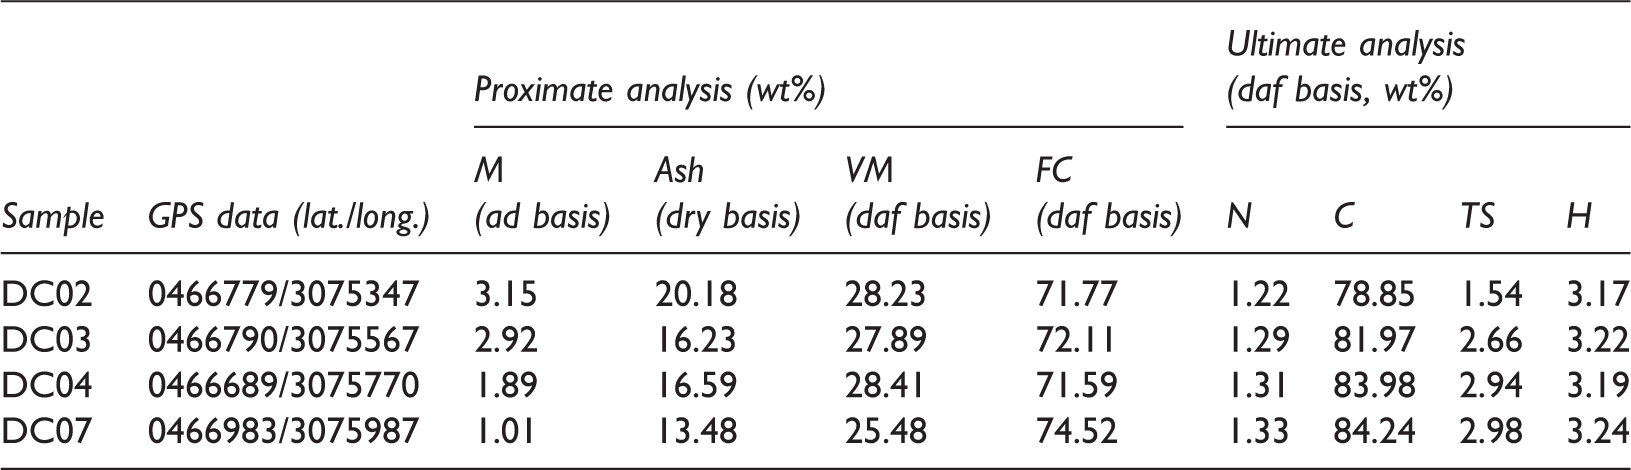
M: moisture; VM: volatile matter; FC: fixed carbon; ad: air dried; daf: dry ash free; N: nitrogen; C: carbon; H: hydrogen; TS: total sulfur.
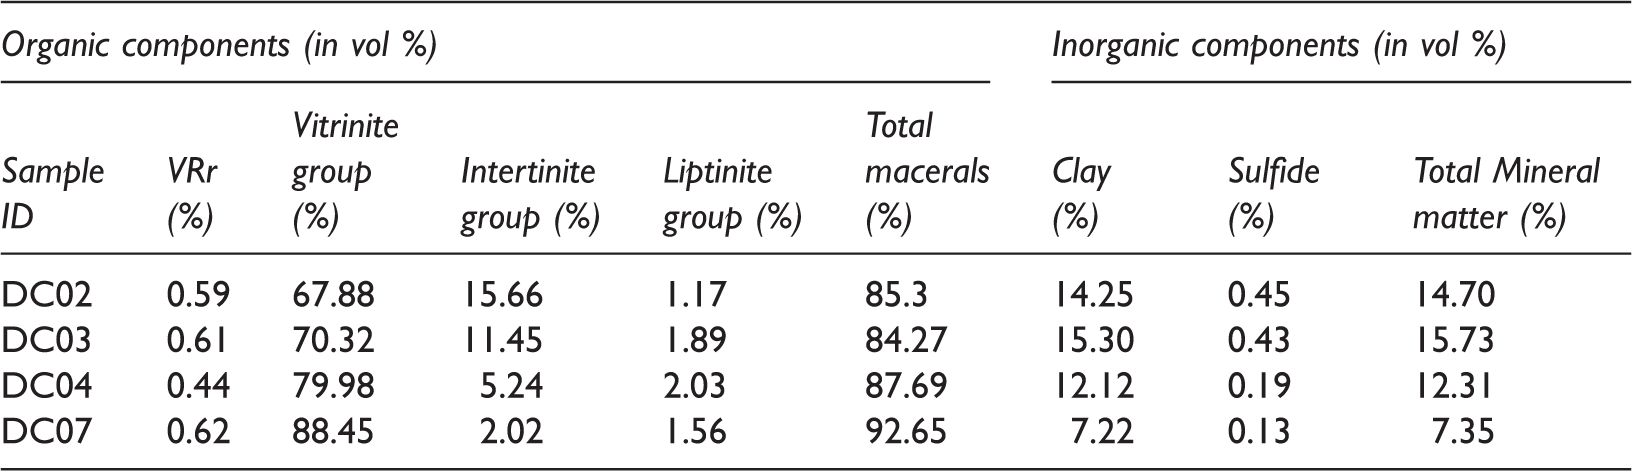
Maceral composition of Central Nepal coals.
Fourier transform infrared spectroscopy
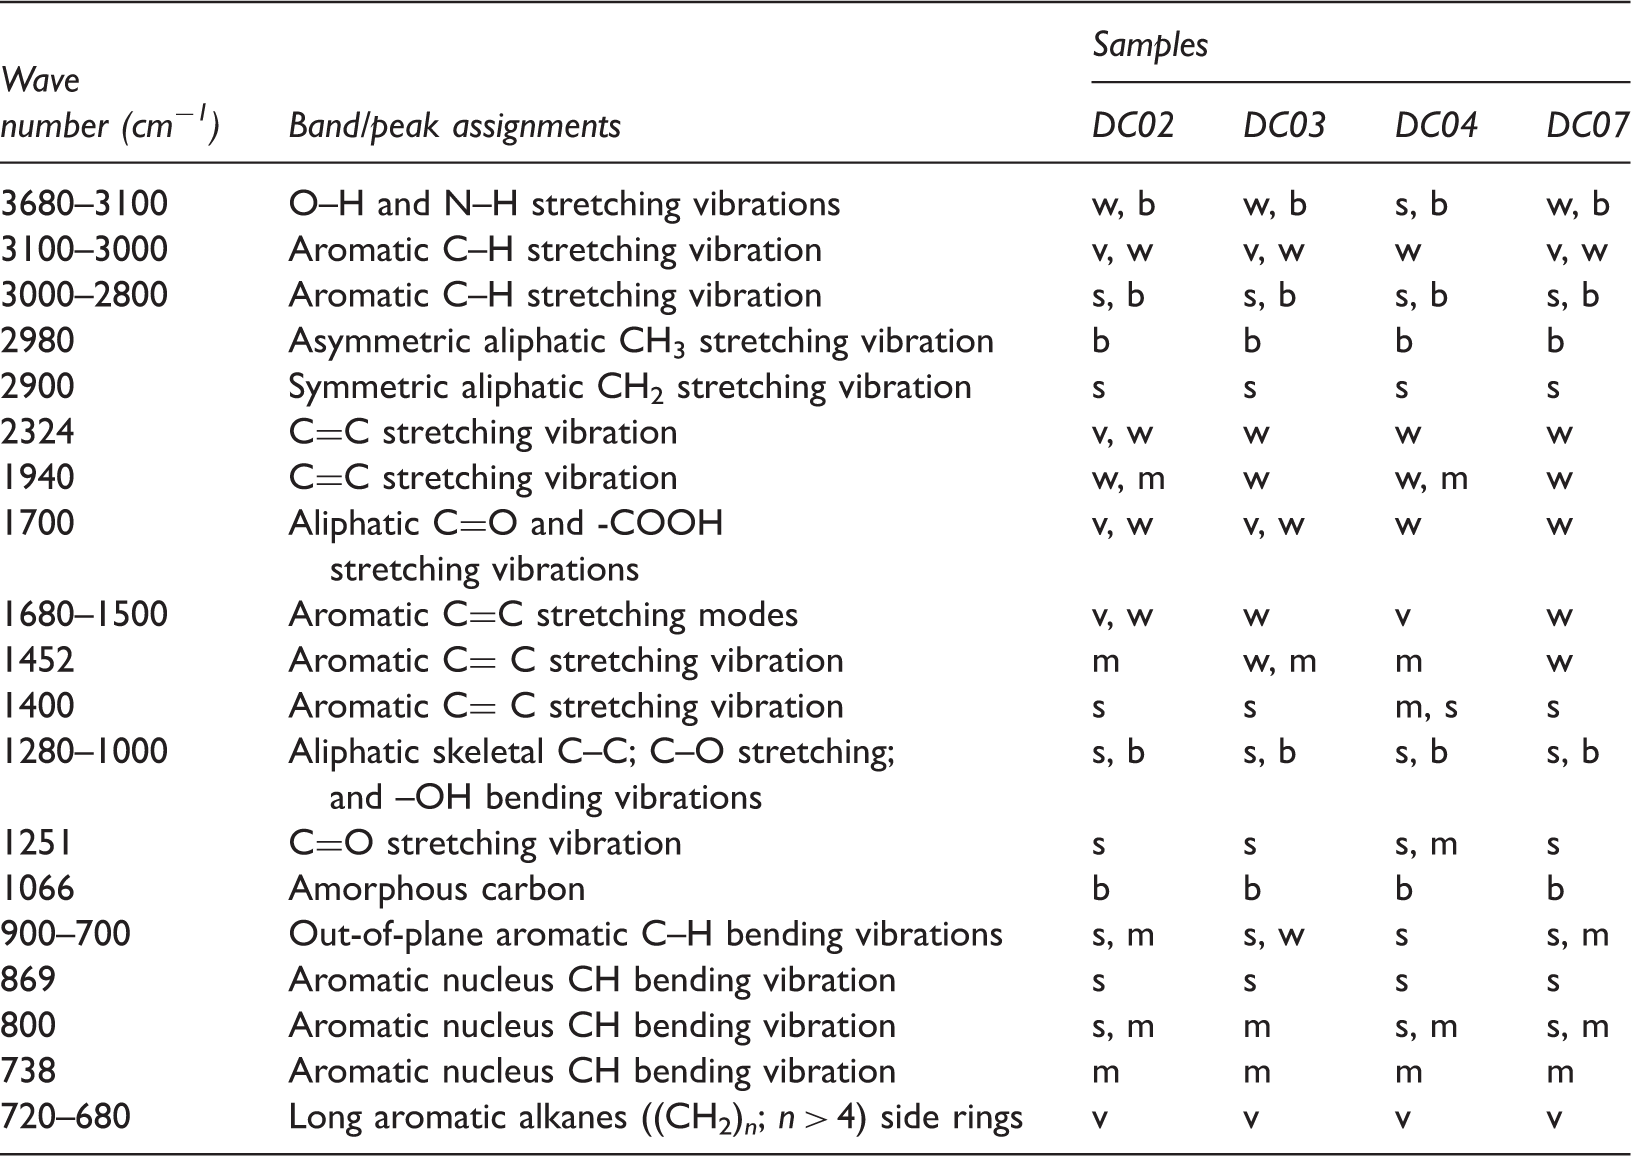
Carbon nanomaterials show distinct FT-IR absorption peaks based on their geometry, which is very useful for purity measurements of carbon nanomaterials (Aqel et al., 2012). The FTIR spectra of the representative four coal samples were obtained to see their structural features (Figure 2). The assignments of the FT-IR analyses of the four samples (DC02, DC03, DC04 and DC07) are summarized in Table 3. Broad region, 3700–3670 cm−1 observed in all four coal samples, is assigned to O–H and N–H groups (Saikia et al., 2009). The broader peak of the O–H stretching-vibration is attributed to high O/C and H/C ratios of coal. The –OH group in raw coal could be associated with either clay minerals, such as illite, kaolinite, montmorillonite or halloysite containing absorbed/interlayer water/structural OH groups, or other minerals containing water of crystallization such as gypsum, mirabilite or rozenite (Geng et al., 2009; Maity, 2006; Mukherjee and Srivastava, 2006). Spectral peaks observed in the region of 3000–2800 cm−1 were assigned to C–H stretching modes due to aliphatic side chains. The distinct peak at 2970–2985 cm−1 (Figure 2) is due to CH3 symmetric vibrations (Mohan and Manoj, 2012). The weak peaks at approximately 1700 cm−1 were assigned to the aliphatic C=O and –COOH stretching vibrations due to the presence of acids, ketones and aldehydes (Speight, 1994; Xuguang, 2005). The spectral peaks observed at ∼1680 cm−1 and 1500 cm−1 were assigned to the stretching of C=C bonds in the aromatic structure vibration of aromatic rings or aromatic nucleus (Painter et al., 1983; Van Niekerk et al., 2008; Xuguang, 2005) and possibly also to C=O stretching vibration of carbonyl groups. The bands near 1450 cm−1 and 1394 cm−1 were mainly due to CH2 asymmetric deformations and symmetric bending of the CH3 group in bridges, respectively. The greater intensity of the 1406 cm−1 peak relative to the 1379 cm−1 peak indicate the presence of long aliphatic side groups or methylene bridges between aromatic rings in the coals (Baysal et al., 2016). The prominent bands in the 1245–1000 cm−1 region were assigned to saturated aliphatic skeletal C–C vibrations, C–O stretching vibrations of ether groups, and O–H bending vibrations in phenolic, phenoxy and hydroxybenzene structures (Okolo et al., 2015; Van Niekerk et al., 2008; Xuguang, 2005). Most of the peaks between 1250 cm−1 and 400 cm−1 in these spectra were assigned to the quartz, clay minerals, such as kaolinite, illite and montmorillonite (Mukherjee and Srivastava, 2006; Saikia et al., 2007, 2009). For the two heated coal samples (DC04 and DC07), the distinct peaks at approximately 1153 cm−1 were assigned to quartz, while broad and intense bands observed at approximately 1020 cm−1 were assigned to kaolinite minerals (Figure 2). Low intensity aromatic –CH bands were observed between 900 and 700 cm−1 in all the samples. These bands were due to aromatic C-H out-of-plane bending vibrations (Basayal, 2016). The small peaks appearing at approximately 700–680 cm−1 were attributed to long aromatic alkane ((CH2)
n
, n > 4) side rings (Coates, 2000; Malumbazo et al., 2011; Xuguang, 2005).
FT-IR spectra of Jhadewa coal samples. Peak assignment of FTIR spectra of studied coal samples. s: Strong; b: broad; w: weak; m: medium; v: variable.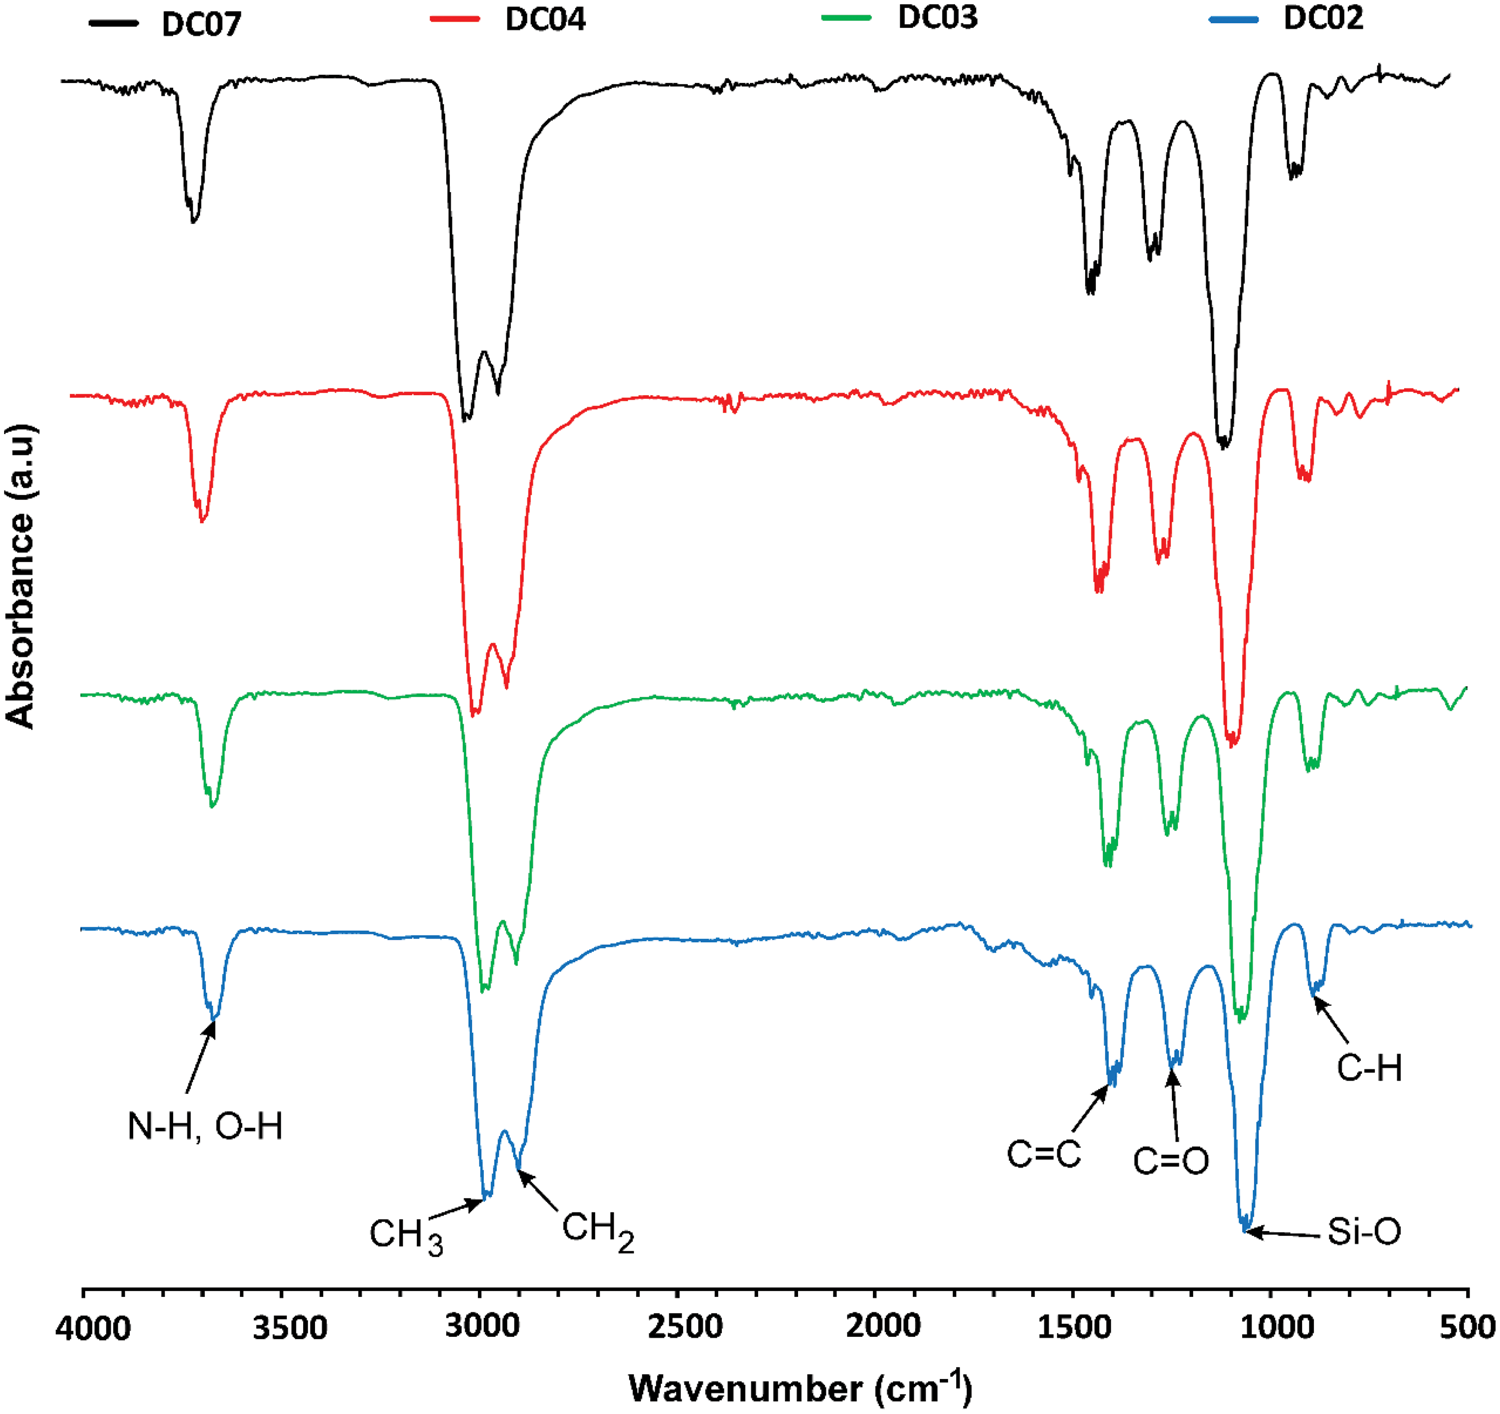
X-ray diffraction
X-ray diffraction profiles of the coal samples are presented in Figure 3 and exhibit characteristics of coal: 20°–30° theta (002 peak) and 40°–50° theta (10 peak), where the intensities at the 002 band are higher than those at the 10 band. Samples containing graphite-like structures (crystalline carbon) were indicated by the presence of a clear (002) band at ∼26° and a (10) band in the neighbourhood of graphite (100) at ∼45°. High background intensity of the samples indicates the presence of highly disordered materials in coal in the form of amorphous carbon. All samples exhibit minor peaks due to residual pyrite (Okolo et al., 2015). Normally, coal is considered to contain two types of carbon structures, crystalline carbon and amorphous carbon; crystalline carbon refers to a turbostratic structure, and amorphous carbon refers to any non-aromatic carbon (Lu et al., 2001). The crystallites in all the coal samples have intermediate structures between graphite and amorphous state (turbostratic structure or a random layer lattice structure) (Sonibare et al., 2010). The diffraction profile illustrates the presence of a clear asymmetric (002) band at approximately 26°, which indicates the existence of another band (γ) on its left hand side. Many workers have observed the (γ) band at approximately 20°, and attributed it to the presence of saturated structures such as aliphatic side chains attached to the edge of coal crystallites (Lu et al., 2001; Painter et al., 2012; Yen et al., 1961).
XRD spectra of Jhadewa coal samples.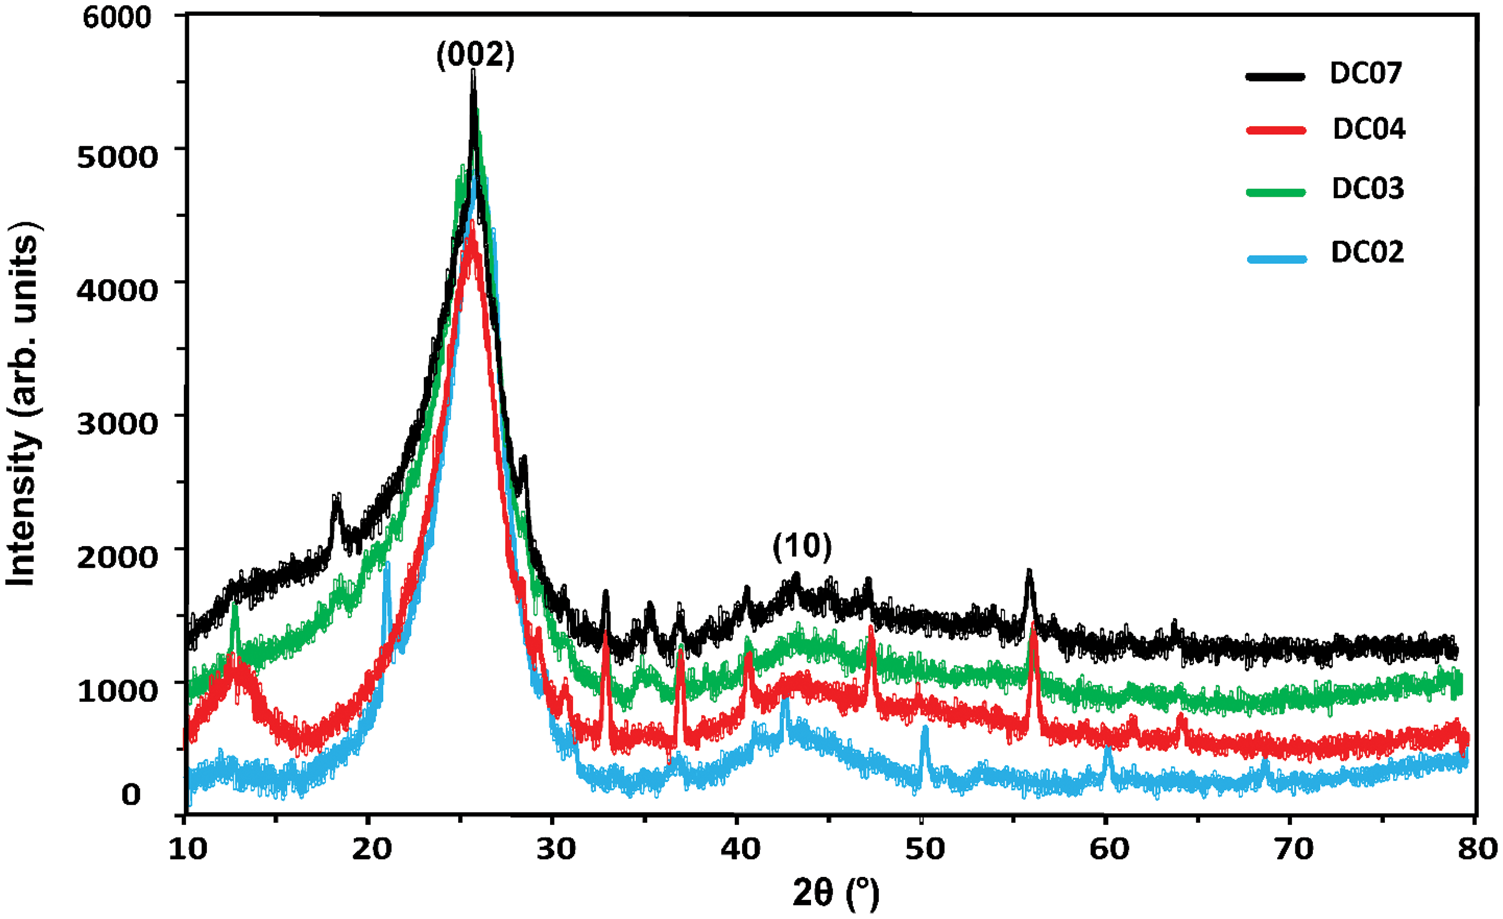
Representative fits of two Gaussian peaks (γ and (002) peaks) for the bands at approximately 20° and 26° of the coal samples are shown in Figure 4. The peak positions, intensity, area and full width at half maxima (FWHM) were calculated from after curve-fitting the 002 and γ bands. These structural parameters of all the samples (DC02, DC03, DC04 and DC07) are listed in Table 4.
Curve-fitting of two Gaussian peaks for DC03 coal in 2θ range 10–30°. Dots indicate the measured intensities and the solid lines (blue, green and red) represent the fitted curves. Summary of the structural parameters extracted from the curve-fitting of XRD spectra.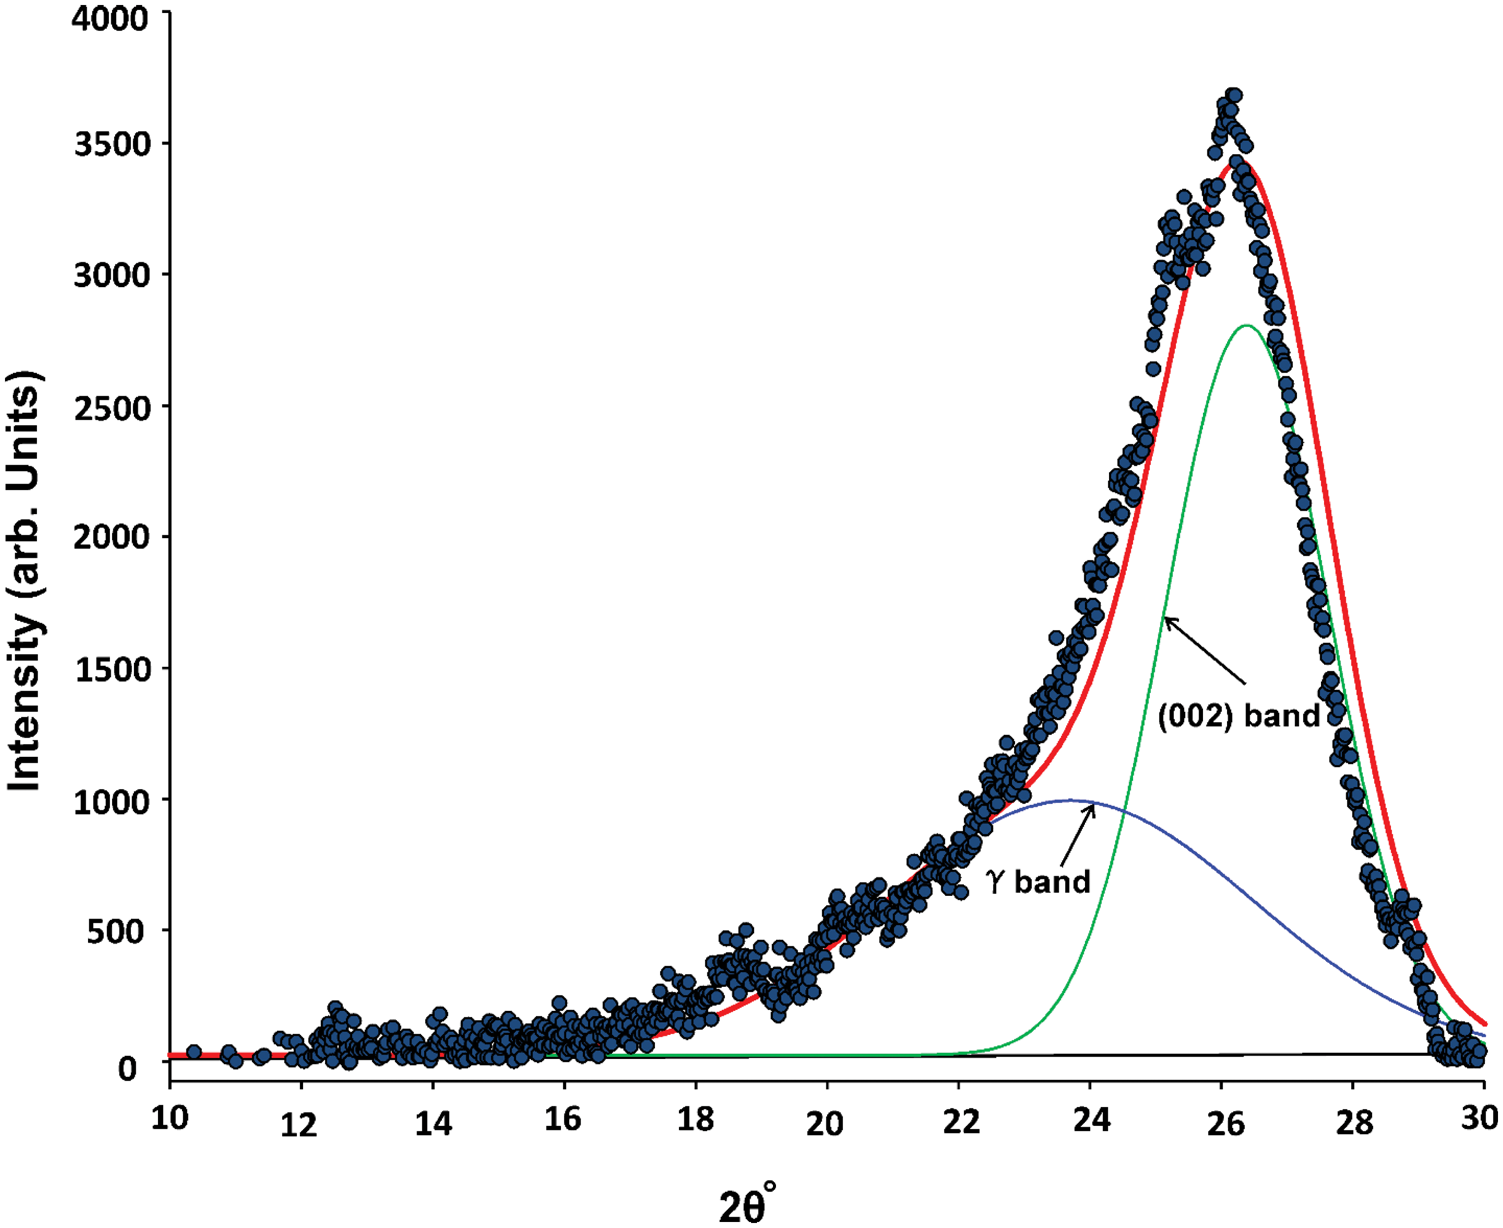
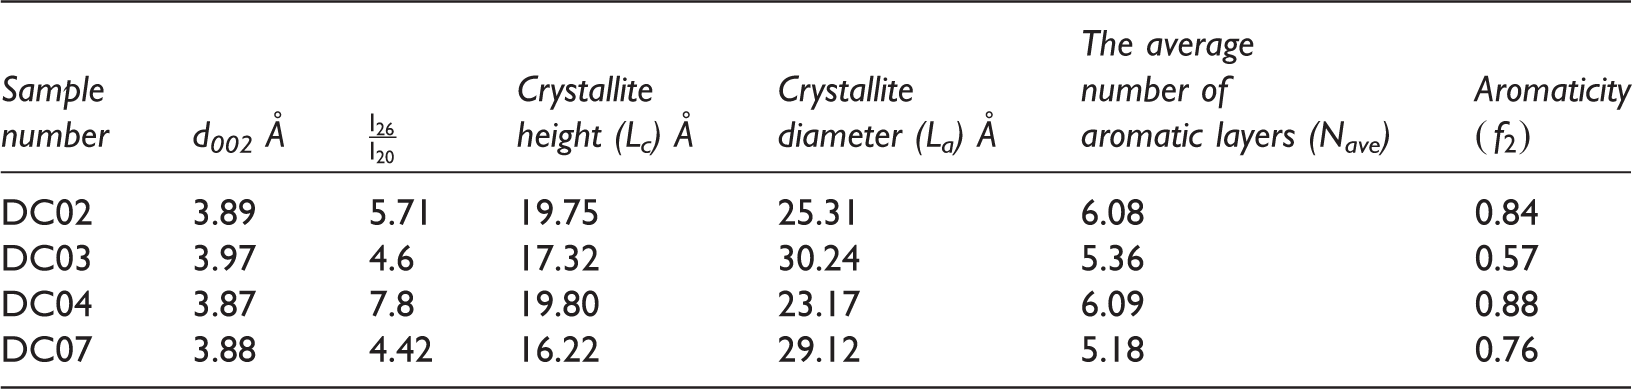
The layer structures in the coal samples included average lateral sizes (La) and average stacking heights (Lc); these were measured using the Scherrer equation. The La values range from 23.17 to 30.24 Å, and the Lc values range from 16.22 to 19.80 Å (Table 3). The aromaticity (fa) and coal rank (
High-resolution transmission electron microscopy
HR-TEM is another refined tool which provides the molecular structural features of coals, using the acquired high-resolution fringe images (Das et al., 2016; Okolo et al., 2015). Image analysis of HR-TEM micrograph helps to understand the nature of microstructures (Tonejc et al., 1996, 2001). With the help of this method, the size of carbon nanoballs, CNTs, and grain boundaries have been accurately determined in the studied coal samples. The HR-TEM analysis shows the carbon nanomaterials in an alkali-treated DC04 coal sample (Figure 5). The typical TEM images of carbon nanomaterials appear as hollow carbon spheres formed along with carbon clusters (Das et al., 2016). Figure 5(b) shows a typical TEM image of single-wall nanotubes (SWNTs) with Y-junction-type (Das et al., 2016; Wang et al., 2006). The diameters of the SWNTs are in the range of 12.67–36.23 nm and the nominal size of SWNT is 16–20 nm, respectively. Observed black spots in Figure 5(b) is attributed to the presence of iron nanominerals (Das et al., 2016).
HR-TEM images of (a) CNTs and (b) SWNTs.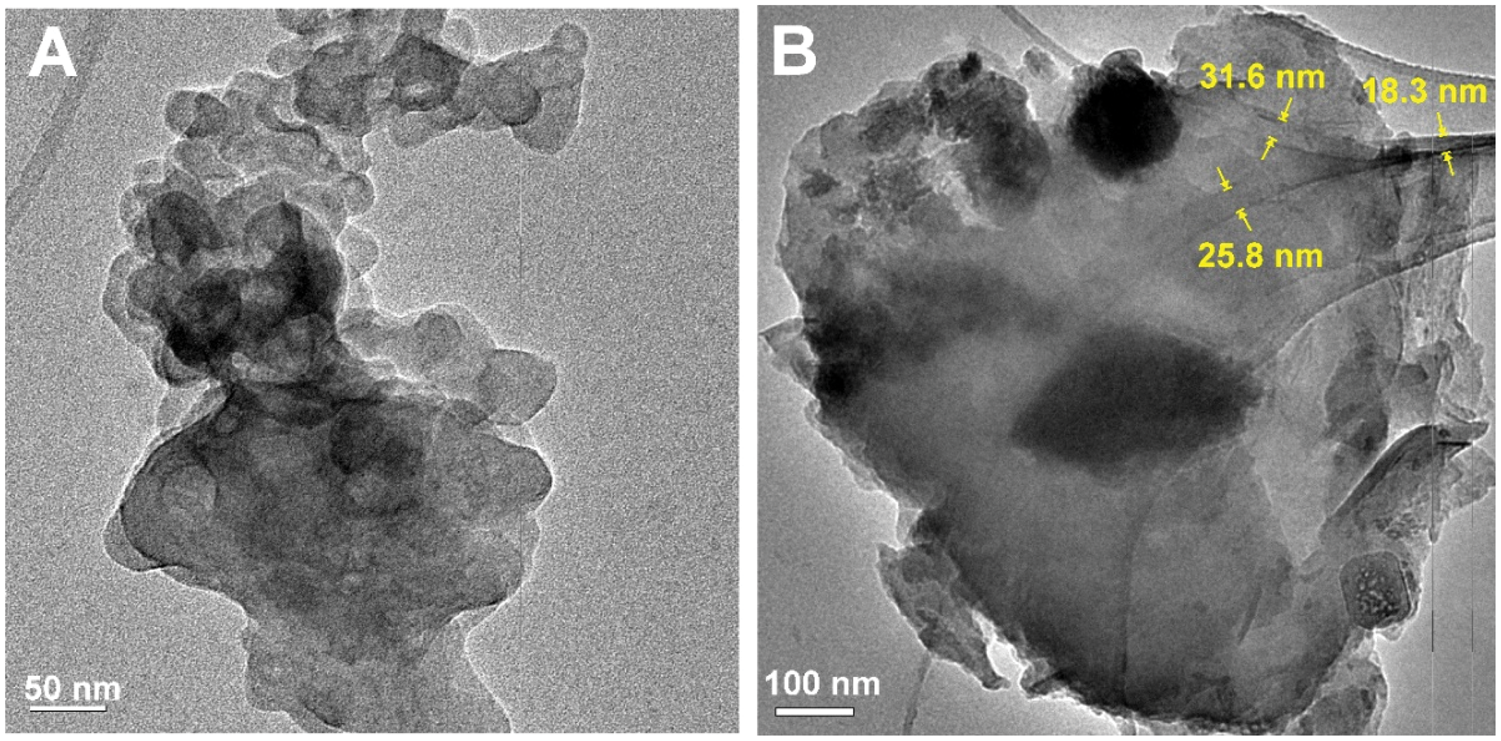
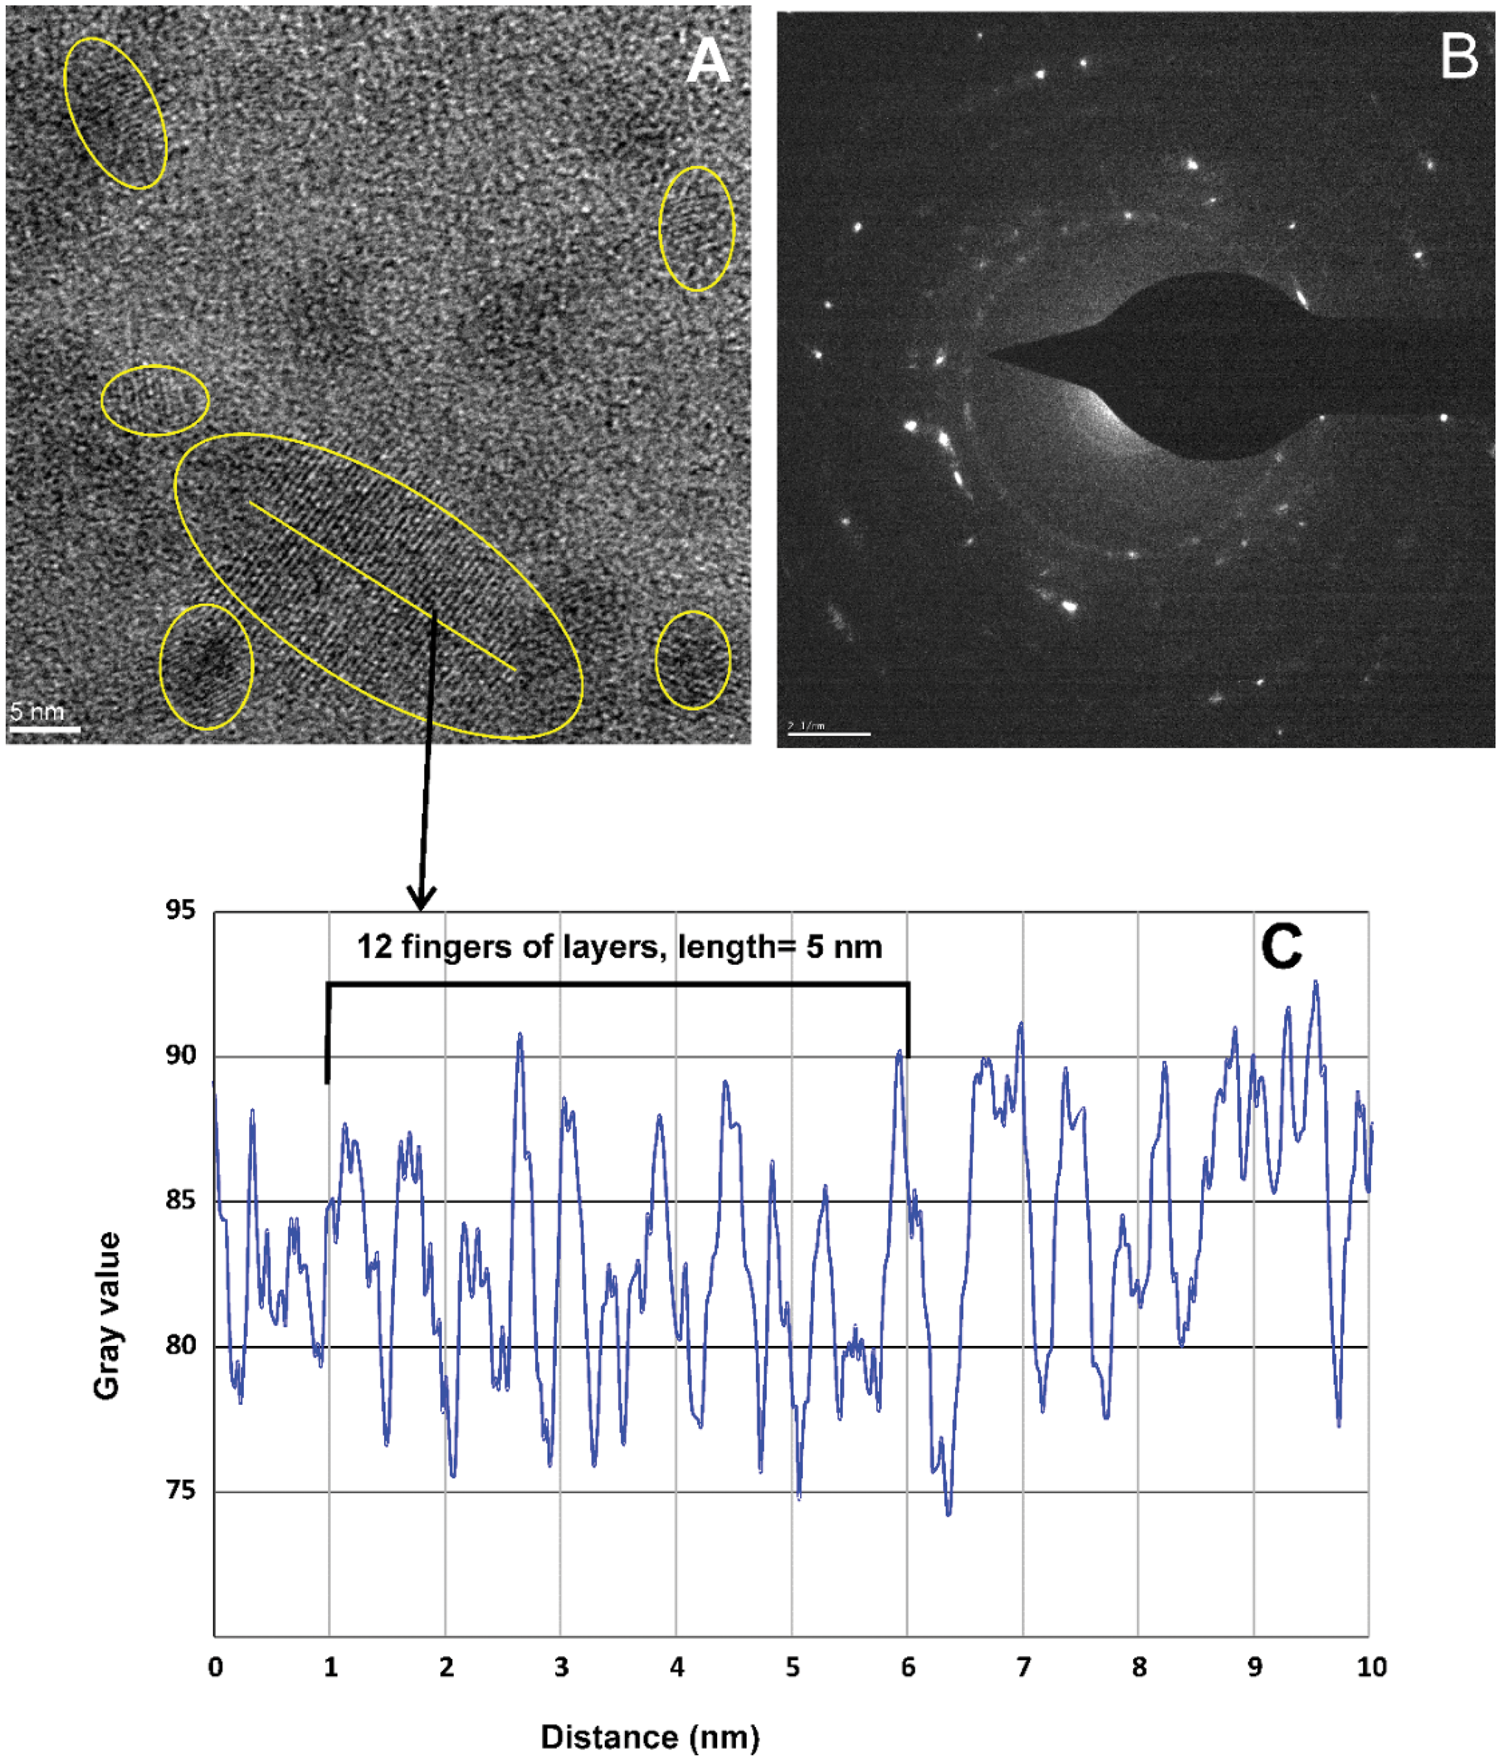
Different size of carbon nanoballs is shown in Figure 6 and the size distribution of the nanoballs is determined with the help of HR-TEM images using the Image J software. From the Figure 6(a) and (b), the nominal area of carbon nanoballs is found to be in the range of 11–14 nm2 (Figure 2(a)) and the nominal size of carbon nanoballs is 4–5 nm (Figure 6(b)). According to the selected area diffraction pattern (SEAD) of sample DC04 (Figure 7(a)), the mean profile of intershell spacing is 0.42 nm. The SEAD pattern (Figure 7(b)) illustrates the formation of the amorphous nature of the carbon nanomaterials (Das et al., 2016).
HR-TEM images of carbon nanoballs and their size distribution: (a) area and (b) size. Mean profile of the intensity levels for sample DC04 (c), the CNTs (HR-TEM image; a), and the corresponding SEAD pattern (b).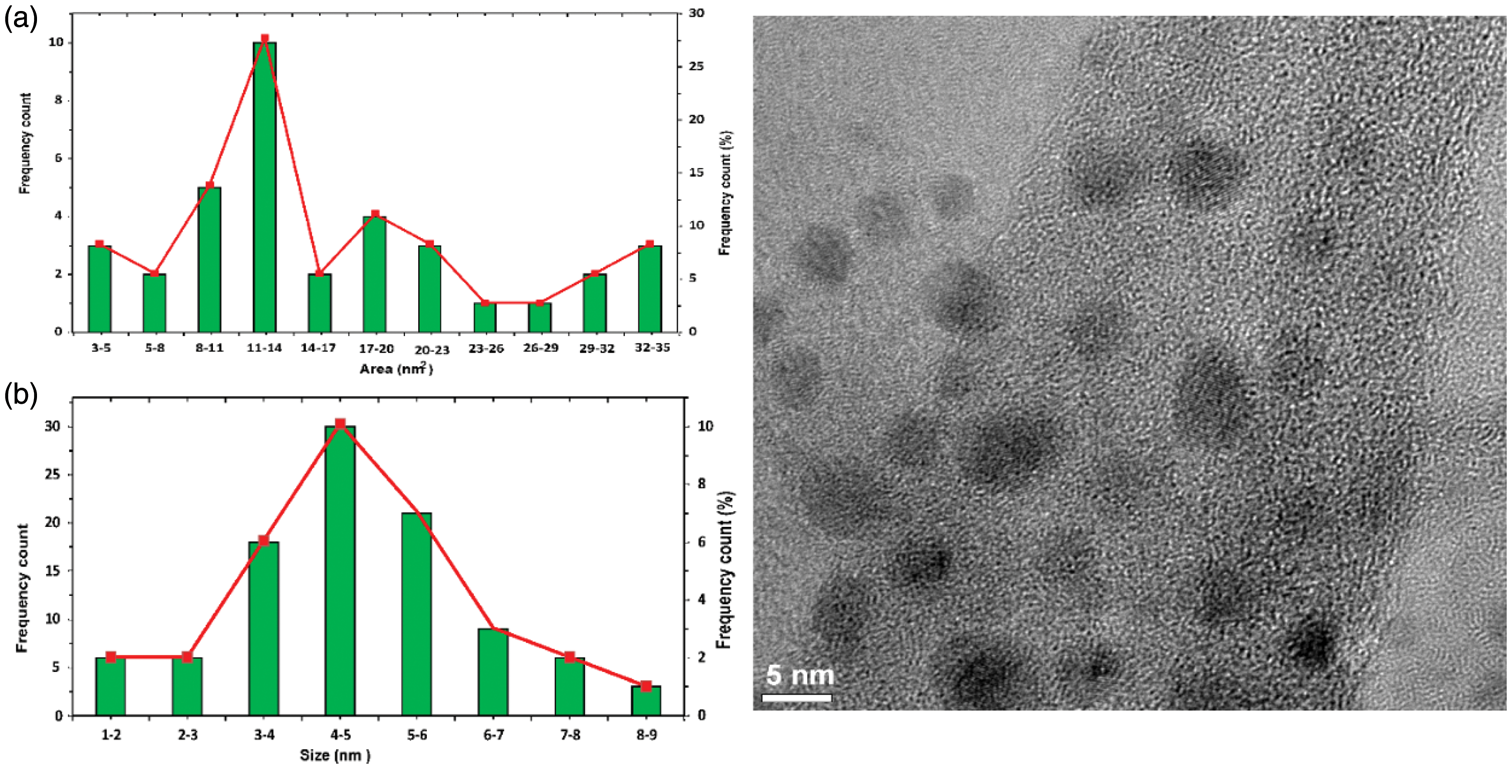
Scanning electron microscopy
SEM is an important technique for the study of the surface microstructural features of coals as well as to understand the microstructural relationships of mineral matter with the organic matter (Singh and Singh, 1995; Singh et al., 2015b). It helps in understanding the micromorphology of solid surfaces and in analyzing the fissure and fracture forms and internal structure of materials (Nie et al., 2015). The SEM images seen in Figures 8(A) to (D) show the inherent micro-fissures and micro-cracks. There appears to have superficial mounting of mineral matter (Figure 8(A) to (D)), micro-fissures (Figure 8(B) and (C)), and micro-pores (Figure 8(D)). These micro-pores are of variable shapes and sizes and are capable of containing hydrocarbons (especially light hydrocarbons like methane) which could have migrated through the channels of micro-fissures developed as a result of enhanced process of coalification as the coal occurs in a tectonically active belt of Himalaya. Figures 8(A) to (C) show bright luminosity, whereas Figure 8(D) represents dark luminosity. Sample DC07 is highly porous with numerous wedge-shaped micro-pores observed in Figure 8(C), which indicates a significant hysteresis loop (Nie et al., 2015).
SEM images of samples DC04 (A, B) and DC07 (C, D) show micro-fissures and micro-pores. The apertures of micro-fissure ‘a’ and ‘b’ in (B) and (C) are 0.65 nm and 0.35 nm, respectively.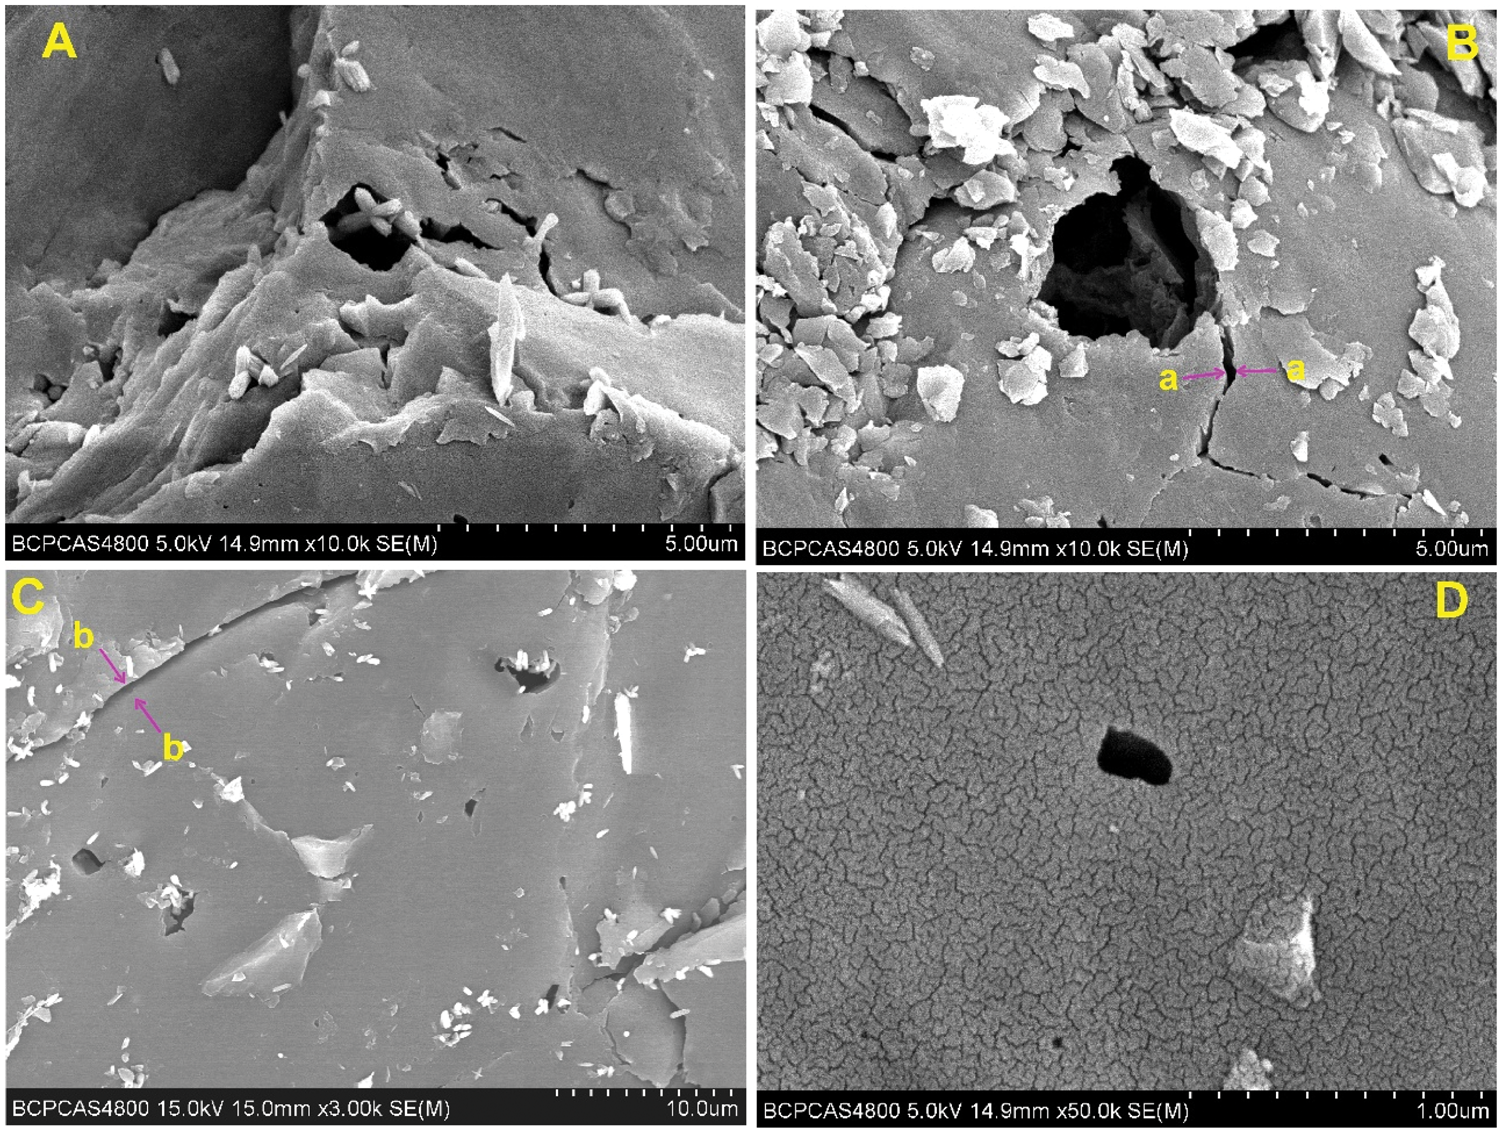
A bulk microstructure composed of a homogeneously distributed network of small crystallites exhibits the presence of minerals (Manoj et al., 2009). The observed luminous, as well as non-luminous, features indicate the presence of minerals distributed in the organic matrix. The presence of different luminosities illustrates different elements. The bright luminosity illustrates the occurrence of aluminum, potassium or sodium, whereas the dark luminosity was mainly due to the presence of chalcophiles (Shakirullah et al., 2006).
Surface plot diagrams of coal samples (DC03 and DC04) at high magnifications are shown in Figure 9(a) and (b) which reflects their 3D surface morphologies. A number of fractures, micro-islands, micro-hills and micro-valleys can be seen randomly throughout the micrographs; these could be attributed to the presence of molasses and carboxymethyl cellulose (Das et al., 2015). Less pronounced peaks are observed in the micrograph of DC03 (Figure 9(b)), whereas smooth surfaces are observed in the micrograph of DC04 (Figure 9(a)). The development of cavities, micro-islands, micro-hills and micro-valleys is due to the thermal shock. This also gets support from the fact that the coal under study contains large proportions of silica, calcium carbonates and dolomite, as well as some proportions of elements such as aluminum, potassium and sulfur which favor this process (Manoj et al., 2009).
Surface plot diagram (a, b) of Jhadewa coal samples.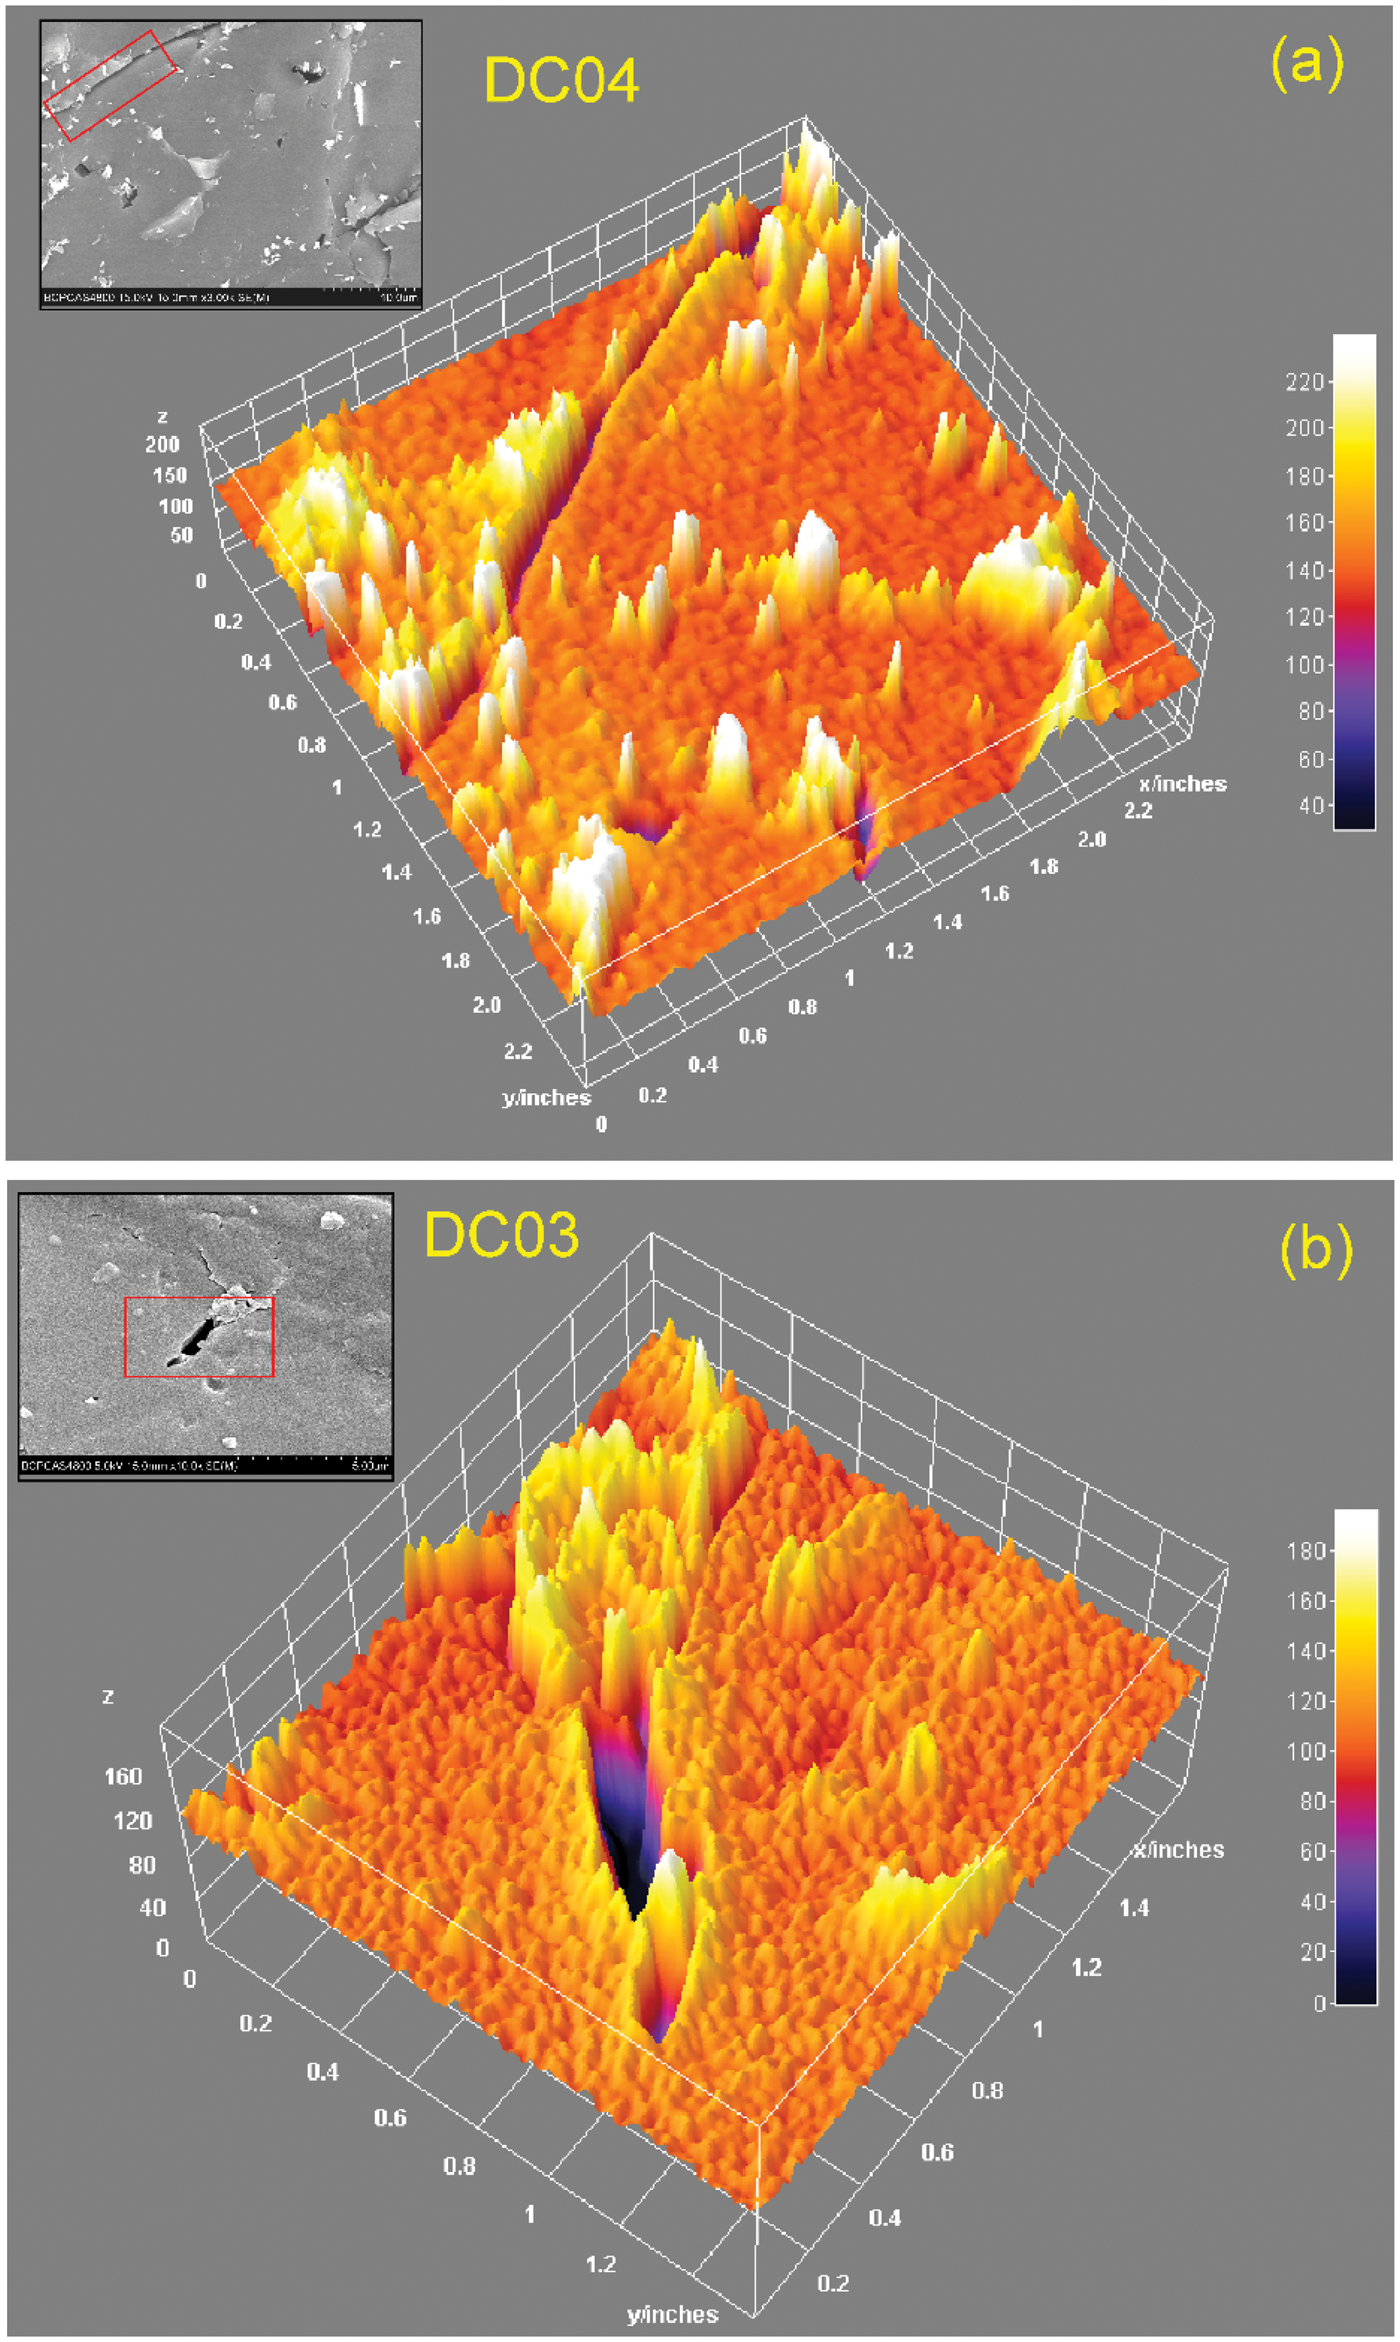
Conclusions
Various analytical techniques were applied to study the structural investigations of Eocene coal from the foreland basin of central Nepal Himalaya. Based on the study, following conclusions are drawn:
The central Nepal are ‘sub-bituminous’ – ‘bituminous-C’ in rank as determined on the basis of vitrinite reflectance. The results of the ATR-FTIR analysis reveal that the coal samples have aliphatic –CH, –CH2 and –CH3, aromatic C=C, aromatic –CH, –OH and C=O functional groups in their structures. The XRD investigation shows that the coals contain some crystalline carbon having the turbostratic structure with lateral sizes (La), stacking heights (Lc) interlayer spacings (d002) and aromaticities HR-TEM image analysis reveals the presence of typical carbon nanostructures such as nanoballs, CNTs and SWNTs. The individual area and size of the nanoballs ranged from 3.09 to 34.09 nm and from 1.73 to 8.02 nm, respectively. The calculated width of the Y-junction type of SWNTs ranged from 12.67 to 36.23 nm, and the mean profile of the intershell spacing was 0.42 nm. SEM studies indicate the development of different types of micro-pores and micro-fissures, cleats, micro-cracks and veins in the organic matter. The micro-fissures could have acted as channels for the migration of hydrocarbons.
Footnotes
Acknowledgements
We would like to thank Reza Bashiri Khuzestani from UCAS, Beijing for his useful suggestions in the development of the image algorithm. We would like to express our appreciation to the High Voltage Electron Microscope Laboratory of the Peking University for the microscope observation. We are also thankful to the unknown reviewers for their critical comments.
Declaration of conflicting interests
The author(s) declared no potential conflicts of interest with respect to the research, authorship, and/or publication of this article.
Funding
The author(s) disclosed receipt of the following financial support for the research, authorship, and/or publication of this article: This study was funded by the ‘Climate Change: Carbon Budget and Related Issues’ Strategic Priority Research Program of the Chinese Academy of Sciences (XDA05030100) and the National Natural Science Foundation of China (41530315 and 41372213). This research was supported by CAS-TWAS president fellowship program.