
Abstract
The correct understanding of shale pore characteristics is the foundation of shale gas exploration and development. Comminution is an essential sample pretreatment in many measurements of shale pore characteristics, but little is known about the influence of comminution on shale pore characteristics. This study utilizes low-pressure nitrogen adsorption and helium porosity measurements to investigate the evolution of shale pore characteristics during comminution. The results show that reducing the proportion of inaccessible pores and improving the gas diffusion efficiency are the main effects of comminution on the shale pore characteristics, resulting in an increase in measured porosity. The recommended analytical shale particle size for low-pressure nitrogen adsorption and helium porosity measurements is below 80 and 20 mesh, respectively. The proportion of inaccessible pores in shale investigated in this study ranges from 13.11 to 45.89% and shows a negative correlation with thermal maturity and a positive correlation with clay content. This suggests an improvement of organic pore accessibility during thermal evolution and a high content of inaccessible pores in clay minerals.
Introduction
Shale gas, i.e. the natural gas occurring in the adsorbed, free, or dissolved state in shale pores (Curtis, 2002), is one of the most important unconventional resources. Shale pore characteristics are important factors controlling the shale gas content. The correct understanding of the pore characteristics of shale is the foundation of shale gas exploration and development (Chalmers et al., 2012; Chen et al., 2015; Li et al., 2015). With the worldwide increase in the shale gas industry, shale pore characteristics have become a hot spot of research. Pores are generally classified according to their diameters as micropores (<2 nm), mesopores (2–50 nm), and macropores (>50 nm; Sing et al., 1985). Different from conventional oil and gas reservoirs, the main controlling factor of hydrocarbon reservoir capacity in shale is nanometer pores (Chalmers et al., 2012; Yang et al., 2015), which are micropores, mesopores, and a component of macropores.
The commonly used shale pore analysis methods include various gas adsorption techniques using helium, nitrogen, and carbon dioxide (Cui et al., 2009; Mastalerz et al., 2012, 2013; Schmitt et al., 2013); small angle X-ray and neutron scattering (SAXS, small angle neutron scattering (SANS), and USANS (Clarkson et al., 2013; Mastalerz et al., 2012, 2013); mercury intrusion capillary pressure porosimetry (Clarkson et al., 2013; Mastalerz et al., 2013; Schmitt et al., 2013); high resolution scanning and transmission electron microscopy (Chalmers et al., 2012; Loucks et al., 2009); and nuclear magnetic resonance (Lewis et al., 2013; Martinez and Davis, 2000; Xu et al., 2015). The porosimetry of small pores from 0.35 to 300 nm typically relies on gas adsorption techniques (Chen et al., 2015; Cui et al., 2009; Mastalerz et al., 2013). On the other hand, gas adsorption techniques are also widely used in the study of the gas adsorption capacity of shale.
Due to the effects of the low permeability of shale on gas diffusion and the adsorption process, comminution is an essential sample pretreatment in shale gas adsorption techniques (Kuila and Prasad, 2013). The correct understanding of the influence of comminution on shale pore characteristics is significant. However, studies in this field are lacking. Various sizes of shale particles are used for gas adsorption techniques, which result in difficulty in comparing results.
According to previous studies, there are four potential effects of comminution on shale pore characteristics: (1) Comminution may damage the pore structure of shale and artificially create excess external surface area (Kuila and Prasad, 2013); (2) comminution may create microcracks in mineral crystals, therefore increase the porosity of shale (Hodson, 1998); (3) comminution reduces shale particle size and may position more pores closer to the particle surface, therefore increasing the proportion of accessible pores (Chen et al., 2015); and (4) gas diffusion is slow in shale. Comminution reduces shale particle size and ensures proper equilibration of gas, facilitating easy gas adsorption measurements (Kuila and Prasad, 2013; Luffel and Guidry, 1992). However, changes in the shale pore characteristics resulting from comminution remain unknown.
In a previous study, all pore space in shale was regarded as interconnected (Luffel and Guidry, 1992). In recent years, with the development of measurement techniques, especially the SANS technique, inaccessible pores in shale have been quantified (Ruppert et al., 2013). Although scholars have indicated that comminution may affect the pore accessibility of shale (Chen et al., 2015), quantification of changes in pore accessibility as a result of comminution remains a knowledge gap. The relationship between the proportion of inaccessible pores and other factors is also poorly studied.
Therefore, it is necessary to study how comminution affects shale pore structure and accessibility. This study focused on pore characteristic evolution in shale with decreasing particle size. The pore characteristics were analyzed via low-pressure nitrogen adsorption and helium porosity measurements. The purpose is to (1) quantify the influence of the above four and other potential effects of comminution on shale pore characteristics and provide recommendations for the choice of shale particle size of gas adsorption measurements; and (2) quantify inaccessible pores of shale and analyze their correlation with other characteristics of shale.
Materials and methods
Sample descriptions and preparation
Five samples, including four shale samples and one artificial zeolite sample, were utilized in this study. Among the four shale samples, SCNS005 and SCN009 are marine shale from the Lower Silurian Longmaxi Formation (SCNS005) and the Lower Cambrian Qiongzhusi Formation (SCN009) outcrop, northeastern Sichuan Basin, China; FY2 and C91 are lacustrine shale cores from the Yanchang Formation of the Upper Triassic, South Ordos Basin, China (Figure 1). The artificial zeolite used in this study was provided by the Micromeritics Company. The given calibration of this artificial zeolite is as follows: mean pore diameter is 11.5 ± 1.5 nm, surface area is 214.0 ± 6 m2/g, and total pore volume is 0.62 ± 0.08 cm3/g.
Origin of shale samples used in this study.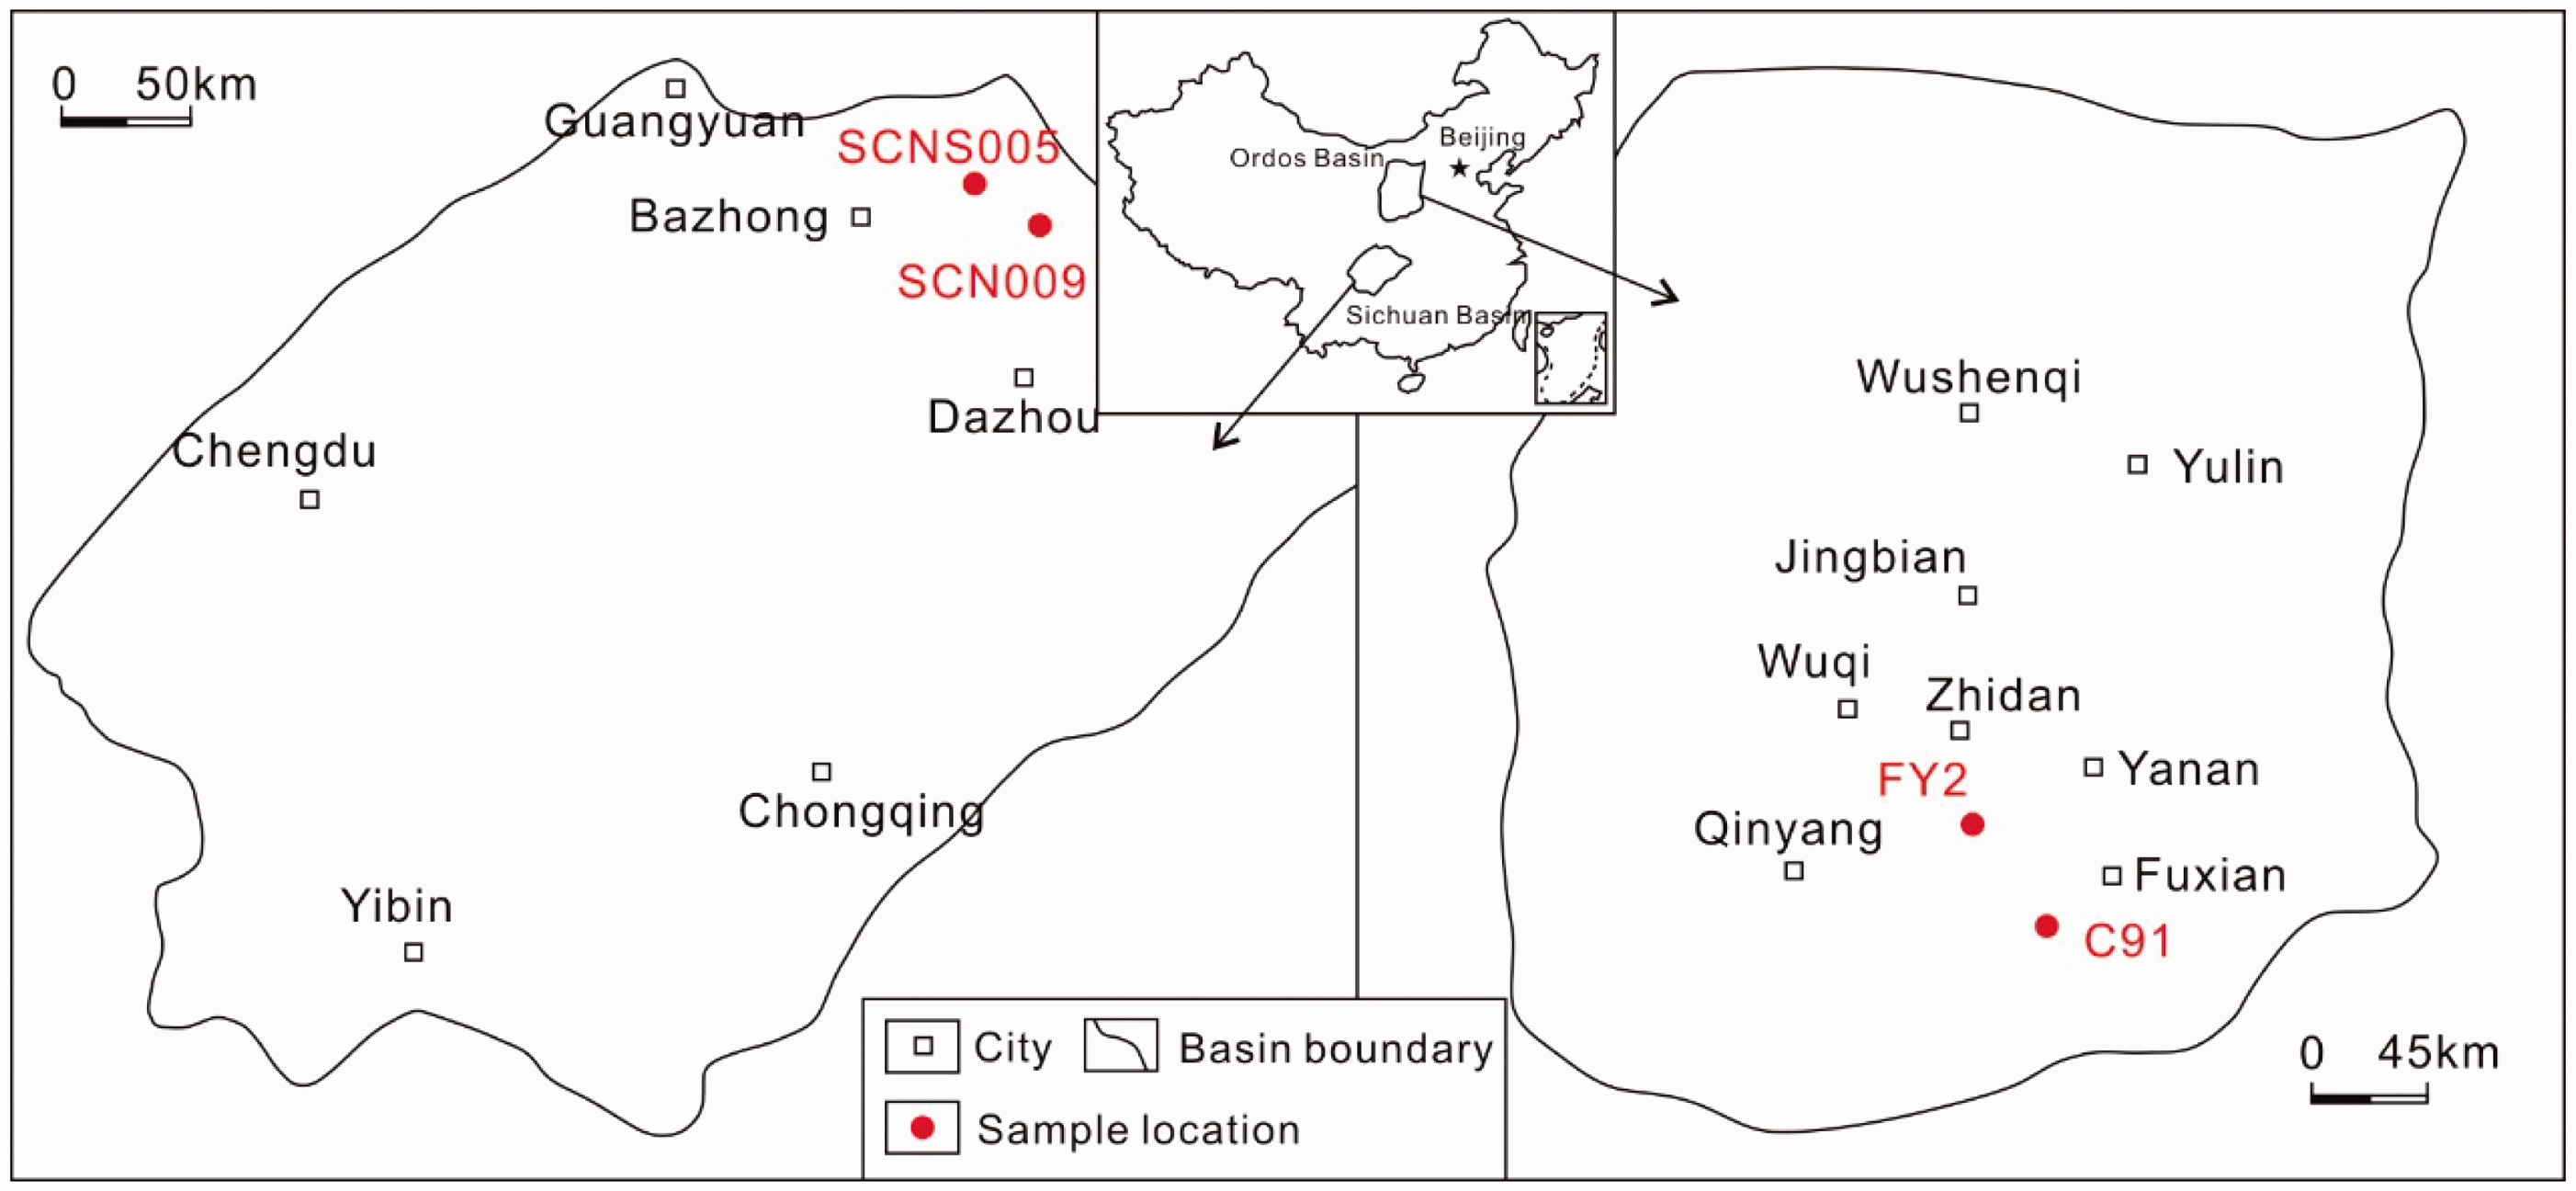
Each shale sample was divided into five parts of about 10 g that were comminuted to 4 mesh (<4.75 mm), 20 mesh (<0.85 mm), 80 mesh (<0.18 mm), 140 mesh (<0.106 mm), and 200 mesh (<0.075 mm). The artificial zeolite sample was divided into two parts, the original state (10 × 1 mm column) and comminuted to 200 mesh (<0.075 mm).
Organic petrography and X-ray diffraction analysis
The shale samples were first comminuted to 200 mesh (particle diameter was smaller than 74 µm), and the carbonates in the sample were removed by hydrochloric acid. Then, a quantitative test of the total organic carbon (TOC) concentrations was performed using a US Leco CS-344 carbon and sulfur analyzer. For X-ray diffraction analysis, the samples were dried at 50℃ for 5 h after being comminuted to 200 mesh and then analyzed on a powder X-ray diffractometer (Rigaku Co., D/Max-III B) with Cu-Kα radiation at 35 kV and 25 mA to investigate their mineral composition. Each scan was taken from 2° to 60°, with a step interval of 0.02° at a rate of 2.0°/min. Vitrinite reflectance Ro (%, for samples FY2 and C91) and bitumen reflectance Rb (%, for samples SCN009 and SCNS005) measurements (maximally 25 points) were performed using a Leica optical microscope and an MSP200 photometry system. The vitrinite content of lower Paleozoic shale is usually low, which makes vitrinite reflectance (Ro) difficult or impossible to measure. Therefore, the bitumen reflectance (Rb) of samples SCN009 and SCNS005 was measured instead in this study.
Low-pressure gas adsorption measurements
All shale samples were analyzed via low-pressure nitrogen adsorption measurements on a Micromeritics ASAP 2020 HD88 apparatus to obtain information about mesopores and micropores. Shale samples weighing approximately 0.3 g were automatically degassed at 110℃ in a vacuum for 20 h (300℃ and 4 h for artificial zeolite) to remove adsorbed moisture and volatile matter. Degassed samples were exposed to nitrogen (N2) at the temperature of liquid nitrogen (−196℃) along a series of precisely controlled gas pressures. N2 adsorption volumes were measured over the relative equilibrium adsorption pressure (P/Po) range of 0.0001–0.995, where Po is the condensation pressure of N2 under laboratory conditions, which is approximately 1 bar, and P is the actual gas pressure.
N2 adsorption data collected on shale samples were interpreted using Brunauer–Emmett–Teller (BET) analysis for surface area, and Barrett–Joyner–Halenda (BJH), Dubinin–Astakhov (D–A), density functional theory (DFT), Horvath–Kawazoe analysis for pore volume and the varied range of pore size distributions. Only BET and BJH analysis were used for artificial zeolite data because its pore is unitary. These analyses and calculations have been described before (Barrett et al, 1951; Horvath and Kawazoe, 1983; Rouquerol et al., 1999) and can be generated automatically by the instrument’s computer software.
Helium porosity measurement
The porosity of the shale samples was measured using a modified GRI method. The GRI method was developed by the Gas Research Institute (GRI, Luffel and Guidry, 1992) and is regarded as the current energy industry standard porosity measurement (Kuila et al., 2014). Similar to the GRI method, the bulk density and grain density of the shale samples were measured. Then, porosity was calculated using the following equation

The grain density of the shale samples was measured using 99.995% pure helium (He) on a magnetic suspension balance high pressure sorption analyzer (Rubotherm, ISOSORP-HP III Static) with a temperature of 25℃ and a maximum pressure of 7 MPa. According to Archimedes principle, the shale samples’ grain volume was calculated by measuring their quality changes in helium at different densities. Combined with the grain mass, the grain density was calculated. The detailed principle and calculation method is presented in the literature (Dreisbach et al., 2002; Gasparik et al., 2014). The bulk density was measured using an electronic density balance (Soptop, FA2104J) with 99.9% pure alcohol as the immersion liquid at a temperature of 25℃.
Results and discussion
Mineralogy and organic petrography
Vitrinite/bitumen reflectance (%) and mineralogical compositions (wt.%) of shale samples.
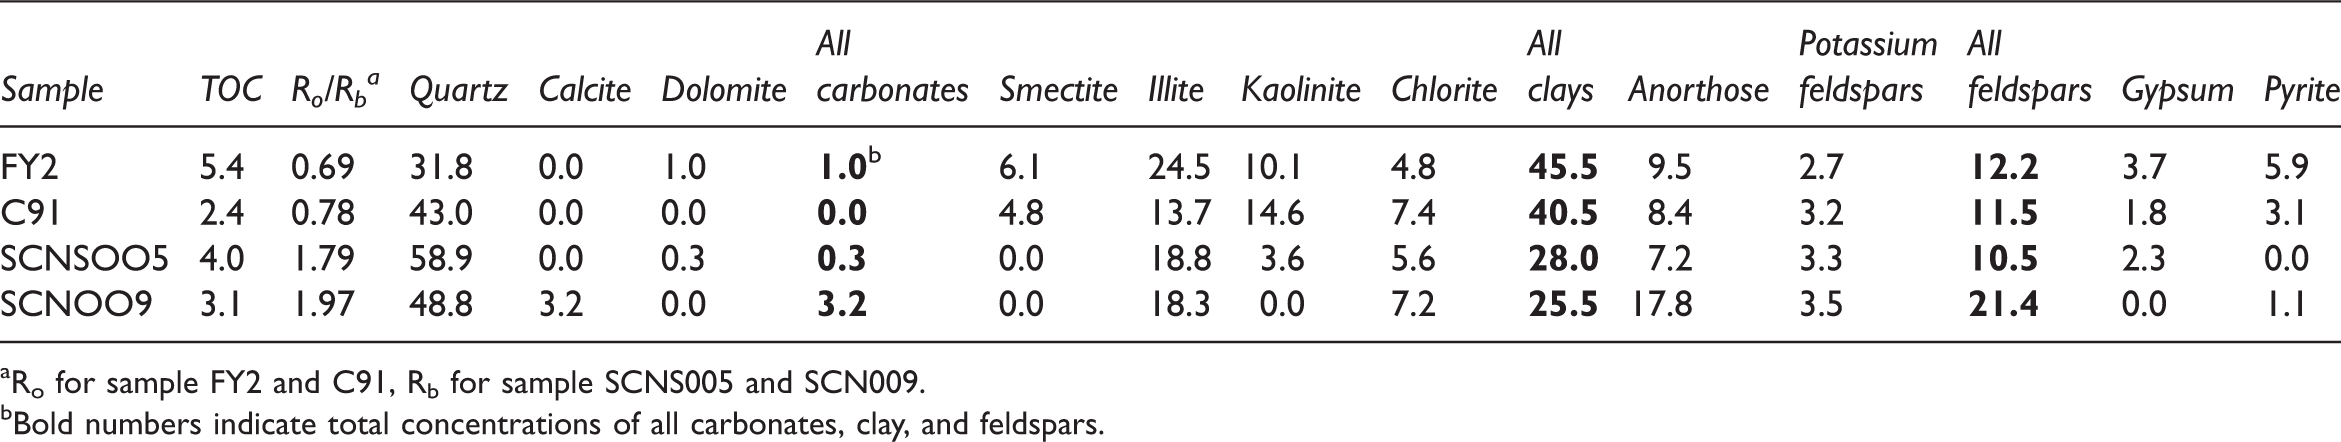
Ro for sample FY2 and C91, Rb for sample SCNS005 and SCN009.
Bold numbers indicate total concentrations of all carbonates, clay, and feldspars.
All four shale samples feature abundant quartz (31.8–58.9 wt.%) but are low in carbonates (calcite and dolomite, 0–1.0 wt.%). The marine shale samples SCN009 and SCNS005 have high clay contents (40.5–45.5 wt.%). The clay content of the lacustrine shale samples FY2 and C91 is relatively low (25.5–28.0 wt.%). The feldspar content of sample SCN009 (21.4 wt.%) is higher than that of the other samples (10.5–12.2 wt.%).
Pore characteristics of zeolite with different particle sizes
Artificial zeolite has a uniform pore structure and all pores are connected. A pore characteristic comparison of artificial zeolite with different particle sizes can be used to exclude the effects of inaccessible pores and the gas diffusion problem. In addition, artificial zeolite consists essentially of the compounds of aluminum and silicon and has high brittleness, which is similar to the brittle minerals in shale. It can also be used to analyze the microcracks created by comminution.
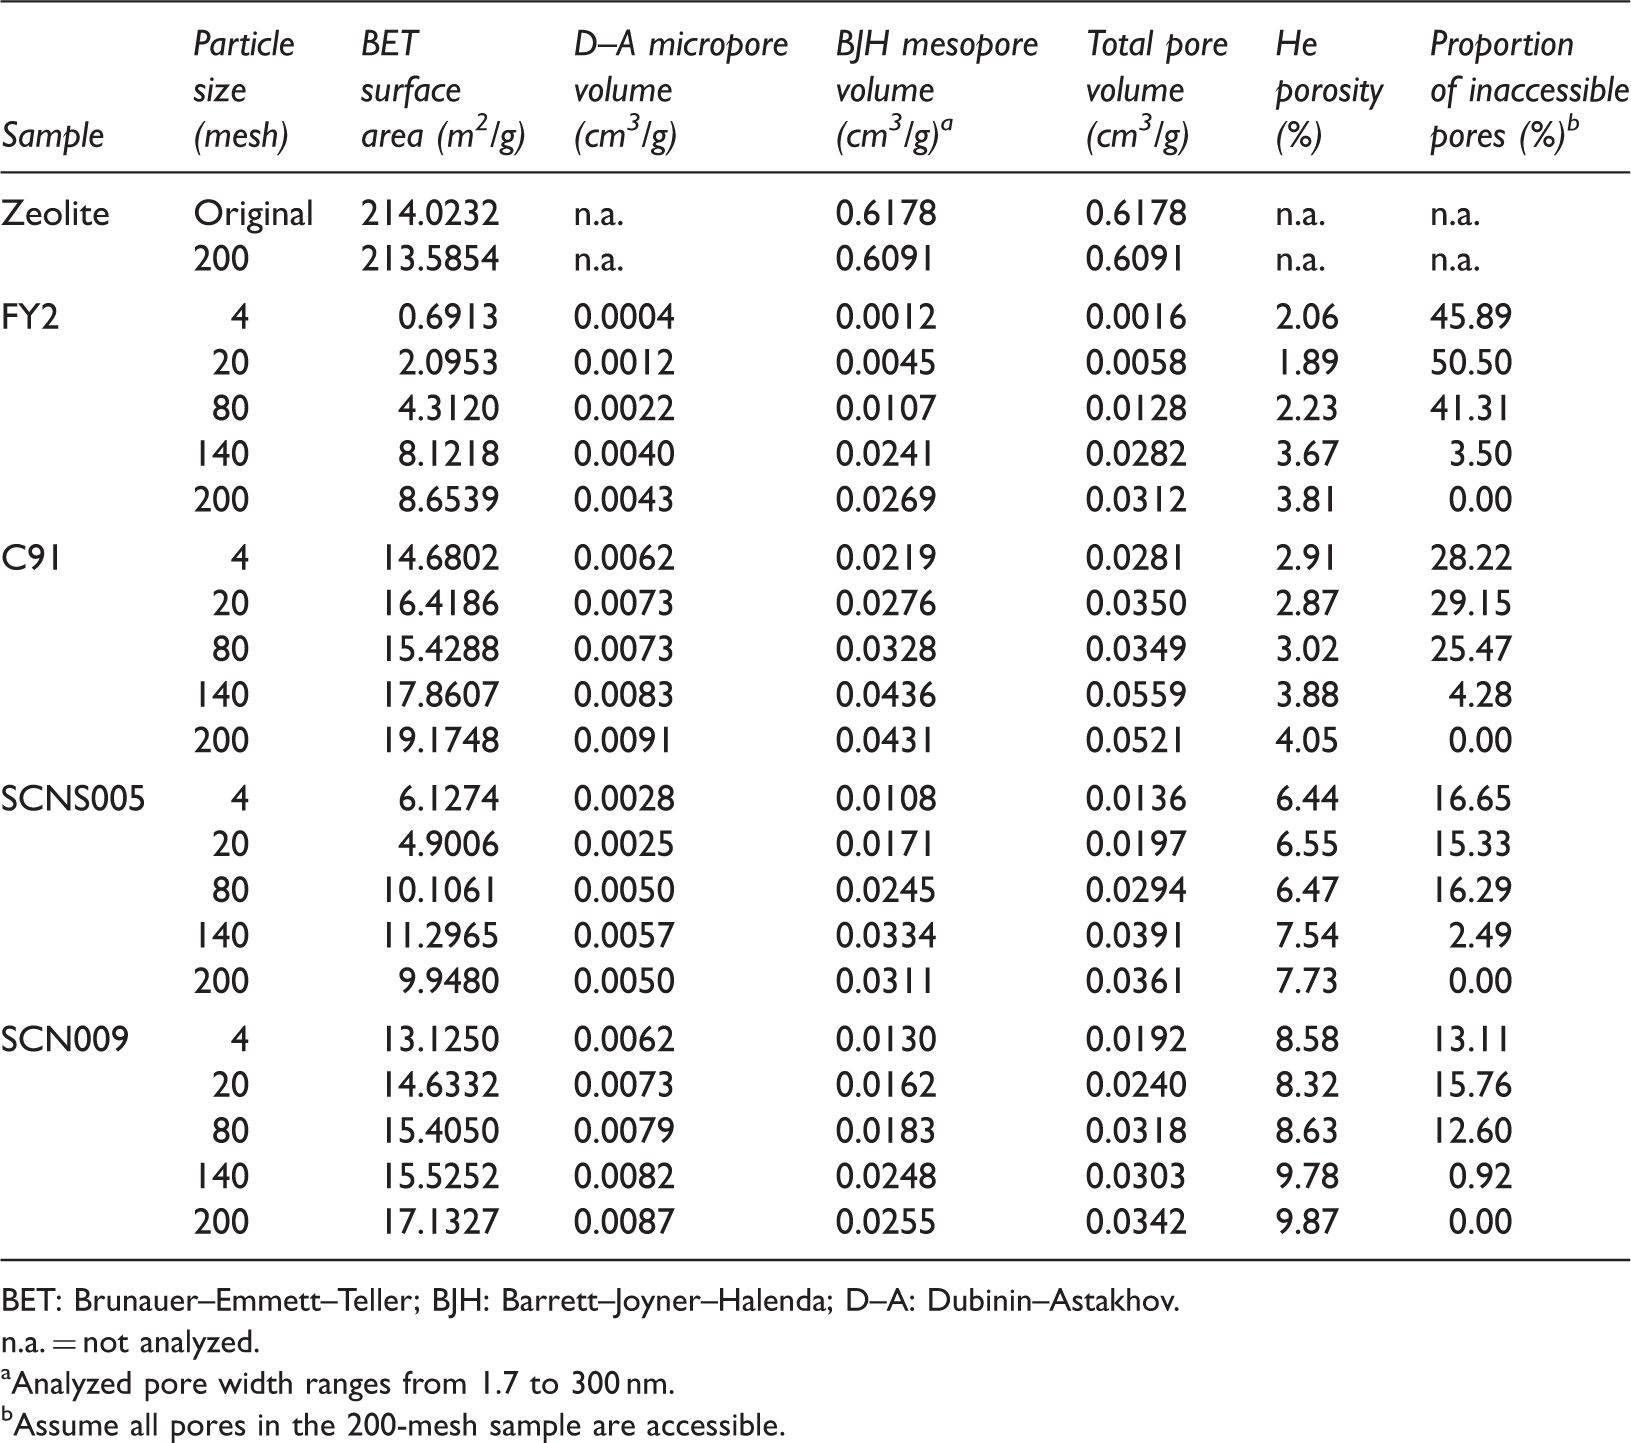
Results show that the total pore volume and surface area of the 200 mesh and original zeolite samples are similar and both conform to the given calibration (Table 2). The difference in the two samples with respect to pore volume and surface area is lower than 5 and 1%, respectively, indicating that comminuting porous material to 200 mesh will not cause remarkable changes in total pore volume and surface area. The pore size distribution of the 200 mesh and original zeolite sample is also similar (Figure 2). The pore size distribution isotherm of the two samples has a single and uniform peak at pore width 11 nm, indicating that microcracks created by comminuting porous material to 200 mesh will not remarkably affect the pore size distribution.
Pore size distribution of zeolite samples calculated from the nitrogen adsorption isotherm using the BJH method (Barrett et al., 1951). BJH: Barrett–Joyner–Halenda. Surface area, pore volumes, and porosity of samples. BET: Brunauer–Emmett–Teller; BJH: Barrett–Joyner–Halenda; D–A: Dubinin–Astakhov. n.a. = not analyzed. Analyzed pore width ranges from 1.7 to 300 nm. Assume all pores in the 200-mesh sample are accessible.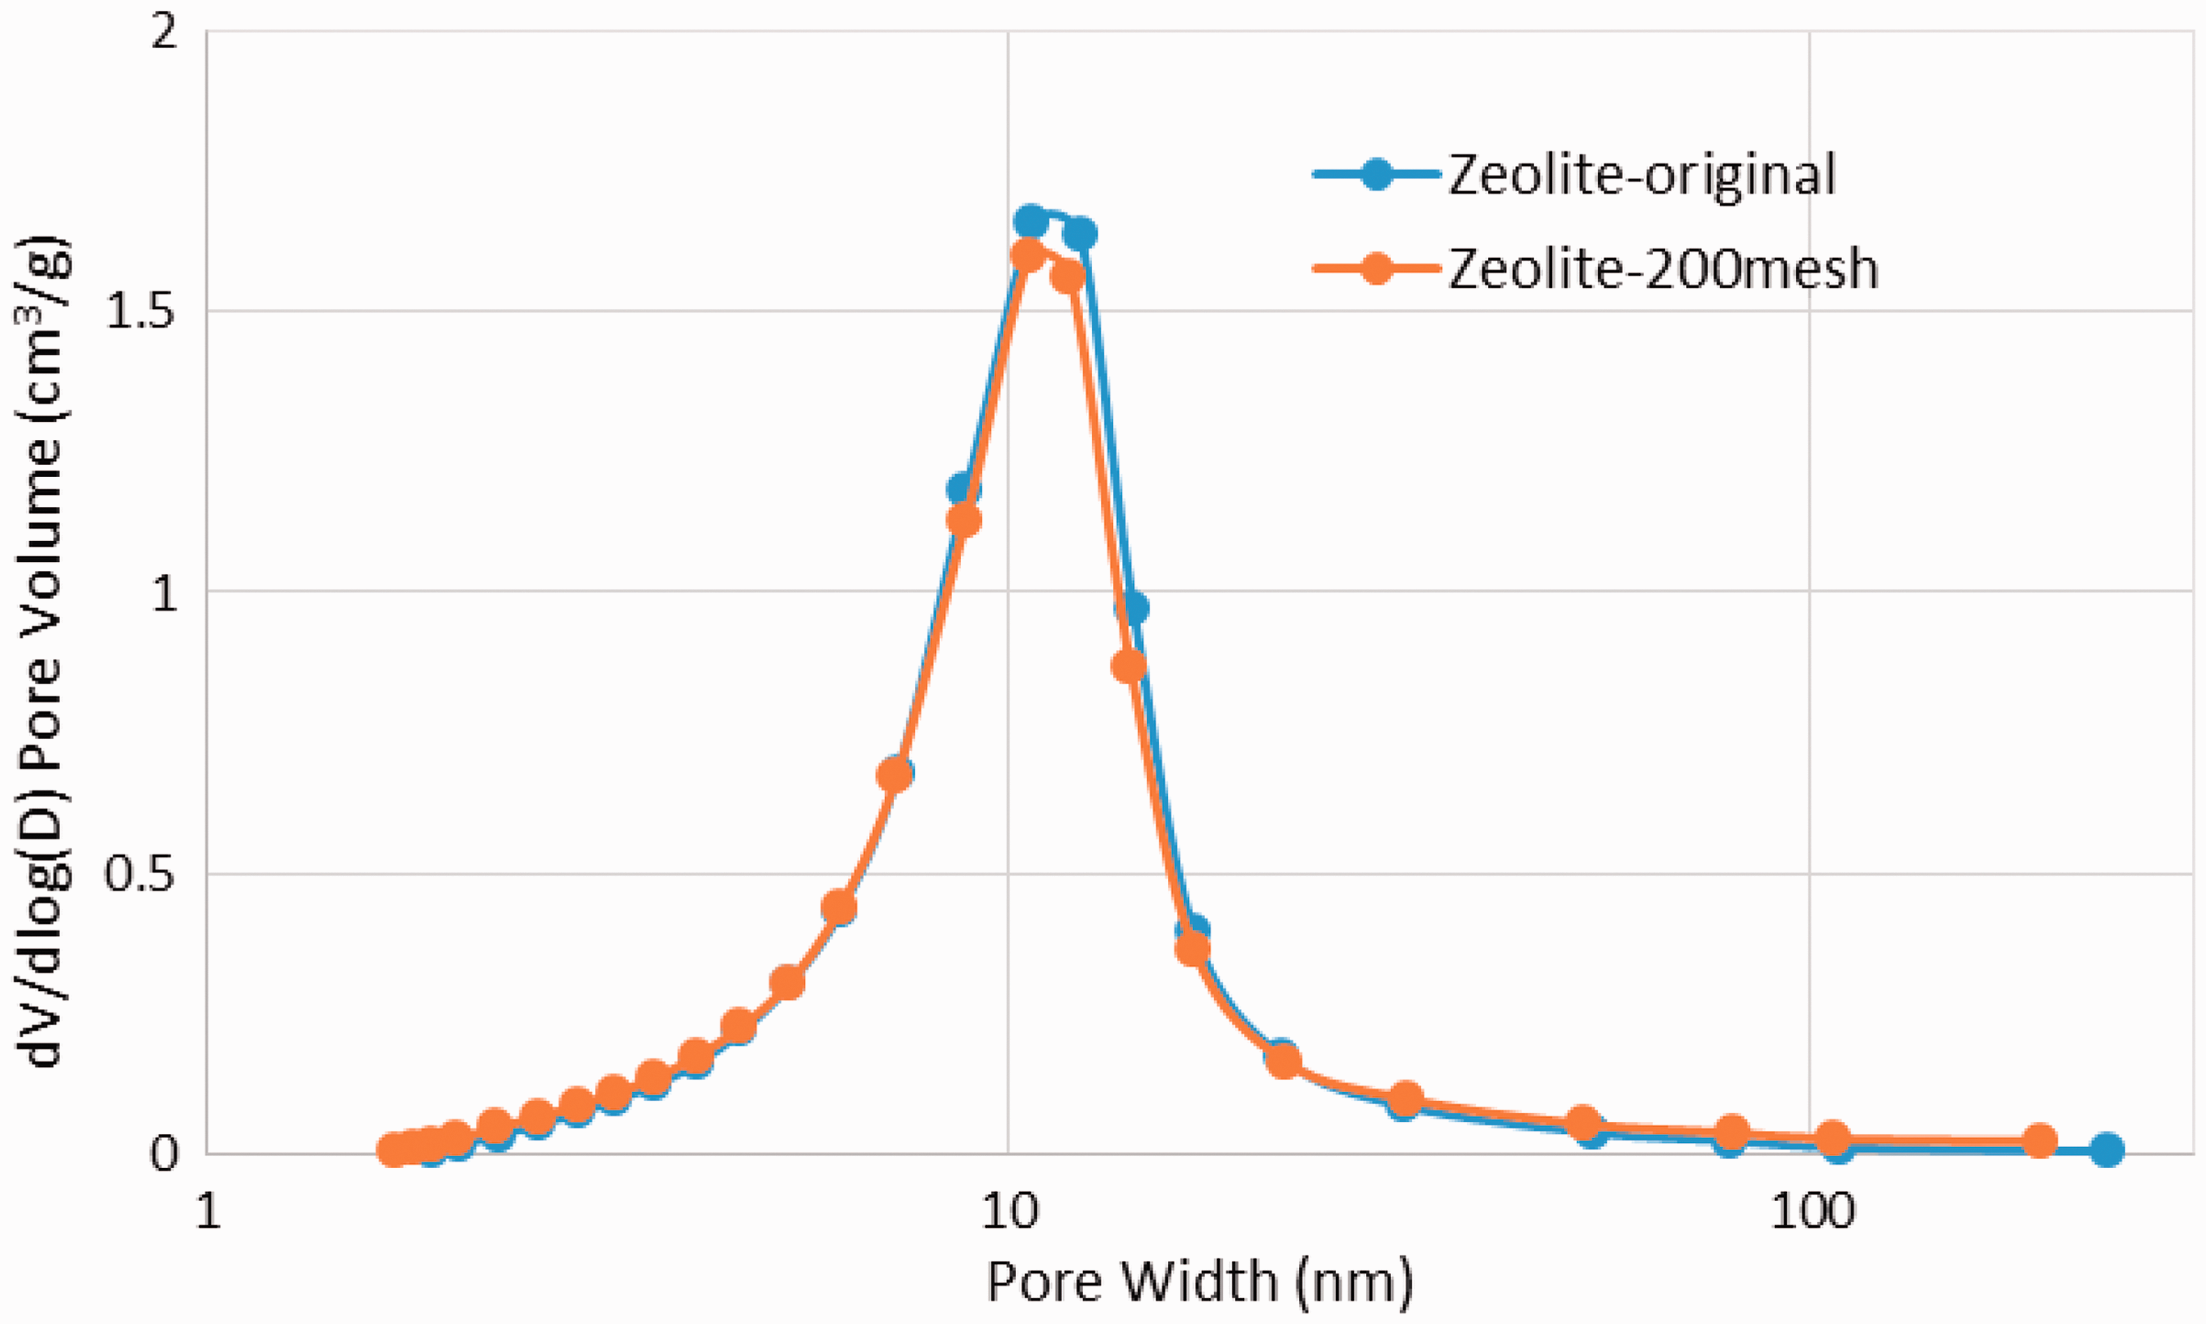
Pore characteristics of shale with different particle sizes
Results of the low-pressure N2 adsorption measurement show that the pore volume of the shale samples generally increases as the analytical particle size decreases (Table 2, Figure 3). The evolution of BJH mesopore volumes with decreasing analytical particle size can be divided into two parts: the first part is the particle size of 4–140 mesh in which mesopore volume increases rapidly, and the second part is the particle size of 140–200 mesh in which the mesopore volume increases slower than the former and even shows a decrease (Figure 4). The increase in D–A micropore volumes with decreasing analytical particle size is smaller than the BJH mesopore volumes. The surface area of the shale samples also shows an increase as the analytical particle size decreases, but its linearity is not as good as that of the pore volume (Table 2).
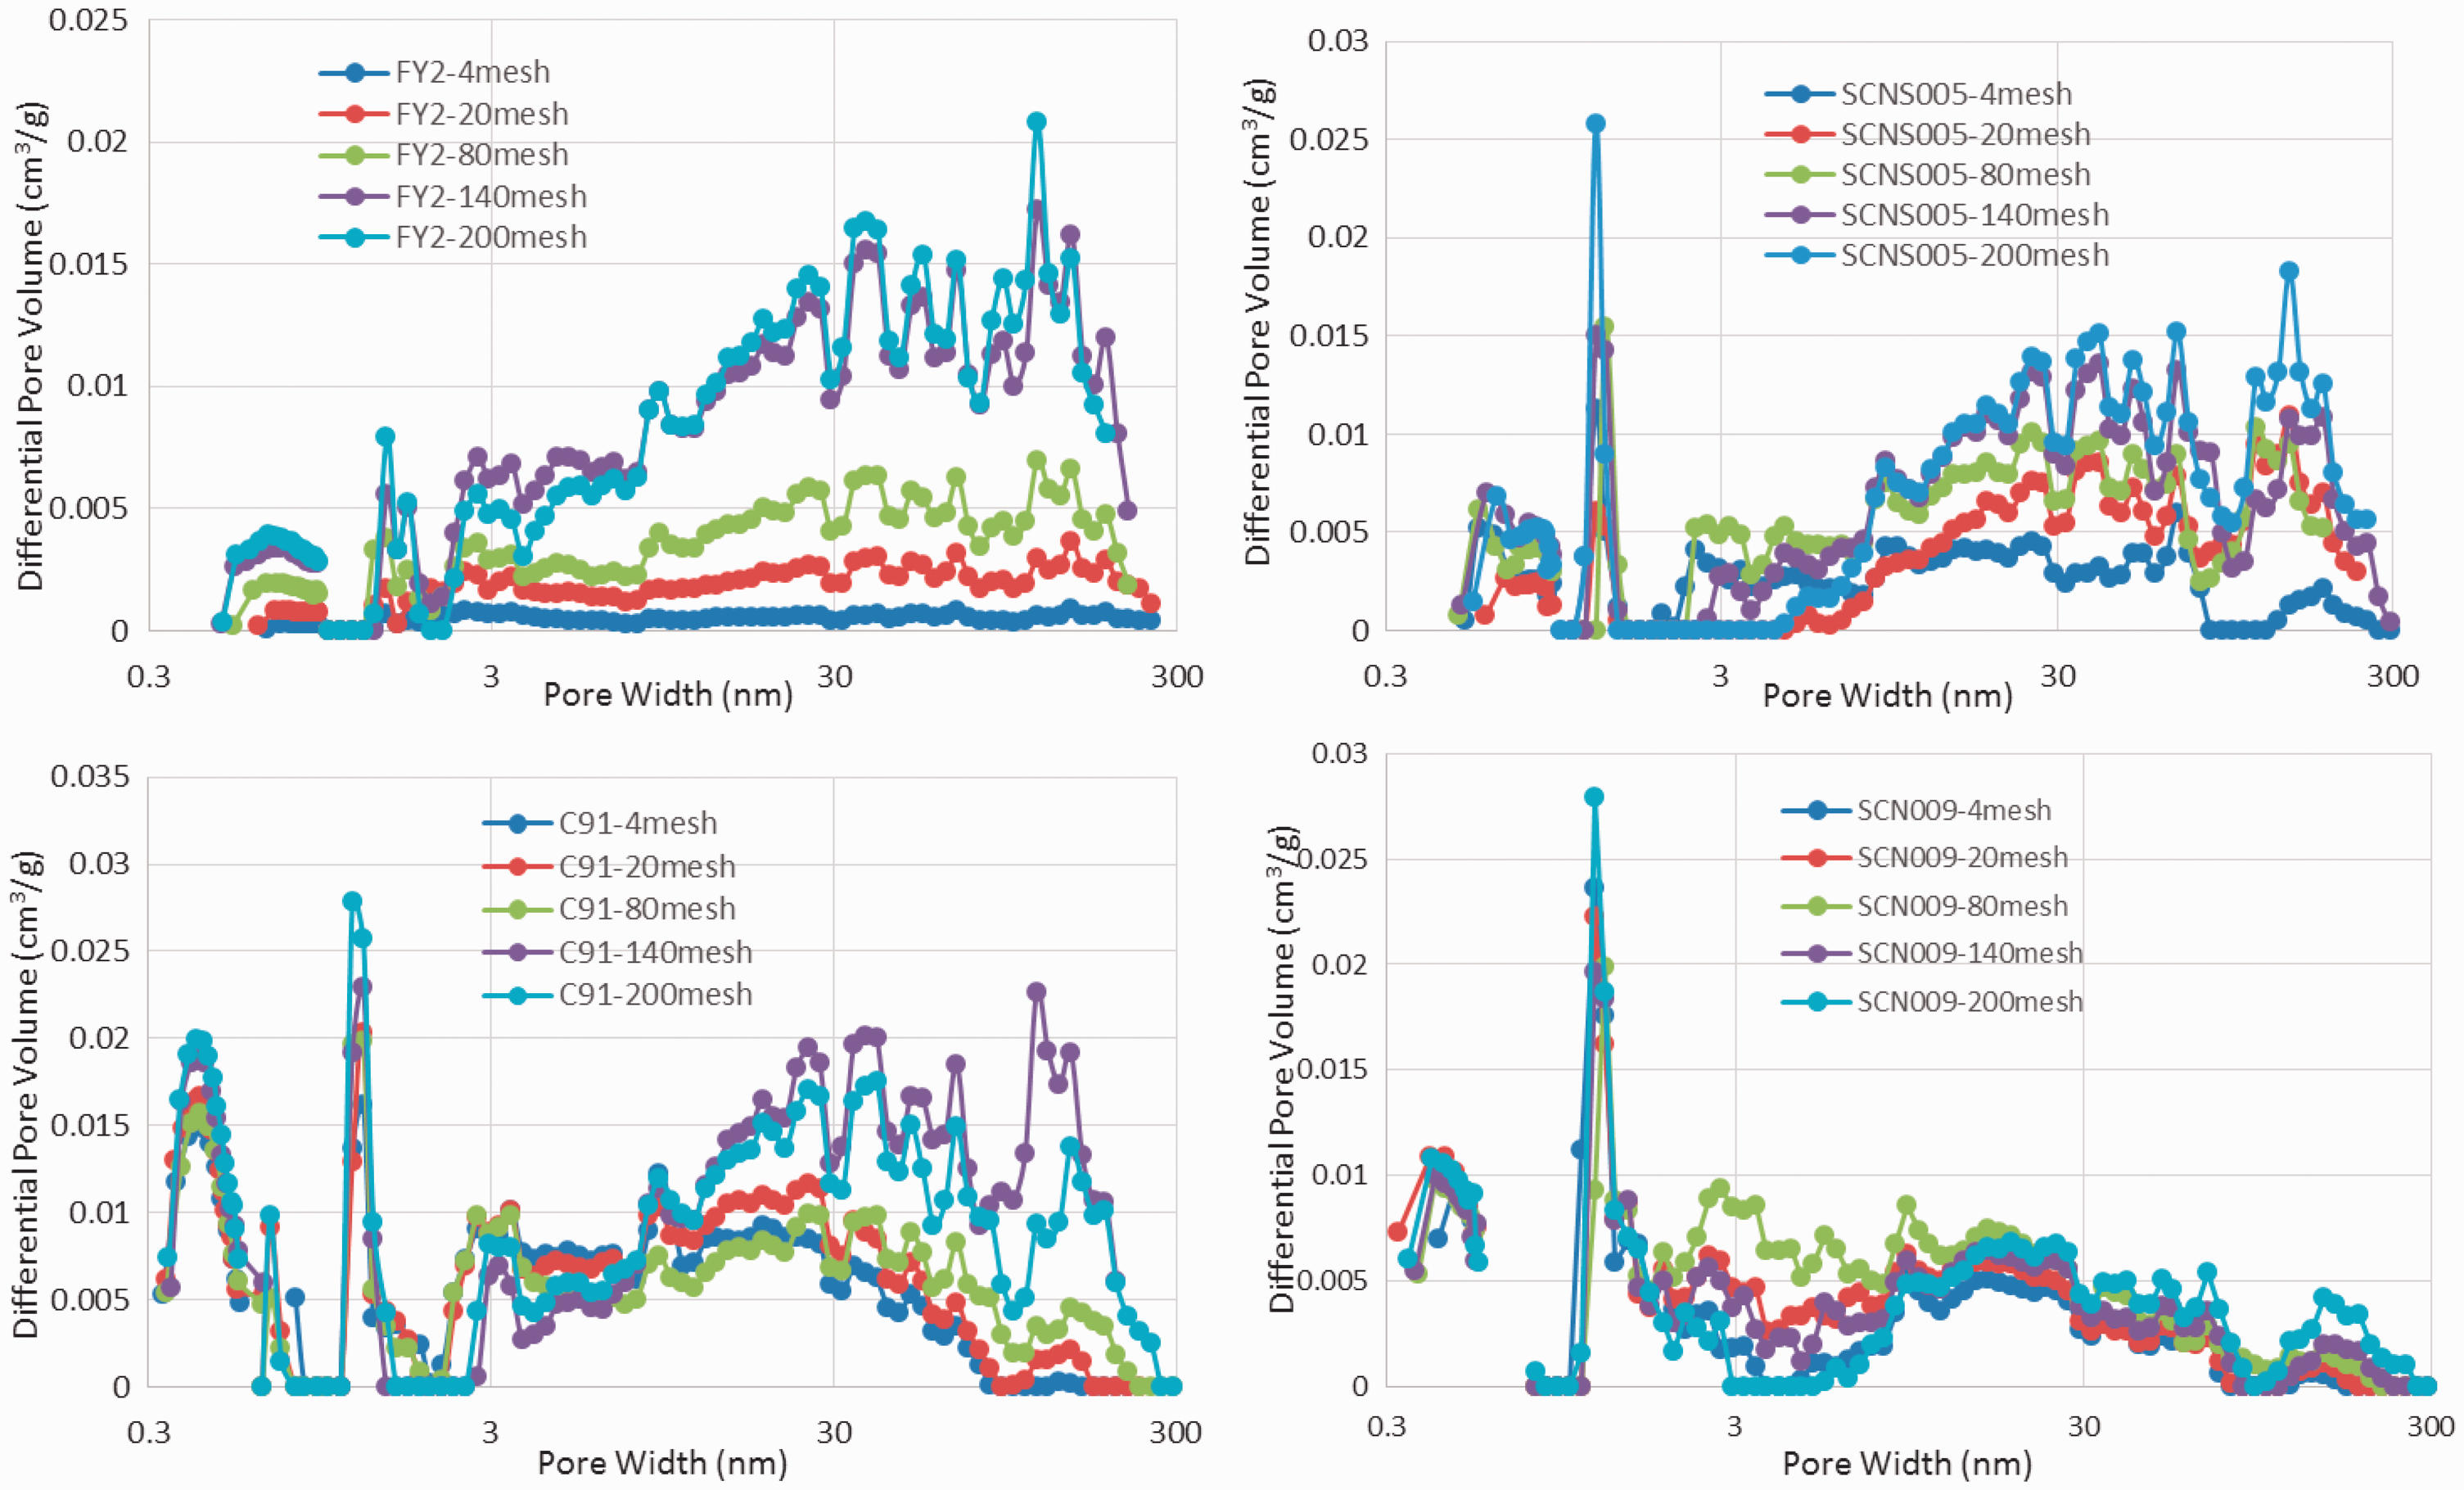
Pore volume and porosity of shale samples. Pore size distribution of shale samples calculated from the nitrogen adsorption isotherm using the HK (0.3–0.8 nm, Horvath and Kawazoe, 1983) and DFT (0.8–300 nm, Rouquerol et al., 1999) methods. DFT: density functional theory; HK: Horvath–Kawazoe.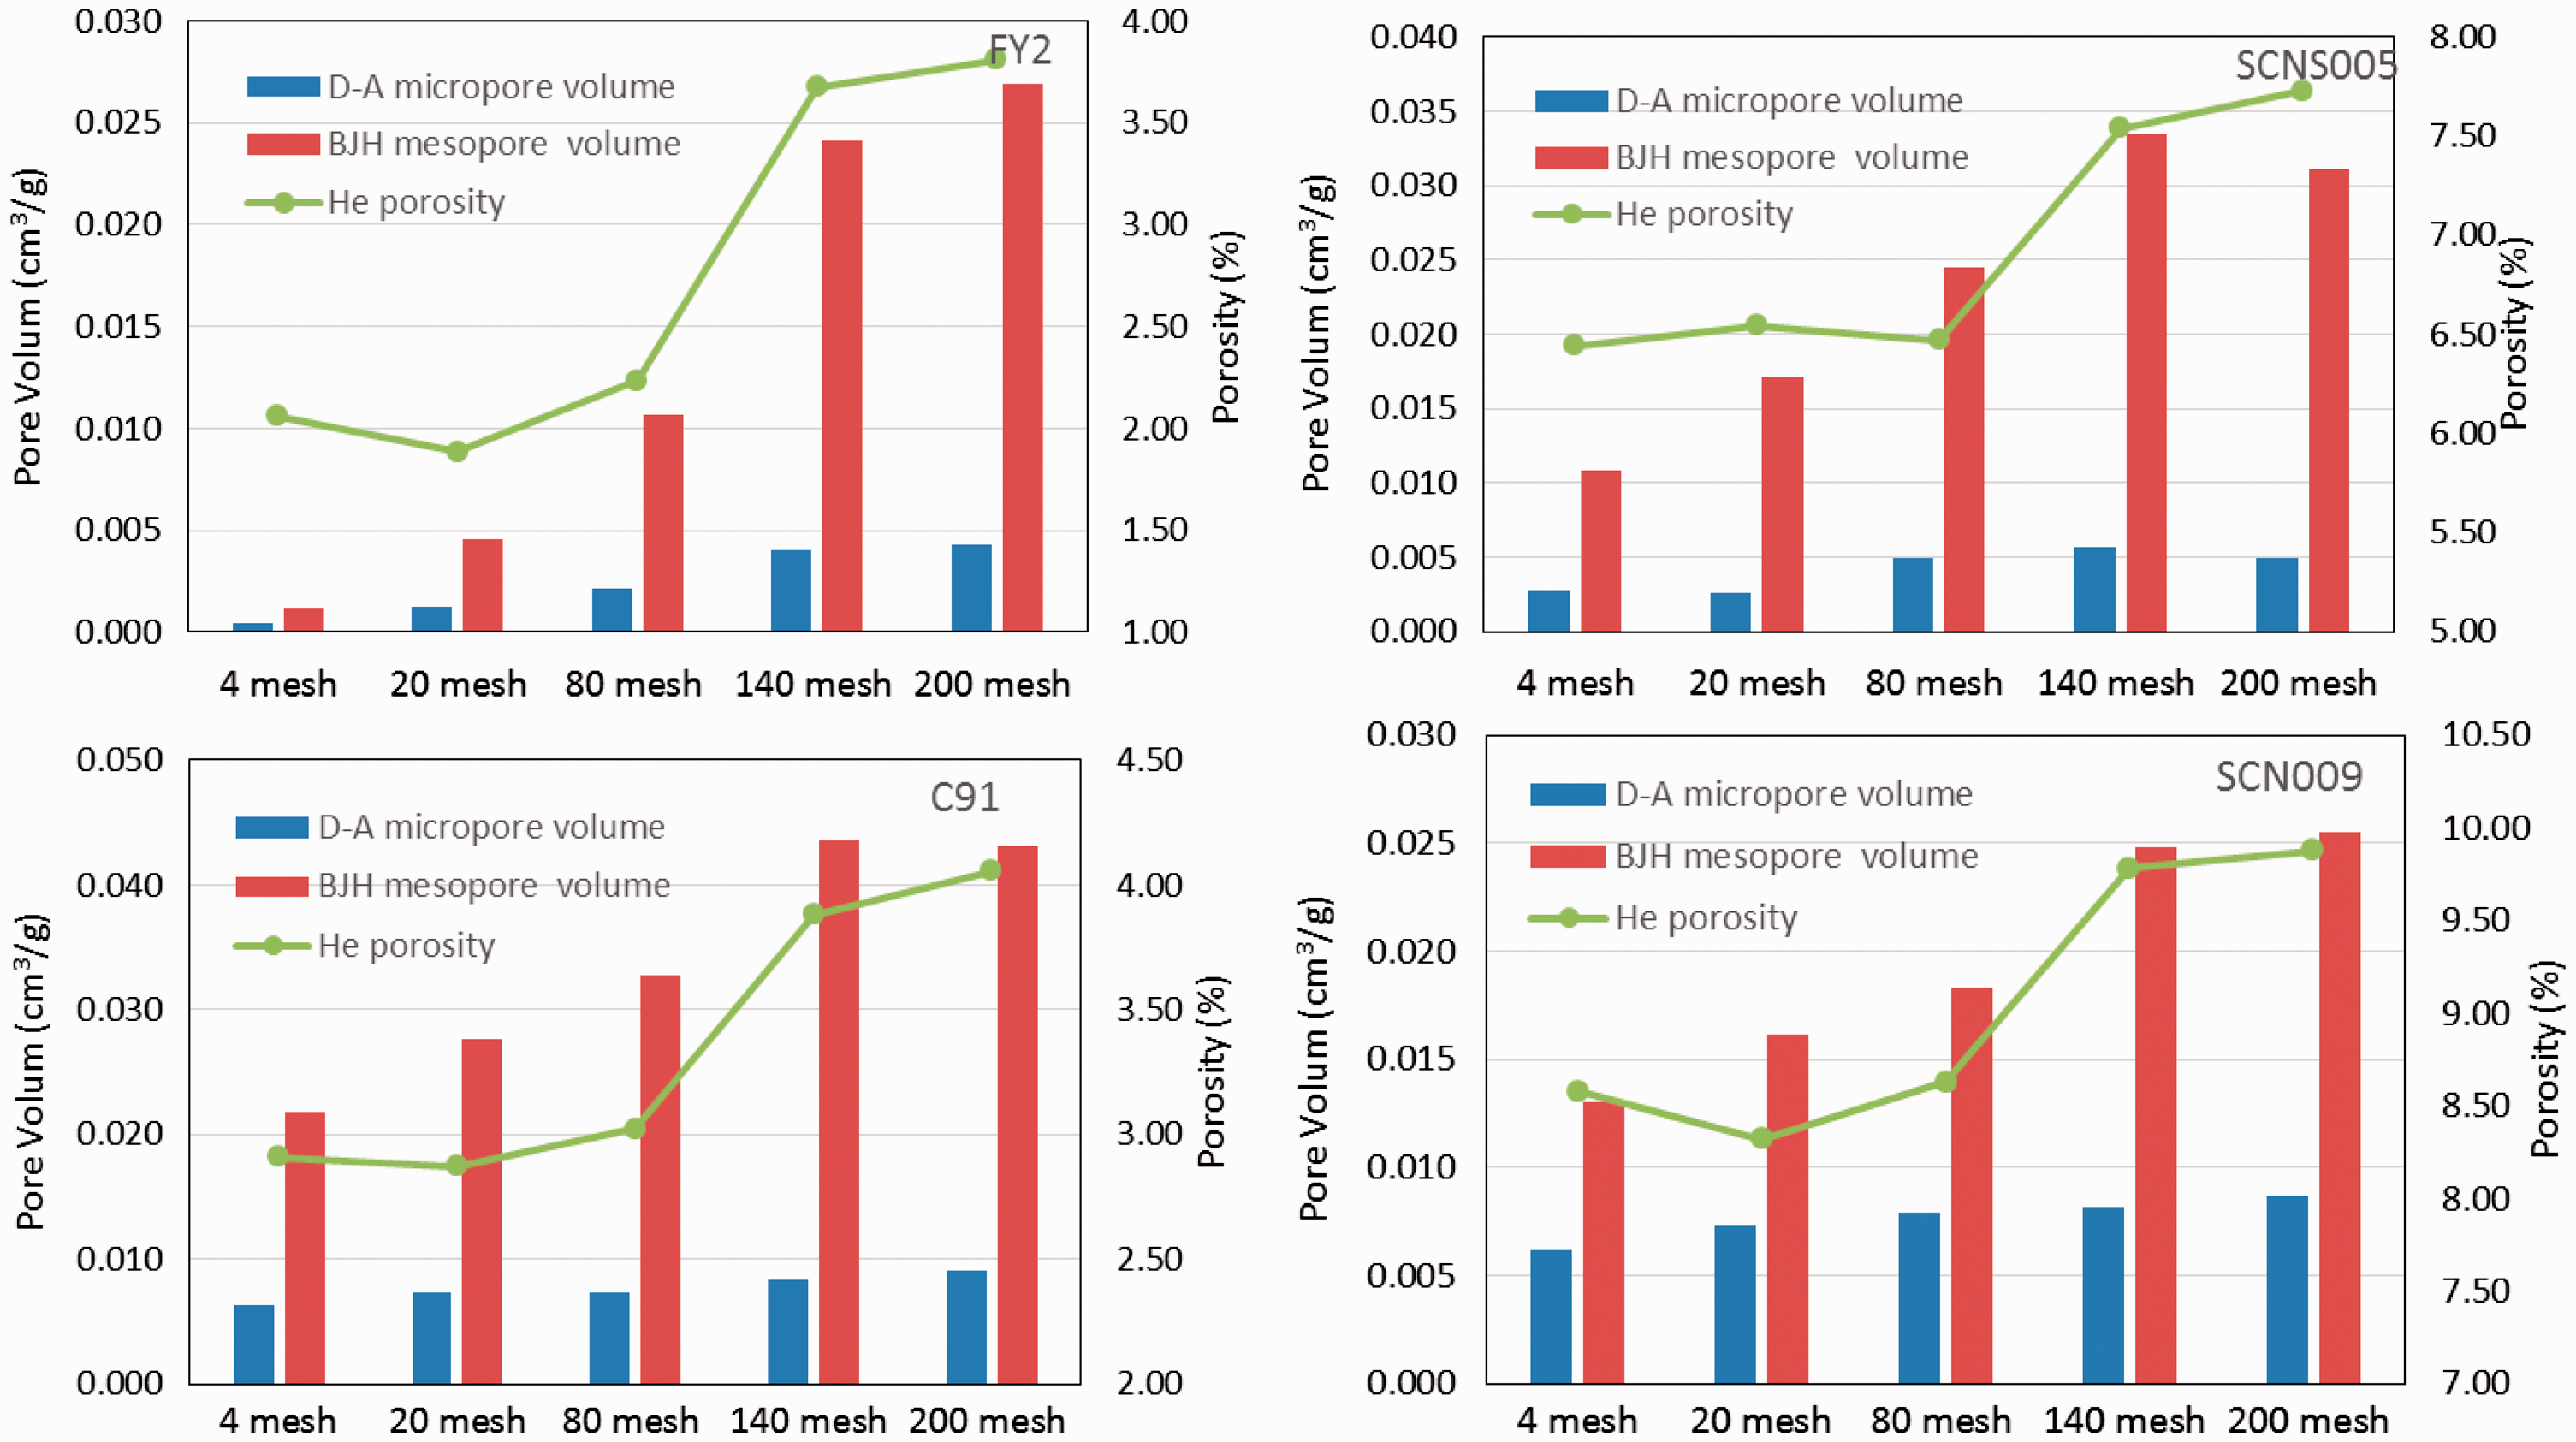
Results of the low-pressure N2 adsorption measurement indicate that pores accessible to N2 under the measurement conditions increase as the analytical particle size decreases, and the increase in mesopores is greater than that of micropores. The N2 diffusion rate through pores could be very low at the low temperature (−196℃) used in the low-pressure N2 adsorption measurements. Comminution of shale to a smaller particle size can reduce the path length for N2 to access the entire pore structure and increase the proportion of pores filling up with N2 under measurement conditions. This is one potential reason for the former result. On the other hand, with the decrease in particle size, inaccessible pores could be positioned close to the particle surface, become connected, and then increase the pore volume filling up with N2.
The pore size distribution isotherm of the shale samples generally increases as the analytical particle size decreases, but the pattern differs slightly between the samples (Figure 4). For shale FY2, all intervals of the pore size distribution isotherm increase as the analytical particle size decreases except for the interval of pore width 2–10 nm. The isotherm of pore width 2–10 nm increases with the particle size 4–140 mesh and decreases with the particle size 140–200 mesh. For shale C91, the isotherm of pore width 0.3–2 nm increases as the particle size decreases; the isotherm of pore width 15–300 nm increases with particle size 4–140 mesh, decreases with particle size 140–200 mesh, and the change in the isotherm of pore width 2–15 nm is small and shows low regularity. For shale SCNS005, the isotherm of pore width 0.5–2 nm and 10–300 nm increases as the analytical particle size decreases, and the change in the isotherm of pore width 2–10 nm shows low regularity. For shale SCN009, the isotherm of pore width 0.3–2 and 20–300 nm increases as the analytical particle size decreases, the change in the isotherm of pore width 20–300 nm is small, and the change in the isotherm of pore width 2–10 nm shows low regularity (Figure 4).
The evolution of the pore size distribution isotherm shows a similar trend to the pore volume and surface area. The low regularity of the change in pore width 2–20 nm was possibly caused by the imperfection of the DFT, which this isotherm interval was interpreted by because the isotherm of some samples in this interval coincide with the 0 line, which is obviously incorrect. The shale samples show different changes in the pore size distribution isotherm shape as the analytical particle size decreases. The increase in the pore size distribution isotherm of shale FY2 at pore width 10–300 nm is greater than that for pore width 0.3–2 nm; for shale C91 and SCNS005, the increase in these two intervals is similar, and for shale SCN009, the increase in the former is smaller than the latter (Figure 4). This was possibly caused by the different pore size distribution characteristics of the shale samples.
Comparison of porosity and pore volume
The evolution of the porosity of the shale samples with a decrease in the analytical particle size can be divided into three parts: part one is 4–80 mesh in which shale porosity changes slightly, part two is 80–140 mesh in which the increase of shale porosity is high, and part three is 140–200 mesh in which the shale porosity increases slightly (Table 2, Figure 3). This evolution indicates that, under the measurement conditions (25℃ and 0–7 MPa), the volume of pores accessible to helium do not change remarkably when shale is comminuted to a particle size larger than 80 mesh and increase obviously when comminuted to a particle size smaller than 140 mesh.
There is a remarkable difference between the evolution of shale porosity and pore volume with a decrease in the analytical particle size. The shale pore volume generally increases as the analytical particle size decreases from 4 mesh to 200 mesh (pore volumes of sample C91 and SCNS005 show a slight decrease when the particle size is smaller than 140 mesh), but shale porosity will not increase remarkably until a particle size smaller than 140 mesh is reached. This may be a result of the difference in the property of gas used in the measurements (N2 and He) and the measurement conditions.
The kinetic diameter of He is 0.2551 nm and is different from that of N2, which is 0.364–0.38 nm (Li et al., 2009). This may lead to a difference in the size of pores accessible to He and N2 molecules. However, this should not be the reason for the difference mentioned above because the difference of kinetic diameter of He and N2 molecules is not remarkable compare with the diameter range of evolution pores (0.3–300 nm). The range of relative equilibrium adsorption pressure (P/Po) in the low-pressure N2 adsorption measurement is 0.0001–0.995. When P/Po = 1, all N2 in pores will be in the adsorption or liquid state. Therefore, there should be a high quantity of N2 transformed into the adsorption or liquid state and stored in pores during the low-pressure N2 adsorption measurement. The quantity of adsorbed He in the porosity measurement is very low and is usually regarded as 0 (Gasparik et al., 2014; Mohammad et al., 2009; Sircar, 2001) for the low adsorption strength of He (Li et al., 2009) and relatively high measurement temperature (25℃). Adsorbed gas could collect at the pore throat and block the path for gas to access the entire pore structure, causing a gas diffusion problem. This should occur to a large extent in low-pressure N2 adsorption measurements because of the high quantity of adsorbed N2, but barely occur in porosity measurements. Comminuting shale to a smaller particle size will reduce the path length for gas to access, alleviating this problem and increasing the measured pore volume in the N2 adsorption measurement without causing a change in the porosity results. This should be the reason for the difference in evolution between the two measurement results.
Therefore, the reason for the evolution of helium porosity is the change in quantity of pores accessible to gas during comminution. For low-pressure N2 adsorption measurement, there are two reasons for the evolution result: the gas diffusion problem is alleviated and the change in the proportion of inaccessible pores. The evolution of shale He porosity suggests that the proportion of inaccessible pores will not change remarkably until a particle size smaller than 80 mesh is reached. According to the evolution results of the low-pressure N2 adsorption measurement, the gas diffusion efficiency will be improved under all comminution conditions. To obtain a correct understanding of the shale original pore structure, gas diffusion efficiency should be improved as much as possible, and changes in the inaccessible pore proportion should be avoided. Therefore, the recommended shale analytical particle size for helium porosity and low-pressure N2 adsorption measurements is below 20 and 80 mesh, respectively.
Proportion of inaccessible pores
Evolution of shale porosity is caused by a change in accessible pore quantity; the shale porosity change can be used to quantify the proportion of inaccessible pores. Assuming all pores in the 200-mesh shale particle are accessible, the proportion of inaccessible pores in the 4-, 20-, 80-, and 140-mesh shale particles can be calculated by contrasting the porosity data (Table 2). Among the five series of shale samples with different particle sizes, four mesh samples should be the most similar to intact shale and were used to represent the intact shale samples in this study.
The inaccessible pore proportion of shale ranges from 13.11 to 45.89% (Table 2). The evolution of the inaccessible pore proportion in shale shows a negative correlation with maturity indicators (Ro or Rb) and a positive correlation with the clay content (Figure 5). During the thermal evolution, the expulsion of organic matter would reduce its volume, resulting in an increase in original pore diameter and the generation of new pores (Chen and Xiao, 2014; Tiwari et al., 2013), which may result in the connection and accessability of previously inaccessible pores. There are numerous nano-scale pores in clay (Fishman et al., 2012; Loucks et al., 2012); the inaccessible proportion of those pores is possibly high, resulting in the positive correlation between inaccessible pore proportion and clay content in shale.
Correlation between proportion of inaccessible pores and Ro/Rb and the clay content.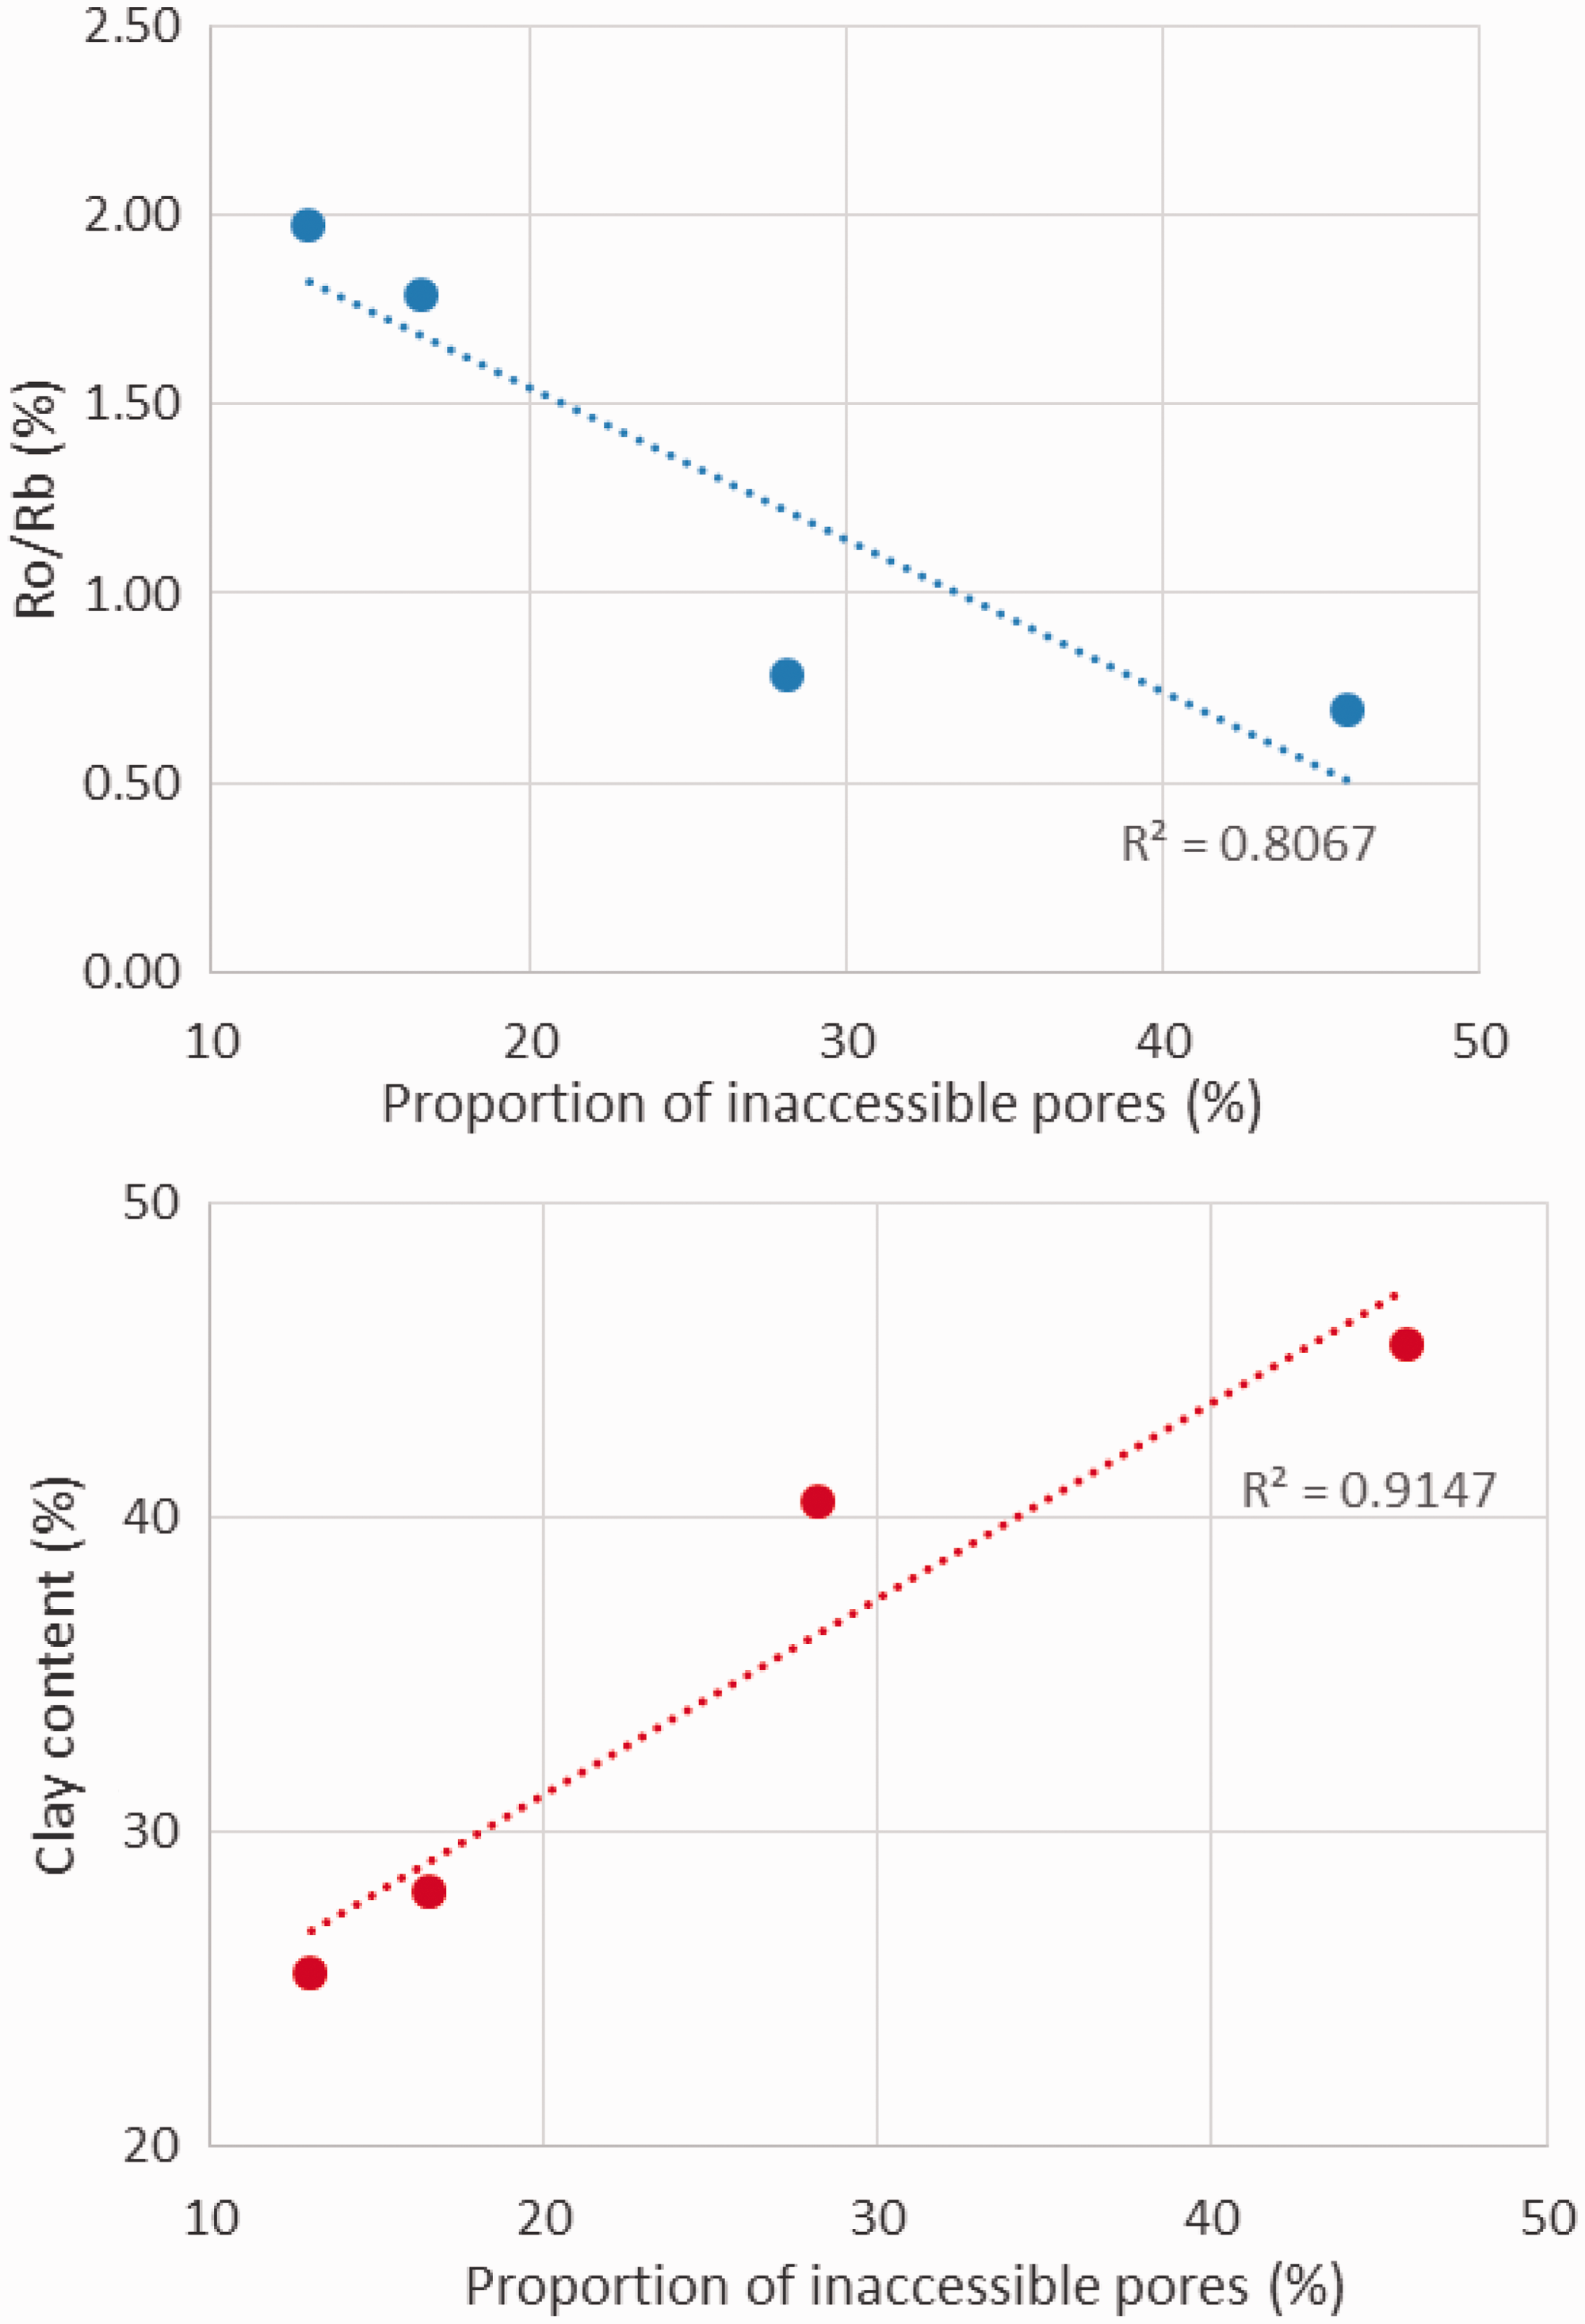
Conclusions
Low-pressure nitrogen adsorption and helium porosity measurements were used to analyze the pore characteristics of shale samples with different particle sizes to study the effects of comminution on shale pore structure. The following main conclusions have been reached:
There are two remarkable effects of comminution on shale pore characteristics. First, comminution reduces the proportion of inaccessible pores and increases shale porosity; second, comminuting shale to smaller particle sizes will reduce the path length for gas to access the entire pore structure, resulting in an improvement in diffusion efficiency. Microcracks and excess surface area created by comminution will not considerably affect shale porosity. Gas diffusion efficiency was improved during all comminution processes (from particle size smaller than 4 mesh to smaller than 200 mesh). The proportion of inaccessible pores in shale will not decrease remarkably until shale has been comminuted to a particle size smaller than 80 mesh. A decrease in the proportion of inaccessible pores by comminution of shale affects the results of both low-pressure nitrogen adsorption and helium porosity measurements. Improving gas diffusion efficiency only affects the results of the low-pressure nitrogen adsorption measurements. Therefore, the recommended analytical shale particle size for low-pressure nitrogen adsorption and helium porosity measurements is less than 80 and 20 mesh, respectively. The proportion of inaccessible pores in shale range from 13.11 to 45.89% and shows a negative correlation with thermal maturity and a positive correlation with clay content. This suggests an improvement in organic pore accessibility during thermal evolution and a high content of inaccessible pores in clay minerals.
Footnotes
Declaration of conflicting interests
The author(s) declared no potential conflicts of interest with respect to the research, authorship, and/or publication of this article.
Funding
The author(s) disclosed receipt of the following financial support for the research, authorship, and/or publication of this article: National Nature Science Foundation of China (Grant No. 41402128), “Strategic Priority Research Program” of the Chinese Academy of Sciences (Grant No. XDB10010103), “Light of West China” Program of the Chinese Academy of Sciences and the Key Laboratory Project of Gansu Province (No. 1309RTSA041).