
Abstract
Wind energy is one of the abundant, cheap and fast-growing renewable energy sources whose intensive extraction potential is still in immature stage in India. This study aims at the determination and evaluation of wind energy potential of three cities located at different elevations in the state of Tamil Nadu, India. The historical records of wind speed, direction, temperature and pressure were collected for three South Indian cities, namely Chennai, Erode and Coimbatore over a period of 38 years (1980-2017). The mean wind power density was observed to be highest at Chennai (129 W/m2) and lowest at Erode (76 W/m2) and the corresponding mean energy content was highest for Chennai (1129 kWh/m2/year) and lowest at Erode (666 kWh/m2/year). Considering the events of high energy-carrying winds at Chennai, Erode and Coimbatore, maximum wind power density were estimated to be 185 W/m2, 190 W/m2 and 234 W/m2, respectively. The annual average net energy yield and annual average net capacity factor were selected as the representative parameters for expressing strategic wind energy potential at geographically distinct locations having significant variation in wind speed distribution. Based on the analysis, Chennai is found to be the most suitable site for wind energy production followed by Coimbatore and Erode.
Keywords
Introduction
India has witnessed tremendous challenges in managing the ever-increasing energy demands from various sectors despite being blessed with plentiful availability of large number of alternate energy resources. The challenges are primarily accounted from population exploration, environmental degradation, energy pricing, energy security and various socio-economic crises. As a wake-up call for the nation, recently government has initiated various policies and programmes strongly in support of renewable energy aiming at significantly reducing its carbon emissions. Nonetheless, depletion of conventional energy sources and associated environmental sustainability issues has put up new strategies for researchers and policy makers to explore and discover renewable energy sources such as solar, wind, geothermal, tidal, biogas, biofuels, etc. Among these, the usage of wind energy has become a promising resource due to its competitive nature as a clean, abundant, easily harvestable, inexhaustible and affordable resource (Baker, 2003; Rehman, 2004). It is certain that irrespective of rampant irregularities existing in global renewable energy market, overall installed capacity for wind power has rapidly increased over 104% during the last decade which is a clear indicative of an increasing role of wind power in fulfilling the future energy demands (GWEC, 2018). Recently, China and USA upgraded their installed capacity within one year (2015–2016) by 23.328 GW and 8.203 GW, respectively, meanwhile the global wind power installed capacity shown a remarkable rise by 12.5% during the same period.
Modern technological developments have led to significant advancement in harvesting wind power by adopting new techniques for the design of wind machines (Akpinar, 2013). However, sustainability and efficiency in harvesting wind power in complex terrains largely depends on the suitability of selected locations for setting up large scale wind farms. For the development of wind power at any location, the statistical analysis of wind data serves as a key tool for assessing wind energy potential (Rehman and Ahmad, 2004). Extensive studies have been conducted on wind characteristics and wind power potential in many countries around the world (Al-Abbadi, 2005; Ahmed Shata and Hanitsch, 2006; Baseer et al., 2015; Chang et al., 2017; Elamouri and Ben, 2008; Keyhani et al., 2010; Kose, 2004; Oyedepo et al., 2012; Rafique et al., 2018a, 2018b; Rehman et al., 2003, 2007, 2017; Sohoni et al., 2017). Moreover, wind energy studies are being conducted even on buildings from the perspective of thermal comforts and ventilation design to enhance energy saving (Gao et al., 2018a, 2018b).
To accentuate the importance of evaluation of wind energy potential across the scales, a few selected studies have been briefly reviewed here. Alaydi (2011) analysed the collected wind data at two sites in the Gaza strip, namely, Gaza city and Gaza international airport in Rafah city and these cities were recommended for wind energy exploitation in the Gaza strip. Ajayi et al. (2011) assessed the potential viability of wind resource potential in Jos, Plateau State, Nigeria for power generation based on the monthly mean wing speeds of 1987–2007 and it was concluded that Jos was a suitable site for wind farm projects of varying sizes and that MW-h to GW-h of electricity was likely to be produced per period of months, seasons and years. Amoo (2012) examined the wind energy potential of Abeokuta and Ijebu-Ode, two southwest sites in Nigeria, and Ijebu-Ode was found to be better in terms of annual variation of mean wind speed. Ilkilic and Aydin (2015) studied the potential of wind power in the coastal areas of Turkey, namely, Black Sea, Marmara, Aegean and Mediterranean regions. They found that Istanbul, Izmir, Datca, Bandirma, Antakya, Canakkale and Hatay are the most promising areas for wind energy systems. However, Kaplan (2015) showed that although Turkey is having significant wind energy potential even more than many European countries (both onshore and offshore), the expected efficiency is not being achieved due to lack of national renewable energy policy. Dabbaghiyan et al. (2016) evaluated the wind energy potential in the province of Bushehr, Iran. They concluded that the annual mean wind power density for that location was found to be around 265 W/m2 for winds at a height of 40 m. Allouhi et al. (2017) evaluated the potential of wind energy in six coastal locations in the Kingdom of Morocco, namely Al Hoceima, Tetouane, Assila, Essouira, Laayoune and Dakhla. They concluded that Dakhla is the most suitable location for harnessing the wind power while Laayoune has been identified as the second most suitable site. Chen et al. (2018) have analysed the wind power potential in Saudi Arabia based on the MENA CORDEX (Middle East North Africa Coordinated regional climate downscaling experiment). They have identified that the high wind energy potential exists over a vast area of western Saudi Arabia. Salam et al. (2018) evaluated the wind characteristics, velocity and directions were studied using Weibull distribution based on the measurement of wind speed at two different locations in Brunei Darussalam. It was concluded that the annual en energy production at a wind speed of 5 m/s was found to be in the range between 1000 and 1500 kWh for both the locations in Brunei Darussalam.
So far, technical evaluation and estimation of wind energy potential from small to medium scale wind farms observed to be limited to a few island countries. Luong (2015) provided a critical review on potential and current status of wind energy utilization in Vietnam identifying the scope of large number of small scale wind farms. Ko et al. (2015) conducted wind power resource assessment by installing a meteorological mast in Weno Island, Chuuk State, in order to introduce wind energy in Chuuk State, Micronesia. They have reported that annual energy production in the range of 36 MWh can be derived from a 20 kW rated wind turbine. Becerra et al. (2017) presented a techno-financial evaluation of two Chilean locations with promising wind energy potential: Laguna Verde placed in the central region of the country and Porvenir in the southern region. Albani and Ibrahim (2017) investigated the wind energy potential by analysing a certain amount of gathered 10 minute measured data at four stations located at the coastal sites in Malaysia, namely, Kudat, Mersing, Kijal and Langkawi. They found that only Kudat and Mersing had a promising potential to develop a medium capacity of wind turbine power, while the other sites were suitable only for wind turbines at a smaller scale.
Although several studies have been carried out in various parts of the globe, scientific evaluation of the wind energy potential of sites in India are very few. Indian economy is in a major shift for implementing ‘low carbon strategies for inclusive growth’ where major government policies and programmes inevitably support renewable energy for combating the adverse impacts of conventional energy production technologies. As such, wind energy development in India has gained momentum only over the last few decades. Ramachandra et al. (1997) evaluated the wind energy availability and its characteristics at Kumta and Sirsi in Uttara Kannada district of Karnataka based on the primary data collected at these sites for a period of 24 months and concluded that coastal taluks such as Karwar and Kumta have good wind energy potential. Ganesan and Ahmed (2008) used wind speed and direction data measured at 10 m and 25 m above ground level for the assessment of wind power potential for Bhopal, India. They reported that the annual energy yields of 3.712 GWh and 4.431 GWh corresponding to hub heights of 50 m and 70 m. Chandel et al. (2014) assessed the wind resource potential of the Western Himalayan region of Himachal Pradesh, India using Weibull distribution function. The seasonal variations in daily mean wind speeds were used to estimate wind power density during summer and winter seasons. In another interesting study, Singh and Prakash (2018) evaluated the availability of wind energy for electricity production at different locations, i.e. Ranchi, Jamshedpur, Devghar, Lohardaga and Chaibasa in Jharkhand, India and reported that the sites studied were unsuitable for wind to electricity generation on a large scale at 10 m above the ground but small-scale wind turbines can be installed to extract energy from low-speed wind. Phadke et al. (2011) have reported Tamil Nadu as one of the potential states for harvesting 95% of the nation’s wind energy potential. But they have not mentioned the detailed intricacies of possible variations in considering the topographical differences at various locations within the state.
In this paper, wind characteristics and energy potential of three cities, namely Chennai, Erode and Coimbatore located at different elevations from the mean sea level, with different topographical features and different distances from the shore has been studied. Furthermore, the study provides the diurnal variation of the mean wind speed, wind directional analysis, wind direction frequency distribution, wind speed probability distribution function, monthly mean variation of the meteorological parameters, annual mean variation of the wind speed, annual mean variation of the Weibull parameters, wind energy yield and capacity factors, monthly net energy yield and monthly percent net capacity factor for the entire data set using five different wind turbines of 2.0 MW rated capacities. Although several studies have been reported on the potentiality of the wind speed as a direct indicator of wind power density, studies considering the combined effect of topography i.e., distance from the shore and the elevation are very limited. This study is the first attempt of its kind, where the combined effect of the above factors has been considered in estimating the wind energy potential of a location.
Study area and data description
The study focuses on analysing and determining the wind power potential of cities located in Tamil Nadu, India. The cities considered for the study are Chennai, Coimbatore and Erode located at 6 m, 183 m and 411 m above mean sea level (MSL). The map showing the locations of these cities (in dark boxes) is provided in Figure 1.
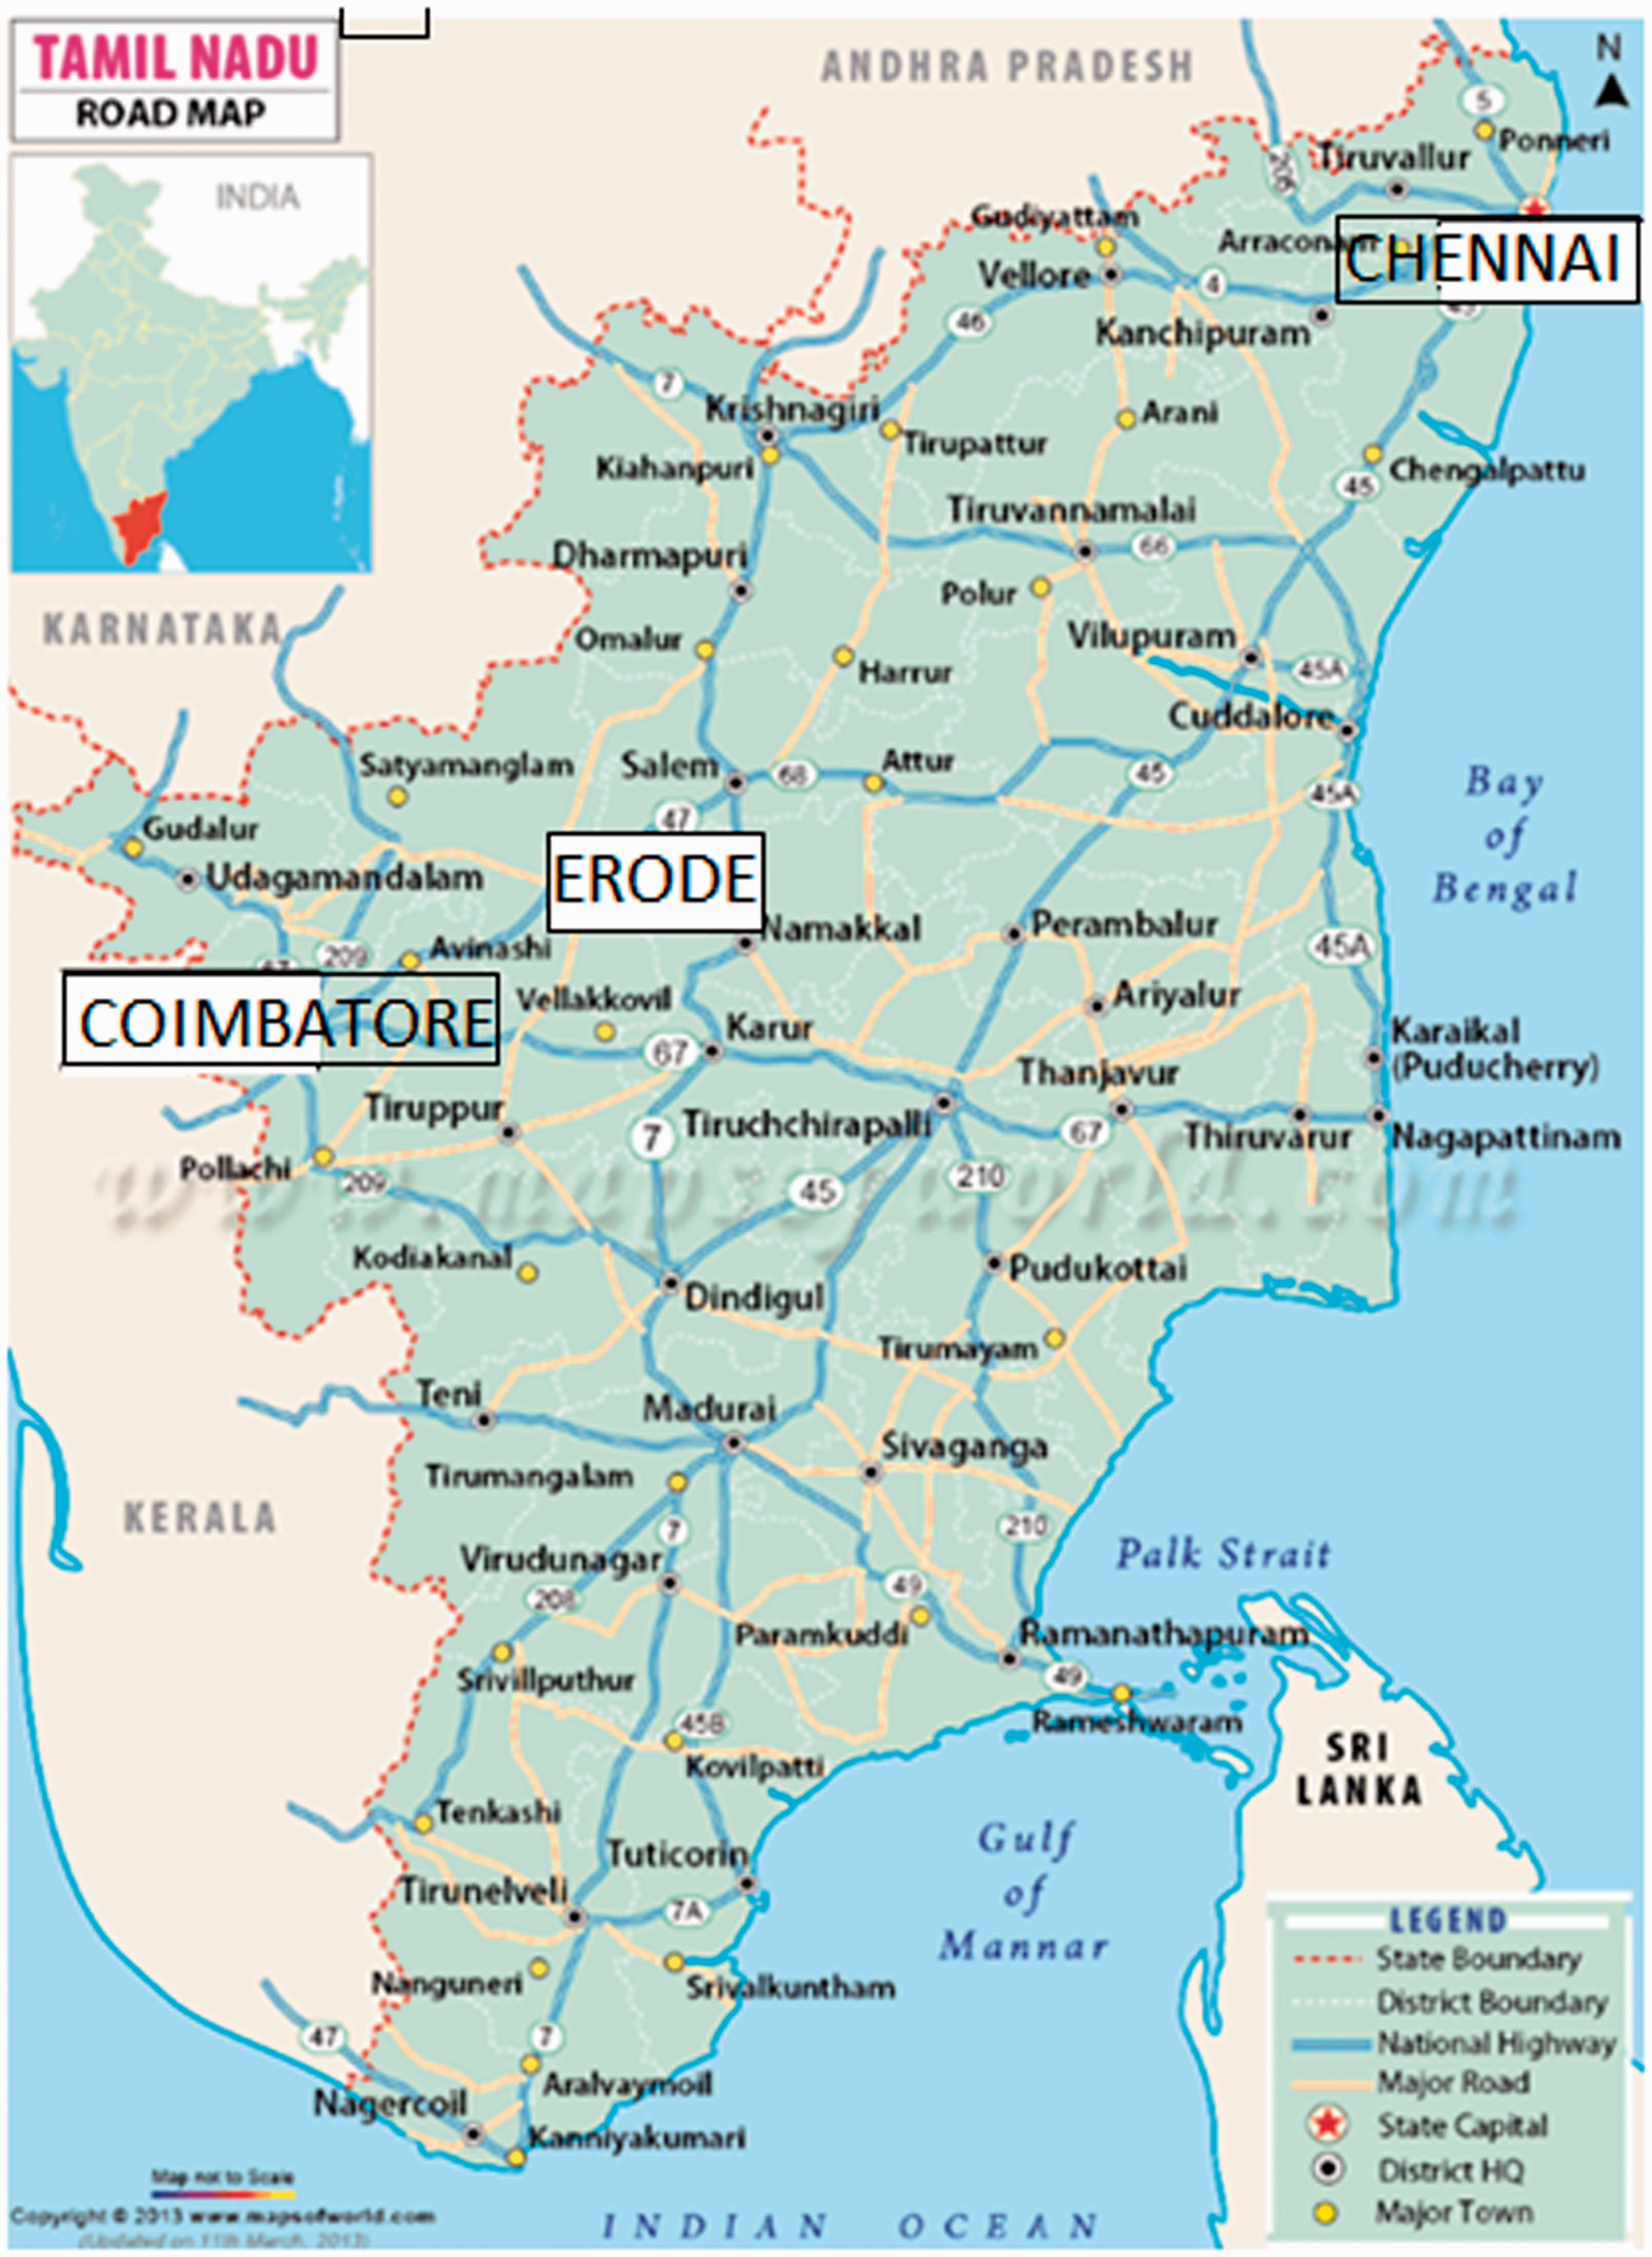
Map showing the geographical location of the cities in Tamil Nadu, India.
Chennai is located on the southeastern coast of India in the northeastern part of Tamil Nadu on a flat coastal plain known as the Eastern Coastal Plains. Chennai experiences tropical wet and dry climate and its average elevation is around 6.7 m above mean sea level (MSL) while the highest point is 60 m. The meteorological station in Chennai is surrounded by a fence about 3 m high, trees, and three storeys high two buildings. The terrain of this site is covered with grass and is almost open land on the northern side of the station 25 m away from the station. Erode District is landlocked and is comprised of a long undulating plain, sloping gently towards the Kaveri River in the south-east. The meteorological data collection station in Erode is an inland site 405 km south west of Chennai. The station surroundings are grassland and few small buildings around. Coimbatore is in the western part of Tamil Nadu and is surrounded by the Western Ghats mountain range on the west and north, with forests and the Nilgiri Biosphere reserves on the northern side. The meteorological station is located 100 km southwest of Erode at Tamil Nadu Agriculture University campus.
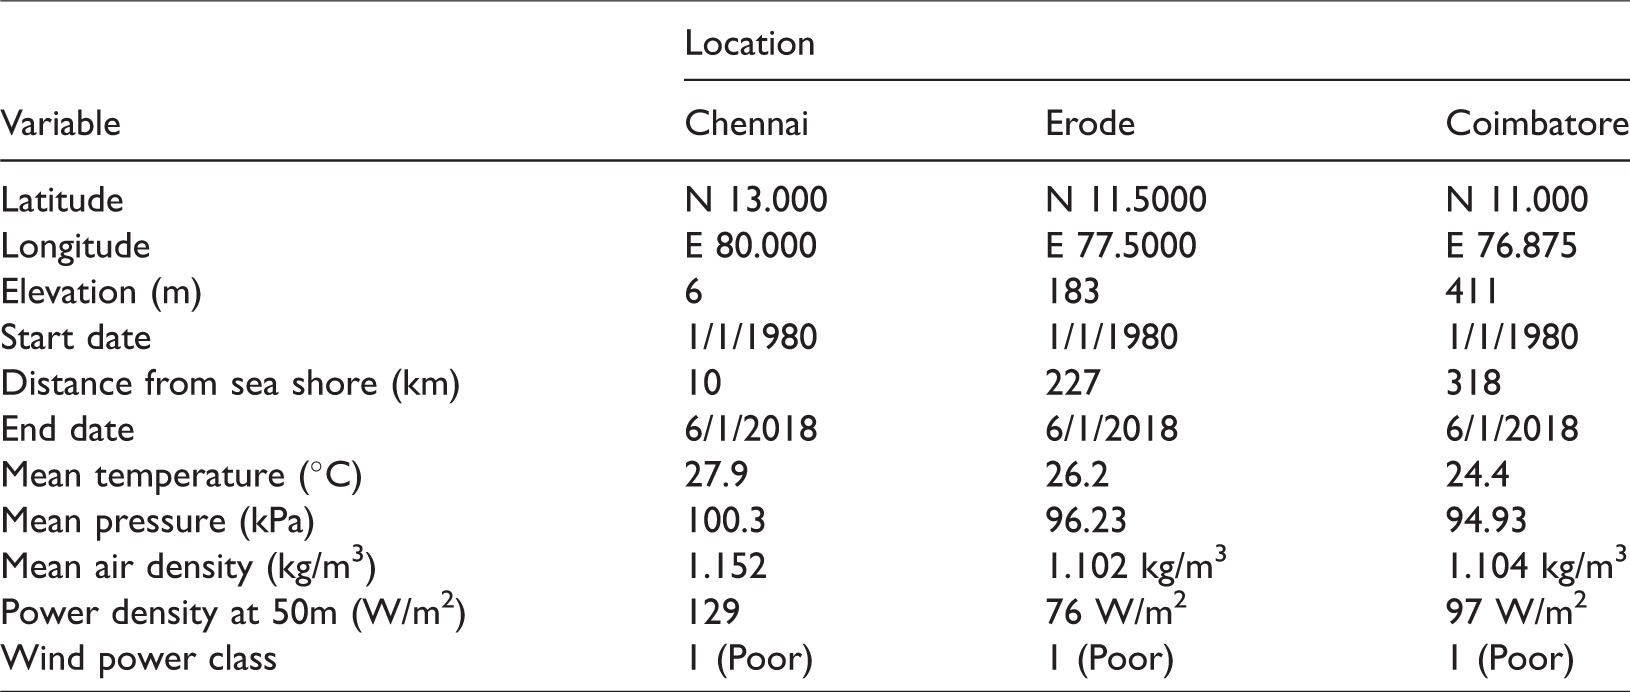
The summary of the site specific details (geographical coordinates, data collection period, long-term mean ambient temperature and pressure and air density) is provided in Table 1. Wind speed data were recorded/scanned every three seconds at 50 m above ground level (AGL) and were saved as hourly averages. The wind speed and other parameters were measured for the period of January 1980 to June 2018 (38 years). There are no missing observations in the recorded data. The calm threshold was identified as 0 m/s for all the stations. The mean temperature varies from 24.4°C to 27.9°C corresponding to Chennai and Coimbatore and while the respective air densities vary from 1.152 kg/m3 to 1.104 kg/m3 (Table 1). The mean pressure varies from 94.93 kPa to 100.3 kPa. The power density at 50 m height is found to be 129 W/m2 at Chennai, 76 W/m2 at Erode and 97 W/m2 at Coimbatore. The wind power class was found to be 1 for all the cities.
Site dependent data summary.
Material and methodology
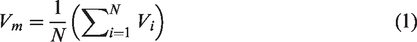
The mean wind speed of the known wind speed data has been calculated using the following expression
The maximum wind energy (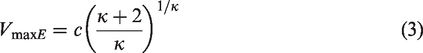
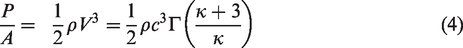
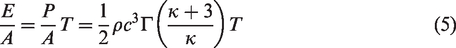
The wind resource potentiality of a site can be determined by calculating the wind power density. The wind power per unit area, P/A or wind power density (W/m2) is (Manwell et al., 2002)
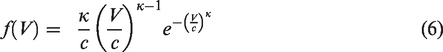
The knowledge of wind speed frequency distribution is very important to evaluate the wind potentiality of a particular location. The helps in explaining the behaviour of the wide range of the wind speed data. The simplest method to perform this is to use a probability distribution function. There are many distribution functions to describe the wind speed frequency curve such as Weibull, Rayleigh, Lognormal, etc. but the most commonly used distribution is the Weibull distribution (Ucar and Balo, 2011). The two-parameter Weibull distribution is the most appropriate and widely accepted as well as recommended distribution for wind speed data analysis. This is because it provides a better probability distribution than other functions (Akpinar and Akpinar, 2005). Hence, the same has been adopted for this study. The Weibull probability density function is given as
The Weibull parameters are calculated using maximum likelihood method, least square algorithm and WaSP algorithm (Windographer software). The mathematical equations of these methodologies are explained as follows:
Maximum likelihood method
This method was proposed by Stevens and Smulders (1979) for fitting a Weibull distribution to a set of measured wind speeds. This method uses the following equation to calculate the Weibull κ parameter in an iterative method.
Least squares algorithm for Weibull parameter fitting
The definition of the cumulative distribution function of the Weibull distribution is given as follows
This can be rearranged to give the following equation (10) which can be further simplified as equation (11)
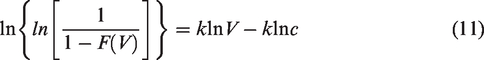
This equation (11) is of the form y = mx + c. Therefore, a plot of ln(V) on the x-axis and
WAsP algorithm for Weibull fitting
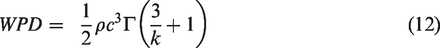
The WAsP algorithm is based on the two principles: (i) the mean power density of the fitted Weibull distribution is equal to that of the observed distribution and (ii) the proportion of values above the mean observed wind speed is the same for the fitted Weibull distribution as for the observed distribution. Considering the first condition, the following equation (12) gives the mean power density (WPD) of the Weibull distribution, assuming constant air density while the mean power density of the observed wind speeds, assuming constant air density is obtained from equation (13).

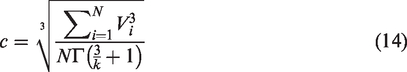
Applying principle (i) in equations (12) and (13) and solving, the expression to calculate the values of parameter c so obtained is given by equation (14).
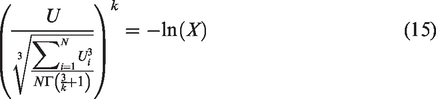
In order to fulfilment of second condition, symbol X is used to represent the proportion of the observed wind speeds that exceed the mean observed wind speed. The cumulative distribution function F(V) gives the proportion of the values that are less than V and 1-F(V) is the proportion of values that exceed V. In the WAsP algorithm, the value of X is first calculated and then the above equation (15) is solved iteratively, using the Brent method, to find the shape parameter κ. Then, the equation (14) is solved to obtain the value of scale parameter c.
Results and discussion
The wind speed characteristics (site dependent, annual, monthly and diurnal scales) over a long period of almost 38 years at three locations are analysed and described in the following sub-sections. These characteristics will include the wind speed, direction, wind power density, Weibull parameters, energy yield and plant capacity factor using five different wind turbines each of 2.0 MW rated power.
Long-term variation at three sites
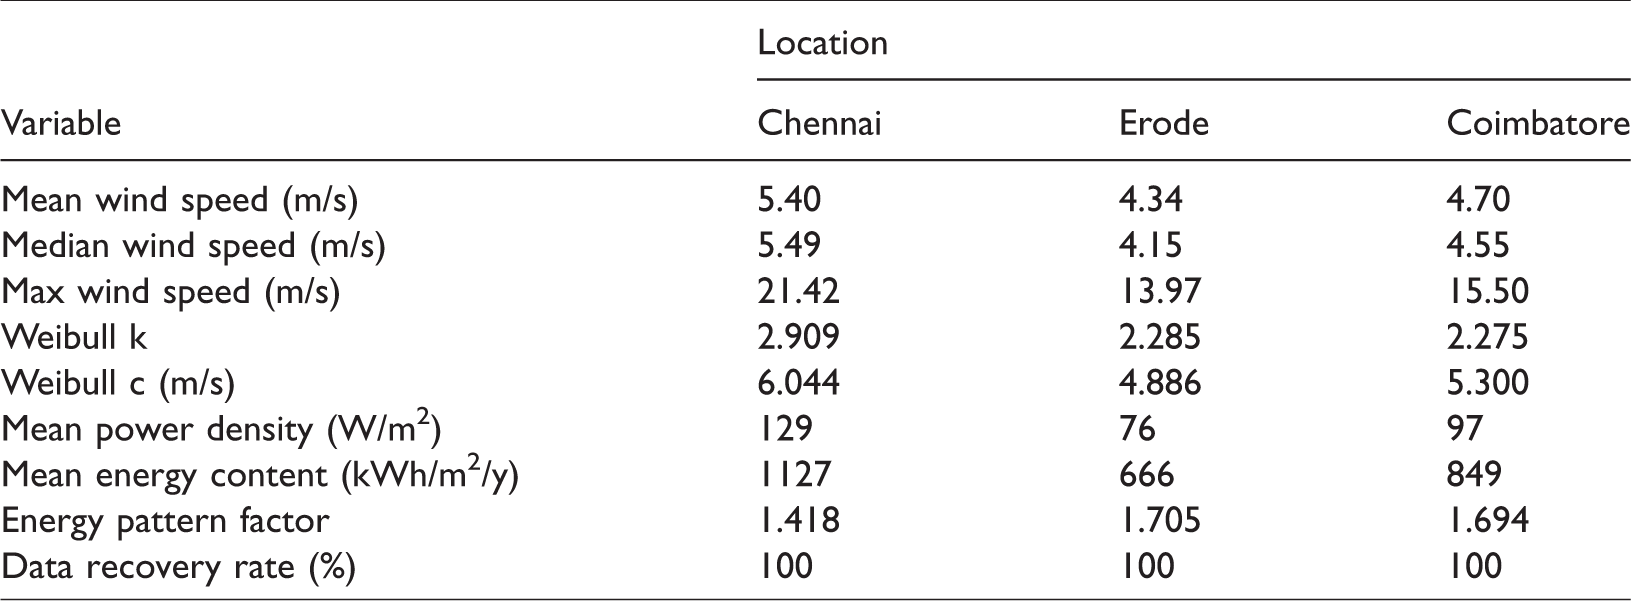
The long-term average wind speed at 50 m above ground level over entire data collection period at Chennai, Erode and Coimbatore is compared in Table 2. As one moves away from the coastal site (Chennai) towards in land (Erode and Coimbatore) the mean wind speed decreases. Also, the mean maximum wind speed of 21.42 m/s is found at Chennai over the data collection period and a mean minimum of 13.97 m/s at Erode. The parameters obtained by fitting a two-parameter Weibull distribution are also provided. Maximum wind power density of 129 W/m2 is obtained for Chennai and a minimum of 76 W/m2 at Erode. The mean energy content for the three cities are 1127 kWh/m2/year for Chennai, 666 kWh/m2/year for Erode and 849 kWh/m2/year for Coimbatore. The energy pattern factor varies from 1.418 to 1.705. The higher values of mean wind speed, wind power density and mean energy content at Chennai may be due to its being the coastal site which is open to sea on the eastern side and is also relatively flat land. The above parameter values are the least at Erode measurement site, may be due to inland location though having gentle topographic features. However, Coimbatore station is relatively better as far as wind characteristics is concerned though locked by mountains in the north and south and to certain extent in west as well. The topographical features in this area are expected to be contributing to relatively higher values of wind speed and other parameters.
Wind speed sensor summary.
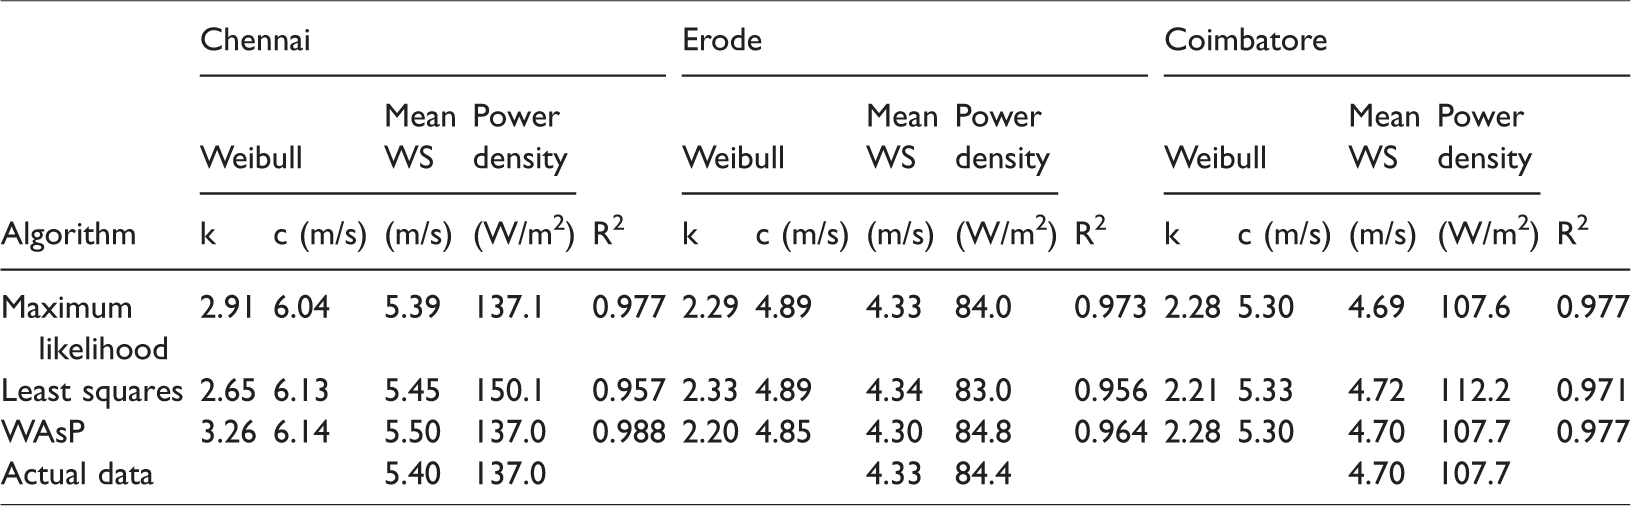
The Weibull parameters are calculated using three methods, viz., maximum likelihood, least squares and WAsP and then the mean wind speed and wind power density (WPD) values are calculated using these parameters and the measured data. Further to compare the performance of these methods, the mean wind speed and WPD values, so calculated, are compared with measured values using coefficient of determination (R2) values. For Chennai station measured data, the maximum value of R2 is obtained using WAsP algorithm while almost same performance is obtained from maximum likelihood method (Table 3, column 6) with R2 value of 0.977. At Erode and Coimbatore, maximum likelihood and WAsP algorithms produced the best values of R2, respectively. With this analysis, it is evident that both maximum likelihood and WAsP algorithms could be used for the estimation of Weibull parameters with acceptable accuracy. However, keeping in view the ease of the method, maximum likelihood method can be preferred.
Comparison of Weibull parameters calculated using three methods (1980 -2017).
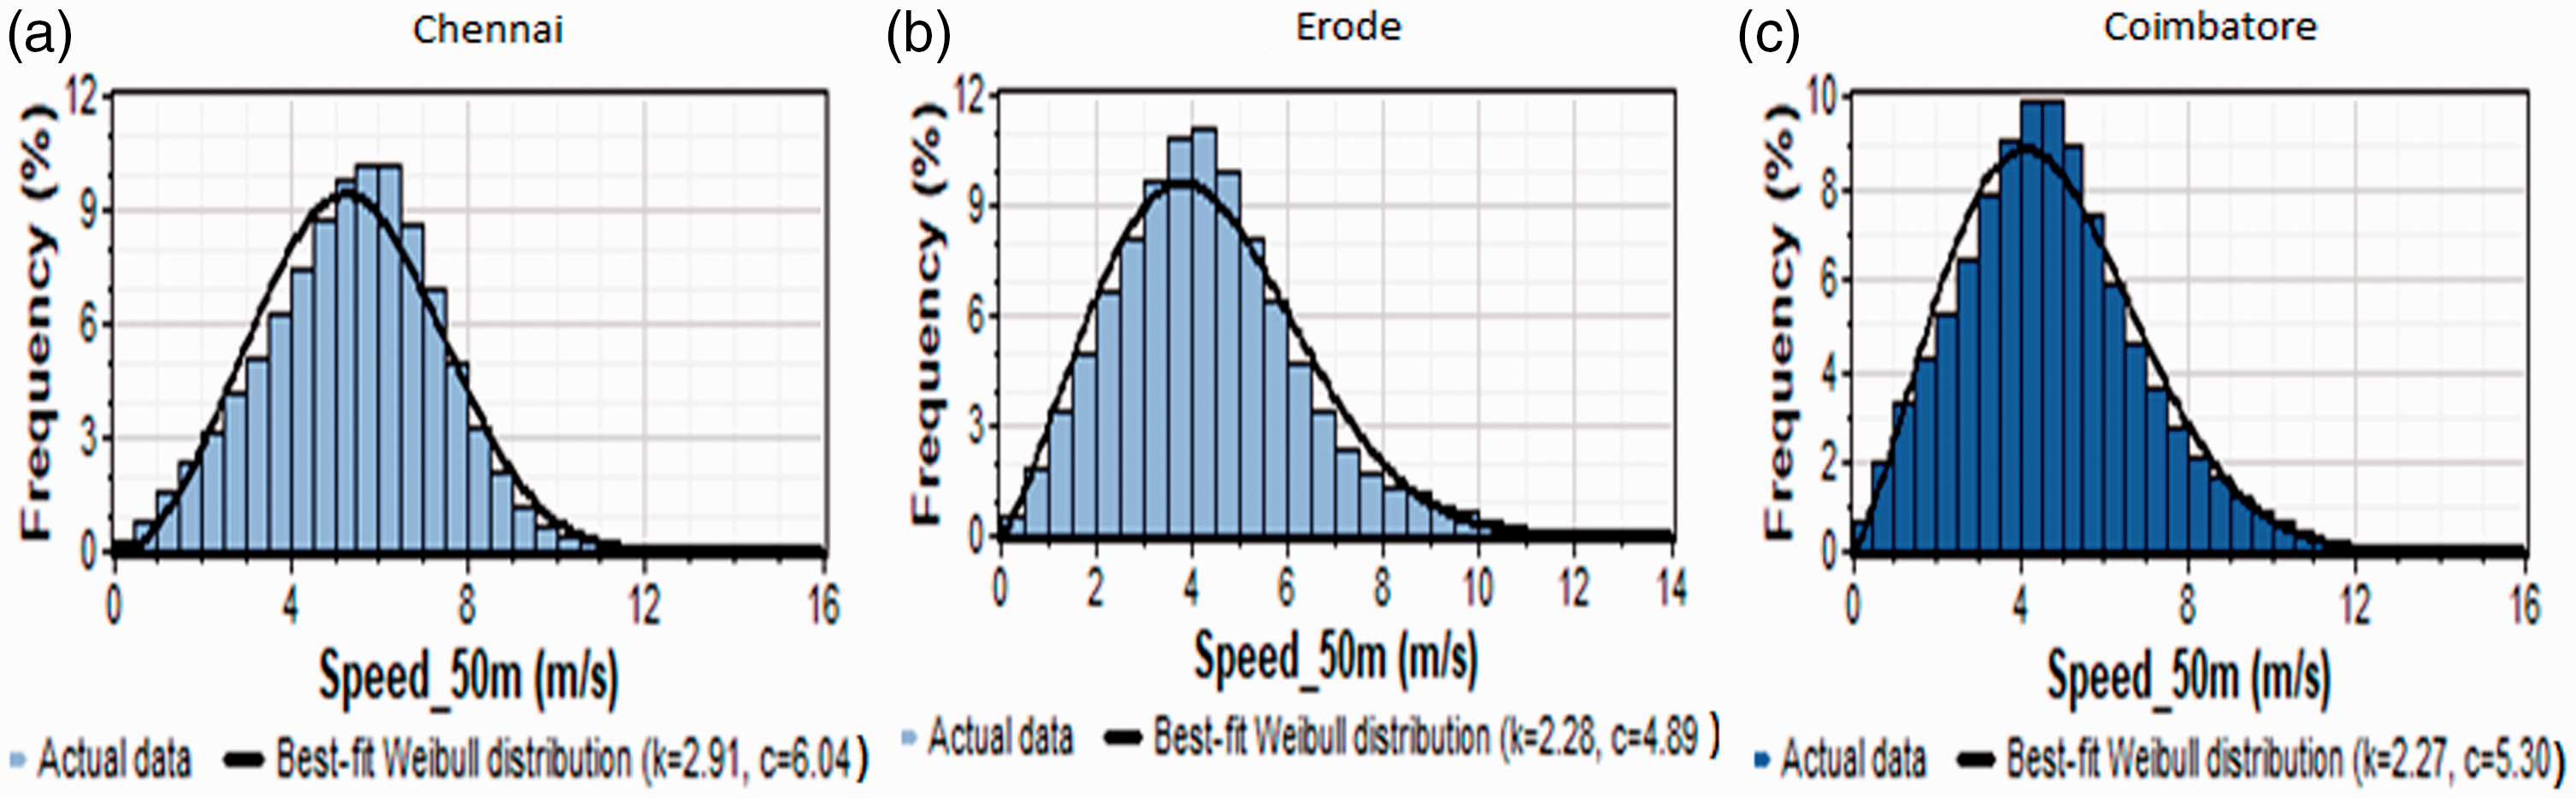
Higher magnitudes of 6.0 m/s and more are found to be more prevalent from northeast and southwest directions at Chennai data collection station as shown in Figure 2(a). This is also reflected in Figure 3(a) that more than 50% times the wind blows from south-west direction and around 30% of the times from north-east at Chennai. At Erode station, the higher magnitude winds between 5.0 m/s and 6.0 m/s blow from west-south and west-north directions as can been observed from Figure 2(b). This is also reflected in Figure 3(b) that around 45% times the wind blows from west-south and west-north directions. At Coimbatore, wind speeds of 5.0 m/s to 6.0 m/s blow from the west and west south directions, Figure 2(c) which is also reflected in Figure 3(c) that 45% to 50% times of the wind comes from these directions. The frequency distribution of wind speed in different speed bins at three locations is shown in Figure 4(a) to (c) along with the Weibull fit and is indicative of excellent representation of wind speed by Weibull fit. It is evident from these figures that wind speed remained around 70%, 60% and 70% between 4.0 m/s and 8.0 m/s at Chennai, Erode and Coimbatore; respectively. This means that wind power can be generated at these sites above these percentages of times.
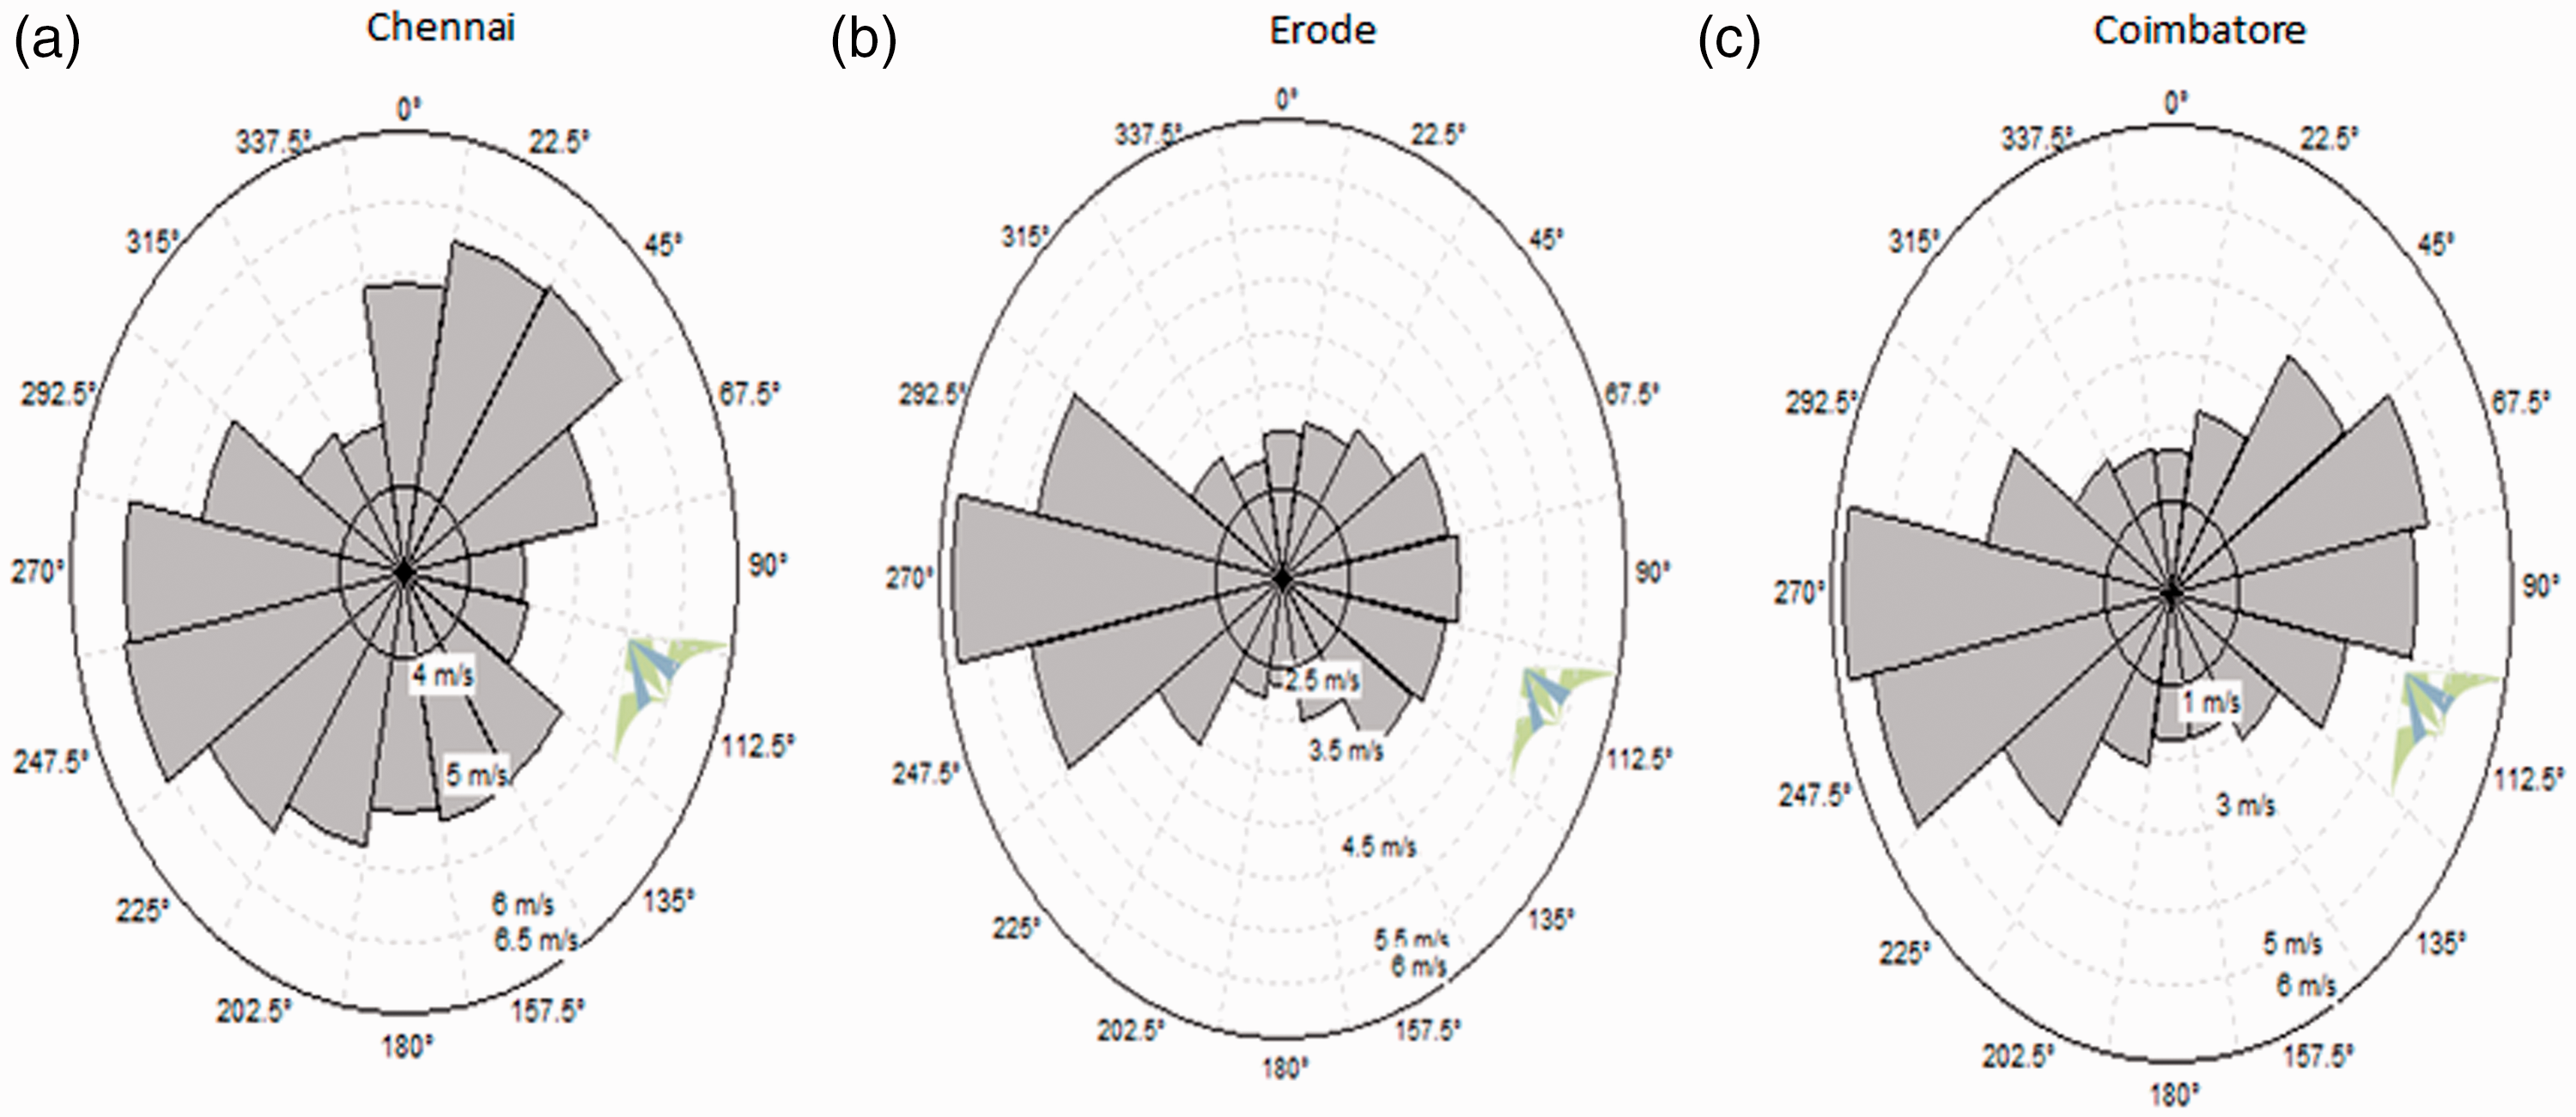
Mean wind speed distribution in different wind directions (1980-2017).
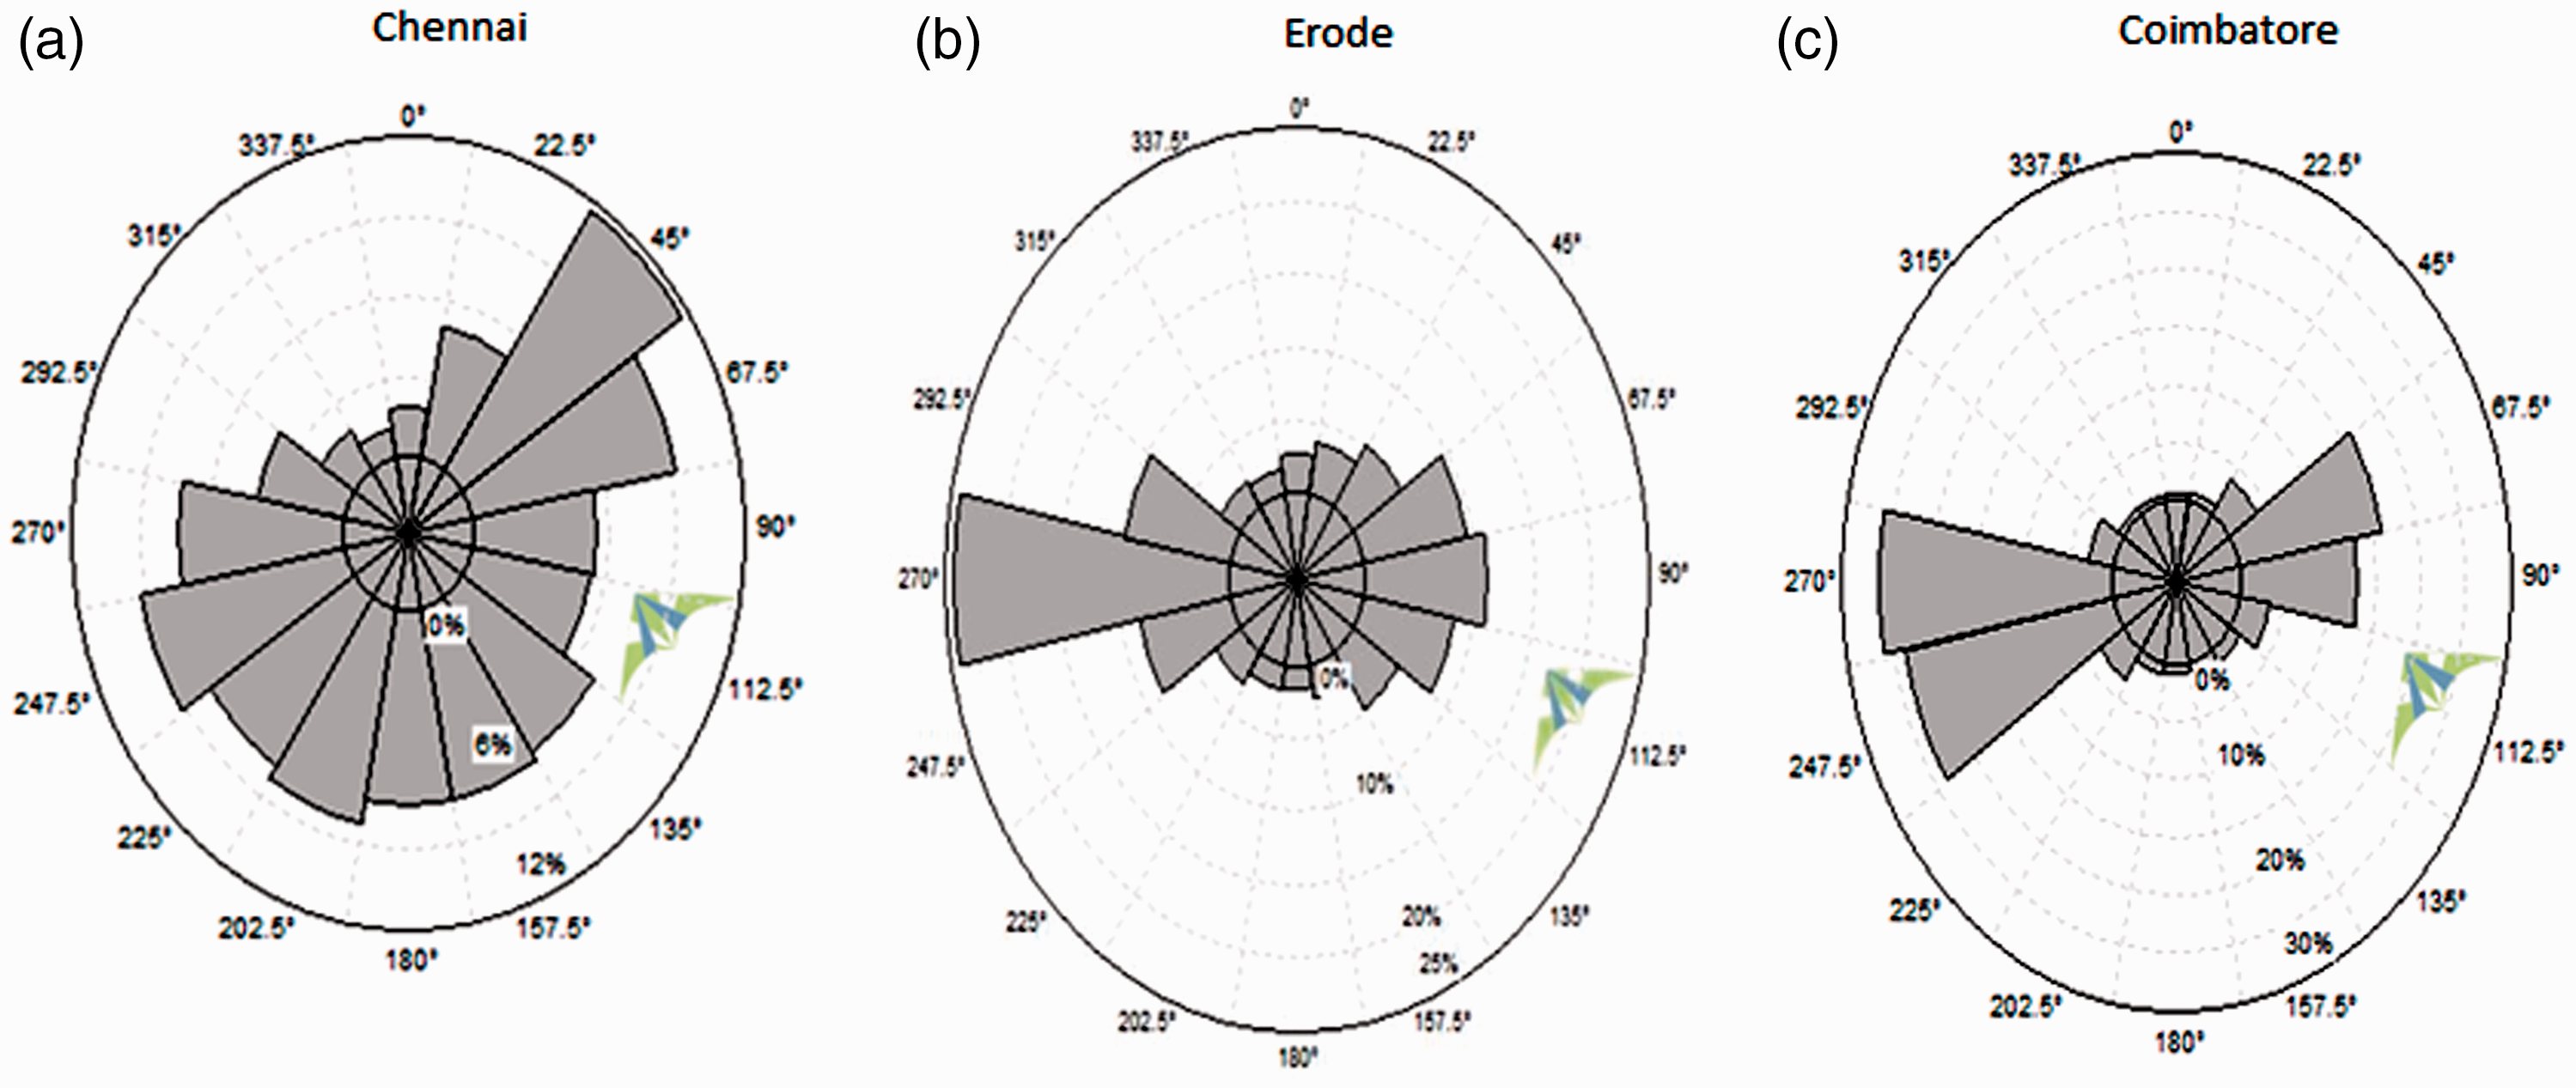
Wind direction rose diagram (1980 -2017).
Hourly mean wind speed frequency distribution (1980–2017).
Long-term annual variation
The annual variation of wind speed over a longer period and other parameters is important to have confidence on the annual availability of wind for power generation. At Chennai, the annual mean wind speed varied between a minimum of 5.1 m/s in 2008 and a maximum of 5.9 m/s in 1983 while remaining around 5.2 m/s during most of the years (Figure 5). However, larger variations are noticed in annual mean wind speed values at Chennai with an overall decreasing trend from 1980. These variations can be due to being an open side to the sea on east. At Erode meteorological station (Figure 6), the annual mean wind speed showed a consistent (4.2 m/s) behaviour with minimum and maximum wind speeds of 4.0 m/s and 4.5 m/s. This consistent behaviour may be accounted for being the locked site from all the direction, the gentle topographical features and being away from the sea. At Coimbatore (Figure 7), the wind speed always remained more than 4.4 m/s with a minimum of 4.3 m/s in 2015 and a maximum of 5.1 in 1990. Overall, larger variations are observed at this site. These variations may be accounted for rough topographical features in Coimbatore.
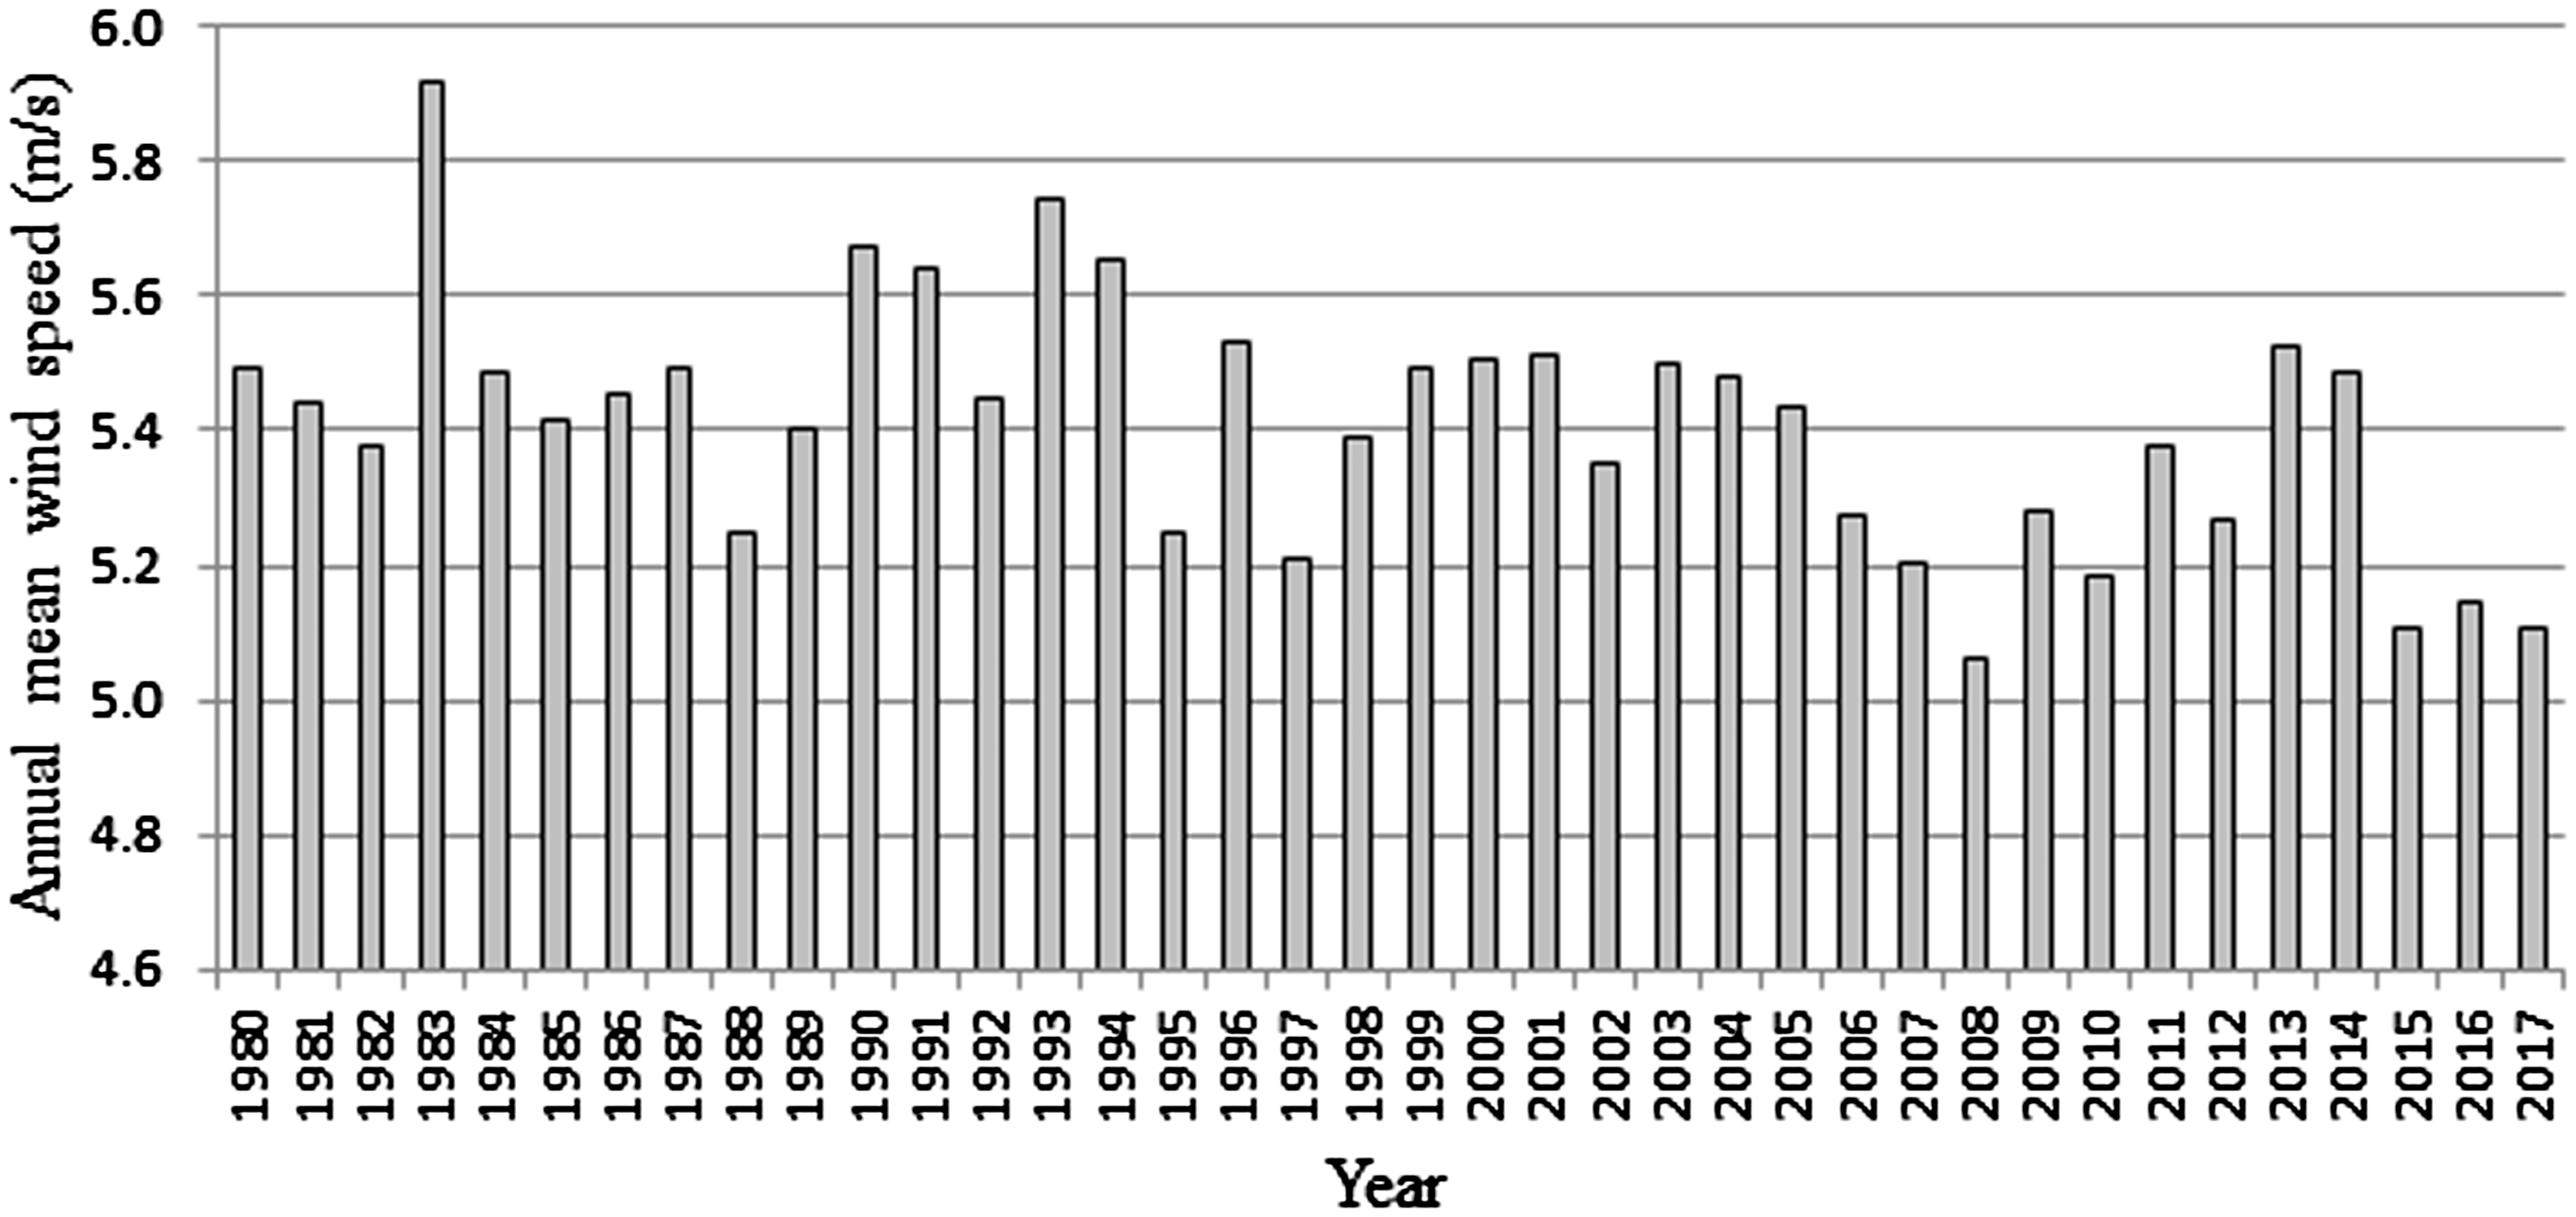
Annual mean wind speed variation at Chennai (1980–2017).
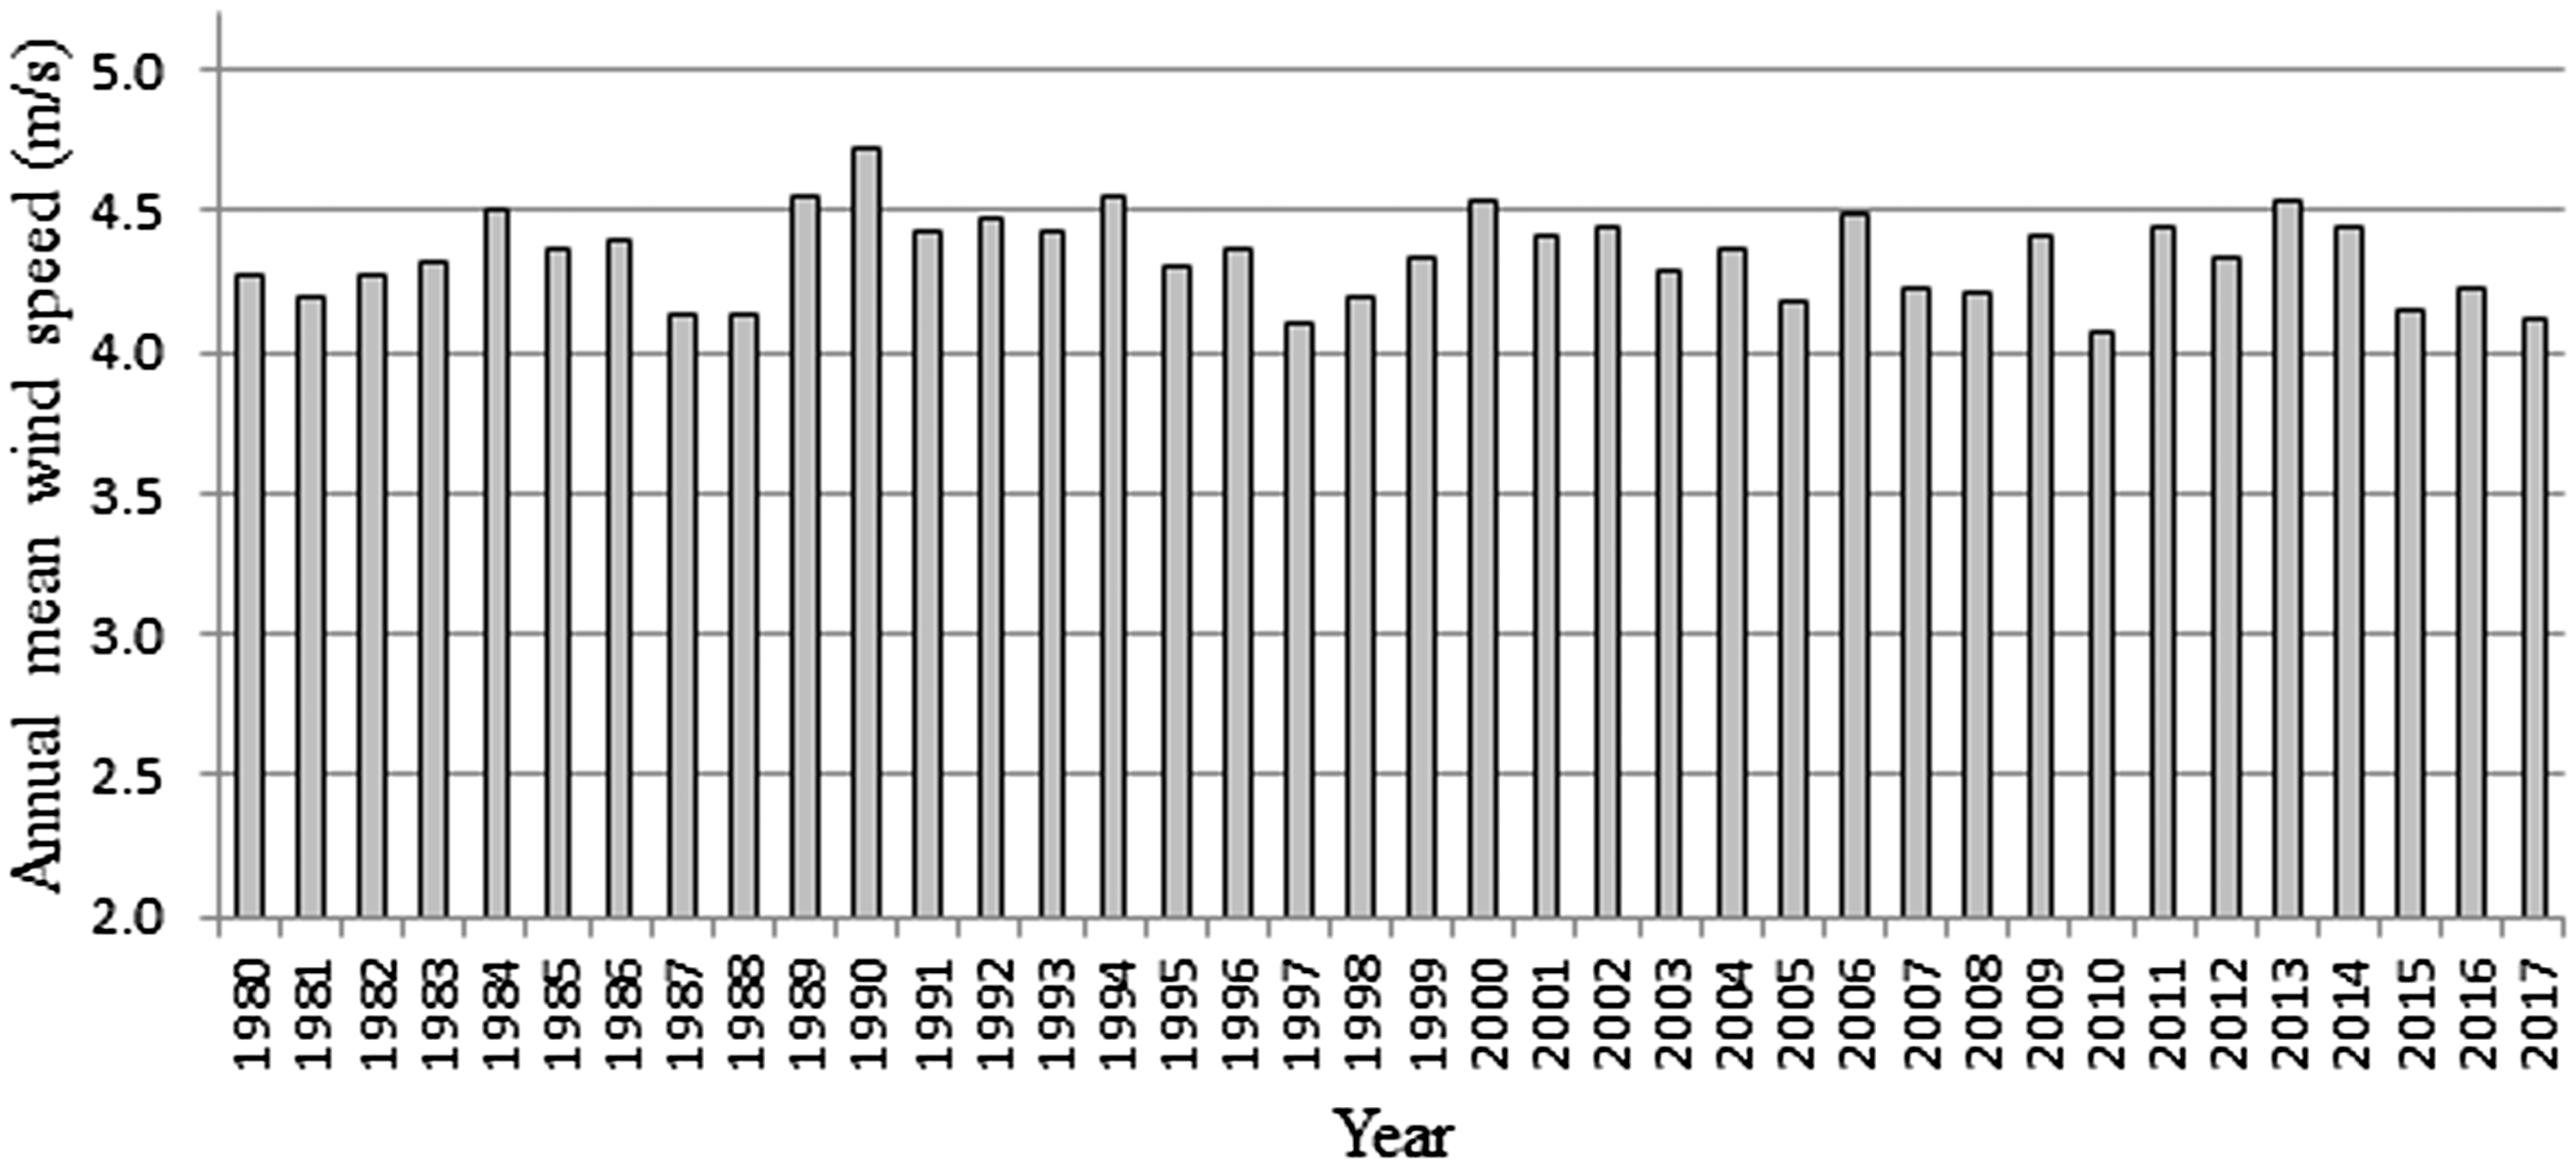
Annual mean wind speed variation at Erode (1980–2017).
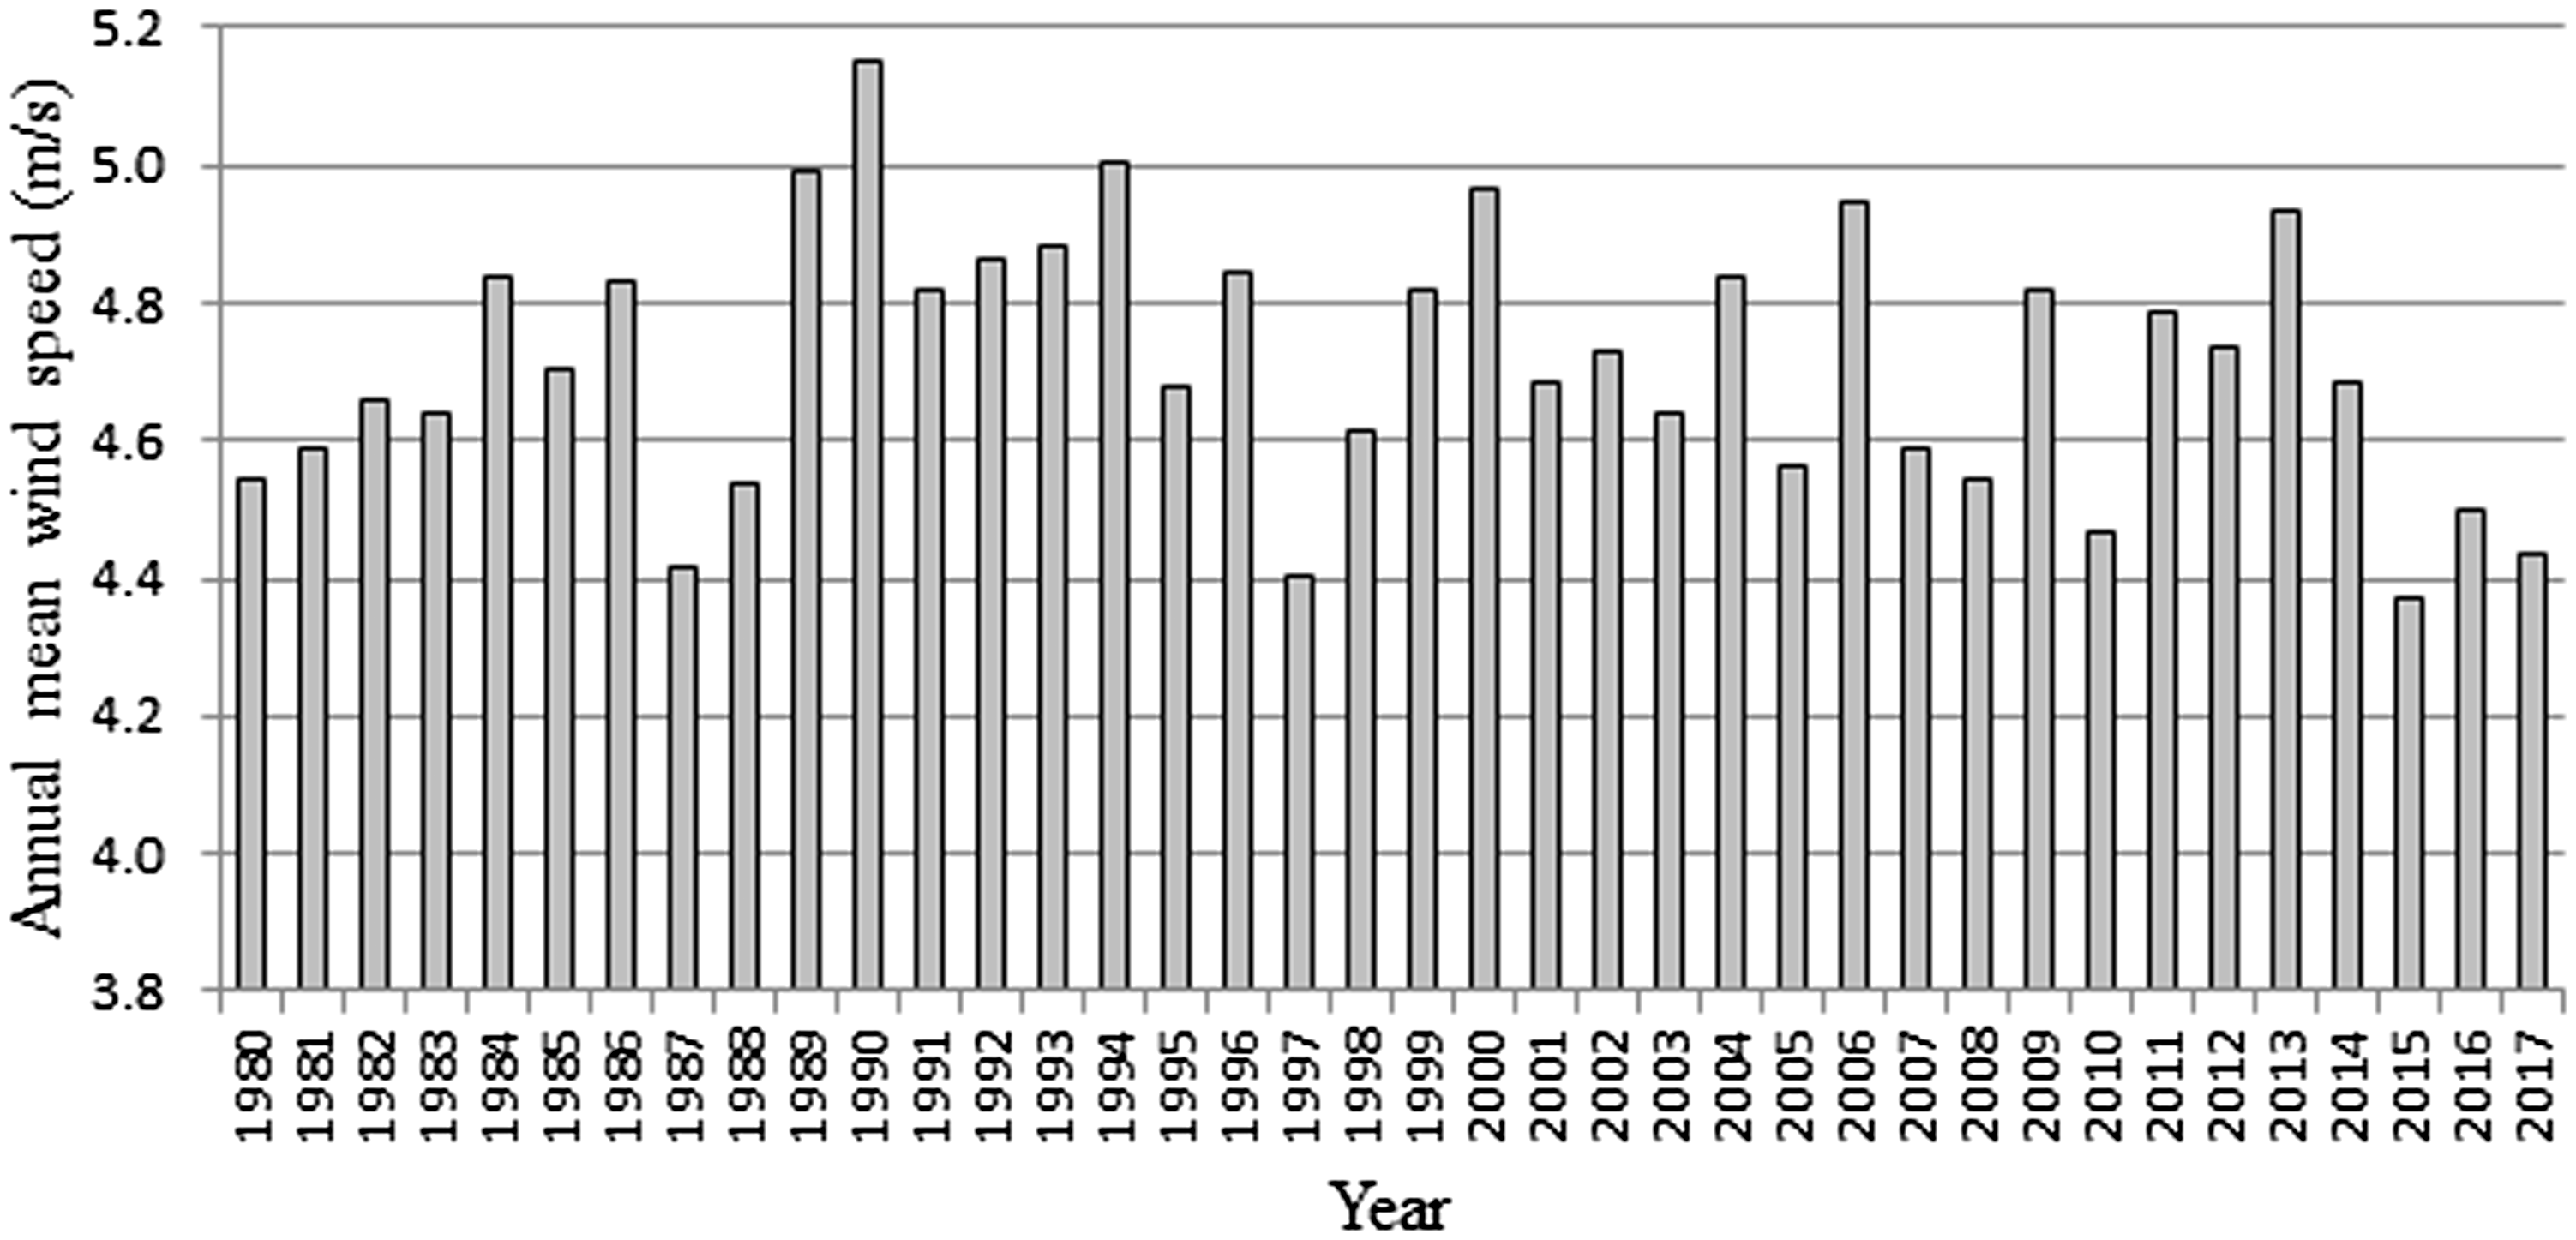
Annual mean wind speed variation at Coimbatore (1980–2017).
The annual mean values of Weibull shape parameter (k) varied from 2.5 to 3.0 during entire data reporting period with an exception of k being > 3.5 in year 1983. In case of Erode station, it varied between 2.0 and 2.3, a consistent pattern, with an exception in year 2003 when it reached to more than 2.5. Relatively, larger variations (2.0 to 2.5) are observed in annual mean k values at Coimbatore peaks of more than 2.5 in years 2003 and 2012.
Long-term monthly variation
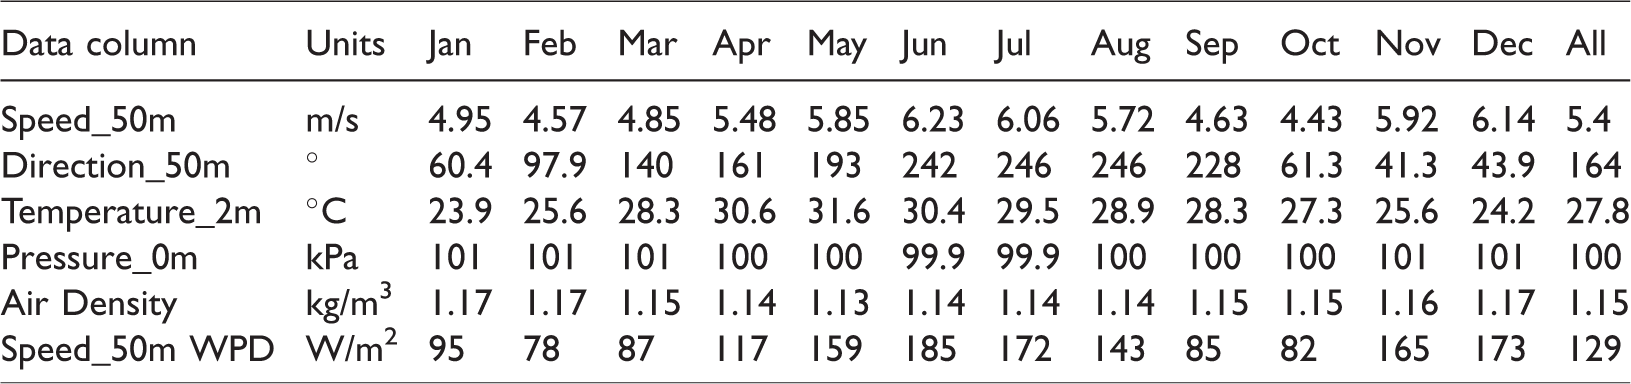
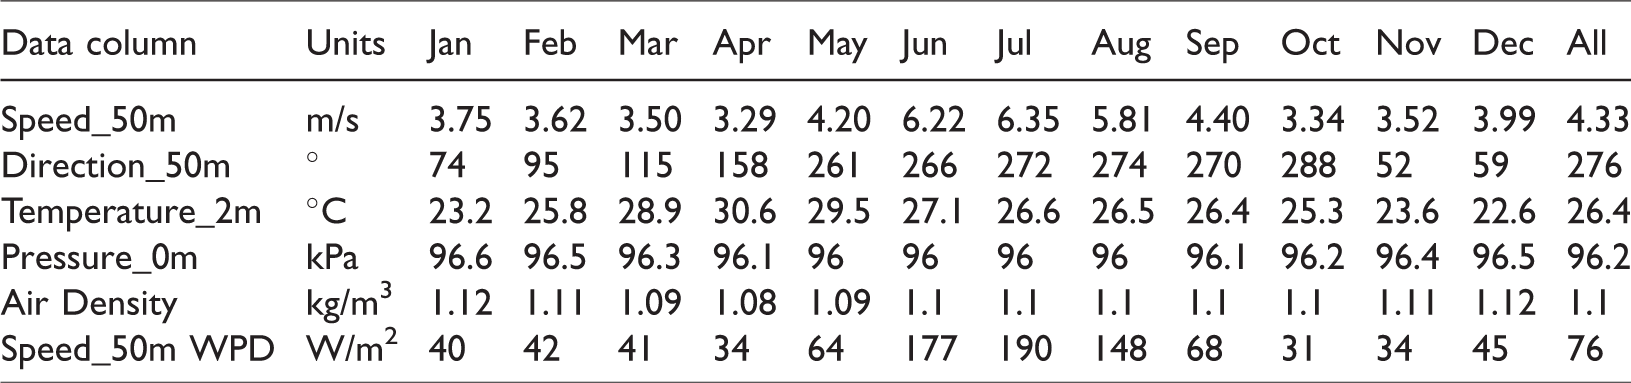
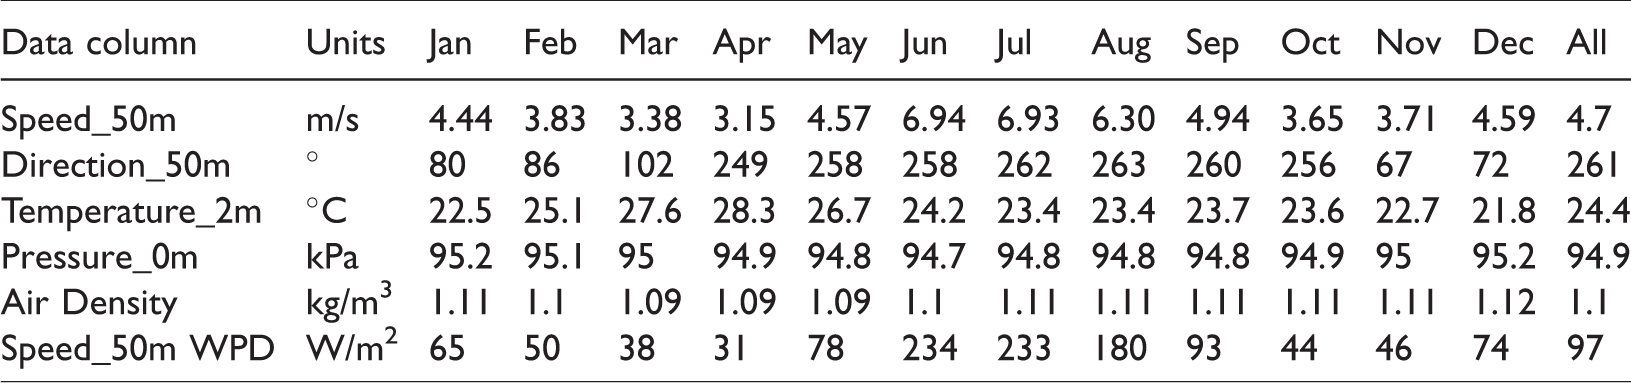
For quality of power and grid stability management, the knowledge of monthly variation of mean wind speed over extended period is important. Furthermore, to match the load demand, monthly mean wind speed and thereof wind power availability is required. The long-term monthly mean wind speed is found to increase from January towards mid of the year, reaching a maximum of 6.23 m/s in June, and then decreased towards end of the year at Chennai (Table 4). The overall mean wind speed of 5.4 m/s is observed over the entire data collection period. At Erode (Table 5) and Coimbatore (Table 6), the maximum wind speeds were observed in the months of July (6.35 m/s) and June (6.94 m/s); respectively. At both of these stations, like Chennai, an increasing trend of wind speed was noticed from January to mid of the year and a decreasing trend towards the end of the year. Highest ambient temperatures were found in Chennai and lowest at Coimbatore. However, higher values of air density are found during winter time and lower during summer time, as can be observed from Tables 4 to 6. Similarly, highest values of wind power density of 185 W/m2, 190 W/m2 and 234 W/m2 were observed at Chennai (June), Erode (July) and Coimbatore (June), respectively. The long-term monthly prevailing directions are also summarized in Tables 4 to 6 at Chennai (164°), Erode (276°) and Coimbatore (261°), respectively.
Monthly mean values of all the meteorological parameters at Chennai (1980 -2017).
Monthly mean values of all the meteorological parameters at Erode (1980-2017).
Monthly mean values of all the meteorological parameters at Coimbatore (1980 -2017).
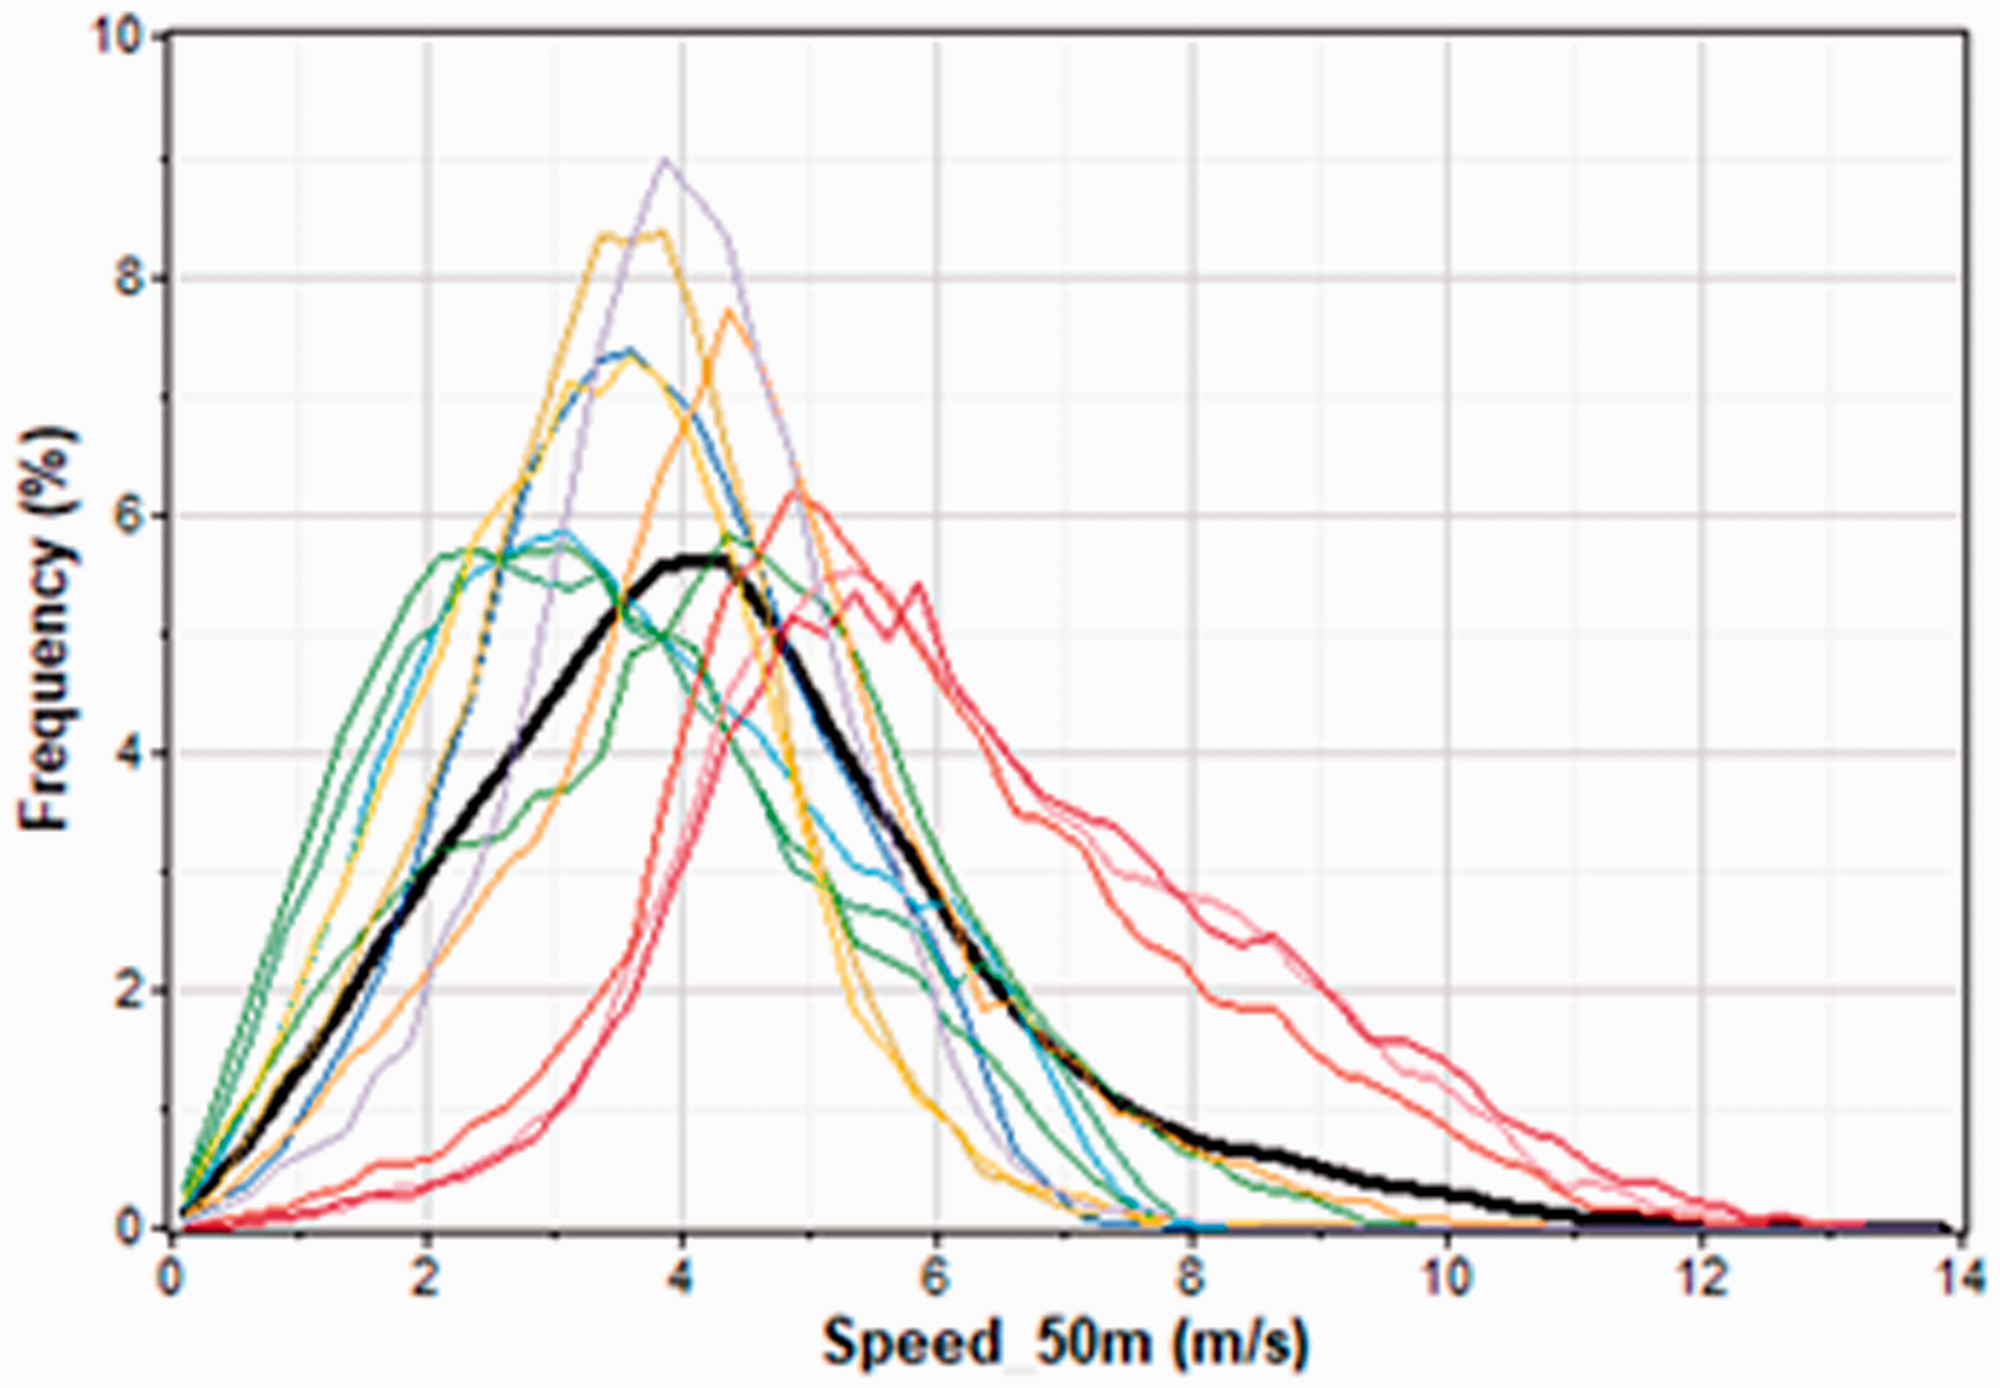
The wind duration curves with wind speed bins for monthly and complete data sets are provided in Figures 8 to 10 for Chennai, Erode and Coimbatore. At Chennai, the peak frequency of 10% to 13% occurs between 5.0 m/s to 6.0 m/s (Figure 8). Furthermore, the wind duration curve, based on entire data set, also follows the same trend and peak frequency of 10% occurs at 6.0 m/s wind speed bin. The peak frequencies at Erode are seen to be spread over a larger wind speed base (2.0 m/s to 5.0 m/s) and for overall data the peak of about 5.8% occurs between 4.0 m/s and 5.0 m/s (Figure 9). Almost similar larger spread of frequencies over wider wind speed bins is observed at Coimbatore (Figure 10). However, the peak frequency of about 5%, based on entire data set, appeared at 4.5 m/s wind speed. This frequency duration curve analysis showed that as one moves away from the coastal site in to inland, though higher altitudes, the peak frequency and wind speed range decreases.
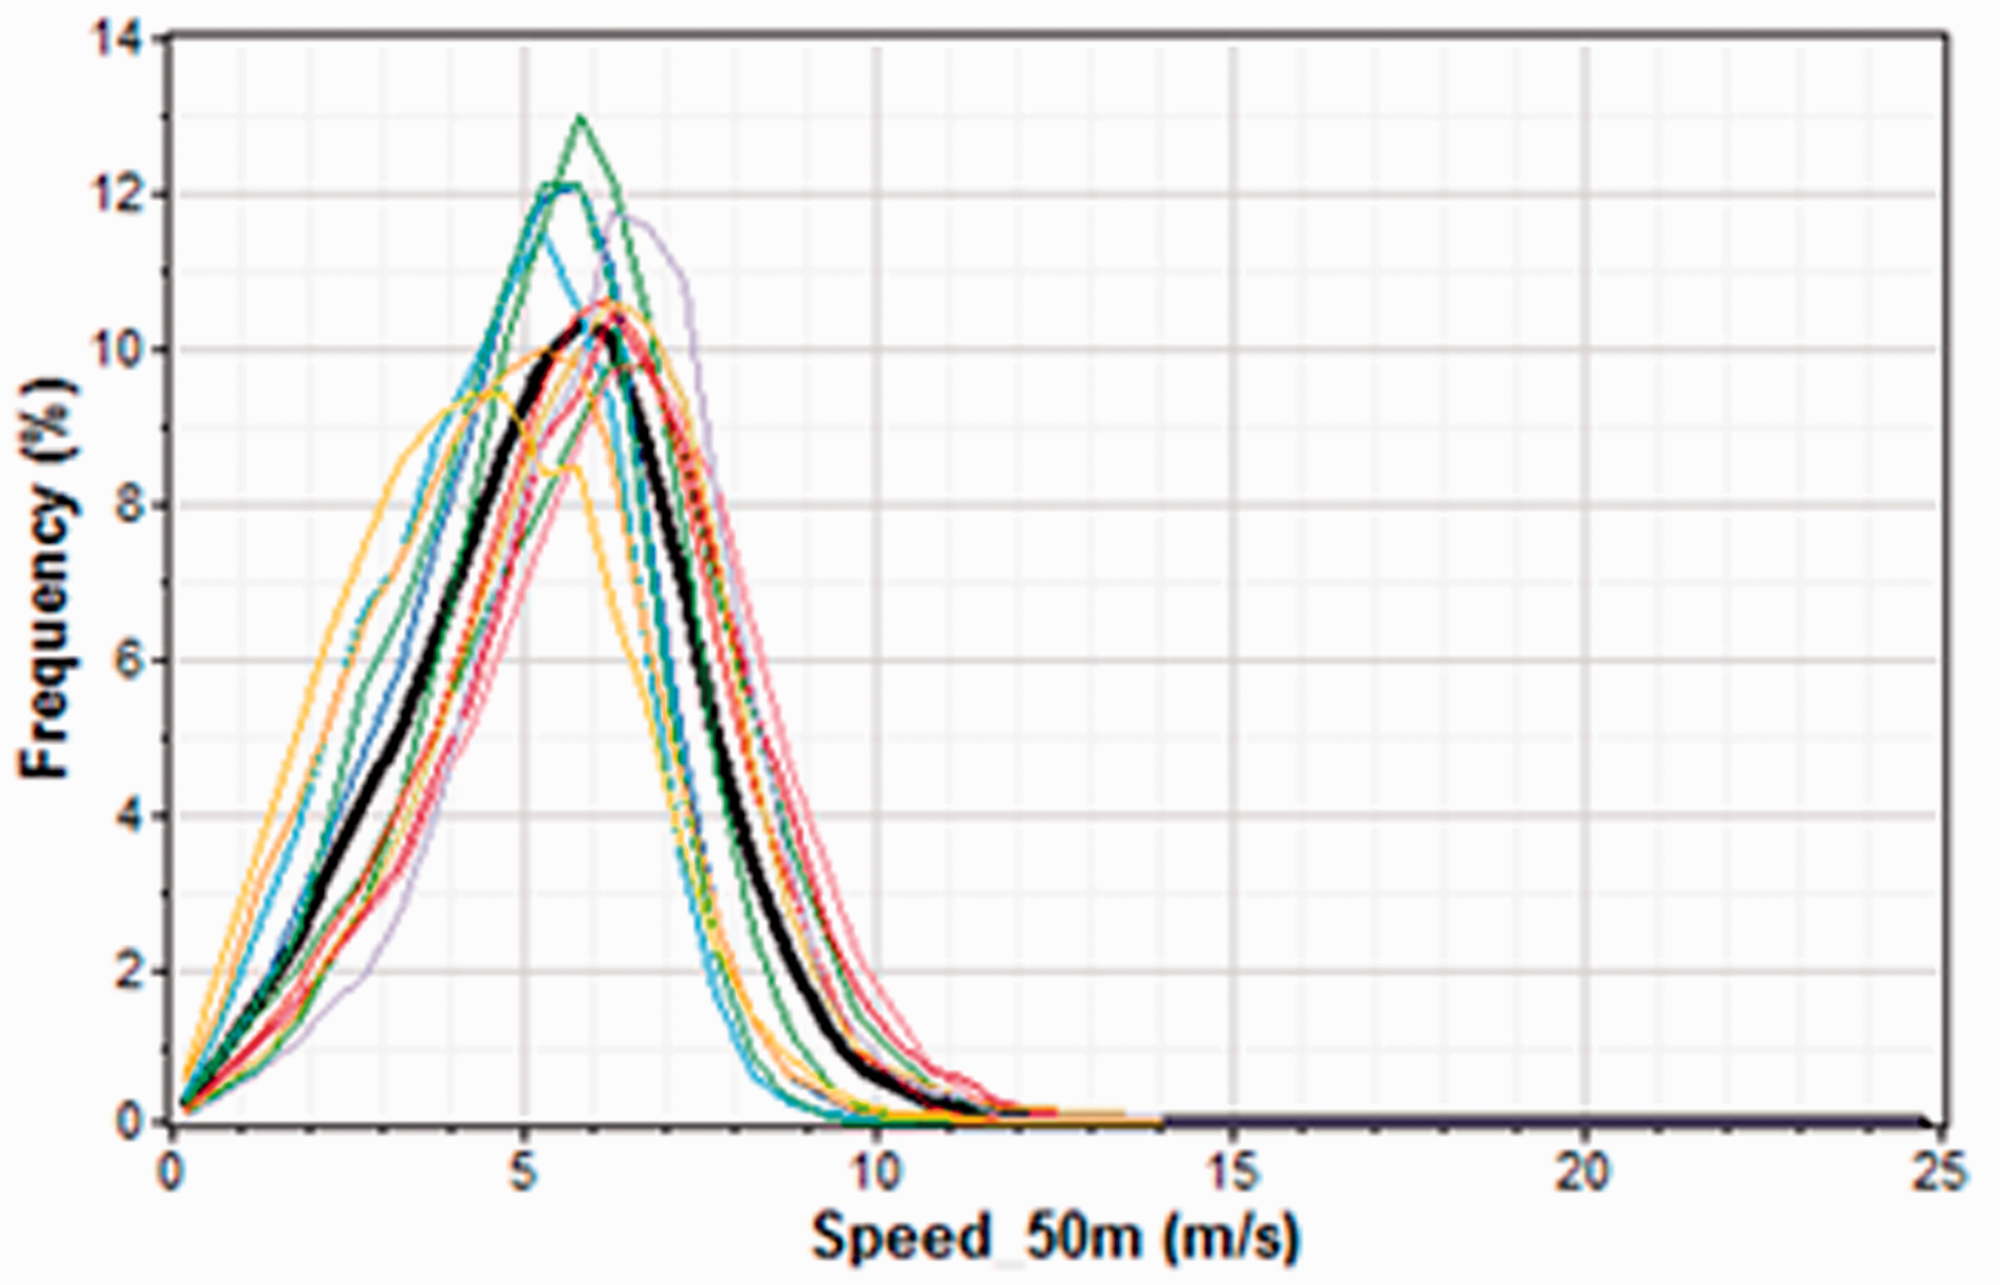
Percent wind speed frequency distribution in different bins at Chennai (1980 -2017).
Percent wind speed frequency distribution in different bins at Erode (1980–2018).
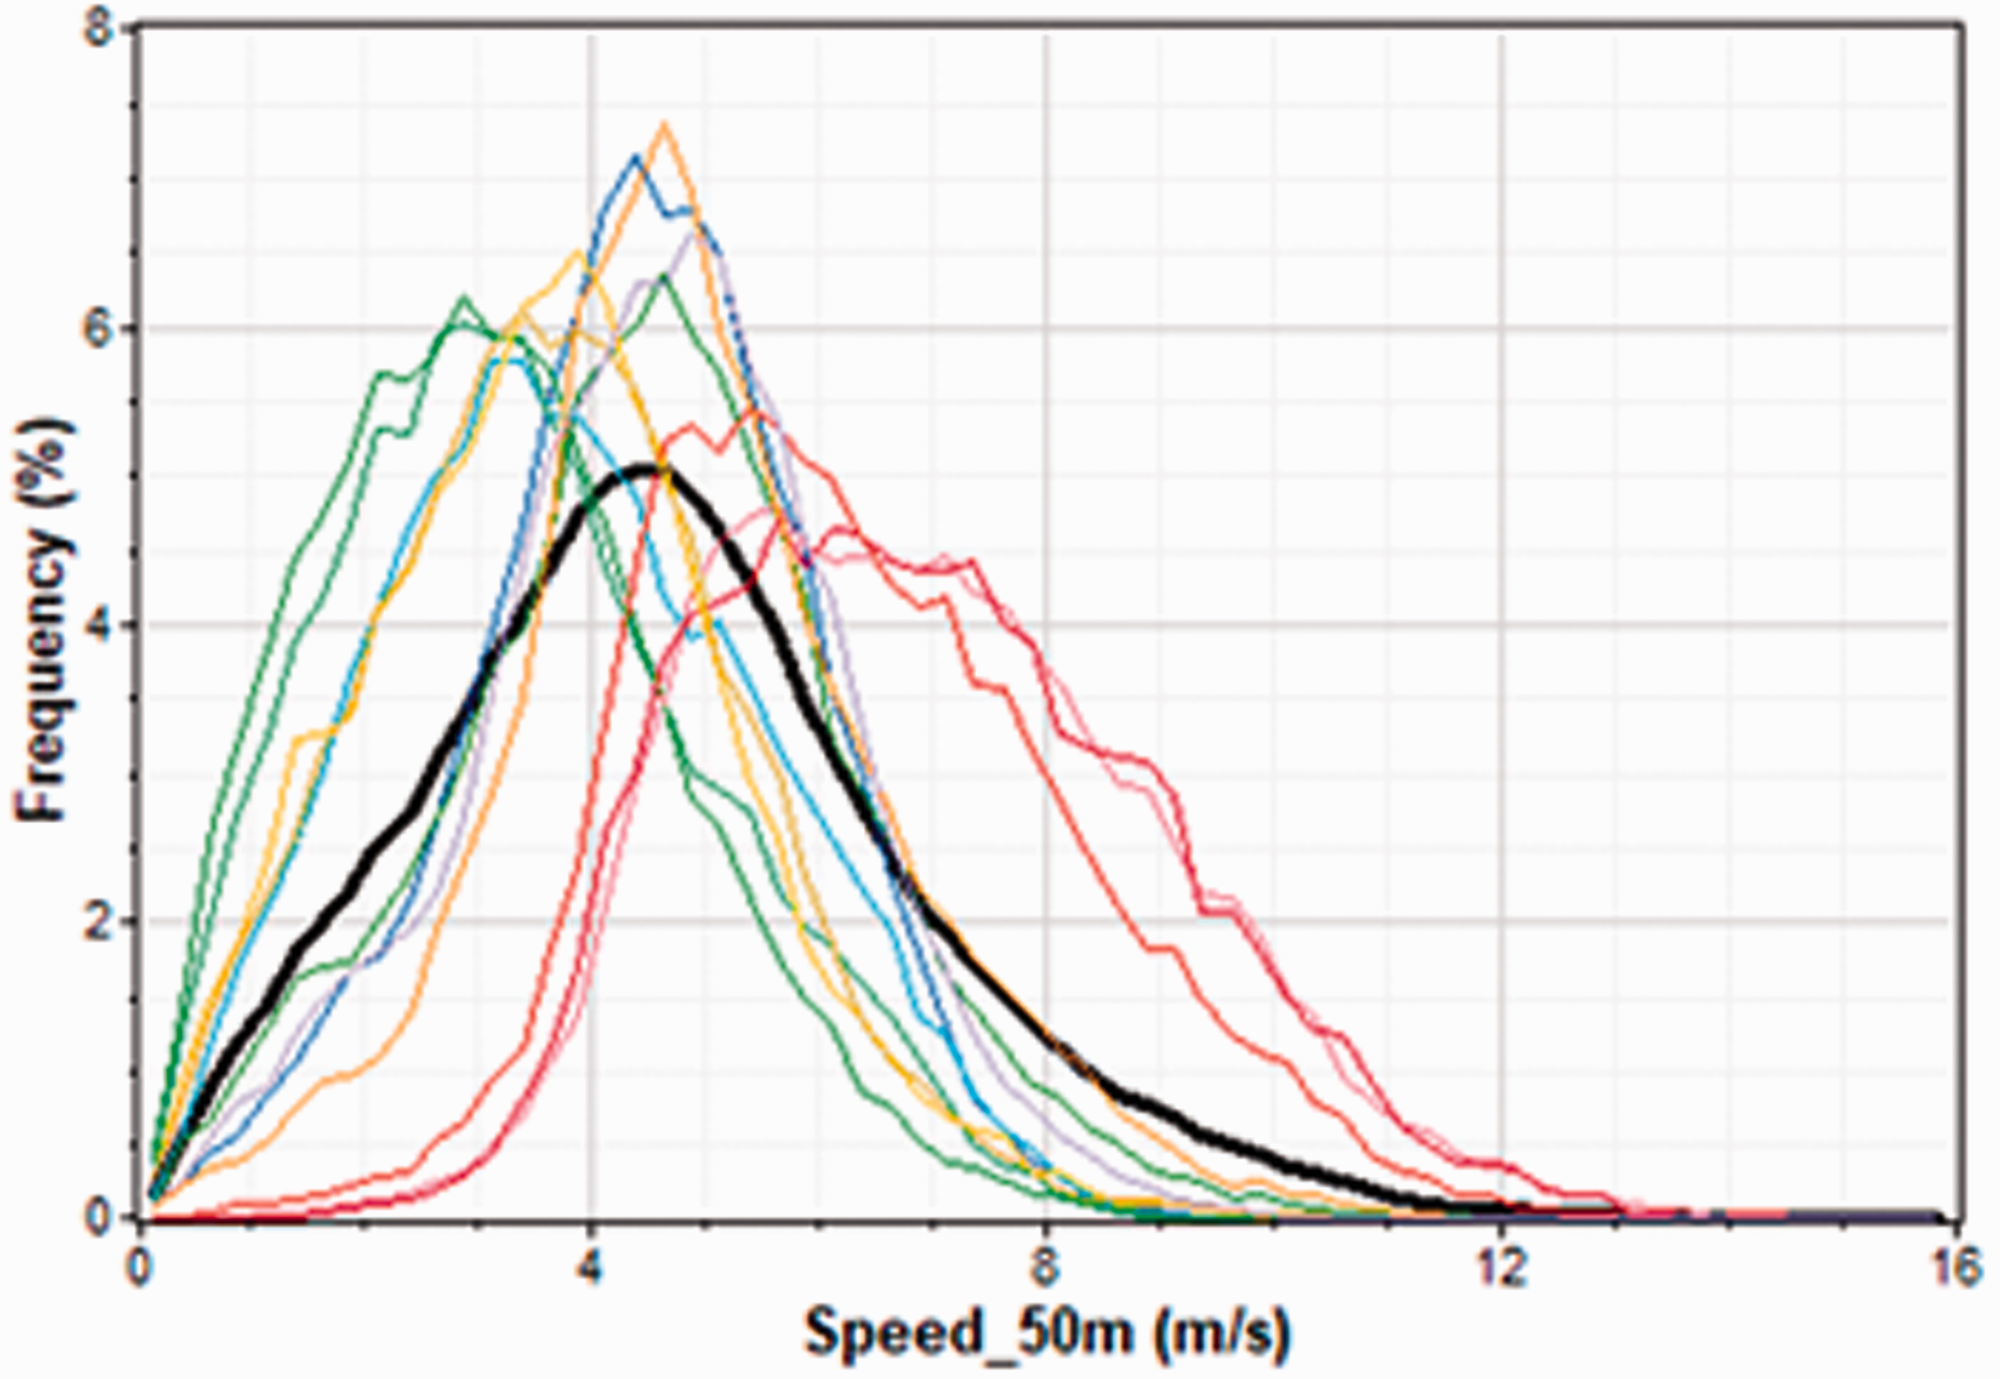
Percent wind speed frequency distribution in different bins at Coimbatore (1980–2017).
Long-term diurnal variation
Knowledge of diurnal changes in mean wind speed over extended periods is critical to match the peak load on the grid. The perfect match is the higher wind speeds at peak load times of the day. At Chennai, the diurnal mean wind speed shows two peaks, one in the early morning at 4:00 hours and the other at 14:00 hours in the early afternoon (Figure 11). So, if the local peaks occur at these timings, then this diurnal wind profile can be best utilized to supplement the peak load through wind power. At Erode, there is a clean cut peak wind availability at around 15:00 hours which could also best utilized for peak load saving through wind power if the peak load also occurs at this time. However, there is a flat peak between 5:00 and 12:00 hours at Coimbatore which could be best utilized for flat load demands during this specific duration. Of the three sites, Chennai seems to be the best situation for utilizing wind power.
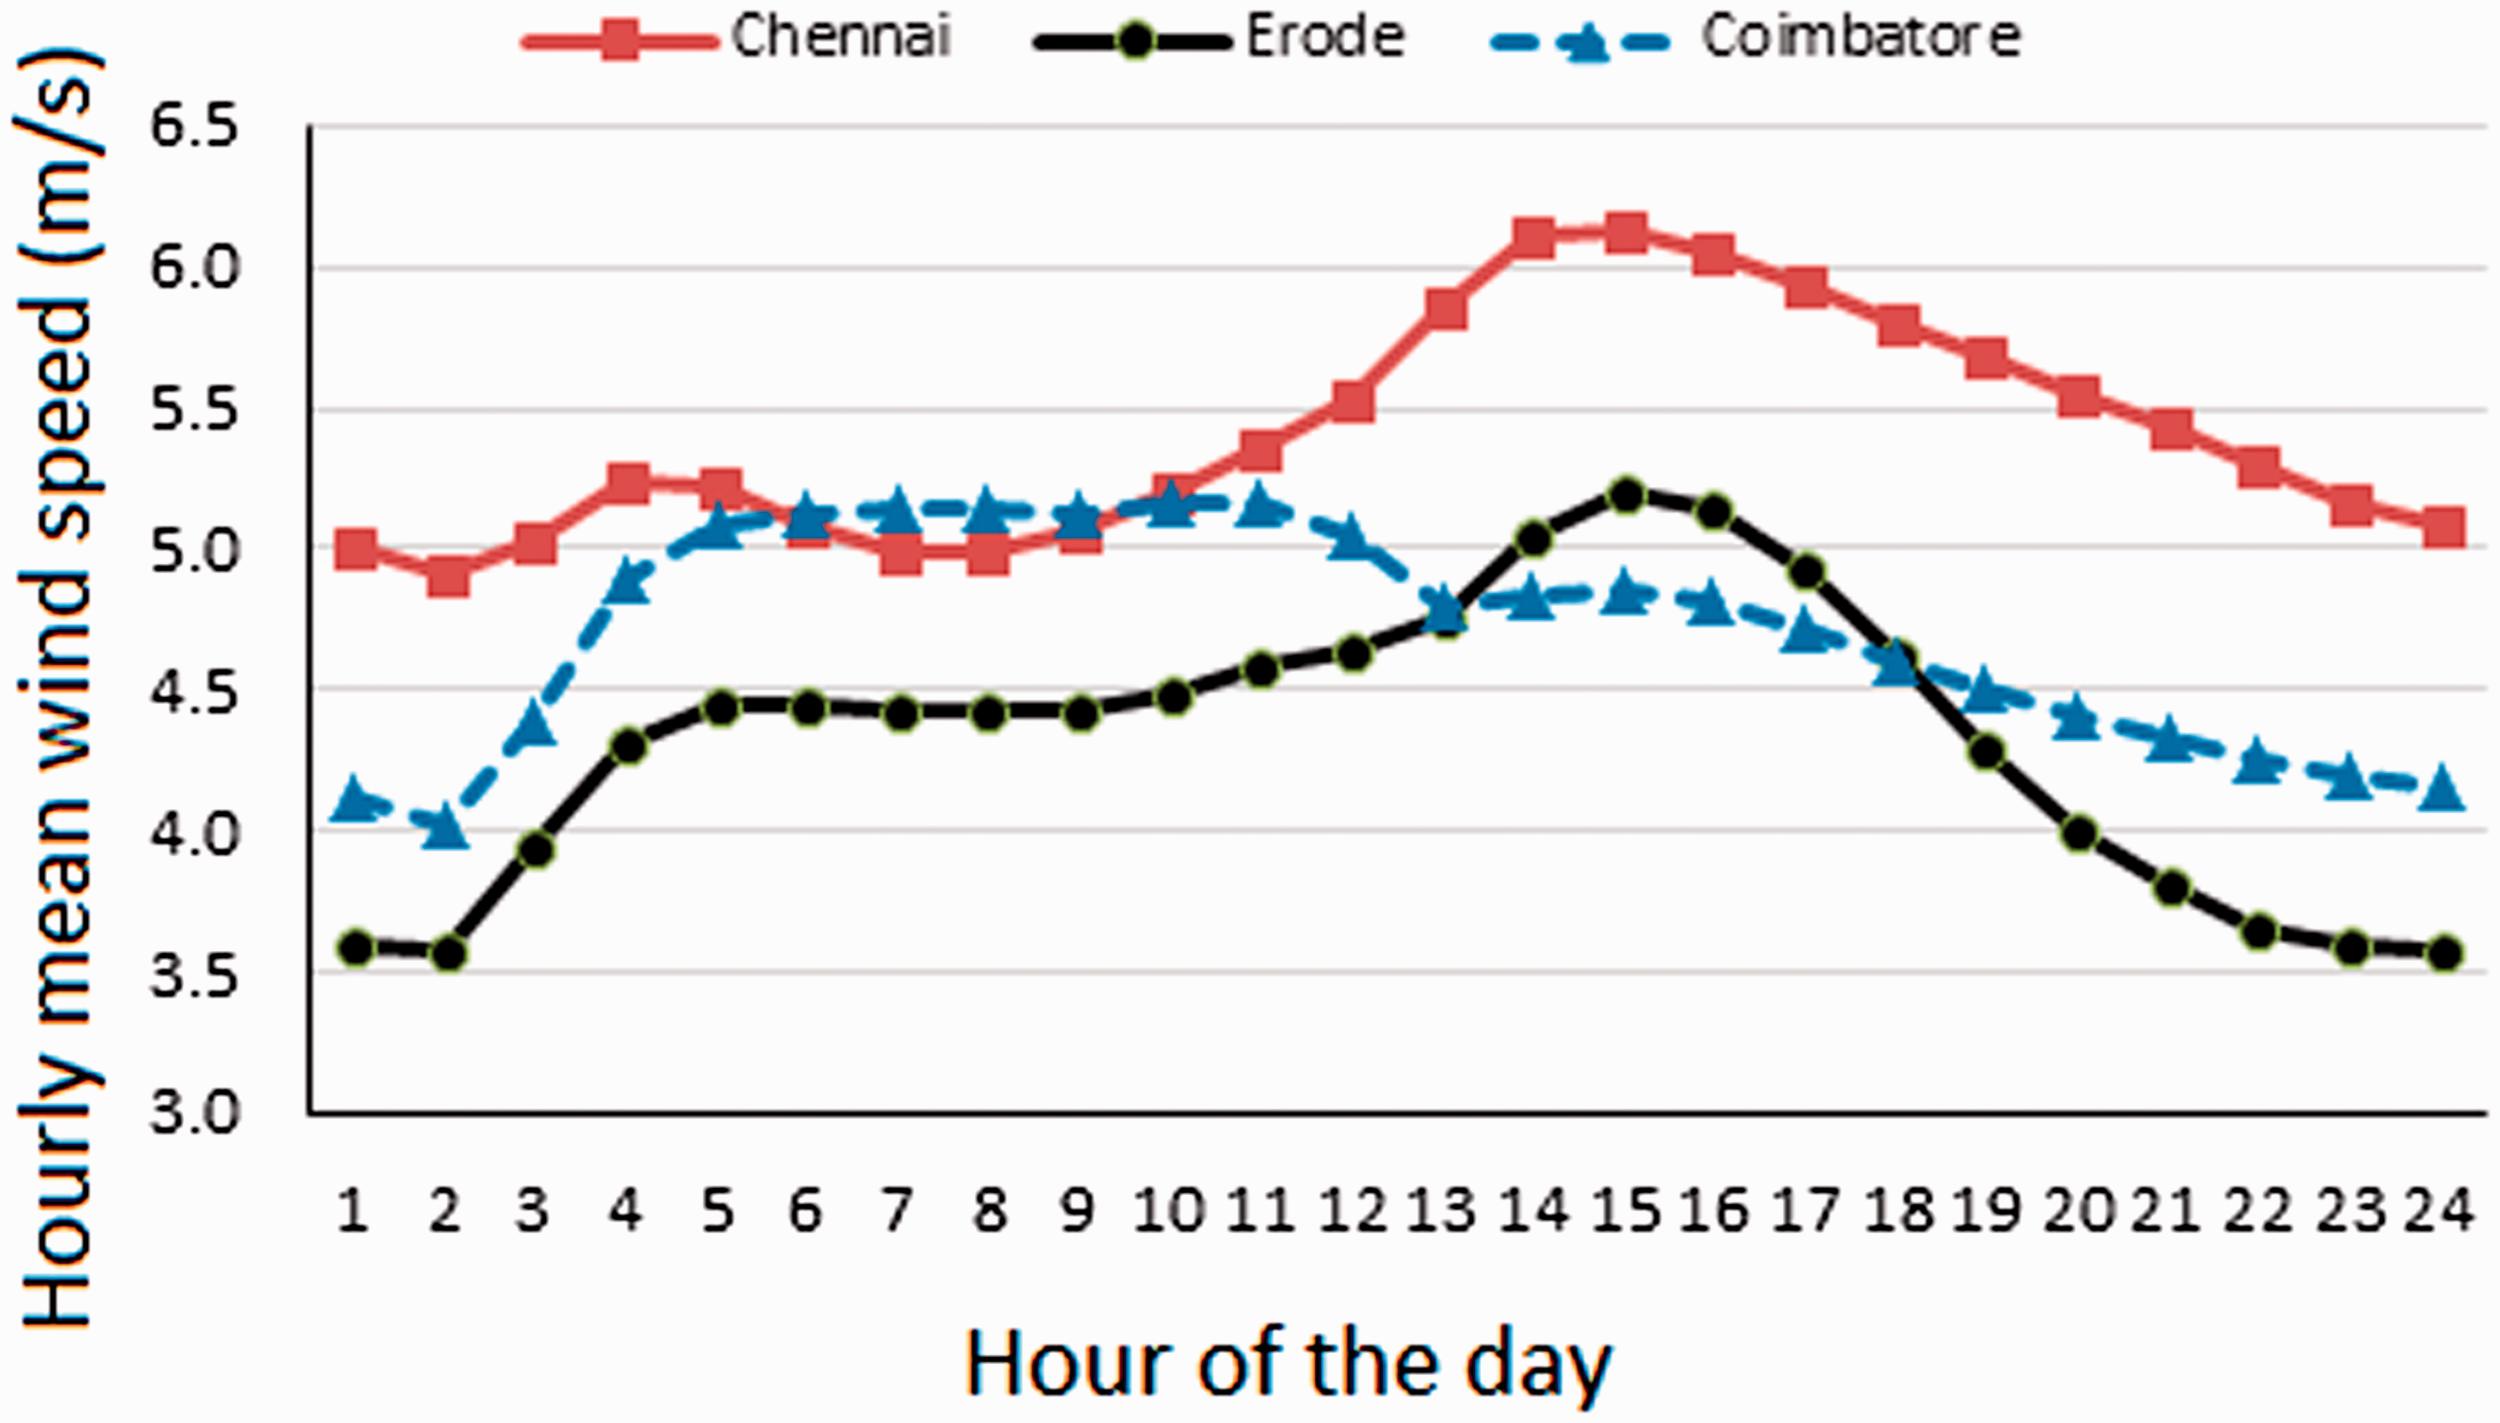
Diurnal variation of hourly mean wind speed (1980–2017).
The long-term diurnal variation of ambient temperature also dictates the peak load demand periods during the day because the cooling demand goes high when the temperature is low and vice versa. Also, the temperature directly affects the air density which is directly proportional to the wind power density. Higher the temperature, lower the air density and hence the WPD. Similarly, lower the temperature, higher the air density and then higher the WPD. The diurnal profiles of ambient temperatures at all the stations show a peak at around 10:00 hours (Figure 12). This fact is also reflected in air density values (Figure 13) being lower during this time. As the ambient temperature increases, the air density decreases, as can be seen in Figure 13. The diurnal WPD profiles match with the long-term hourly mean wind speed values and also have embedded effect of air density (Figure 14).
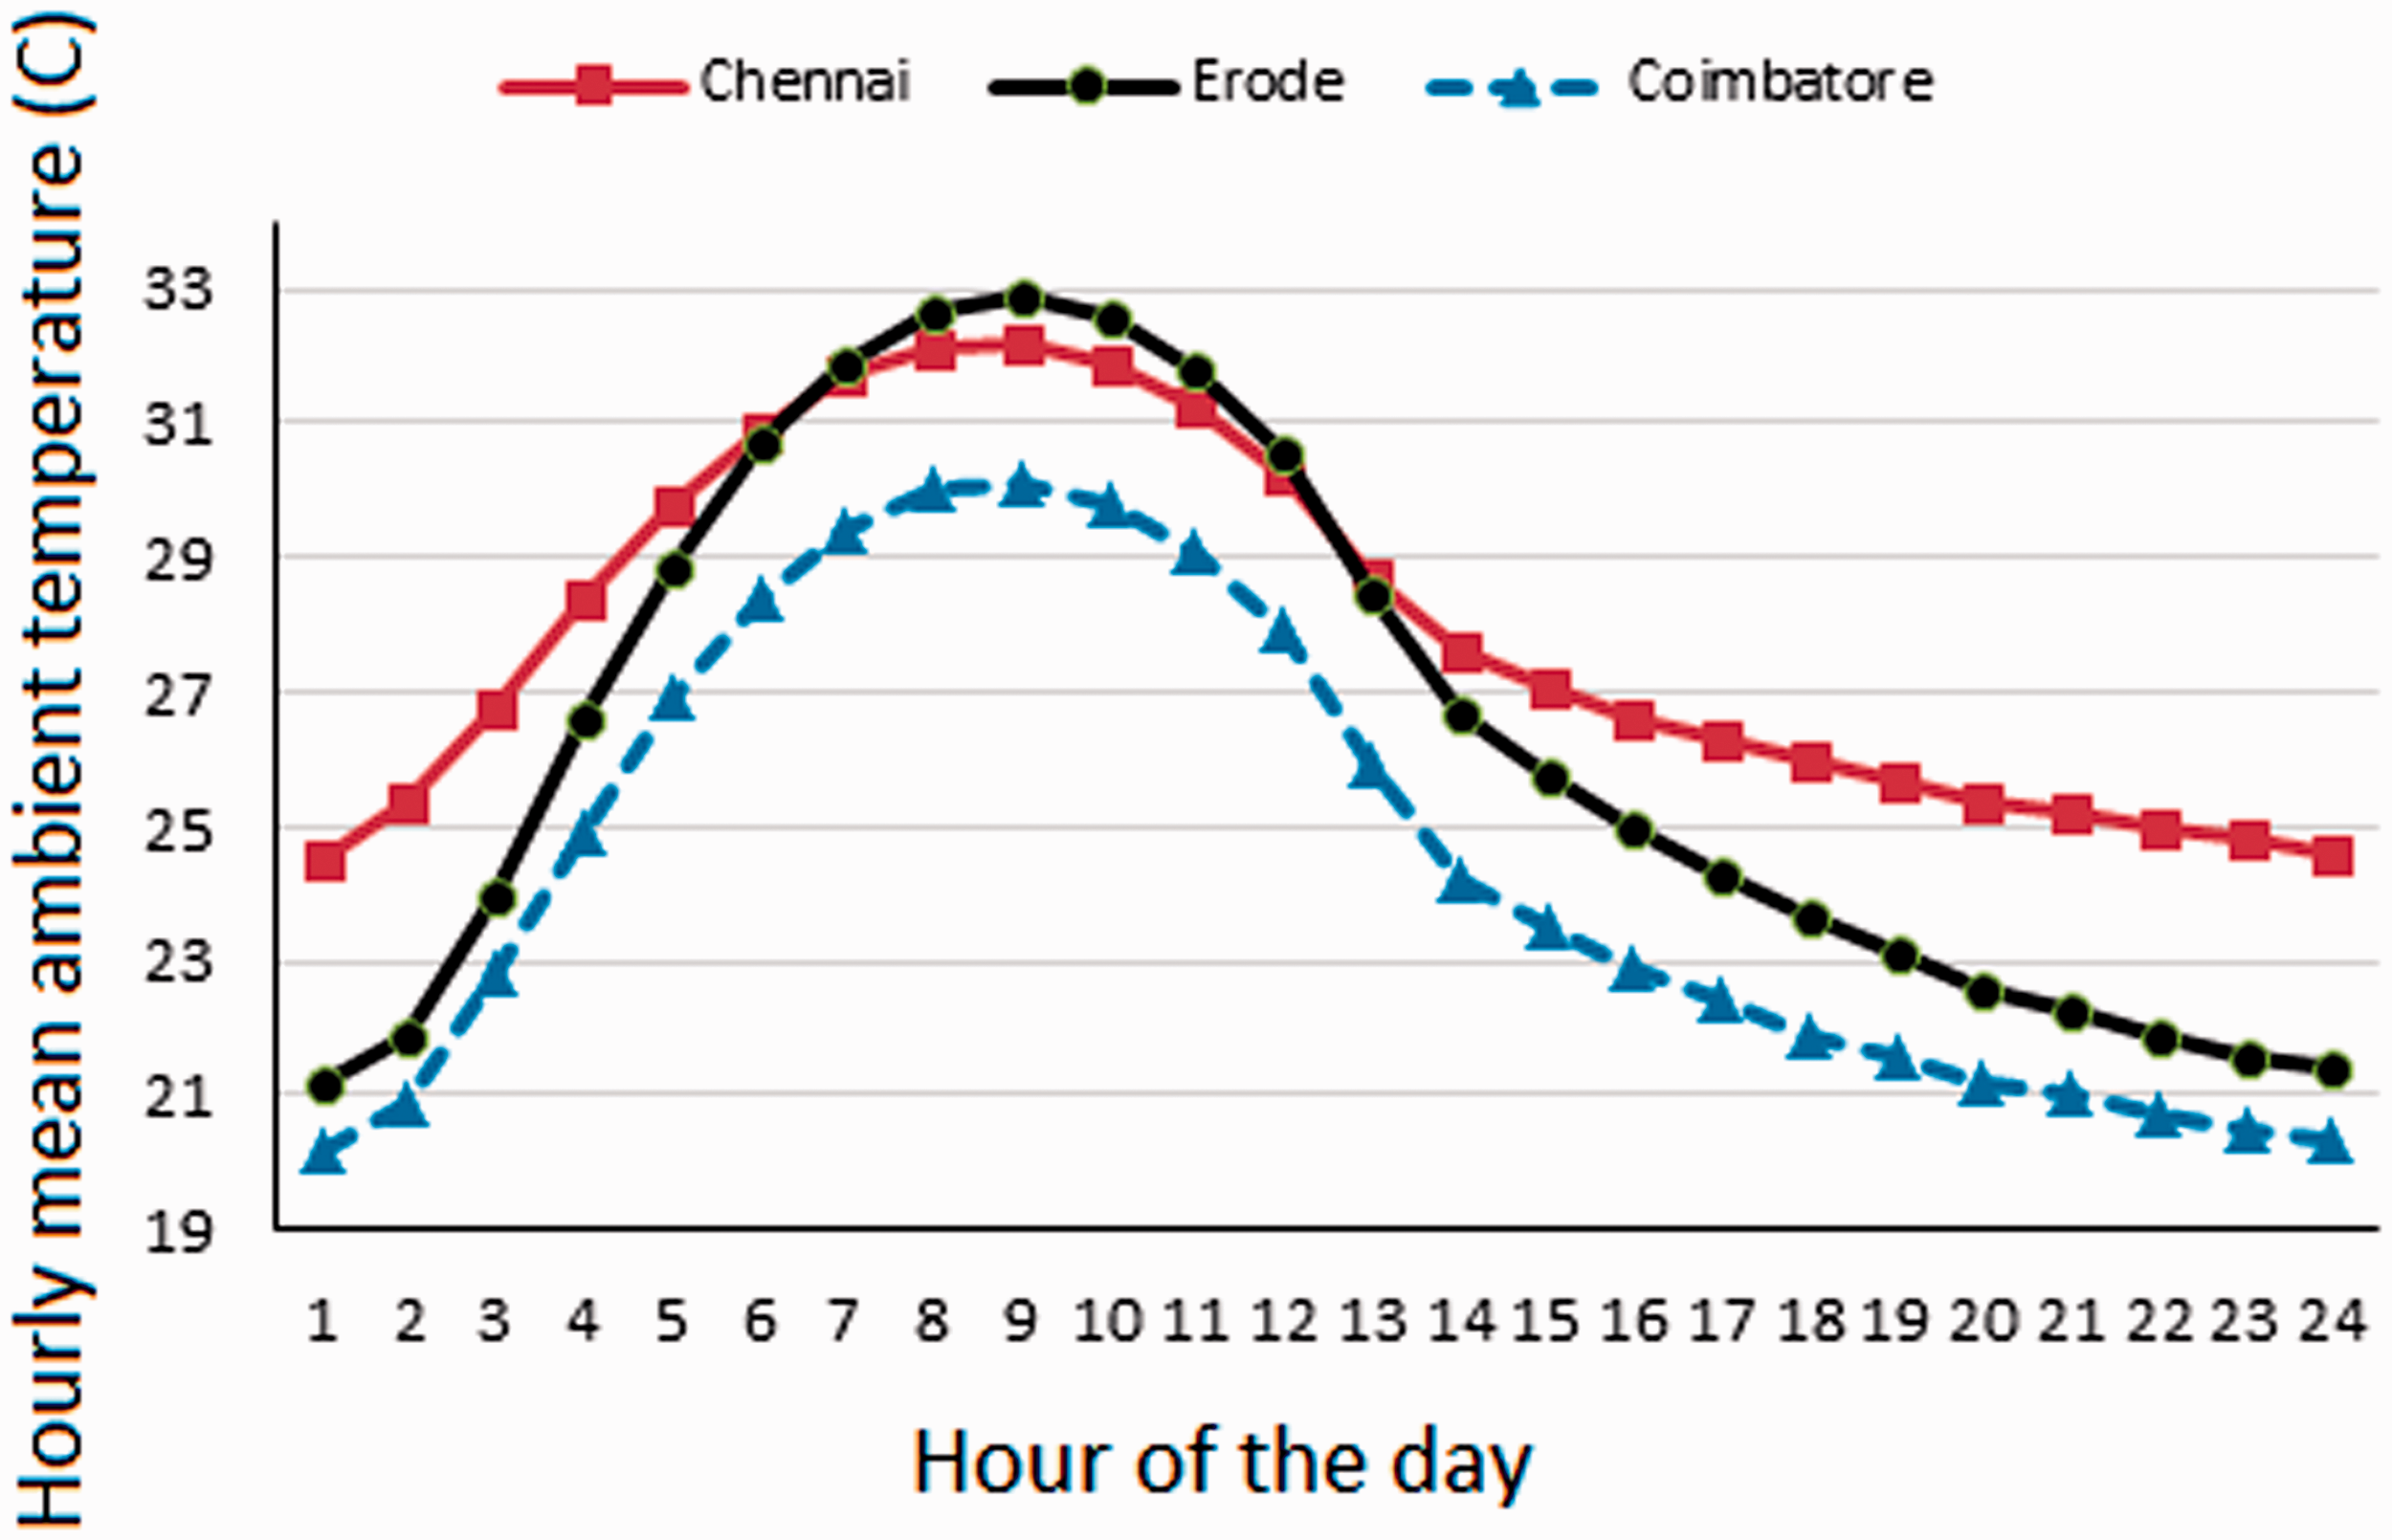
Diurnal variation of hourly mean ambient temperature (1980–2017).
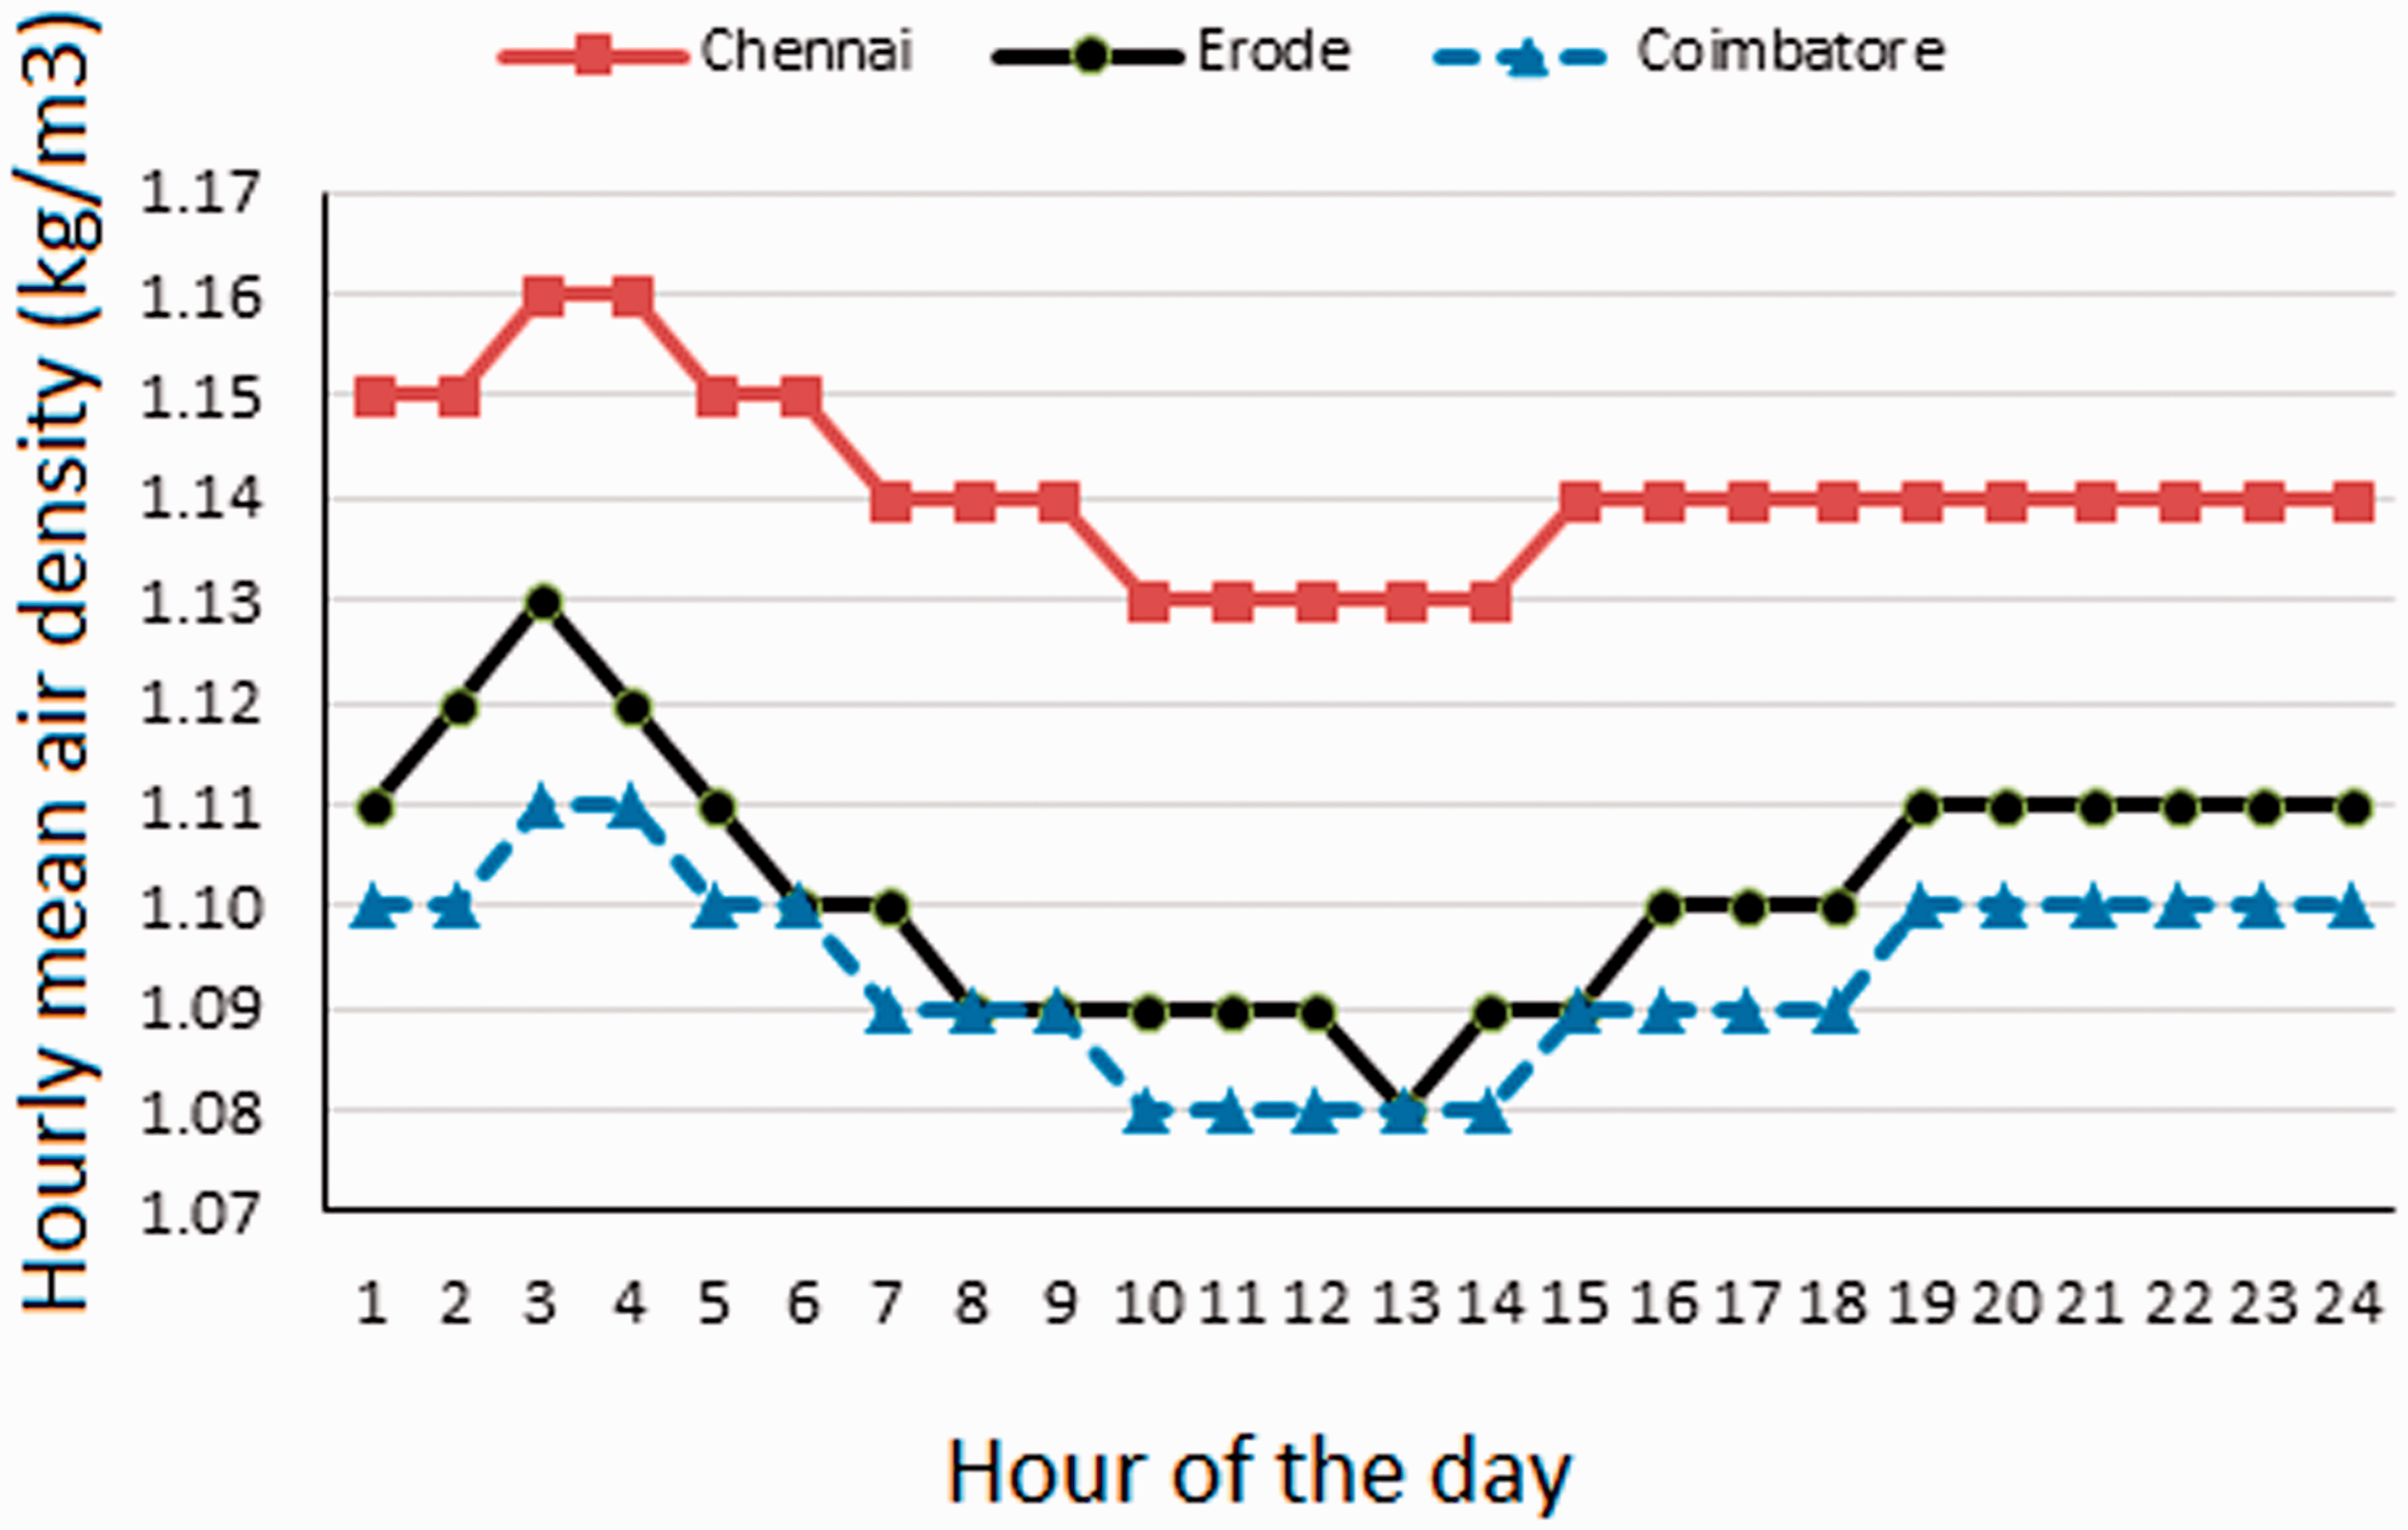
Diurnal variation of hourly mean air density (1980–2017).
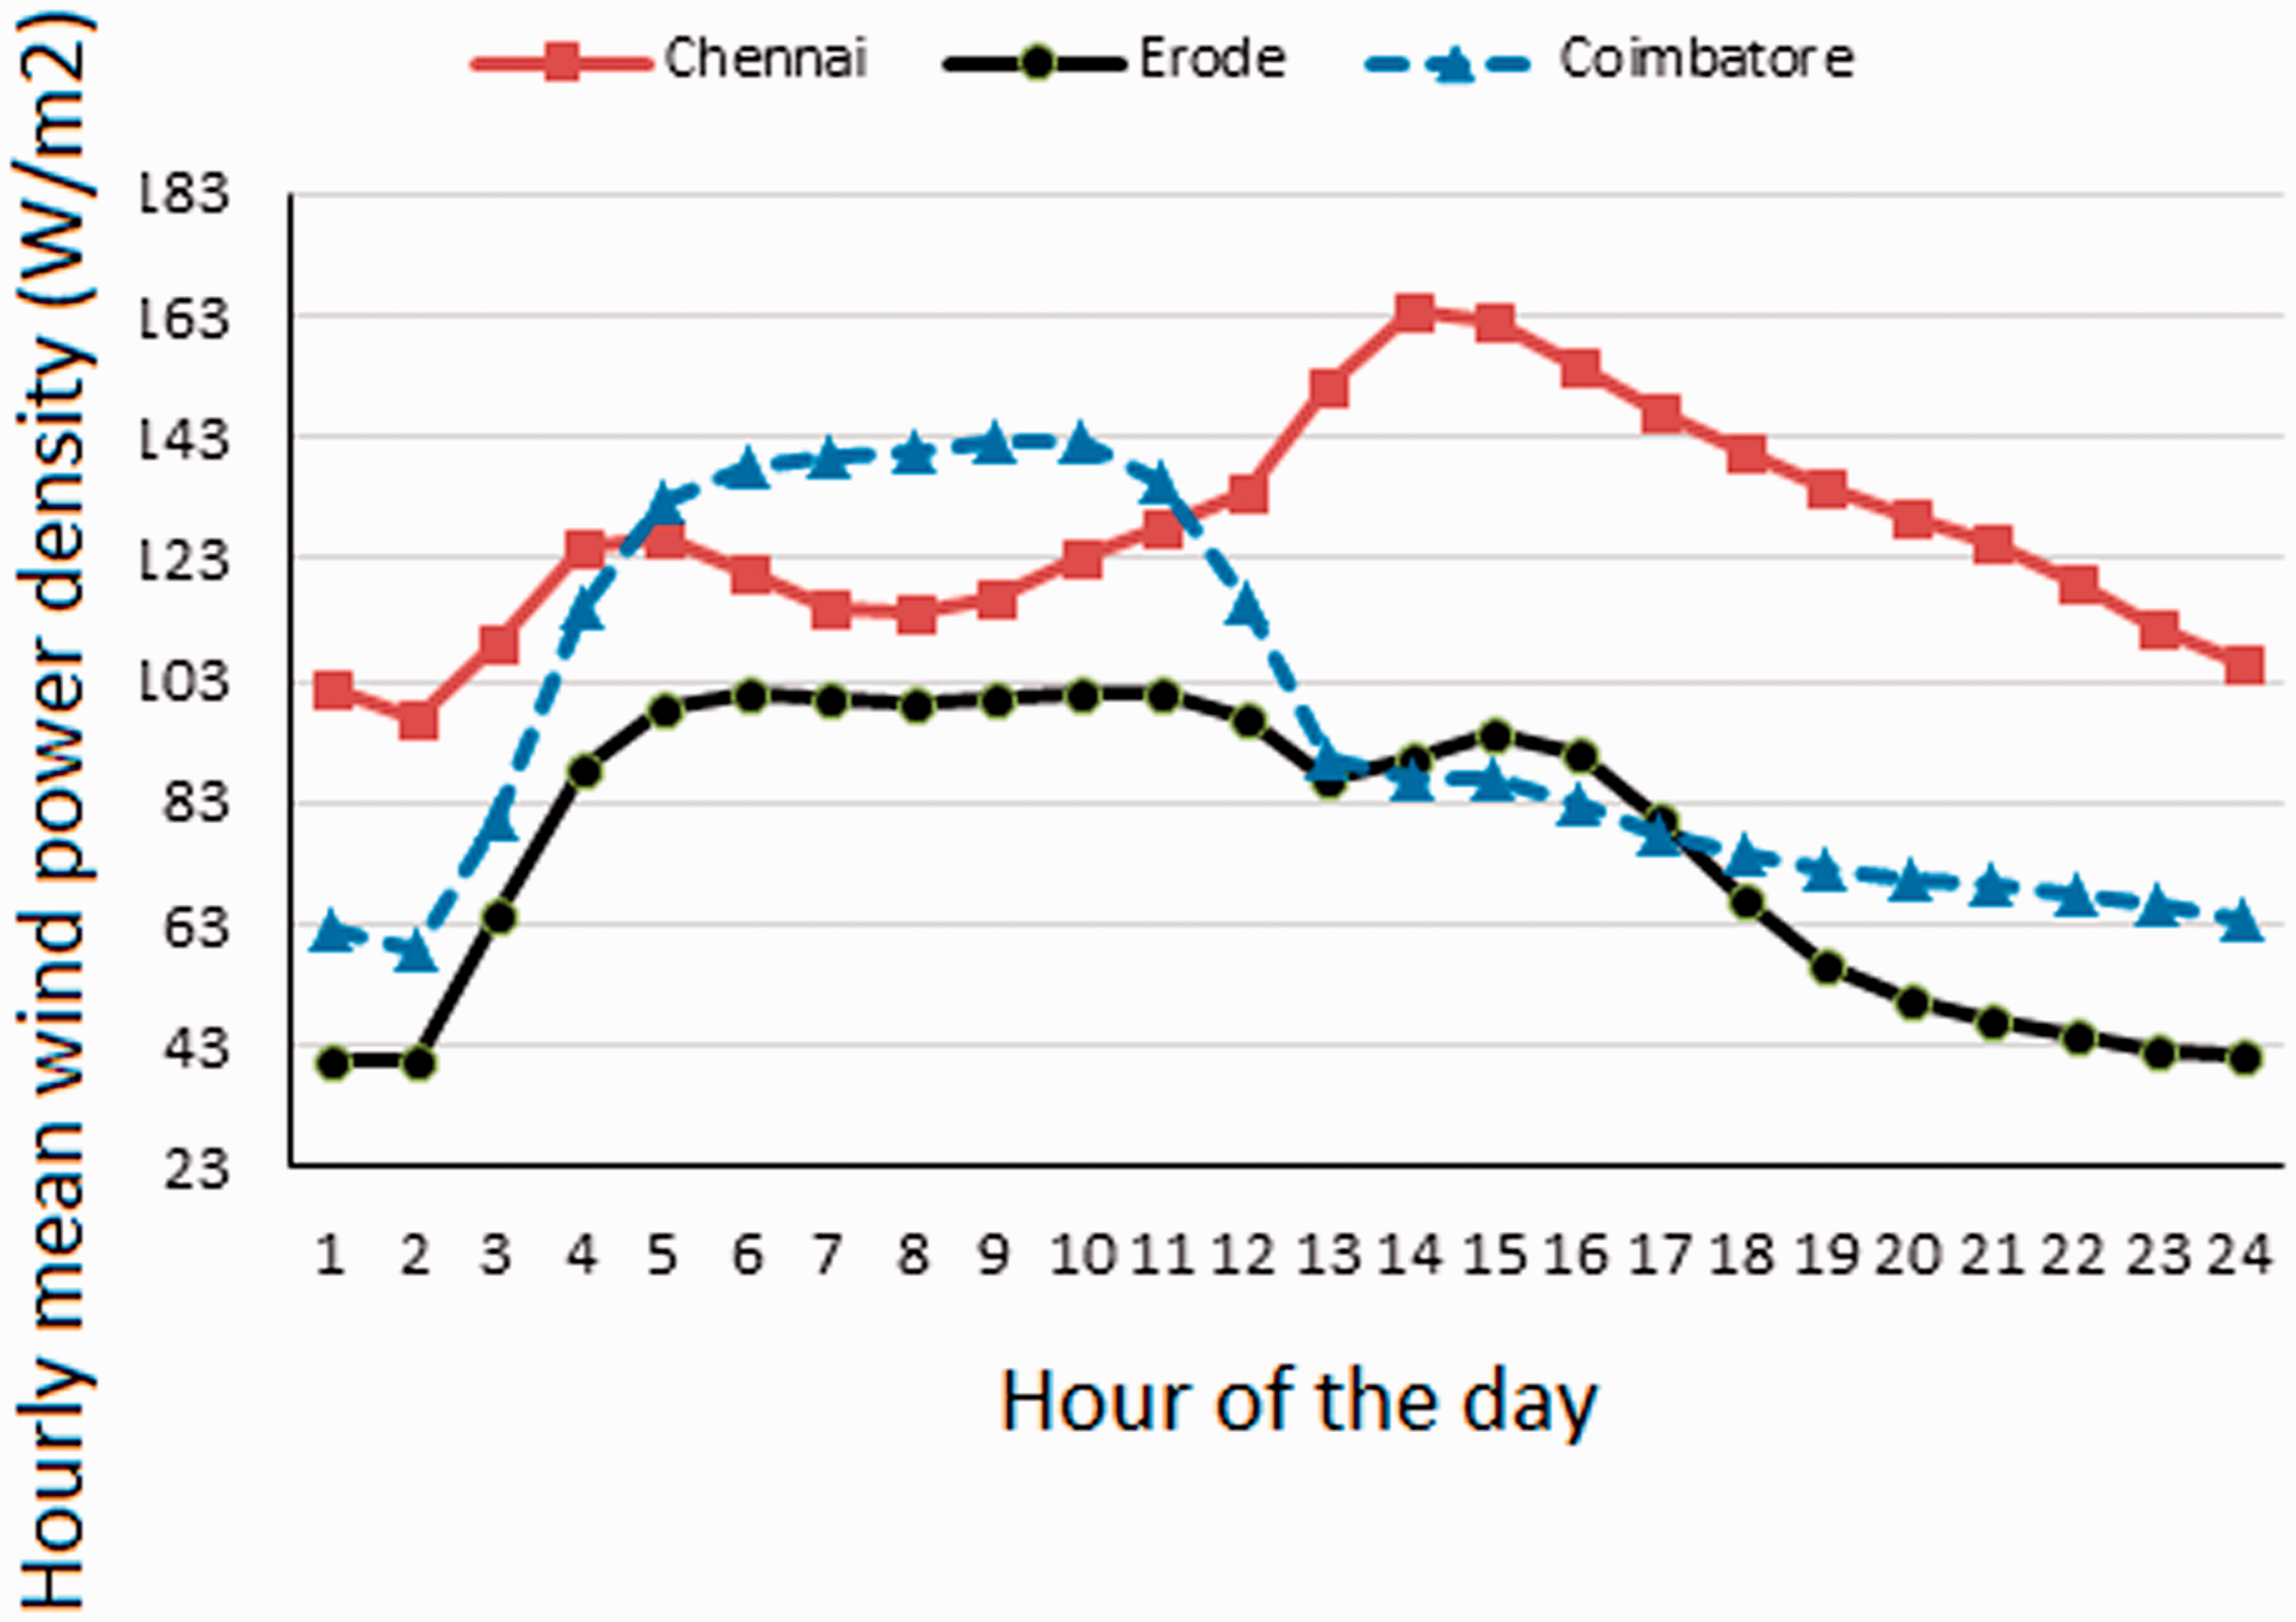
Diurnal variation of hourly mean wind power density (1980–2017).
Variation of most probable and maximum energy carrying wind speed
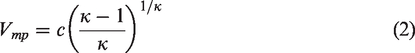
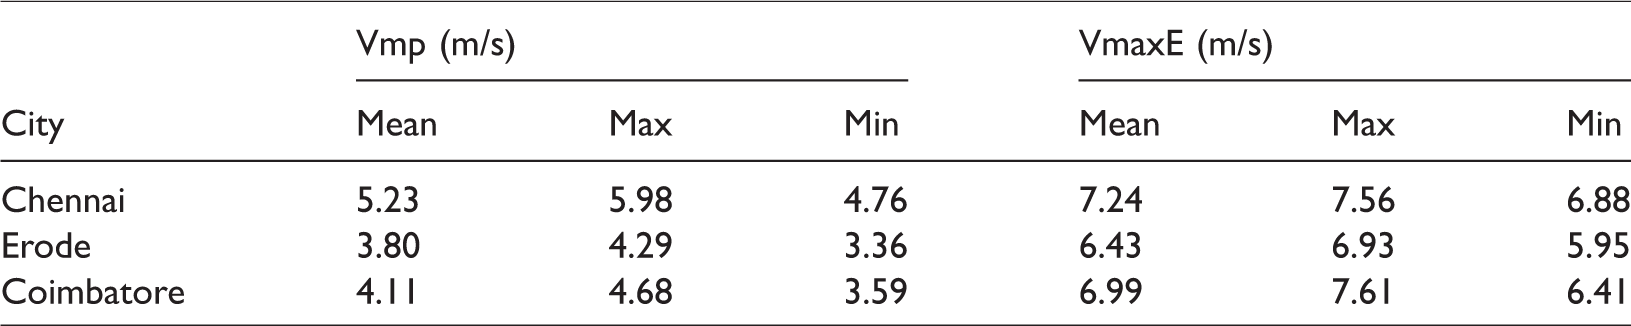
In the analysis of wind speed data, the most probable wind speed (Vmp) and maximum energy carrying wind speed (VmaxE) are of particular interest to the wind power system planners. In simple words, the most probable wind speed provides the most frequently occurring wind speed for a given wind probability distribution. In other words, the maximum energy carrying wind speed represents the wind speed that generates the maximum amount of wind energy. Wind speed carrying the maximum energy is also used to estimate the rated wind speed (Oyedepo et al., 2012). On the other hand, the most probable wind speed represents the peak of the probability density function (Oyedepo et al., 2012). Since the Weibull distribution accurately fits the wind speed data, these two wind speeds are calculated using equations (2) and (3).
The most probable (Vmp) and maximum energy carrying (VmaxE) wind speed values are calculated using equations (2) and (3), respectively. The Weibull scale and shape parameters appearing in these equations were obtained from expression given above by equations (7) and (8). Highest mean (5.23 m/s), maximum (5.98 m/s) and minimum (4.76 m/s) values of Vmp are found at Chennai while the corresponding minimum values of 3.80 m/s, 4.29 m/s and 3.36 m/s at Erode, as observed from Table 7. Similarly, the highest of the mean, maximum, minimum values of the VmaxE are found at Chennai and the corresponding lowest values at Erode. It is evident from this discussion that 5.23 m/s mean wind speed is the most probable speed having maximum frequency in the entire data set at Chennai. At Erode and Coimbatore, the smaller values of Vmp are indicative of larger presence of comparatively lower values of wind speed than in Chennai. The mean maximum energy carrying wind speeds 7.24 m/s, 6.43 m/s and 6.99 m/s are observed at Chennai, Erode and Coimbatore, respectively.
Long-term values of most probable and maximum energy carrying wind speeds at all the locations (1980–2017).
Higher values (5.0 m/s to 6.0 m/s) of Vmp are observed throughout the year at Chennai with exceptions in February and October (Figure 15) while June to August at Erode and June to September at Coimbatore. This means that higher frequencies of higher winds are found throughout year at Chennai and only for few months at Erode and Coimbatore. The monthly mean maximum energy carrying wind speeds of 6.0 m/s to 8.0 m/s, 5.0 m/s to 8.0 m/s and5.0 m/s to 9.0 m/s are observed at Chennai, Erode and Coimbatore. However, VmaxE remained always more than 6.0 m/s at all the sites based on entire data set (Figure 16).
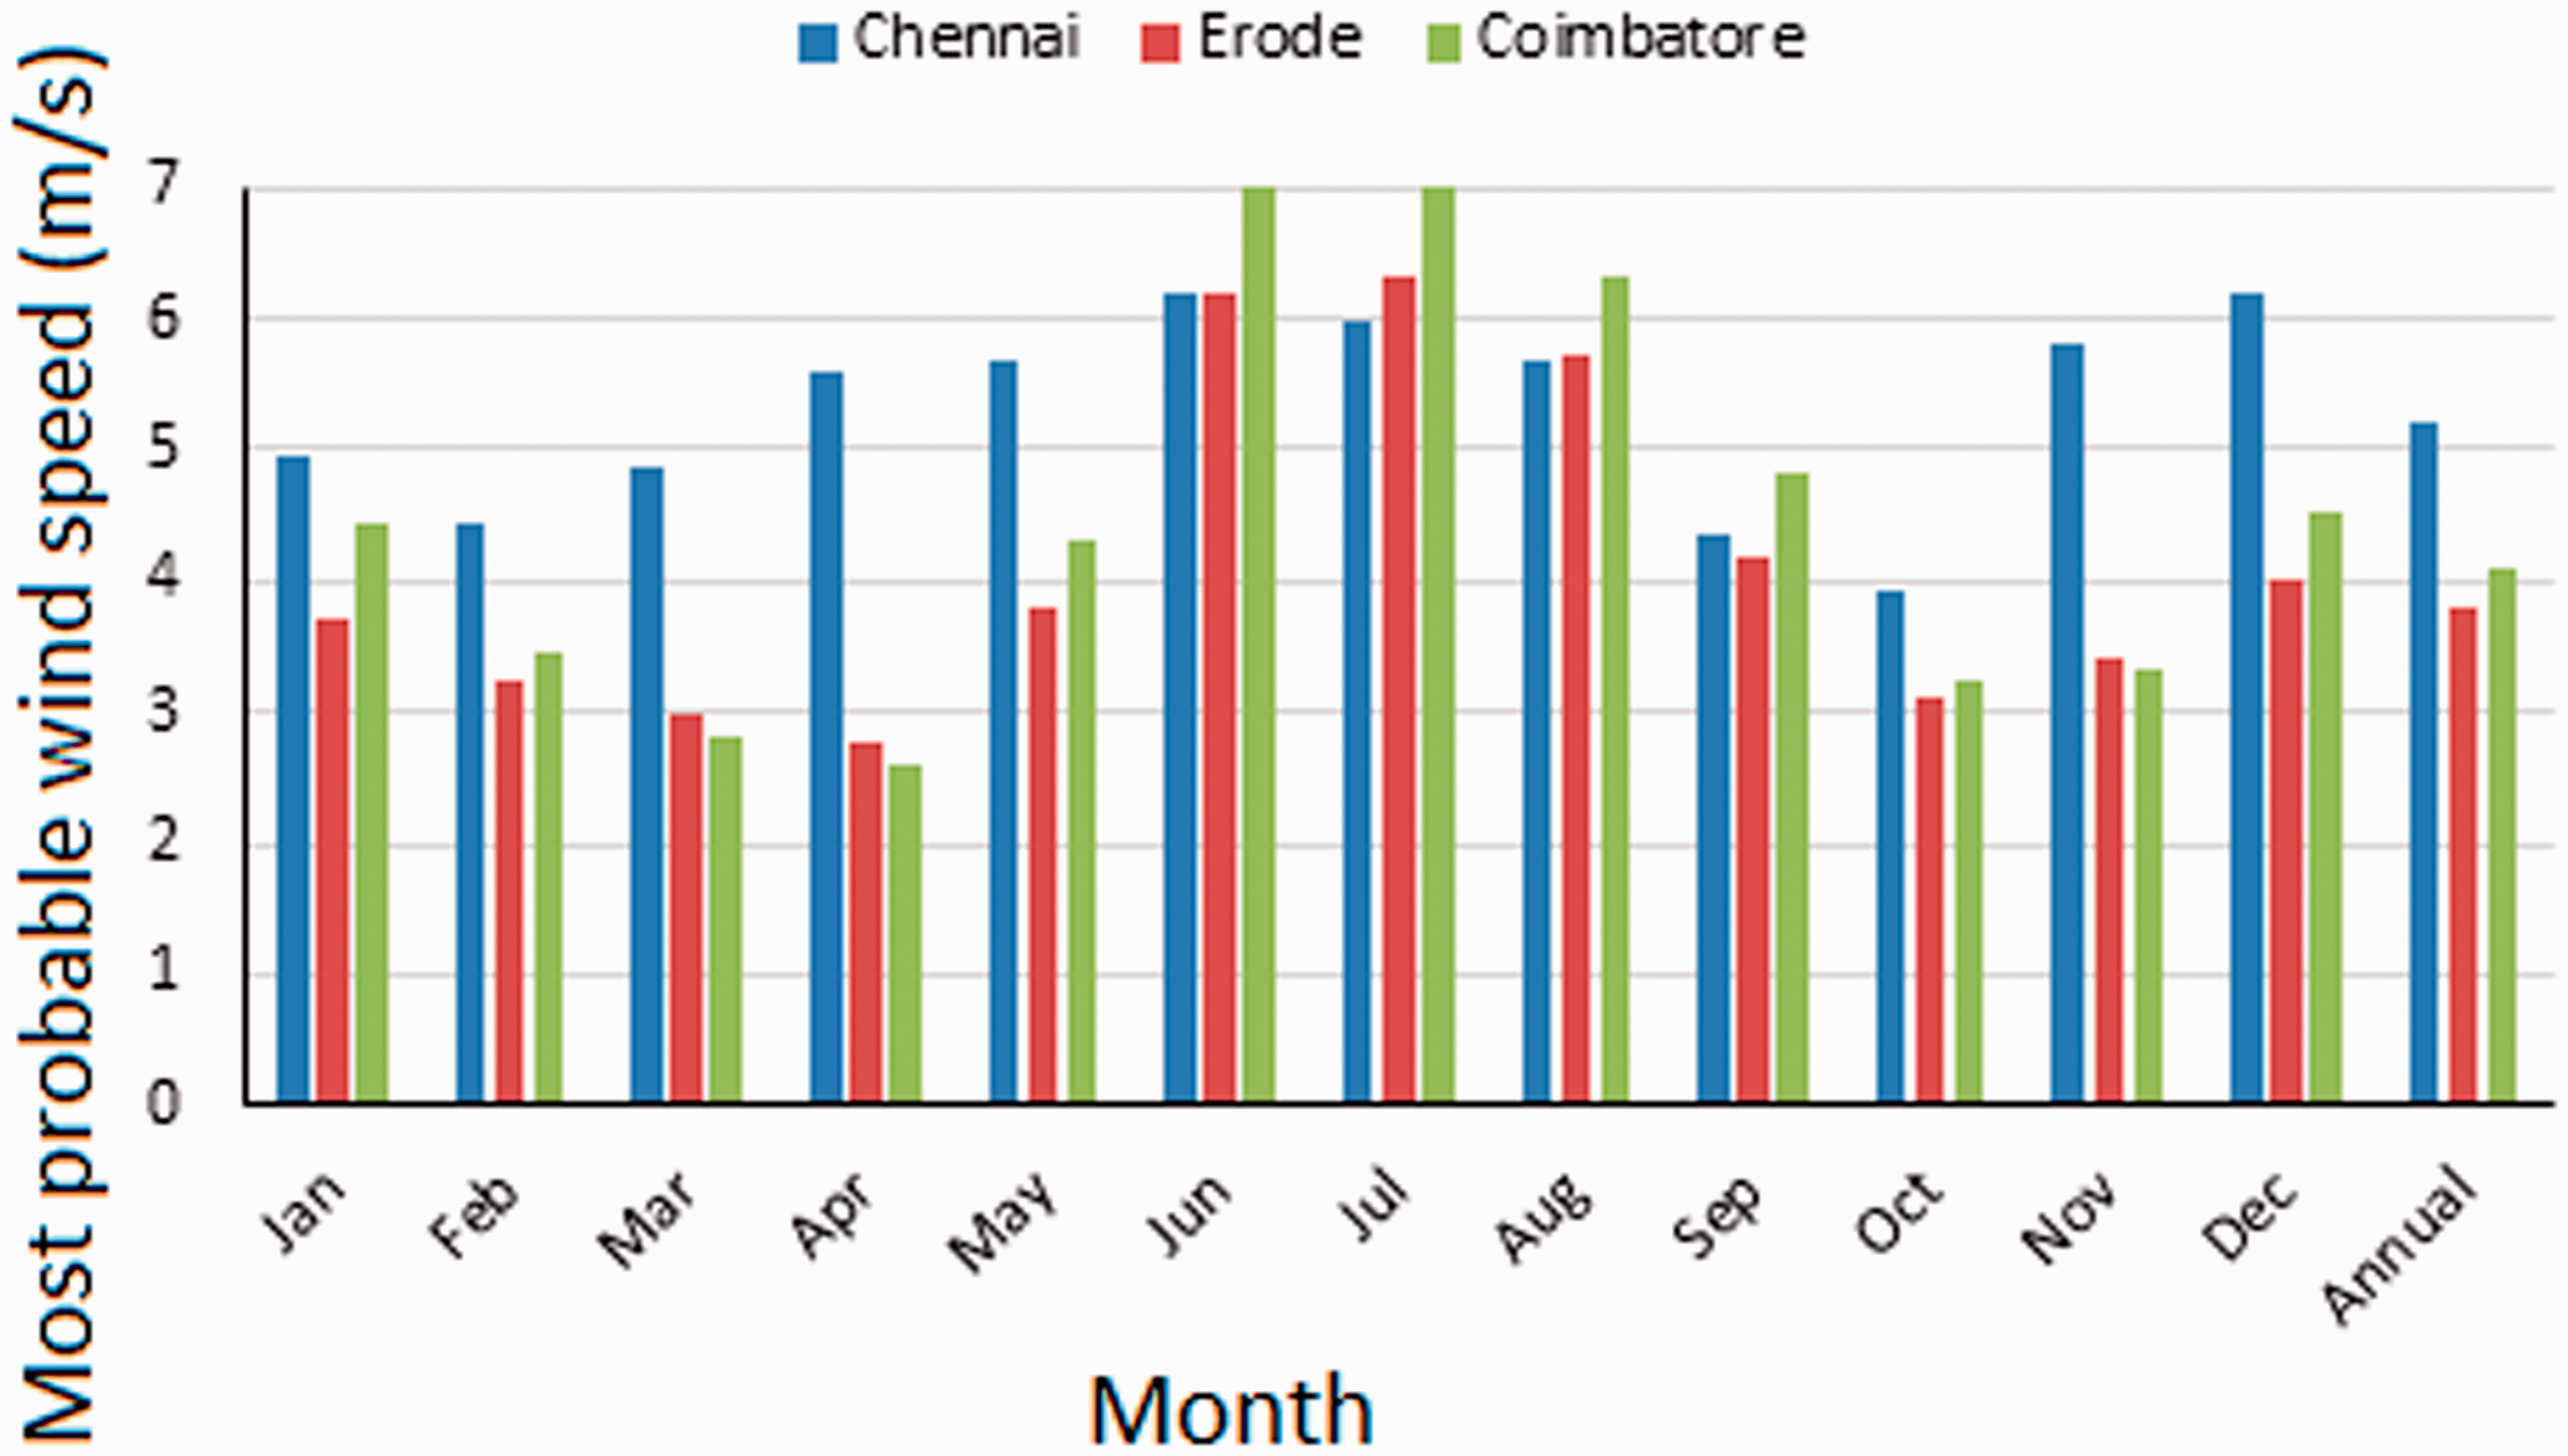
Monthly mean values of most probable wind speed (1980–2017).
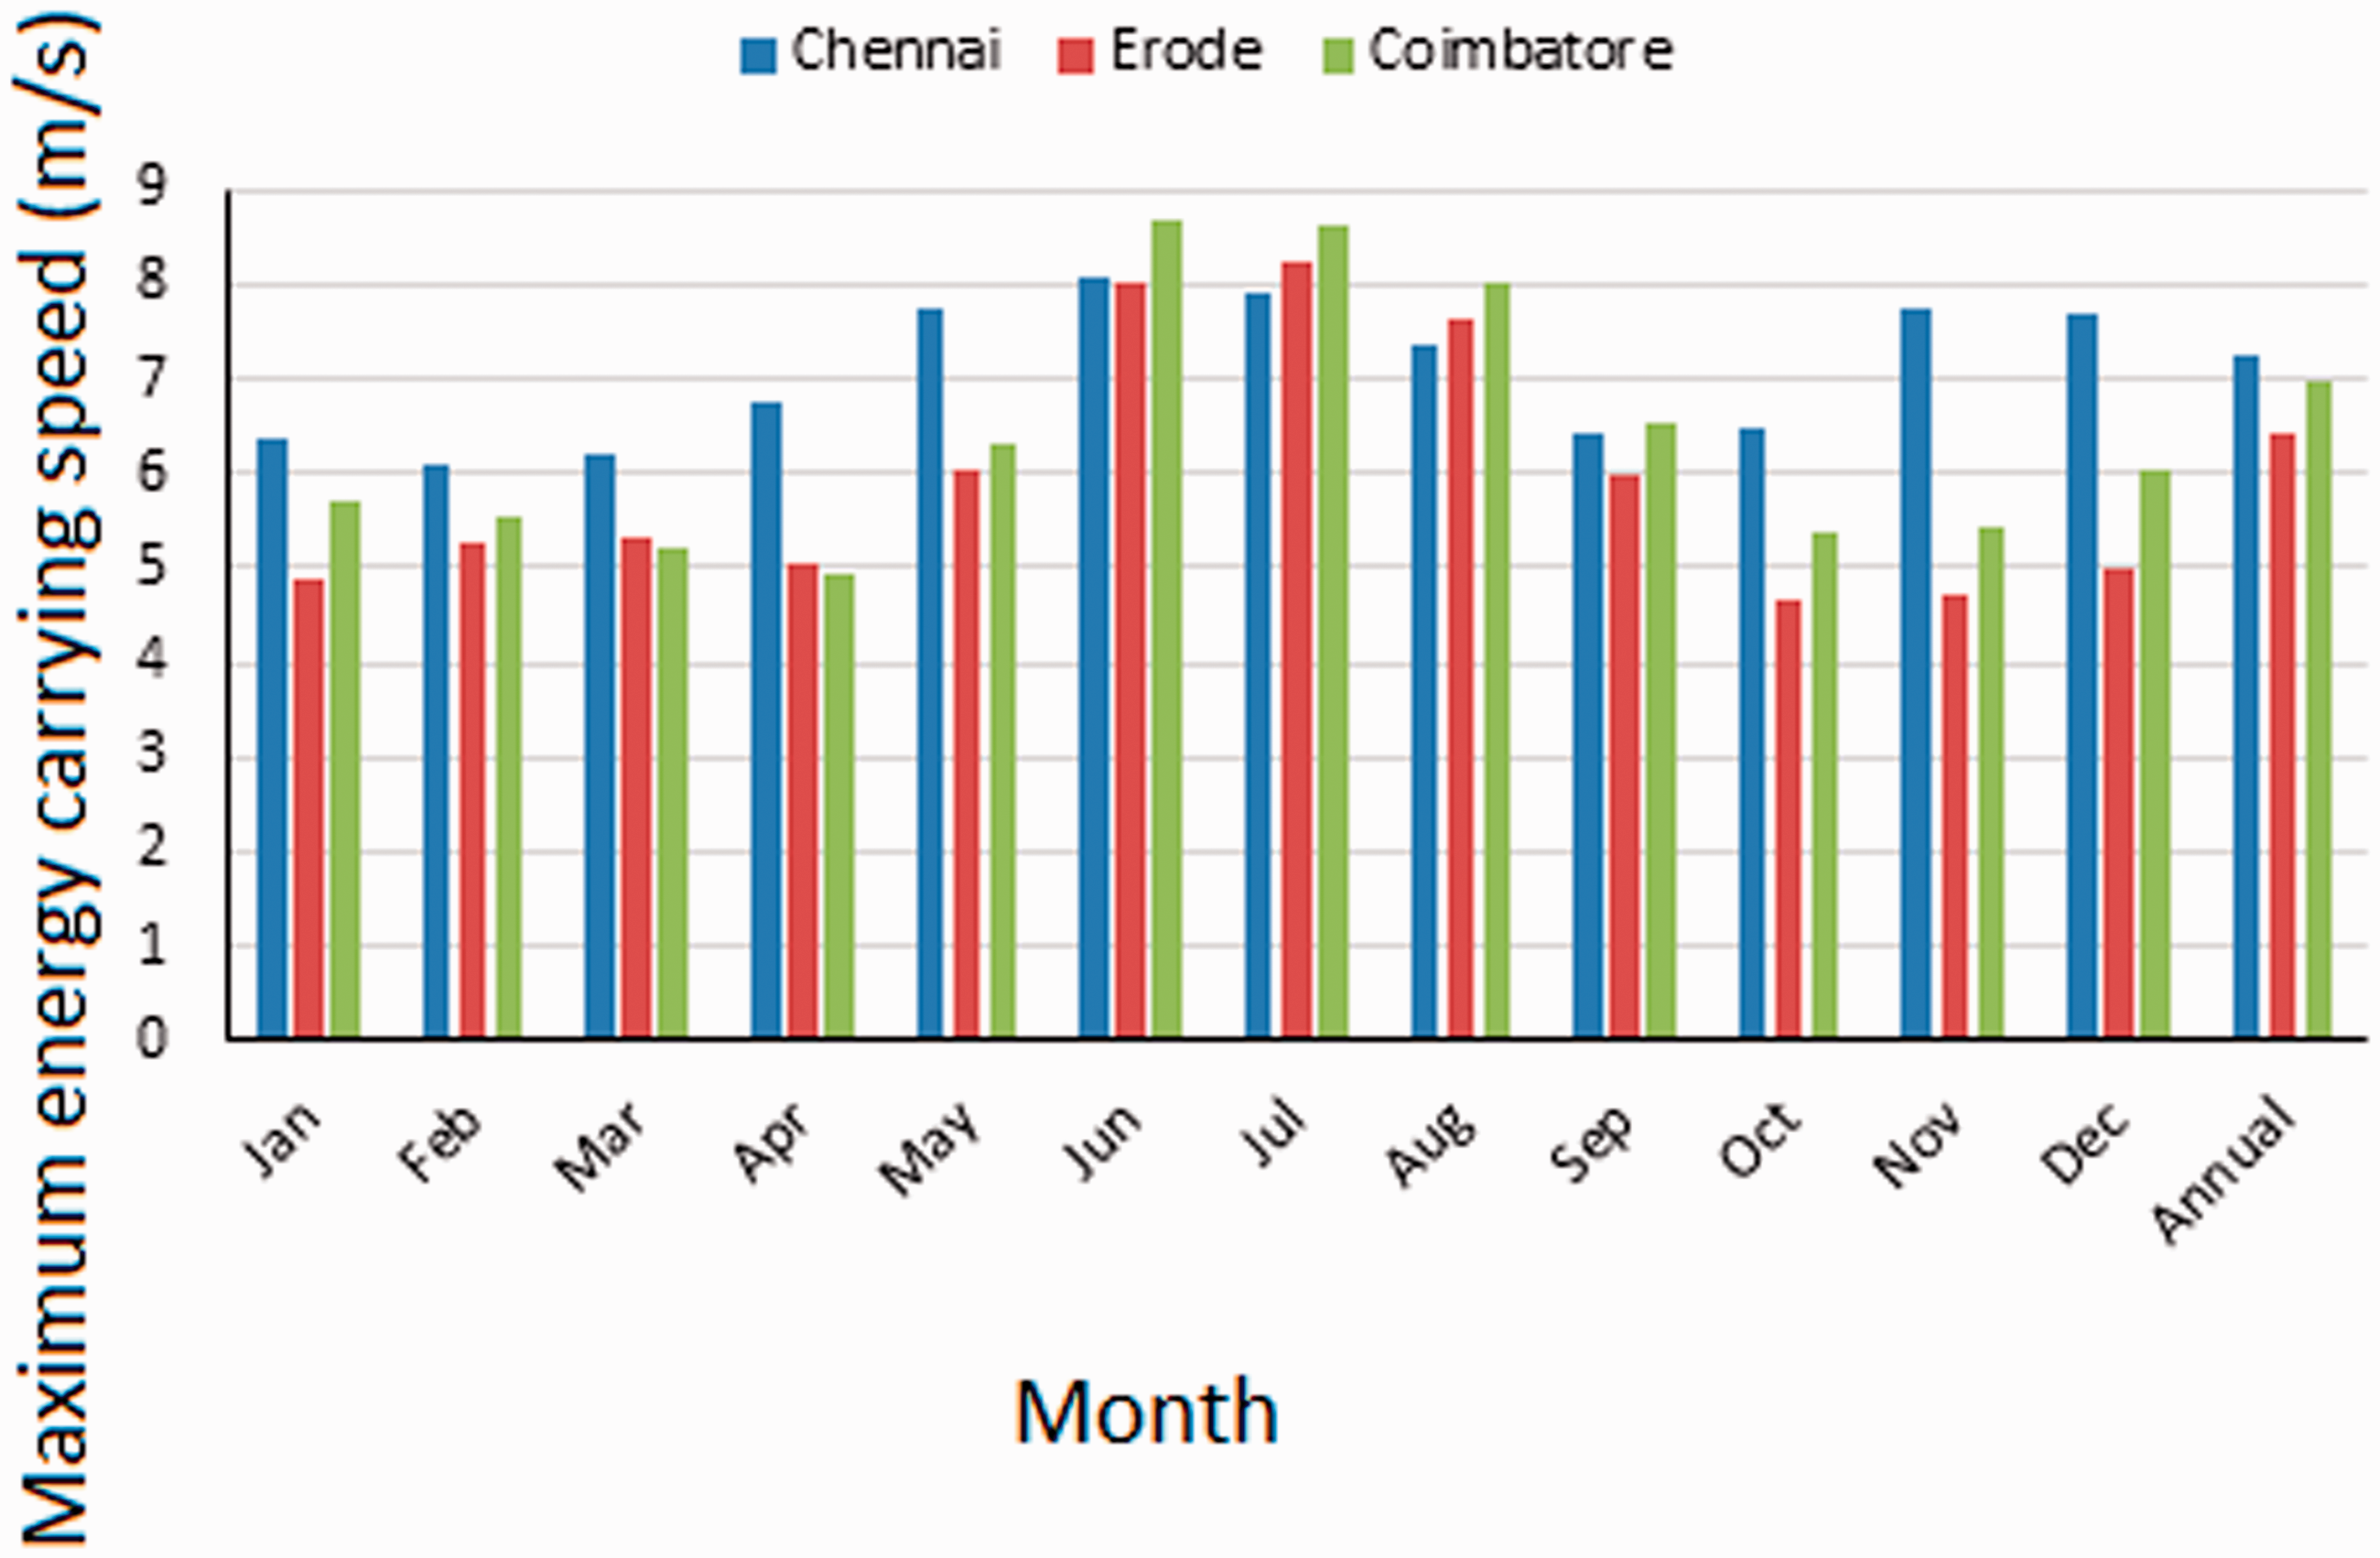
Monthly mean values of maximum energy carrying wind speed (1980–2017).
Wind power generation and capacity factor analysis
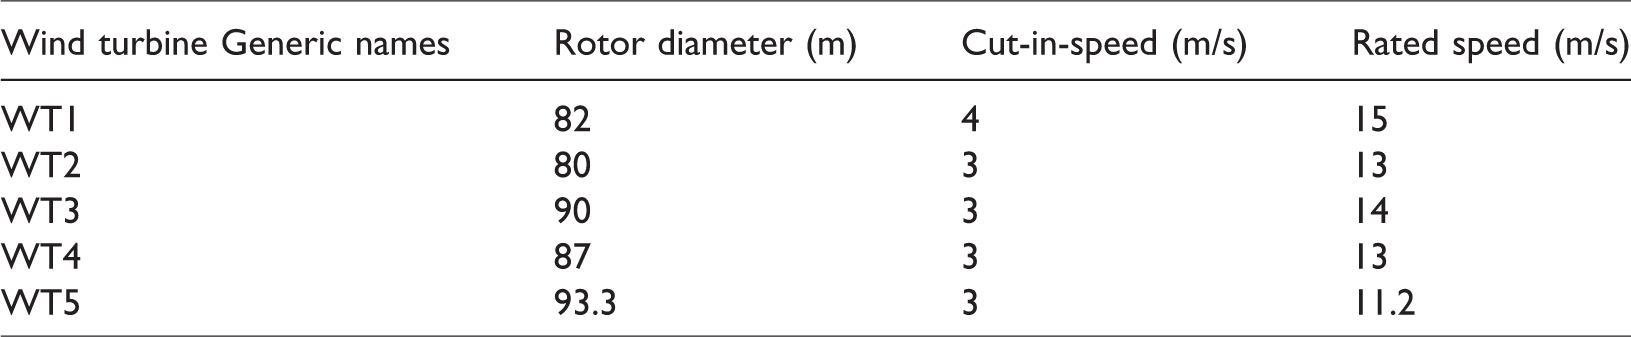
In order to study the power generation and capacity factor, five wind turbines, each of 2.0 MW rated capacity and pitch controlled type, are chosen. The technical specifications of the chosen turbines are summarized in Table 8. It is to be noted that largest rotor diameter of 93.3 m and lowest rated power of 11.2 m/s corresponds to turbine WT5. The wind power curves of the chosen wind turbines are provided in Figure 17. For calculating the net energy generation and net capacity factor calculations, various equivalent losses of 11.4527% (availability 2%, wake effect 4%, turbine performance 2%, electrical 0%, environmental 2%, curtailment 0% and others 2%) are considered.
Technical specifications of pitch controlled 2.0 MW rated capacity wind turbines.
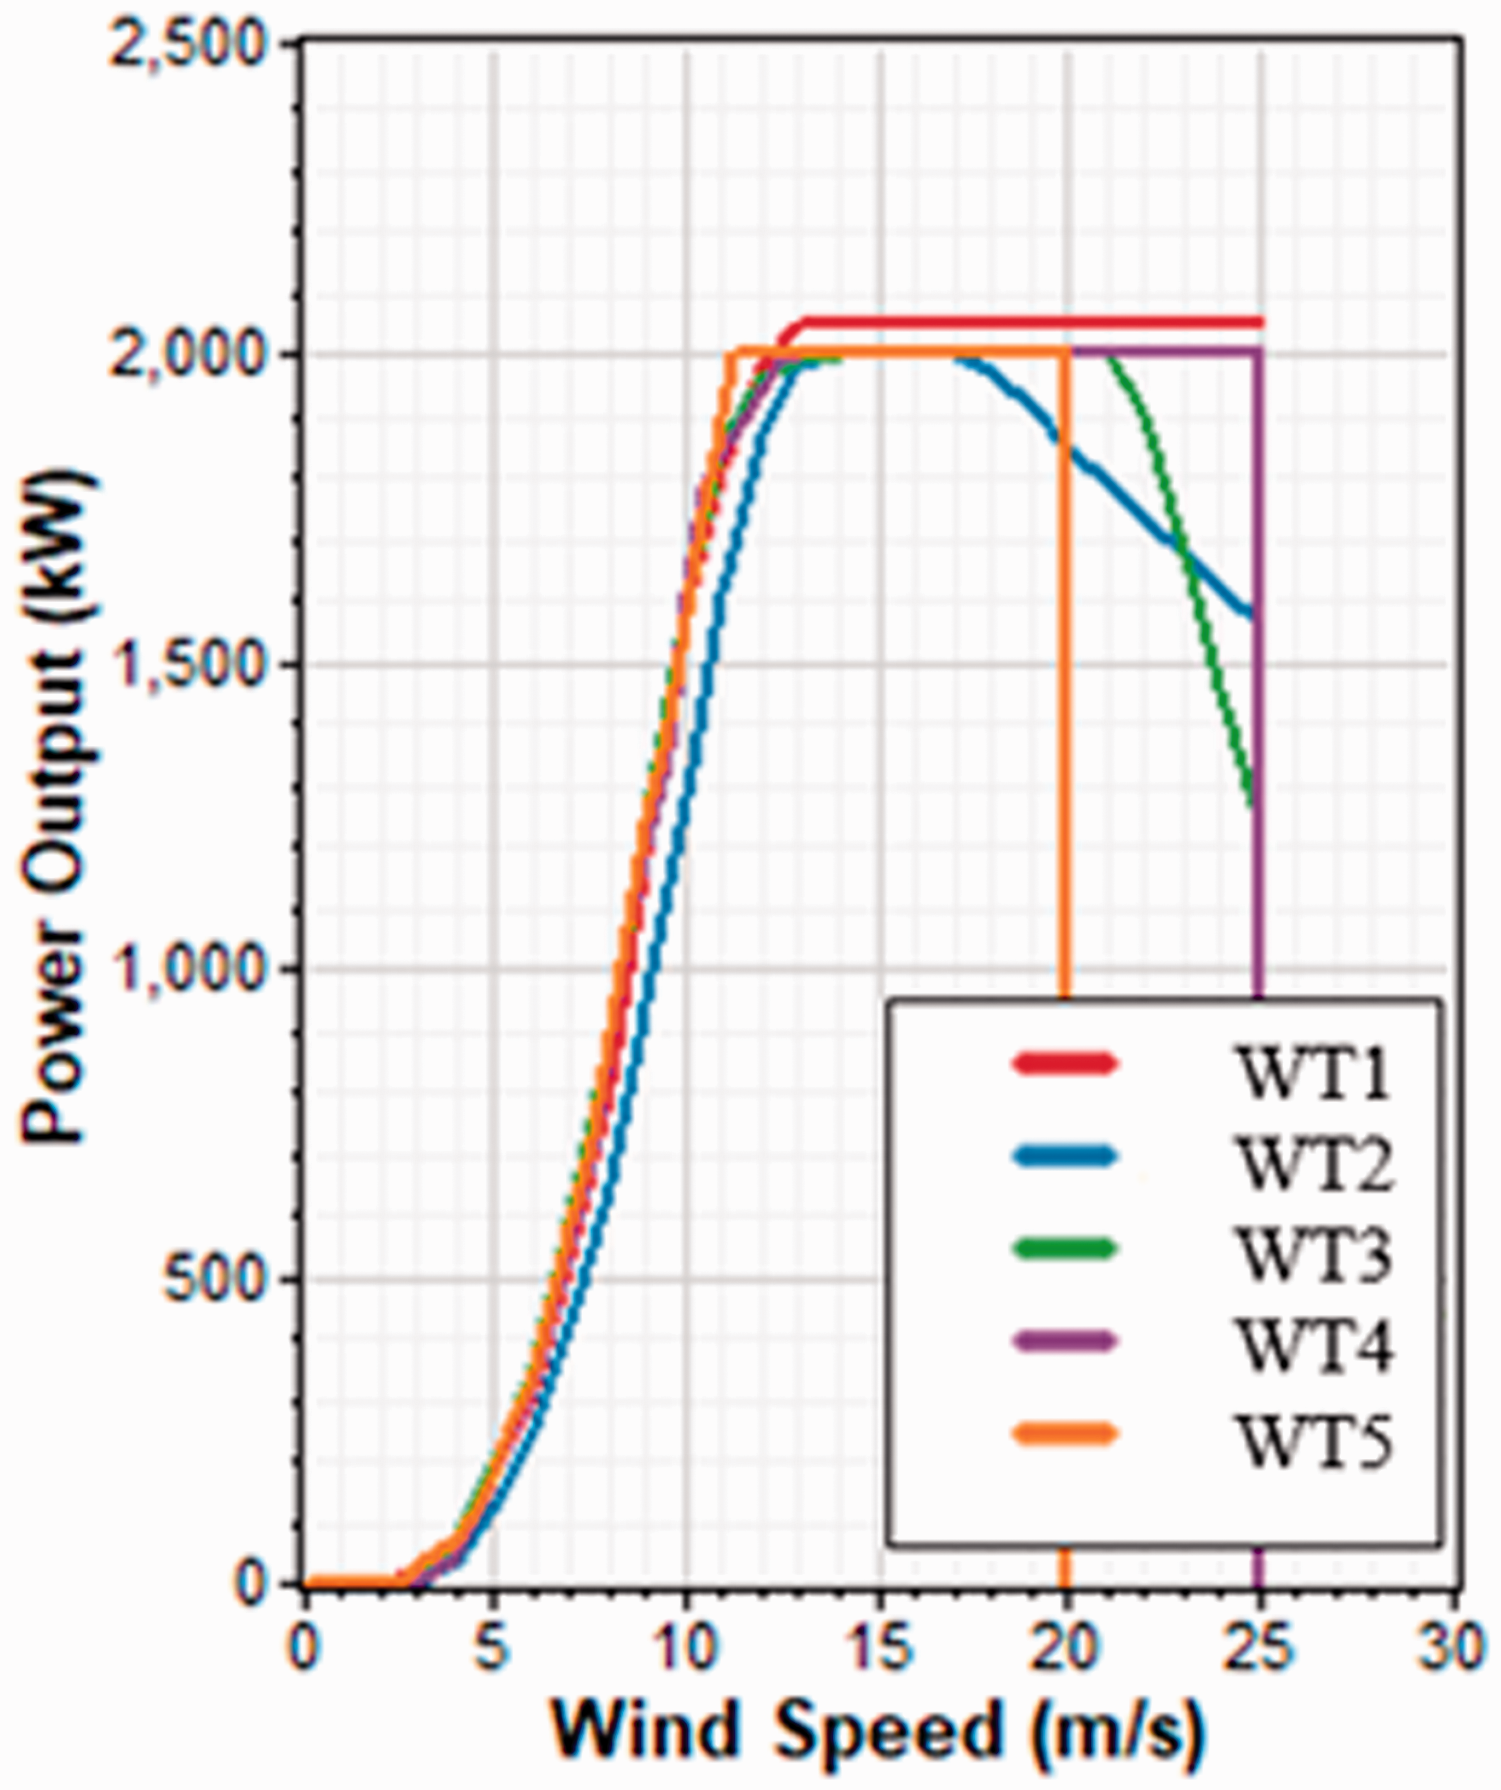
Wind power curves of the 2.0 MW rated power capacity used in this study.
Annual energy yields and capacity factors are calculated using the site specific wind speed and wind turbines technical data (Tables 9 and 10). Wind turbines WT3 and WT5 produced highest energy while WT1 and WT4 produced lesser energy at Chennai (Figure 18). Wind turbine WT2 performed the worst compared to other four turbines. Almost same performance is observed at Erode and Coimbatore (figures are not included). Highest capacity factors are obtained in 1983 and lowest in 2008 (Figure 19), irrespective of the turbine type.
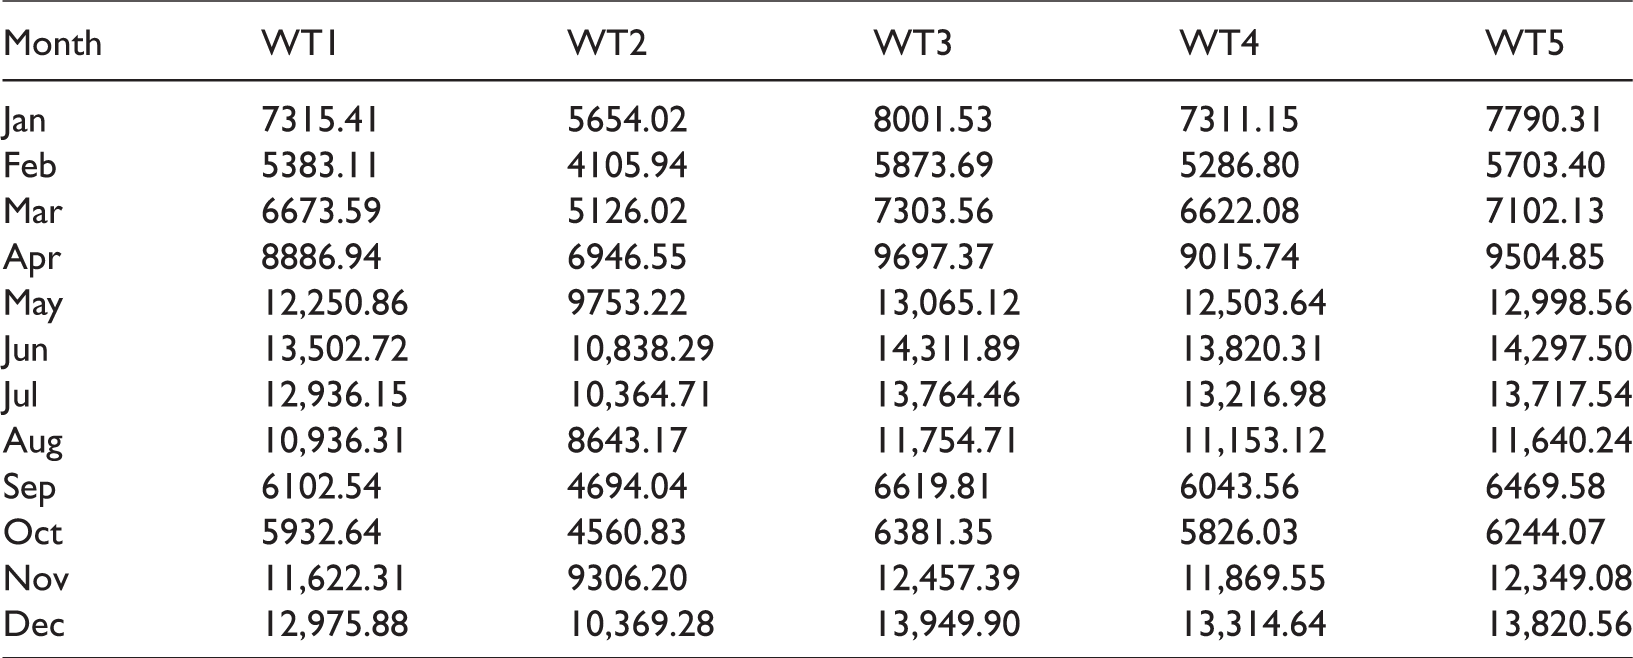
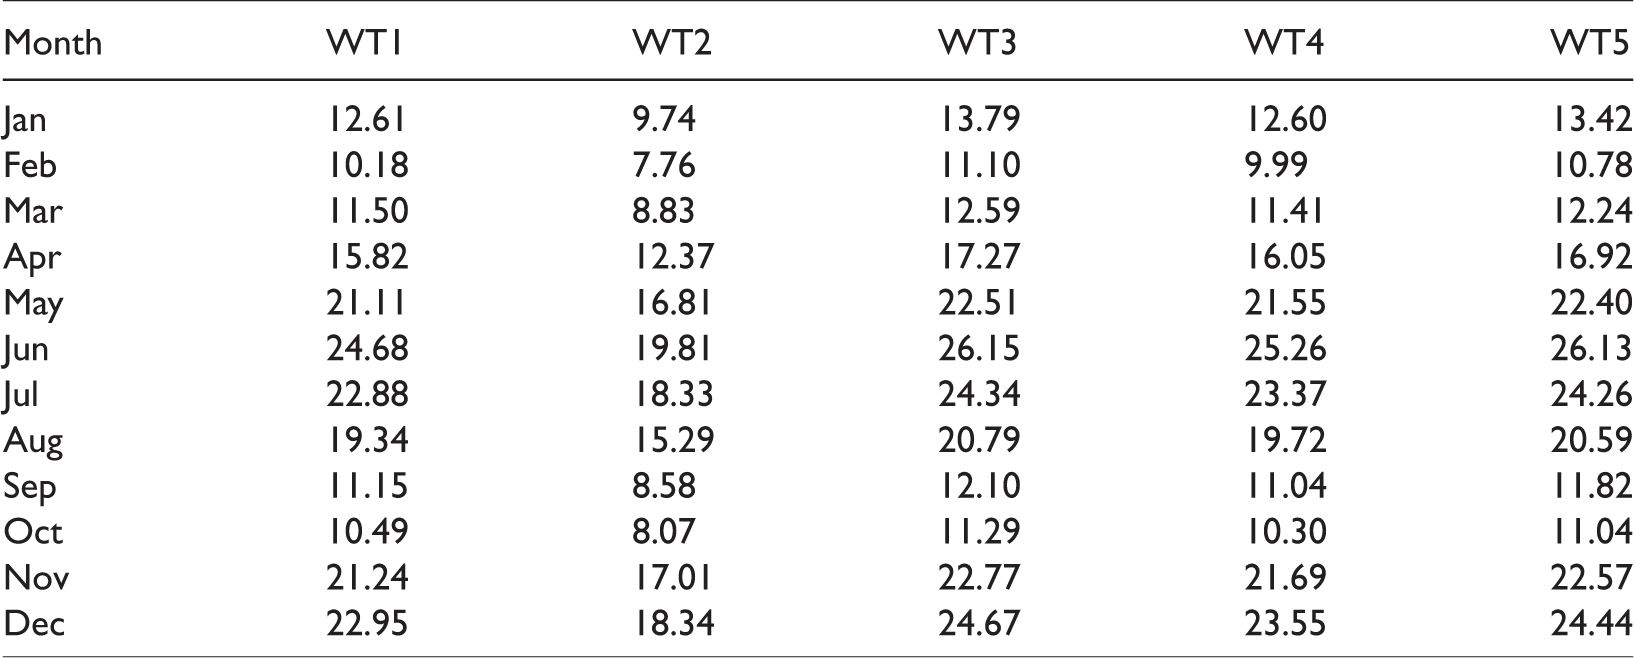
Monthly net energy yield (MWh) at 80 m hub height at Erode (1980–2017).
Monthly percent net capacity factor at 80 m hub height at Chennai (1980–2017).
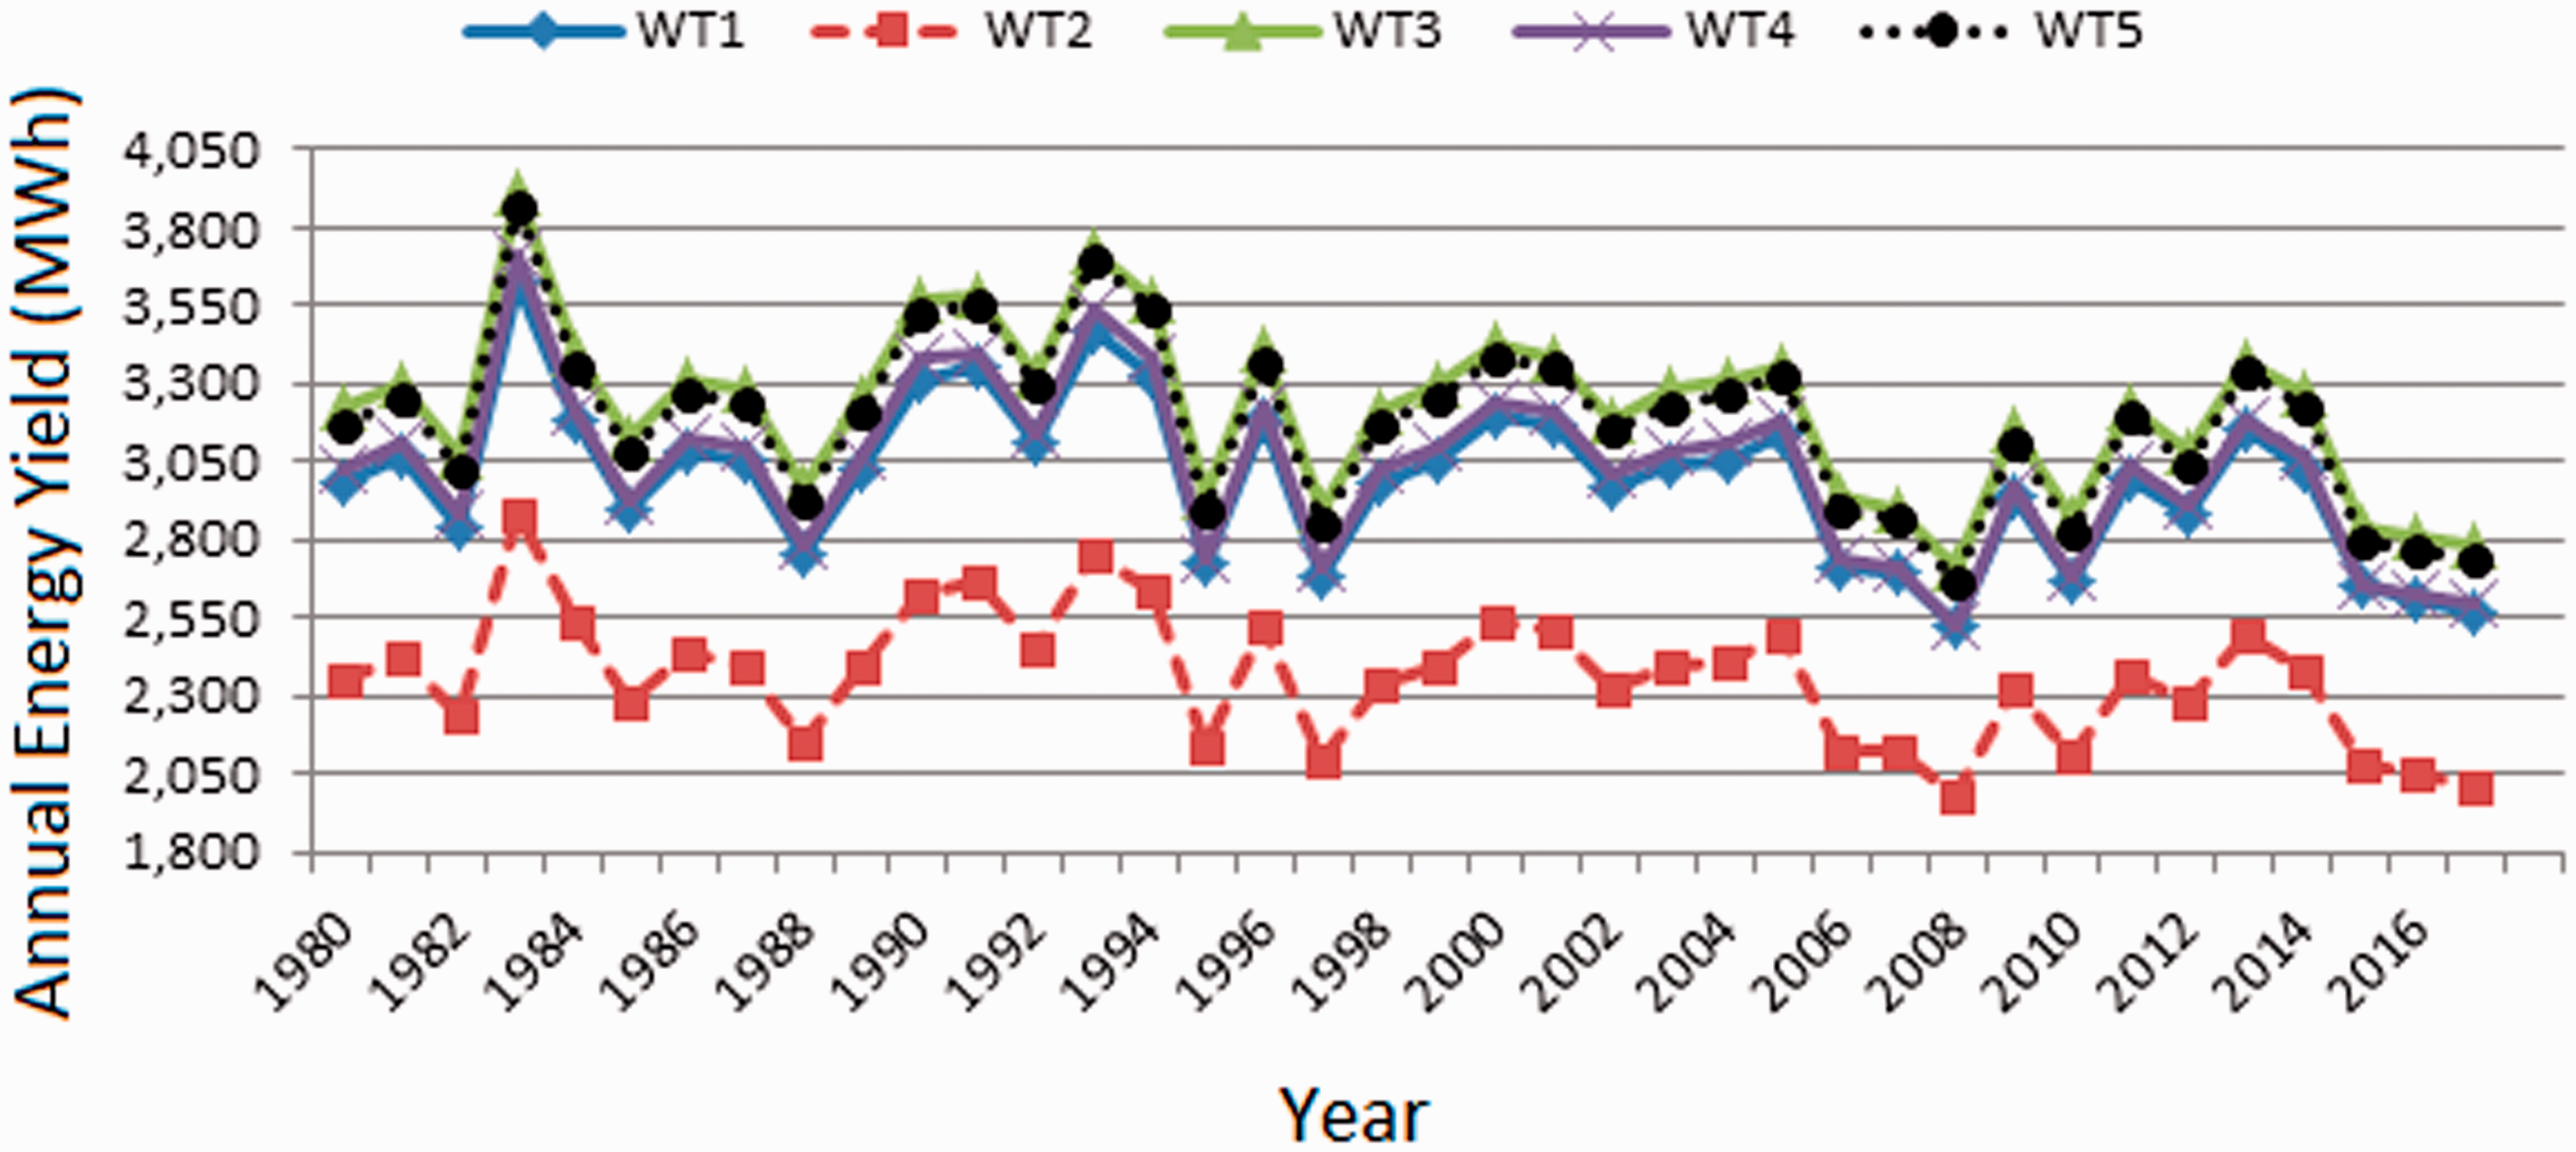
Annual net energy yield at 80 m hub height at Chennai (1980–2017).
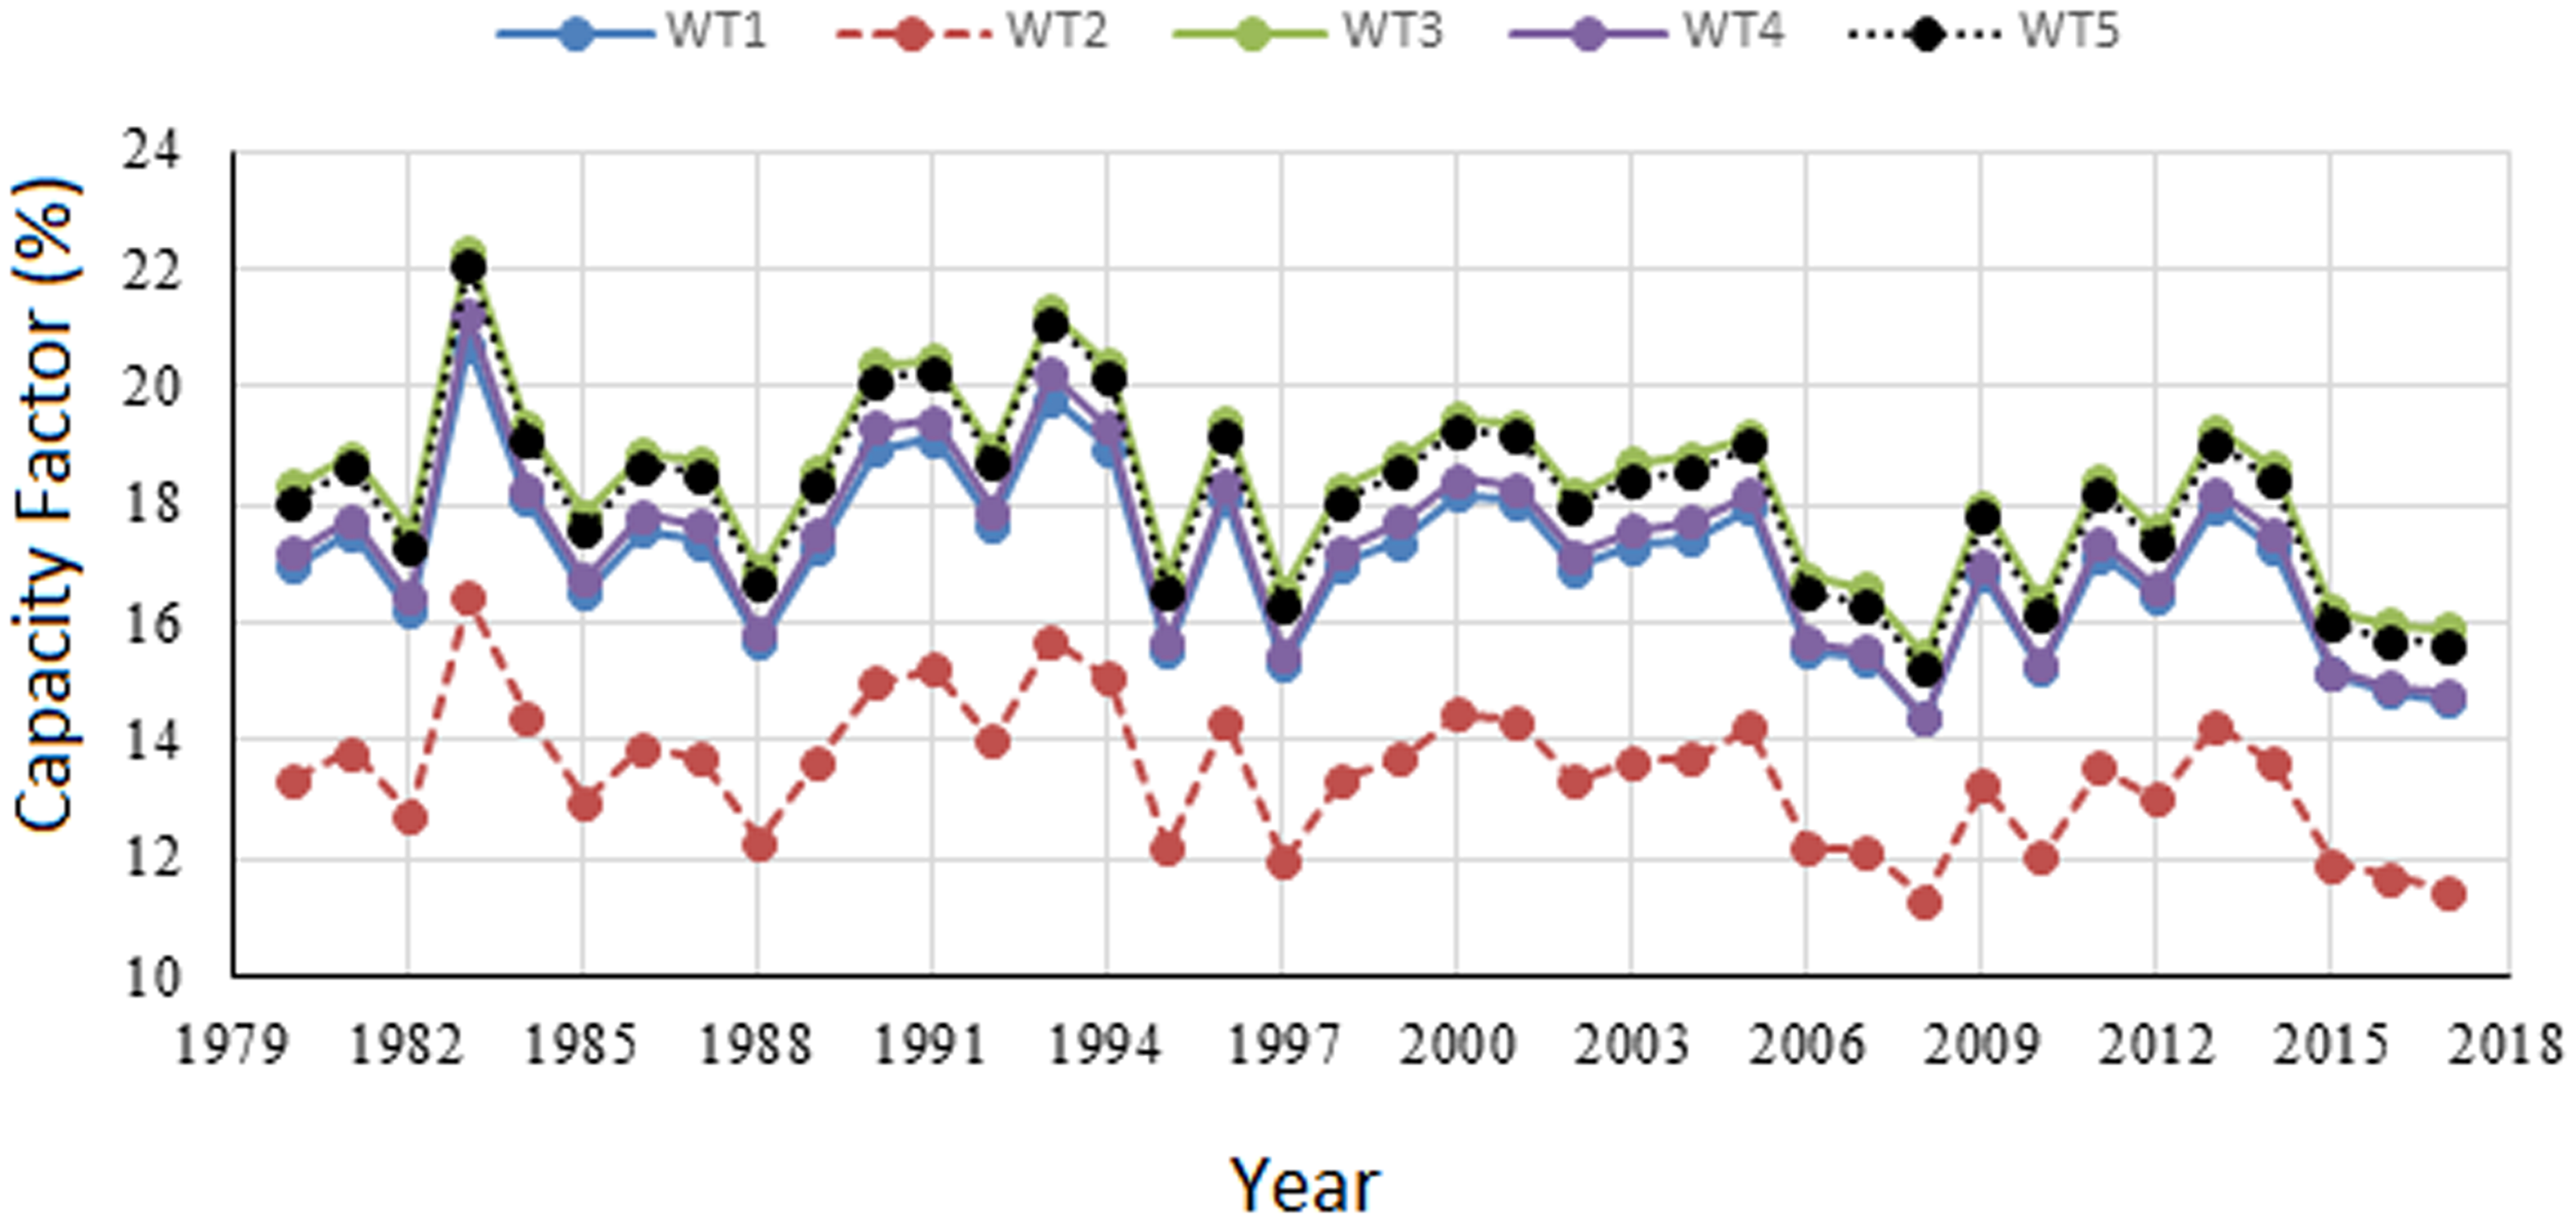
Annual net capacity factor at 80 m hub height at Chennai (1980–2017).
The relative performance of all the wind turbines at Chennai, Erode and Coimbatore are depicted in Figures 20 and 21 based on annual energy yield and capacity factors. The average annual energy yield of > 3000 MWh over entire data reporting period is obtained at Chennai based on turbines WT1, WT3, WT4 and WT5 (Figure 20). Similarly, the higher capacity factors between 17 to 19% are obtained at Chennai corresponding to the same turbine types as above while at Erode the capacity factors remained around 10% (Figure 21). However, at Coimbatore the capacity factor values remained between 12 and 14%. In terms of turbine performance, WT3 and WT5 produced the maximum energy at all the locations. In terms of location performance, Chennai is found to be the location, Coimbatore the second best while Erode is the least performer.
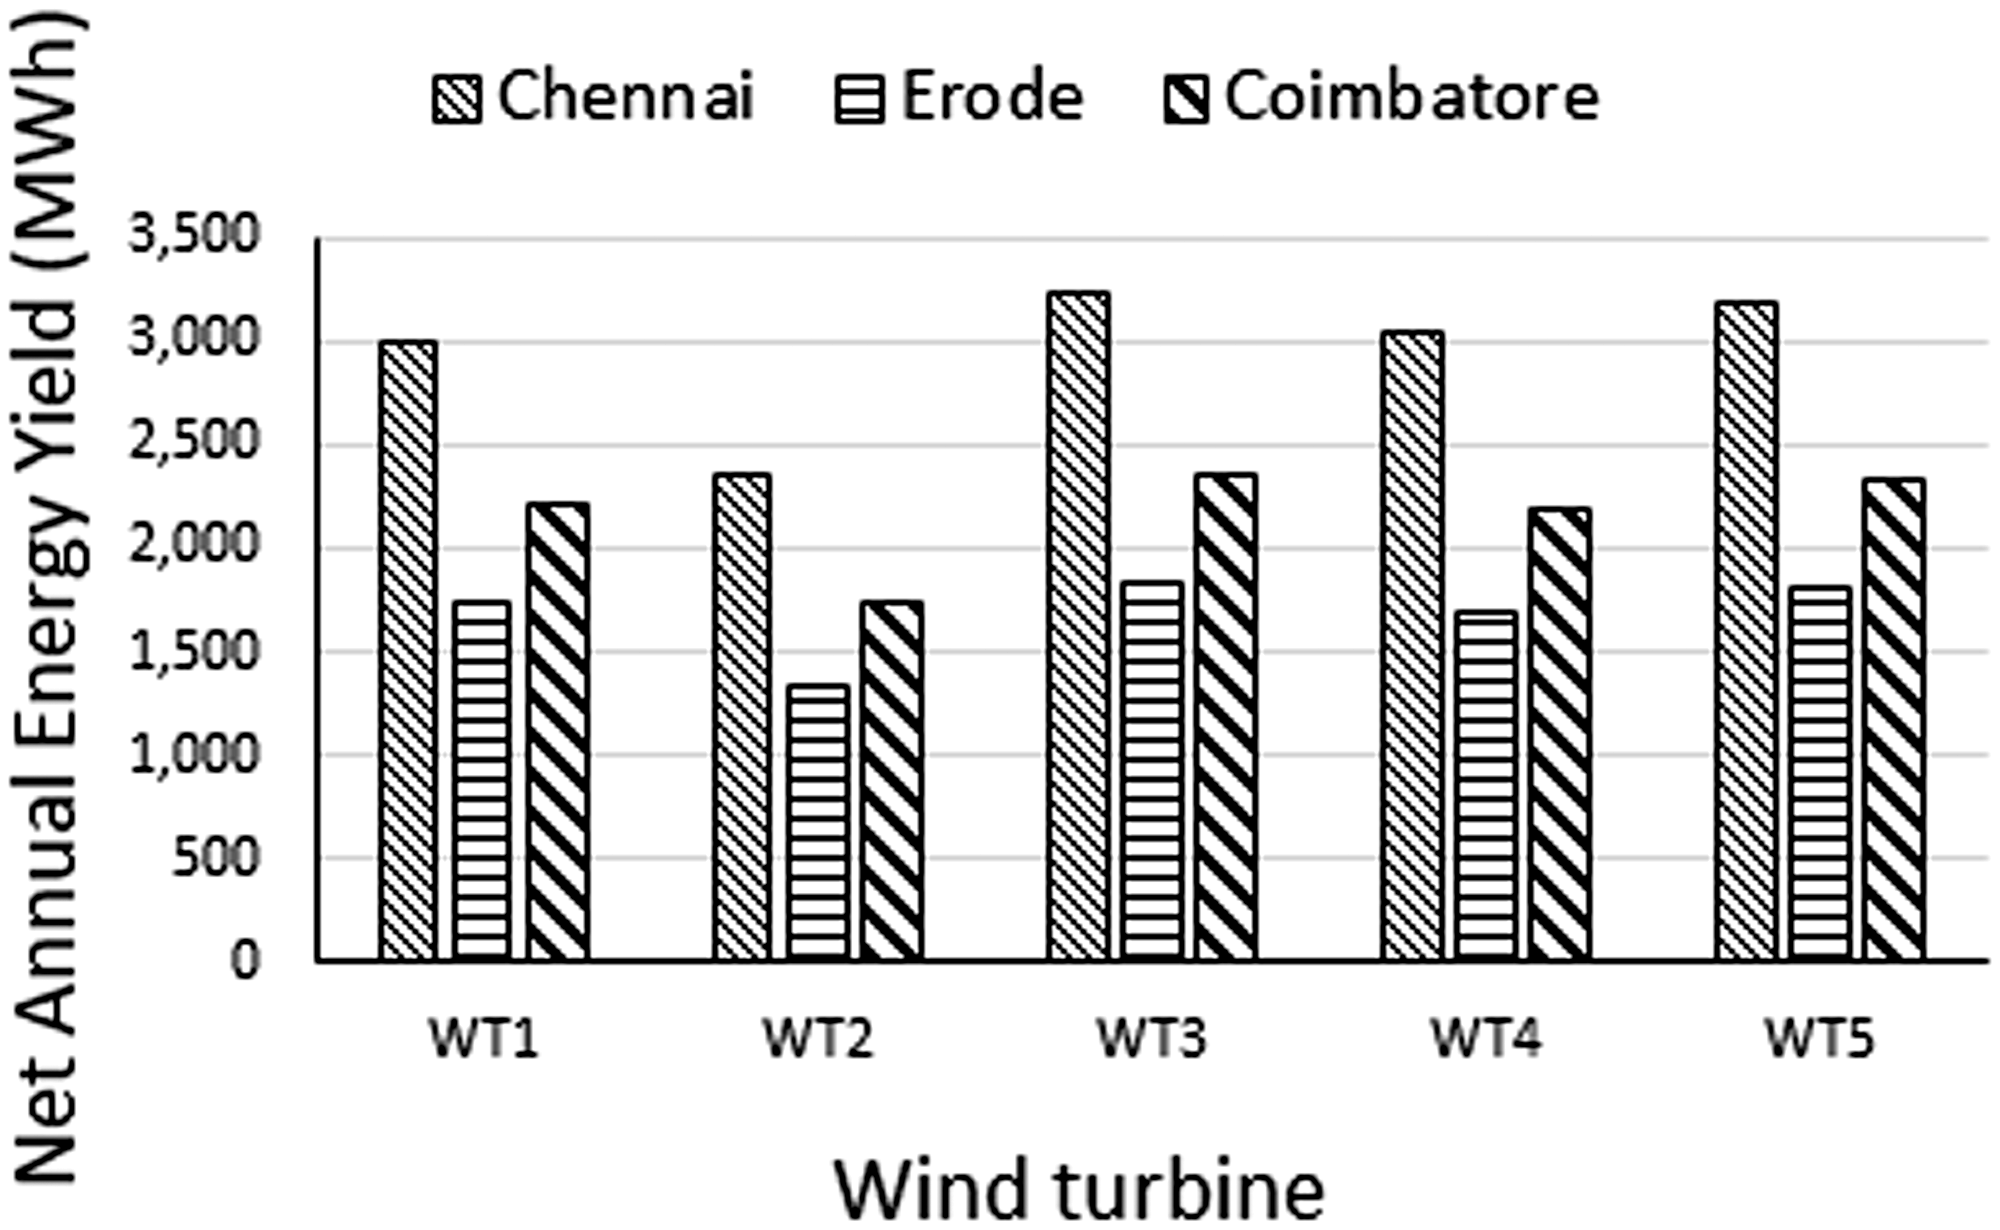
Annual average net energy yield (1980–2017).
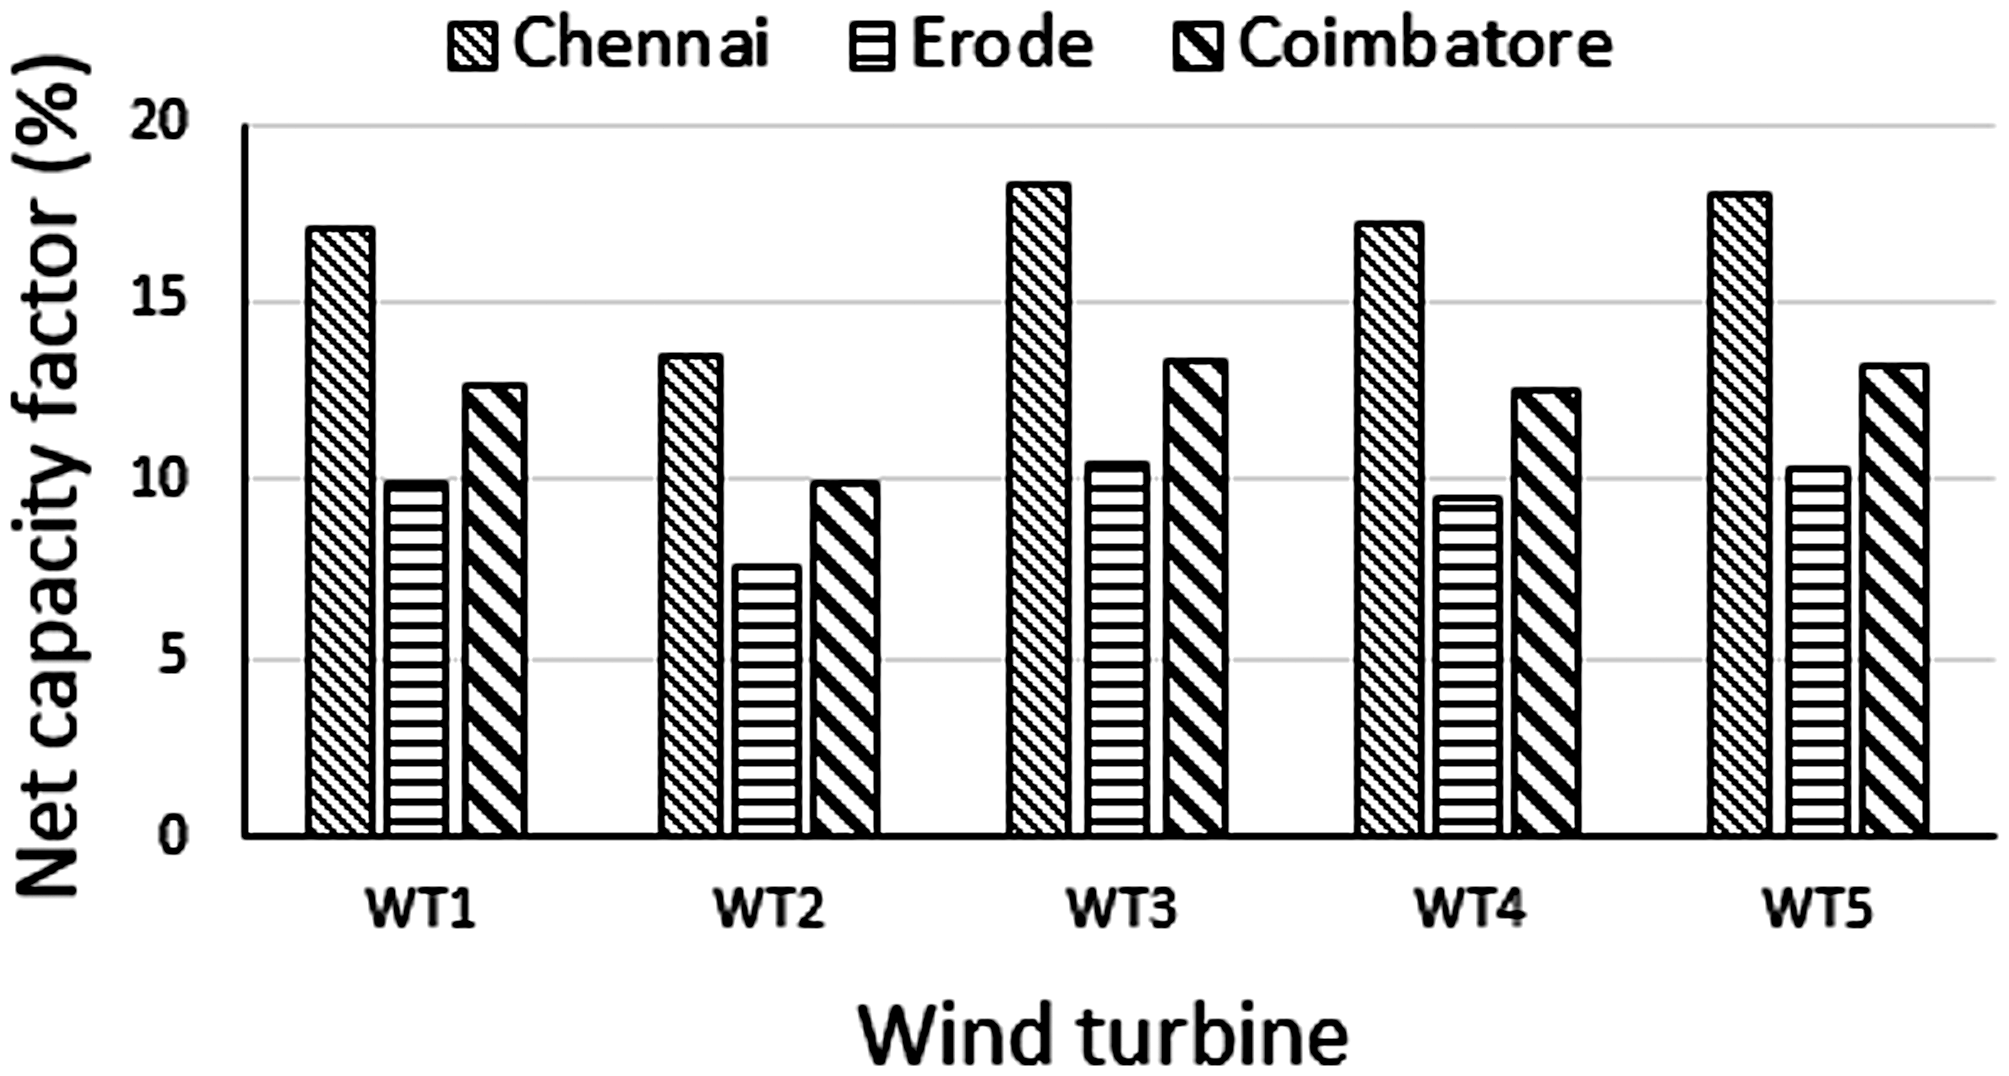
Annual average net capacity factor (1980–2017).
Conclusions
This study investigated the wind power potential and wind characteristics at three cities located at different elevations and distance from the shore line across the state of Tamil Nadu, India. For the wind resource characterization, 38 years of wind data were statistically analysed in detail using two-parameter Weibull distribution function. The diurnal, monthly and annual wind speed variations have been investigated. Furthermore, the most probable and maximum energy carrying wind speed, wind power generation and capacity factor have also been studied. The critical conclusions of this study are summarized as follows:
Mean wind speed for Chennai, Erode and Coimbatore are 5.4 m/s, 4.34 m/s and 4.7 m/s while the mean maximum are 21.42 m/s, 13.97 m/s and 15.50 m/s. The mean maximum wind speed is highest in Chennai since it is located near the seashore. The wind speed decreases for cities located inland. The mean wind power density for Chennai, Erode and Coimbatore are 129 W/m2, 76 W/m2 and 97 W/m2 and the mean energy content 1127 kWh/m2/year, 666 kWh/m2/year and 849 kWh/m2/year. The wind speed remained around 70%, 60% and 70% between 4 m/s and 8 m/s at Chennai, Erode and Coimbatore. The probable wind direction is predominantly from north-east and south-west in Chennai, west-south and west-north in Erode, west and west-south in Coimbatore.
The annual mean wind speed varied between a minimum of 5.1 m/s in 2008 and a maximum of 5.9 m/s in 1983 at Chennai. At Erode, the annual mean wind speed varied between 4 m/s and 4.5 m/s. At Coimbatore, the variation was between 4.3 m/s and 5.1 m/s. The monthly variation of the mean wind speed showed an increasing trend from Jan to mid of the year and a decreasing trend towards the end of the year at all the locations.
The peak frequency of wind speed is observed between 5 m/s and 6 m/s at Chennai, between 4 m/s and 5 m/s at Erode and Coimbatore. The highest and lowest of the mean, maximum and minimum values of Vmp and VmaxE were found Chennai and Erode, respectively. The mean maximum energy carrying wind speeds at Chennai, Erode and Coimbatore were 7.24 m/s, 6.43 m/s and 6.99 m/s.
Highest capacity factors are obtained in 1983 and the lowest in 2008 irrespective of the type of turbine. In terms of turbine performance, WT3 and WT5 produced the maximum energy at all the locations. Chennai is found to the best site for wind energy development followed by Coimbatore and Erode has the least prospects. Chennai has a higher mean wind power density since it is located near the shore and possesses the least elevation above the mean sea level. Although, both Coimbatore and Erode are located inland, Coimbatore has a higher elevation compared to Erode which has resulted in a higher mean wind power density. Hence, proximity with the sea shore and the height of the station above mean sea level plays a role in capturing the higher winds and hence higher energy yields.
Footnotes
Acknowledgements
The authors acknowledge the support provided by King Fahd University of Petroleum and Minerals, Dhahran-31261, Saudi Arabia in completing this study.
Declaration of conflicting interests
The author(s) declared no potential conflicts of interest with respect to the research, authorship, and/or publication of this article.
Funding
The author(s) received no financial support for the research, authorship, and/or publication of this article.