
Abstract
The main objective of the present work is to assess the wind energy resources in the Black and in the Caspian seas. Additionally, the electric power expected to be provided by various state of the art technologies was also evaluated. For this reason, several reference points were considered in the coastal environments of the two areas targeted. In order to assess the wind potential in these locations, 12 year of data coming from the US National Centers for Environmental Prediction were processed and analyzed. From the analysis of the wind power density (corresponding to a height of 80 m), it was possible to evaluate the spatial and seasonal distributions of the wind resources, and also to identify some hot spot areas. Since the regions located near the shoreline are under the influence of the diurnal/nocturnal fluctuations, a special attention was paid to this aspect. This is especially due to the fact that the power output of a wind farm project is supposed to be significantly influenced by such variations. In the second part of the work, several offshore wind turbines were considered and their performances were evaluated in relationship with the local wind patterns. Based on these results, we can conclude that important variations may occur between the diurnal and the nocturnal intervals, in terms of both wind velocity and direction, while on a regional scale the northern parts of the Black and the Caspian seas seem to present more consistent wind energy potential. Moreover, this potential is comparable with that from the locations where such offshore wind farms already successfully operate.
Introduction
The global energy market considers that the renewable energy sector played in the last decades an increasing role, especially as regards the constant development of this industry. Its contribution to the world electricity budget (Kiran, 2013) was estimated to be in the range 7.8–8.5% for the years 2012–2013 (Bloomberg New Energy Finance, 2014). At a global scale, the wind energy sector influences this electricity mix throughout a total capacity of 318 GW (in 2013), which is divided between 71 countries with more than 10 MW and 24 countries exceeding a capacity of 1 GW (REN21, 2014).
Europe is characterized by a remarkable variety of windy locations, some of them being already considered for the development of high-capacity projects, such as those located in the coastal environment of the North Sea or those operating onshore, as for example, Fantanele–Cogeac (600 MW) area in Romania or Whitelee (539 MW) and Clyde (350 MW) wind farms in Scotland, which were connected to the grid in 2012 (EUROBSERV’ER, 2013). At the same time, many scientists and experts agree that the real future of this industry is in fact in the offshore regions (Kirtay, 2010), where the wind energy potential is more significant and available in practically unlimited areas, the main drawbacks being related to the water depth and to the severe weather conditions. In such areas, hybrid solutions, wind-waves, might be also effective and such marine energy farms can play an important role in the coastal protection (e.g., Diaconu and Rusu, 2013; Zanopol et al., 2014a, 2014b).
In any renewable energy project, an important step is to evaluate the potential of the natural resources in order to estimate the performances of the future energy farm (Albani et al., 2014; Gazzilli et al., 2001; Schneiderhan et al., 2005). It can be also mentioned that most of the studies performed in the recent years were focused on the evaluation of the nearshore and offshore wind resources at a level of 80 m (and above), considering different geographical scales: Global (Lu et al., 2009), Portuguese nearshore (Salvacao et al., 2013), Brasilian coastal environment (Pimenta et al., 2008), or the US coastal environment (Dhanju et al., 2008).
Besides the height level where the wind speed is considered, in the analysis of a particular location another factor which needs to be taken into account is related to the diurnal/nocturnal variability. Most of the marine regions located less than 100 km from the shore are strongly affected by this process (Lapworth, 2005). This is controlled by the differences in temperature between the sea and the land, when during the day time the land areas present higher temperatures (Choi and Speer, 2006; Mapes et al., 2002). These fluctuations are taken into consideration, since they can significantly influence the performances and the lifespan of any offshore wind project (Emeis, 2014; Pichugina et al., 2012).
Usually the mean wind speed is considered to describe the wind conditions, but the wind power density (WPD) represents a more concise parameter, which can reflect in a more appropriate way the particularity of the wind potential in terms of the seasonal, diurnal/nocturnal, or directional variations. This is due to the cubic relationship that exists between the WPD index and the wind speed, which means that even a small variation of the wind speed can lead to a significant increase of the energy budget of a particular region (Gunturu and Schlosser, 2012). This parameter can be also considered to be more suitable for the assessment of the wind turbine performances since this can take into account some atmospheric components, such as the air density. This is subsequently related to the temperature and the pressure, which are variable for a specific height (Nawri et al., 2014).
Although at this moment in Europe, the ocean boundaries present more interest, since the wind conditions seem to be in general more energetic there, possible benefits can be obtained also from the inland basins such as the Mediterranean and the Black seas (Onea and Rusu, 2014a; 2014b; Shata and Hanitsch, 2006), or from the Caspian Sea (Kerimov et al., 2013, Onea et al., 2015; Rahmanov et al., 2014; Rusu and Onea, 2014), which is relatively close to this geographic region.
Finally, we can also highlight that the novelty of the present work, is mainly related to the assessment of the performances of some state of the art wind turbines considering the particular wind conditions from the Black and the Caspian seas, and also the diurnal/nocturnal variations.
Materials and methods
The target areas
Figure 1 presents the two targeted areas and the locations of the reference points considered. These are equally distributed along the two coastal environments targeted, all of them being located in water depths below 50 m. The A-group points (A1–A12) were considered in the Black Sea, being defined by the following geographical landmarks: A1, Razim Lake (RO); A3, Sevastopol (UA); A5, Novorossiysk region (RU); A7, Poti city (GE); A9, Bafra city (TR) and A11, Kefken city (TR). For the Caspian Sea, the reference points (B1–B12) were selected in the vicinity of: B1, Izberbash city (RU); B3, Volga Delta (RU); B5, Bautino port (KZ); B7, Bekdash city (TM); B9, Chalus city (IR) and B11, Yenikand city (AZ).
The spatial distribution of the reference points corresponding to: (a) the Black Sea, (b) the Caspian Sea.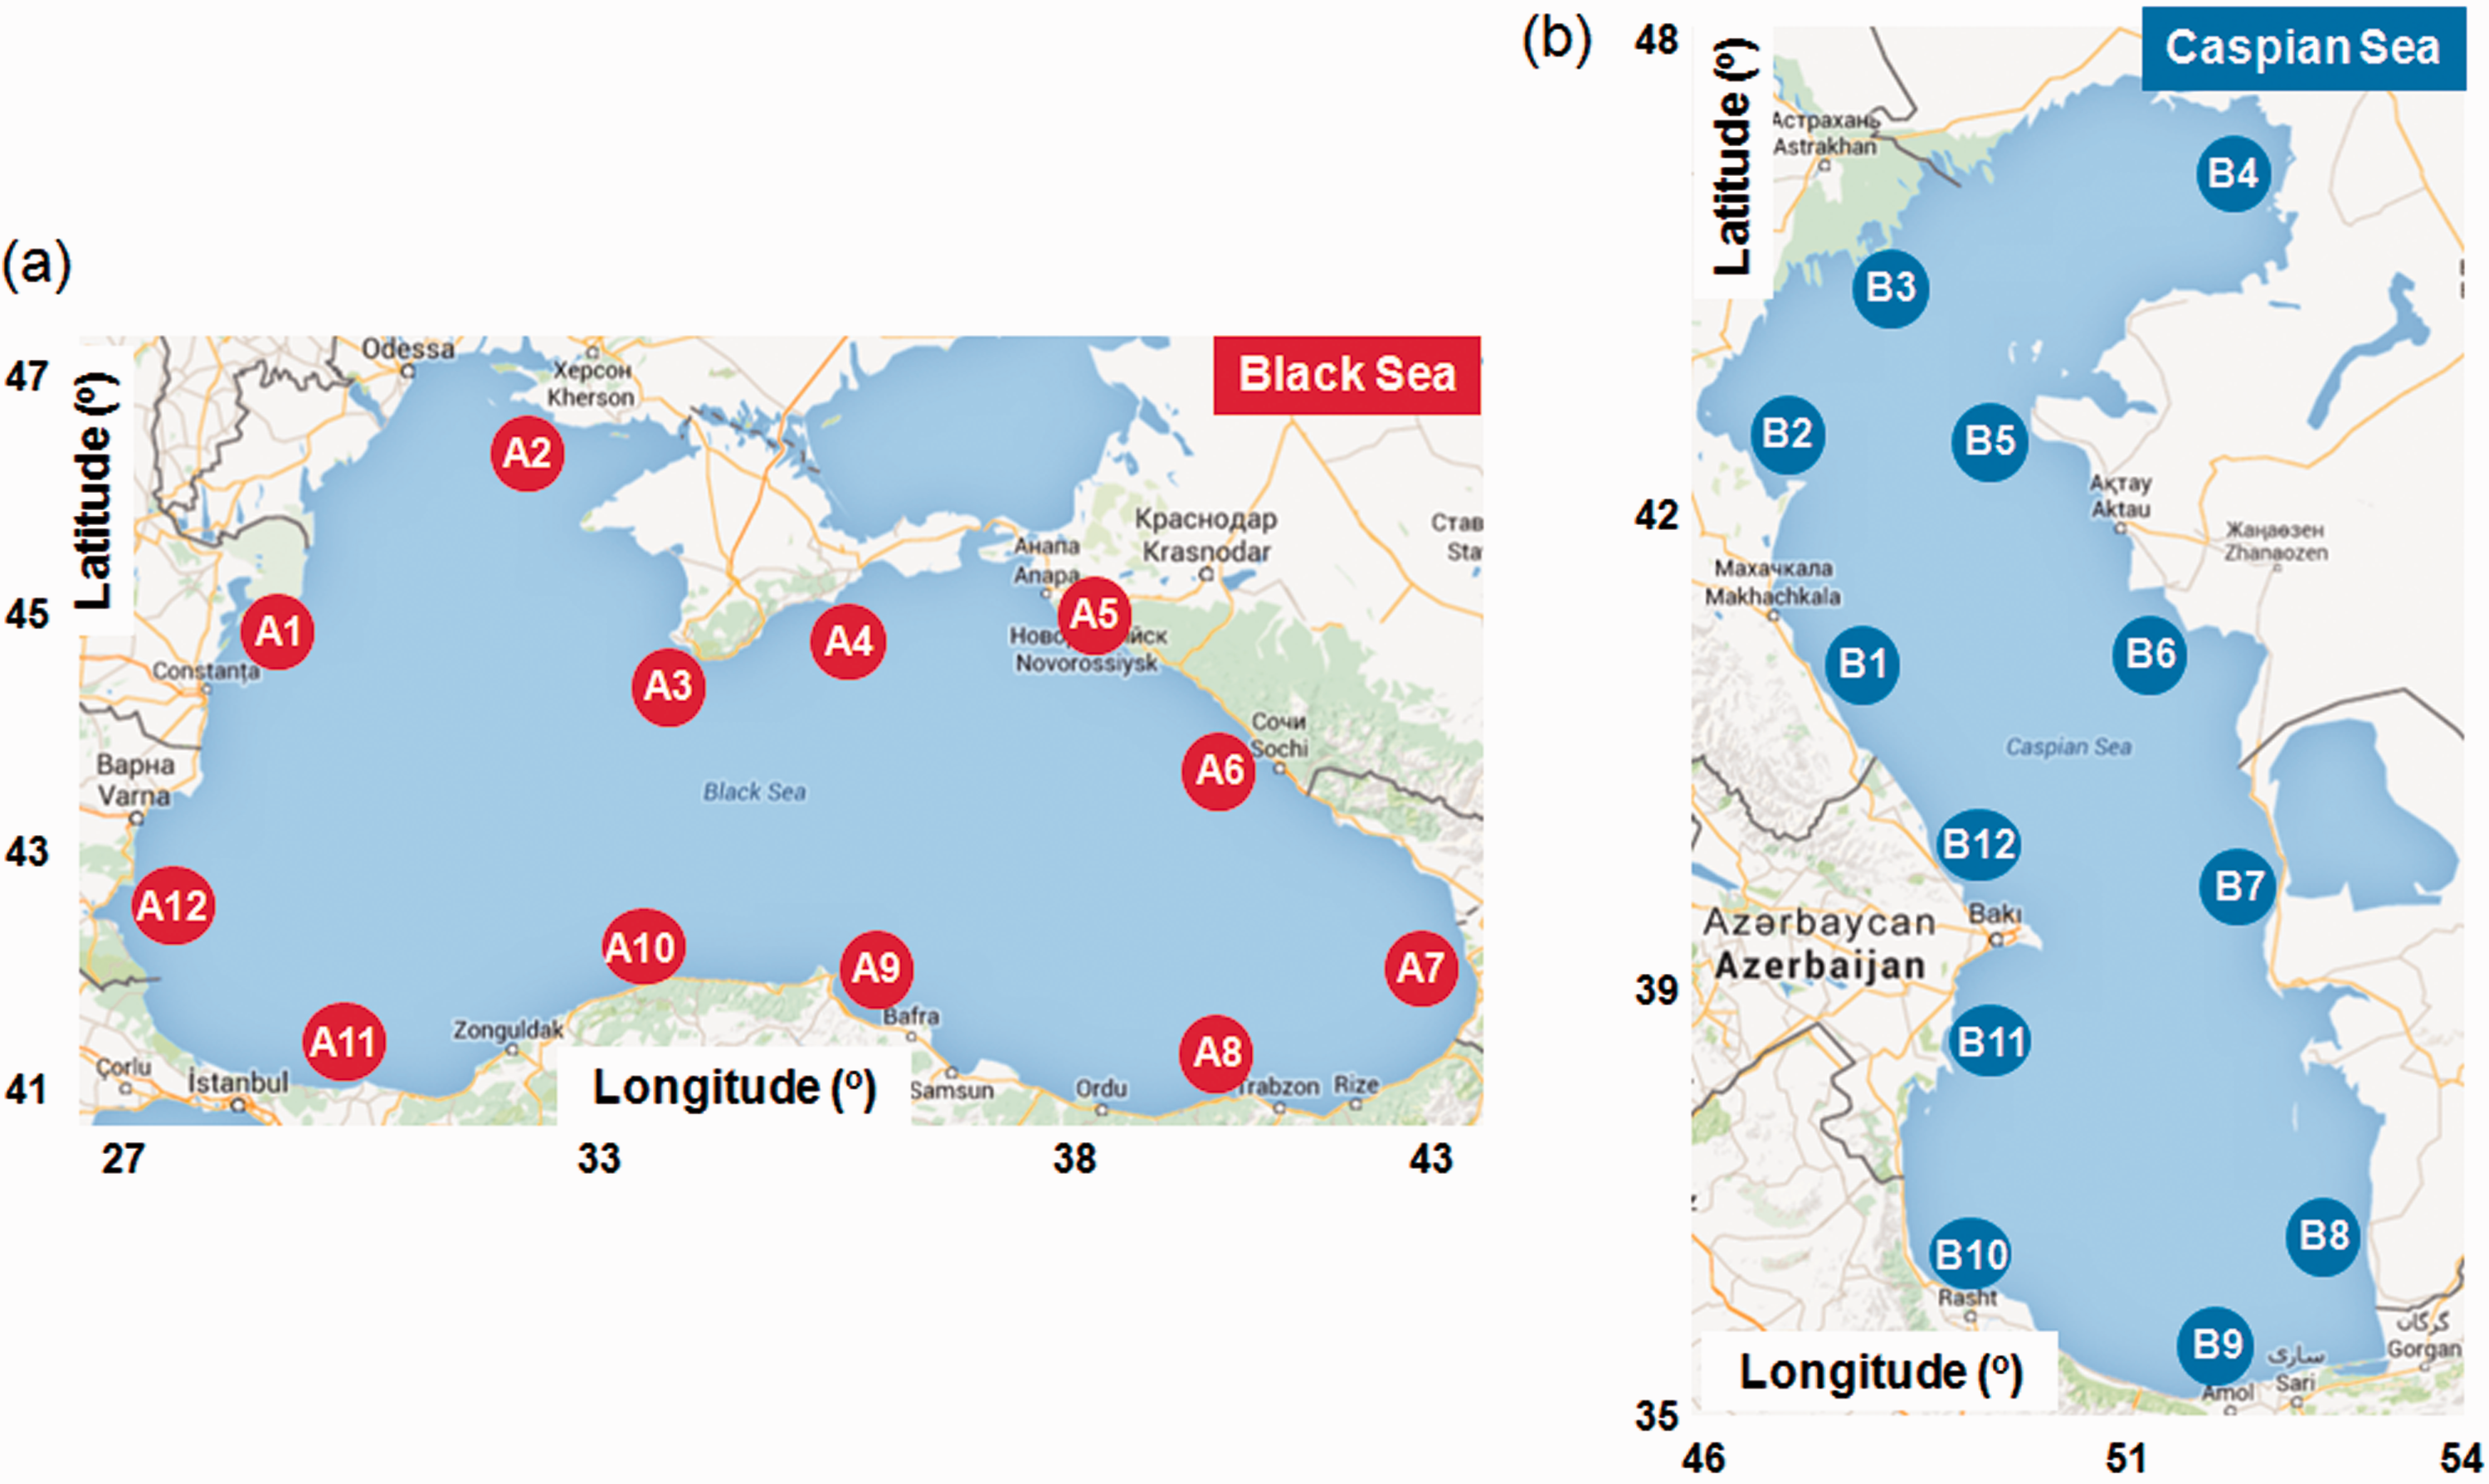
As regards the bathymetric features, we can mention that the northwestern part of the Black Sea is characterized by a shelf area with shallow water regions, while in the Caspian Sea the coastal environment in the north has very large areas with depths below 20 m.
The NCEP/CFSR dataset
The NCEP/CFSR (National Centers for Environmental Prediction/Climate Forecast System Reanalysis—further denoted as NCEP) is a reanalysis dataset designed for climate studies and is available for the time interval 1979–2010. In this project, several atmospheric parameters (ex: sea ice, snow, temperature, etc.) were evaluated, among them being also included the wind conditions in the marine areas (at a height of 10 m). In order to provide an accurate image of the wind speed, at a global scale and with a good temporal coverage (24 data per day corresponding to 1 h—time step) several input sources of data were taken into account (Saha et al., 2010). The first database included in the NCEP project (in 1979) comes from a geostationary satellite imagery (METEOSAT, OES, and GMS missions), which are processed as derived atmospheric motion vectors. Corresponding to the time interval 1993–1997, the SSM/I (Ocean Surface Wind Speed) was assimilated. This provided microwave imager data, from which observations regarding the ocean wind speed were extracted. Starting with 1997, the SSM/I brightness temperature data were processed throughout a neuronal network algorithm in order to obtain the wind speed characteristics (Krasnopolsky et al., 1995). The scatterometer instruments represent another important source of data, from which can be mentioned: ERS-1/AMI (since 1991), ERS-2/AMI (1996), ERS-1 and ERS-2 (1991–2007), QuikSCAT SeaWinds (2001–2009), and NRL WindSat (2008).
Thus, the accuracy of the NCEP wind data was significantly improved in time. In the present work, a 12-year time interval (1998–2009) was analyzed, processing daily four values corresponding to 00–06–12–18 UTC. The winter time is considered here to be the period between October and March (6 months), while the diurnal/nocturnal intervals were structured as follows: (a) Diurnal (denoted with D) →12–18 UTC; (b) Nocturnal (N) →00–06 UTC.
Methods
Taking into account that most of the offshore wind turbines operate at a height of about 80 m above the sea level (ASL), the initial NCEP data (reported at 10 m) were adjusted by considering the classical logarithmic law (Carvalho et al., 2014)


Finally, the performances of a wind generator can be estimated as follows

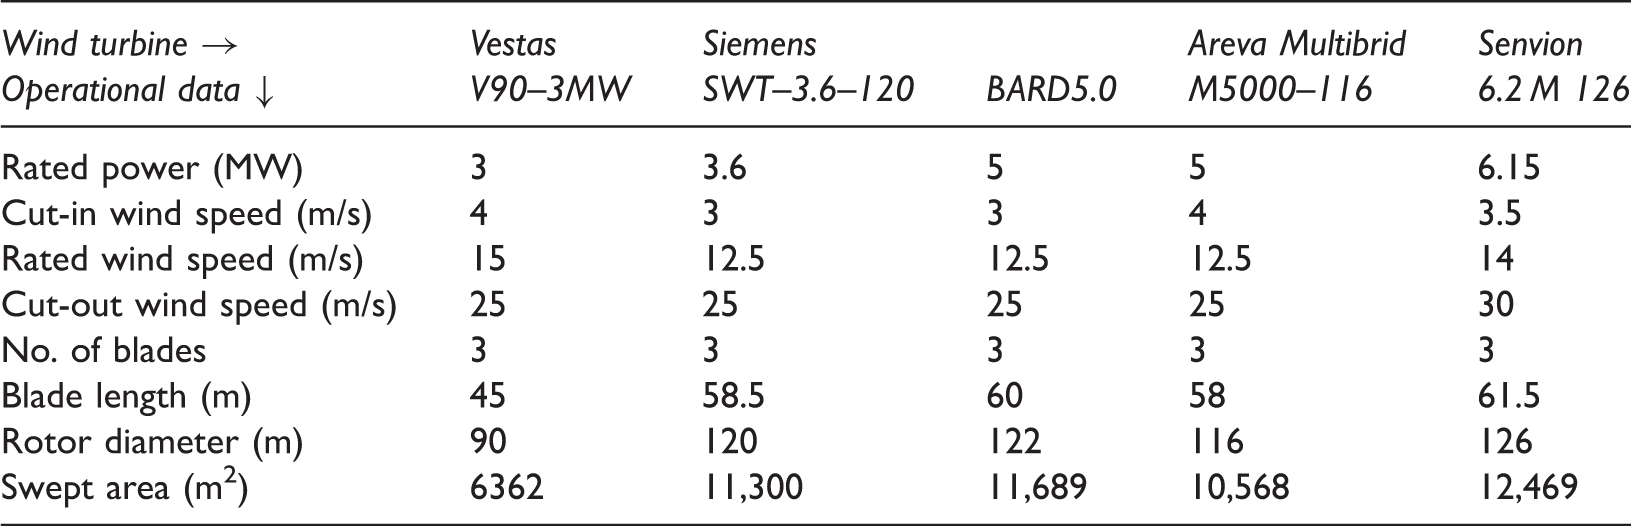
Main characteristics of the wind turbines considered.
Results
Evaluation of the WPD
Figure 2 illustrates the diurnal/nocturnal distributions of the parameter WPD corresponding to the time interval 1998–2009. The distribution of the mean values is presented in Figure 2(a) for all the reference points, where can be observed that the group points A1–A6 presents higher values. On the other hand, the points A10–A12 present more significant diurnal values. The group points A1–A6 have during the nocturnal interval values in the range 572–343 W/m2, compared to the diurnal values that are in the interval 511–323 W/m2, more energetic conditions corresponding to the points A1, A2, and A5. In this category, it can be also included the point A3 which, unlike the point A6, presents more consistent values during the diurnal and the nocturnal periods. The points A7–A12, located in the southern part of the sea do not exceed 215 W/m2, more important values being registered near the point A10, while the point A9 with a maximum WPD value of 16 W/m2 can be considered to be the least energetic. The monthly variation of the parameter WPD between the diurnal and the nocturnal intervals is presented in Figure 2(b) for the most energetic points, where the values located below zero indicate that the nocturnal values are considerably higher than the diurnal. At a first analysis, we can notice that the negative variations are significantly higher, indicating a maximum of 128 W/m2 during the period August–September for the point A2, while the positive values correspond to the point A3 indicating a maximum WPD value of 46 W/m2 during March. The point A1 presents smaller fluctuations during the interval April–July, compared with A2, which presents maximum variations during the summer time. Excluding the winter months, we can notice that the points A3 and A5 present a constant distribution of the variation around the zero value, a fact which could be considered as a positive aspect related to the performances of any wind turbine.
Diurnal/nocturnal distribution of the parameter WPD as estimated for the Black Sea (80 m). The results are based on the NCEP data (1998–2009), where: (a) mean values at the points A1–A12; (b) monthly variations of the diurnal/nocturnal values (for the reference points A1, A2, A3, and A5).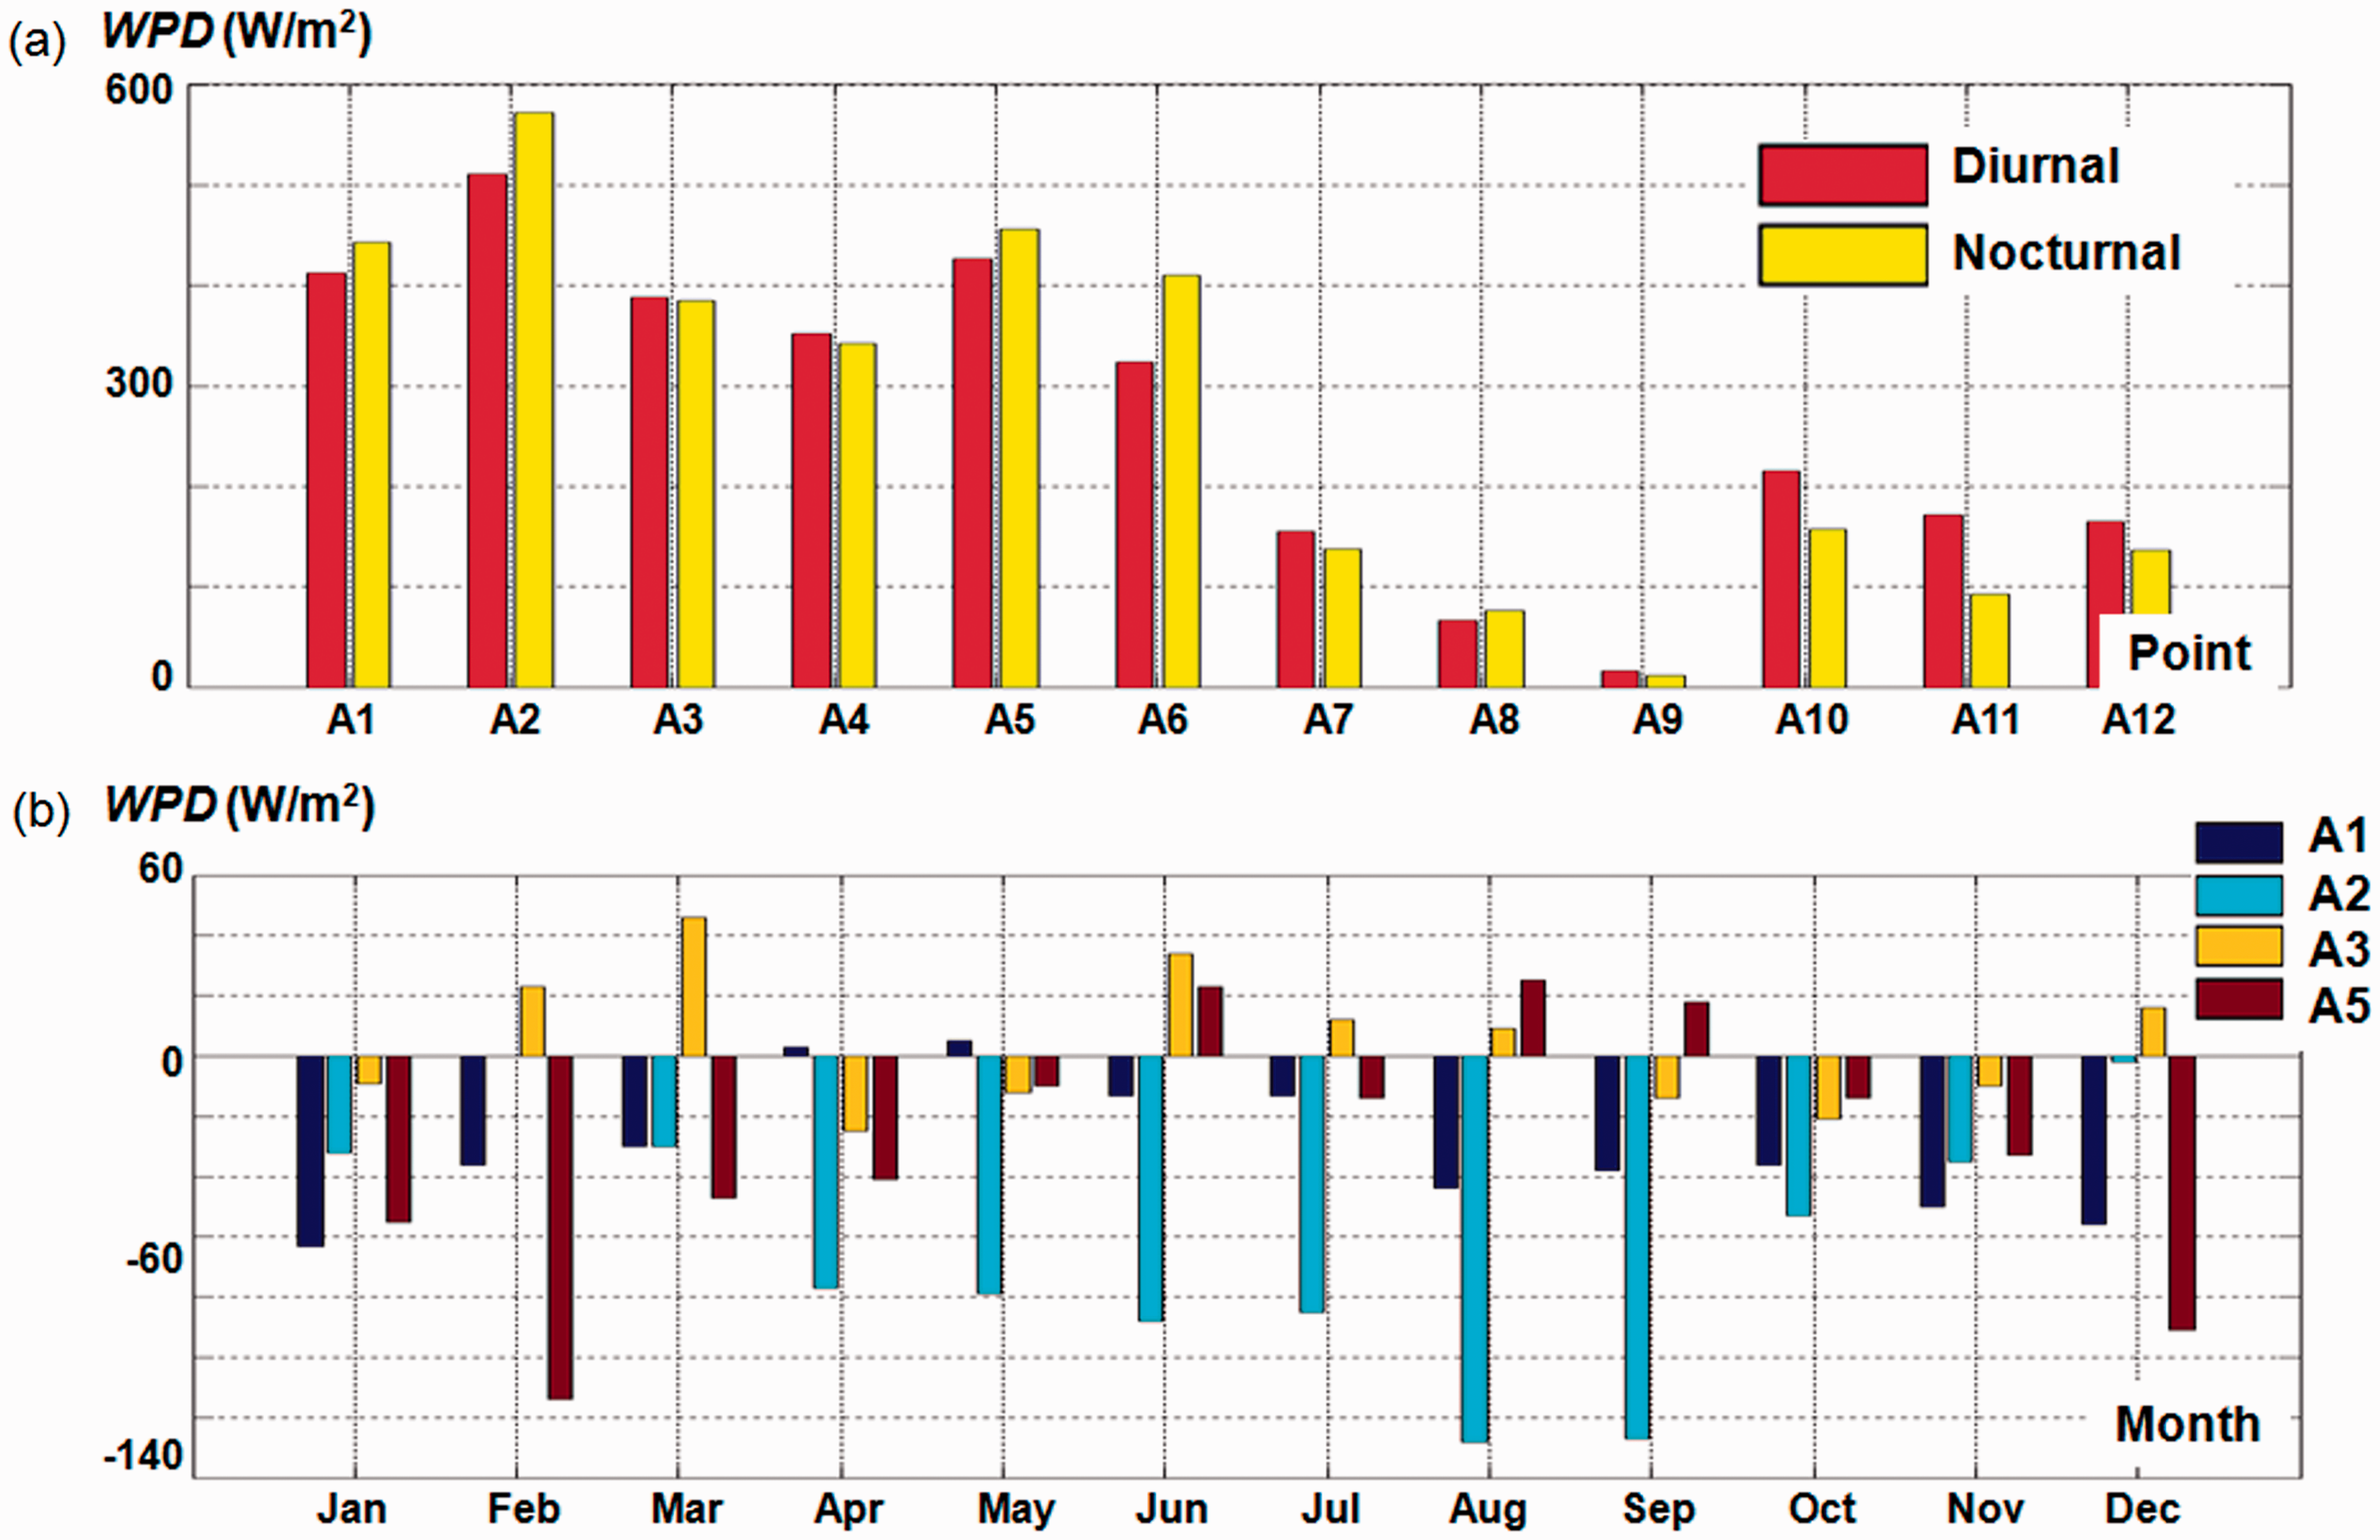
A similar analysis is presented in Figure 3 corresponding to the environment of the Caspian Sea, considering the same time interval. In this case, the points B2–B8, located in the northern and eastern part of the region, seem to present more energetic features, especially in the case of the point B6. This indicates a maximum WPD value of 556 W/m2 during the nocturnal time. The point B1 and the group points B9–B12 present values in the range 22–141 W/m2, more energetic peaks being registered by B11 and B12 during the diurnal time. In this case, we can notice that the points B3–B6 present more important conditions from the entire basin. Therefore, in Figure 3(b) the monthly fluctuations of the diurnal/nocturnal conditions is evaluated in more detail. Compared to the Black Sea, which seems to have an aleatory distribution of the wind conditions influenced by the nocturnal conditions, in this case it seems that the wind conditions present a monthly wind pattern. During the interval February–April, the nocturnal conditions are more important presenting a maximum WPD value of 136 W/m2 for the point B6, being followed by a smooth transition to the interval May-July when the diurnal conditions are dominant with a WPD maximum value of 100 W/m2. The cyclic pattern is highlighted by the interval September-December, when more significant differences occur in the points B5 and B6 (220 W/m2), at the end of this period the variations gradually decreasing to a zero value, as can be observed in the case of January.
Diurnal/nocturnal distribution of the parameter WPD, as estimated for the Caspian Sea (80 m). The results are based on the NCEP data (1998–2009), where: (a) mean values corresponding to the points B1–B12; (b) monthly variation of the diurnal-nocturnal values (for the reference points B3, B4, B5, and B6).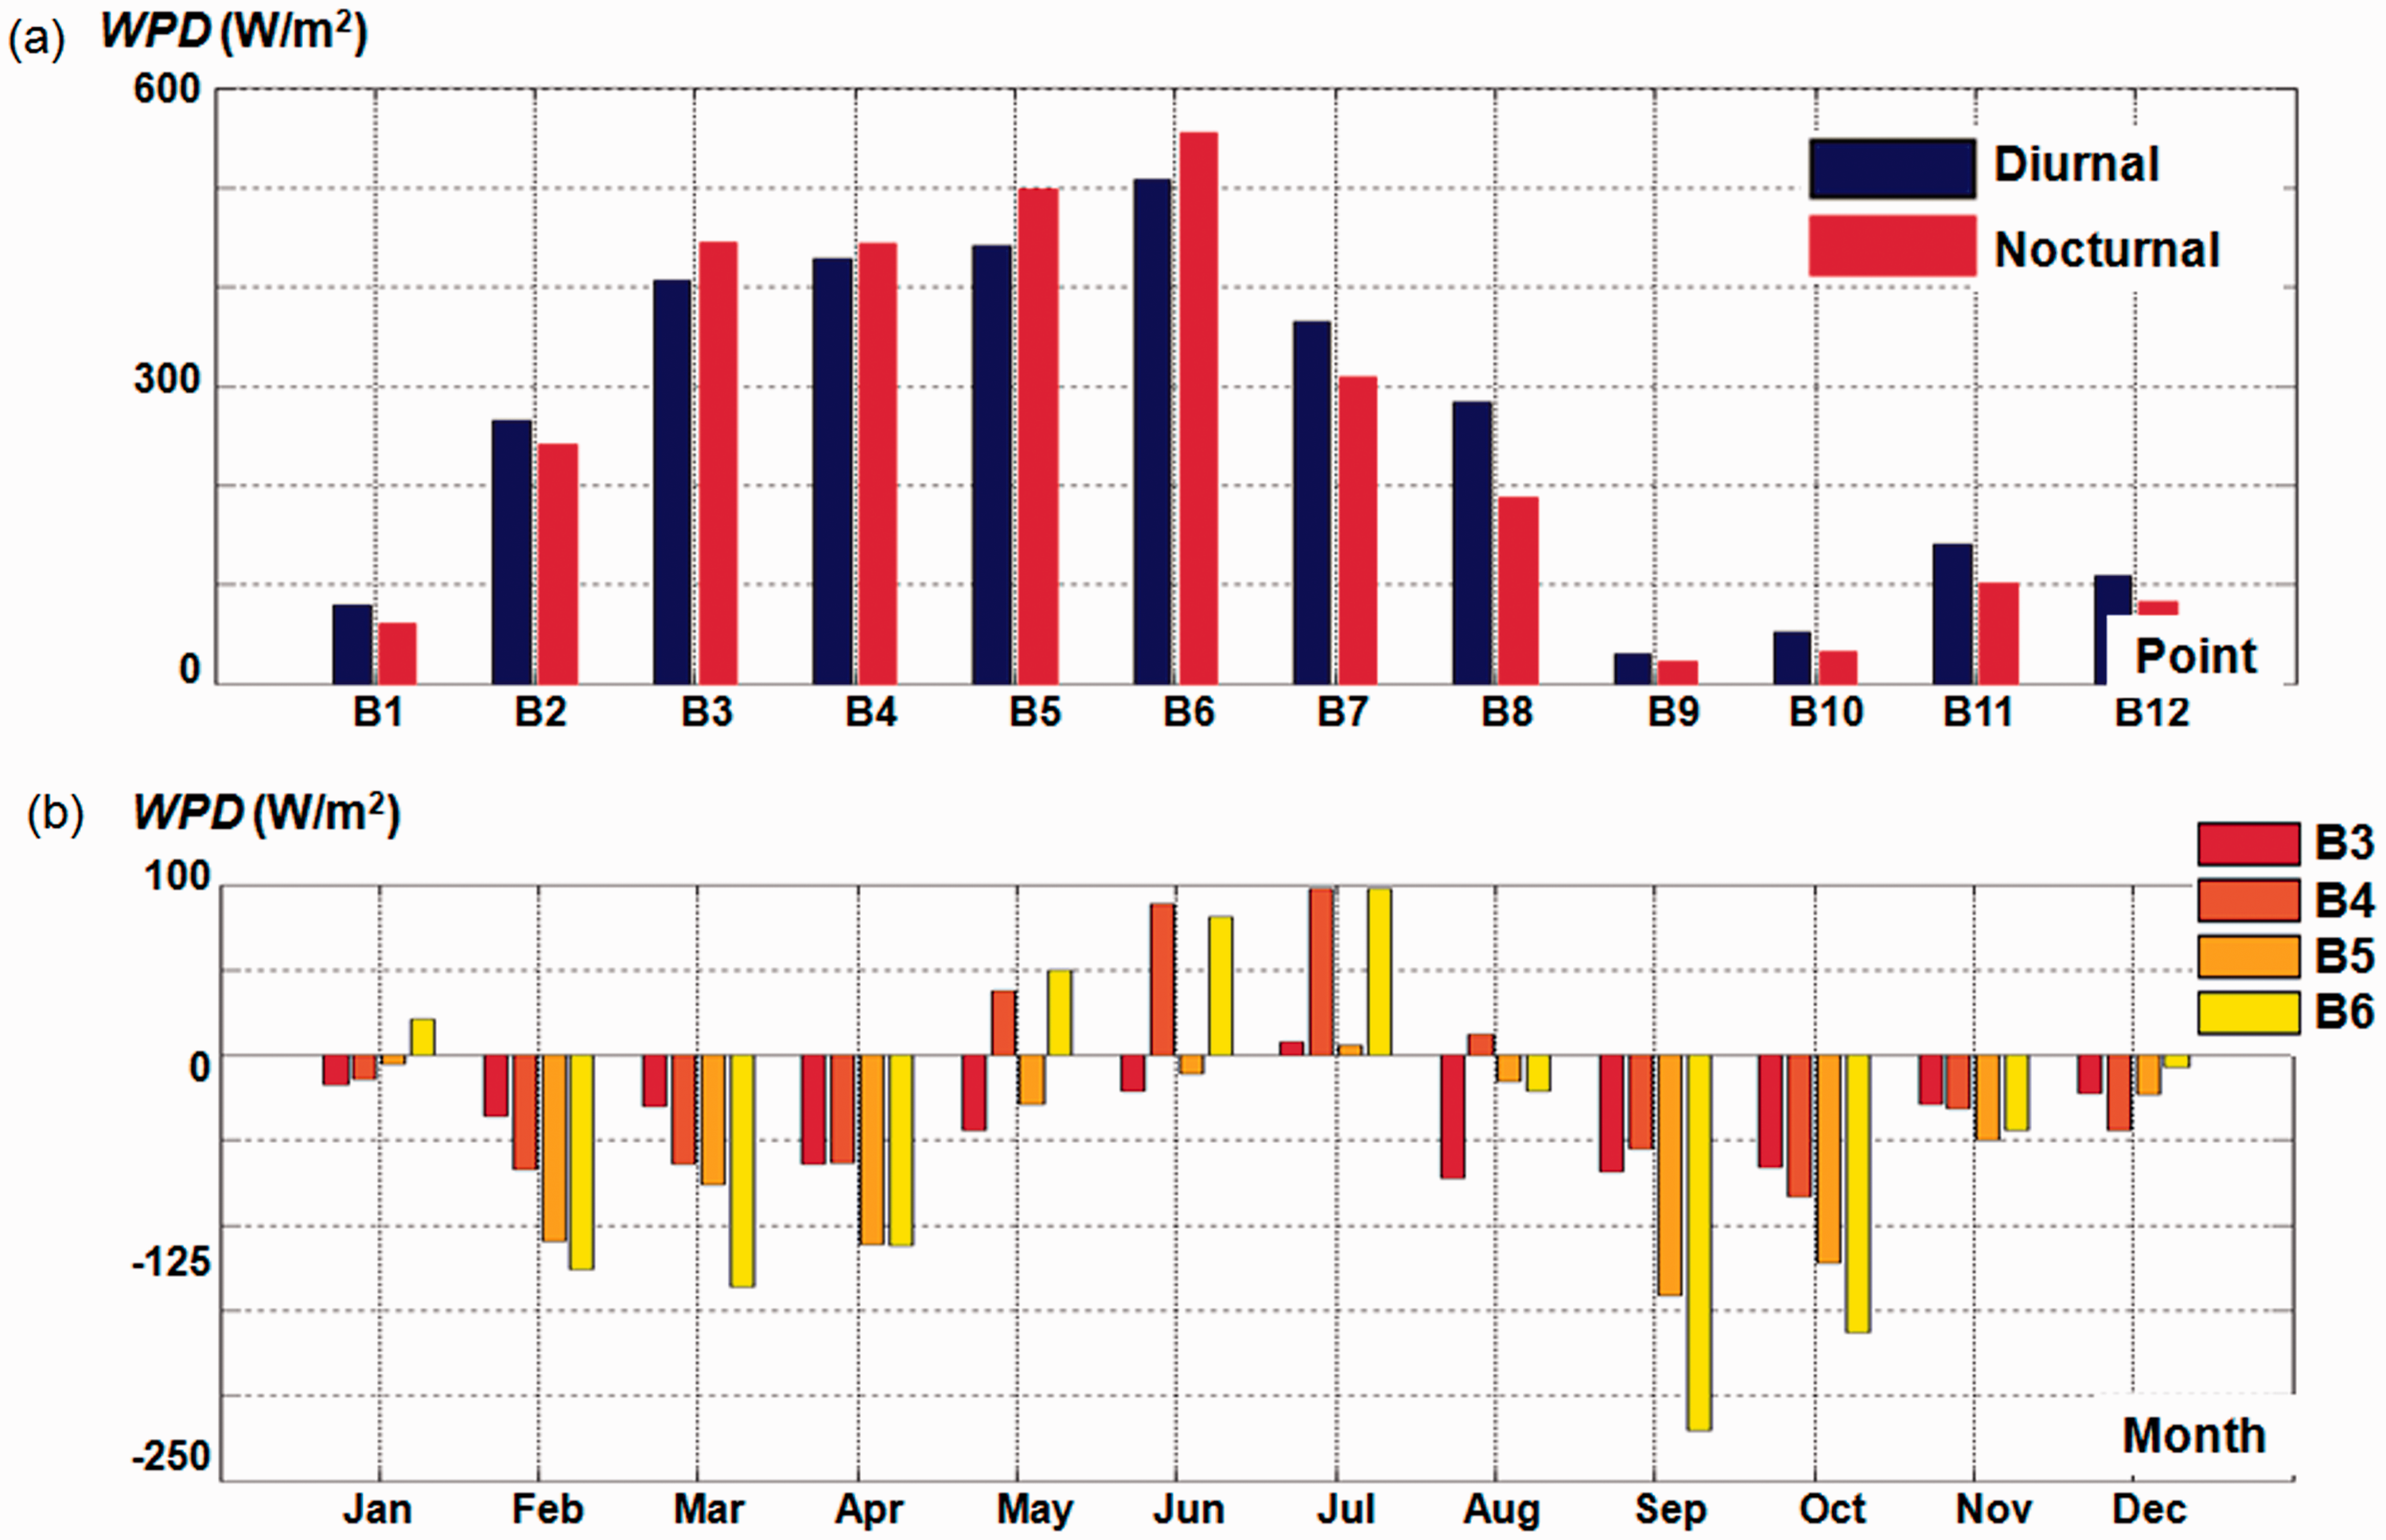
Statistical evaluation of the WPD, corresponding to TT and to WT, respectively.
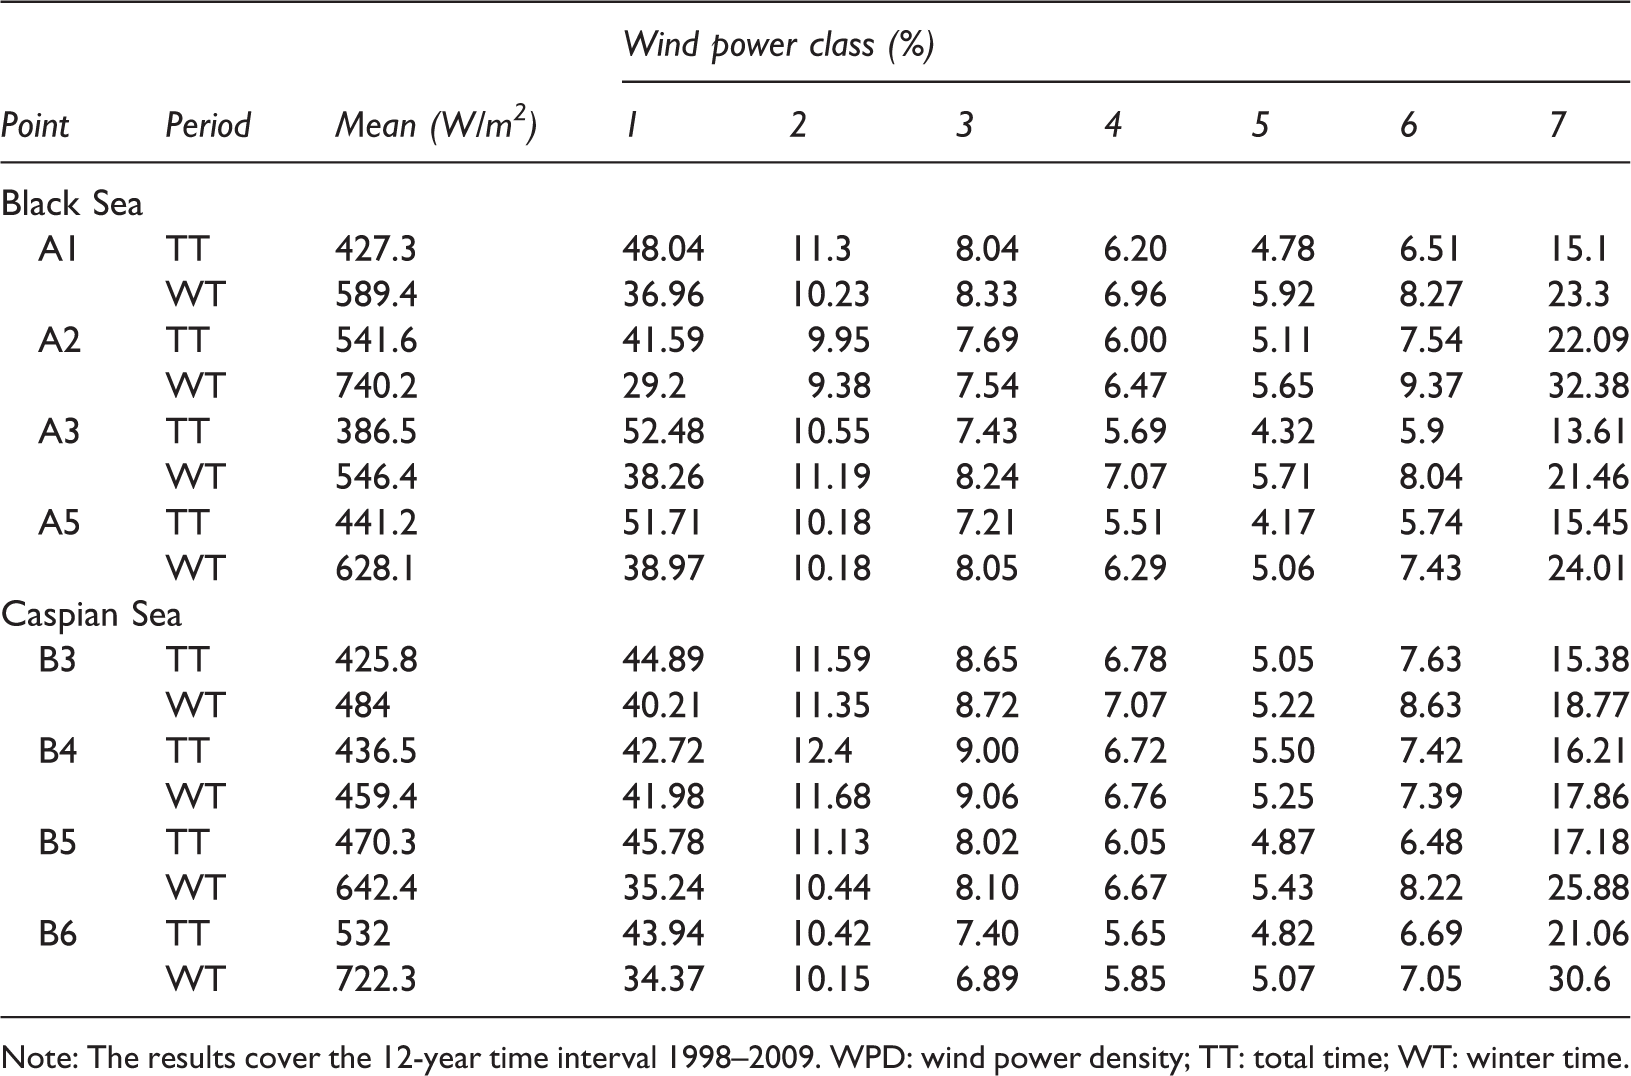
Note: The results cover the 12-year time interval 1998–2009. WPD: wind power density; TT: total time; WT: winter time.
The wind energy potential of a particular location can be classified throughout a wind power scale expressed in percentages, which is divided in seven classes (from Class 1 to Class 7), the first being considered to be the least energetic (Archer and Jacobson, 2003). They are related to the wind speed and WPD as follows: Class 1 <5.9 m/s (126 W/m2), Class 2→5.9–6.9 m/s, Class 3→6.9–7.5 m/s, Class 4→7.5–8.1 m/s, Class 5→8.1–8.6 m/s, Class 6→8.6–9.4 m/s, and Class 7 >9.4 m/s (510 W/m2). These distributions are also presented in Table 2, from which we can notice that the values in the classes 3–7 tend to increase during the winter time. For the total time, Class 1 seems to be the most representative, presenting a maximum of 52.5% for A3, compared to 46% corresponding to the point B5. Class 5, which is considered to be “excellent” in terms of the wind energy, presents values in the range 4.17–5.92% for the A-points with lower values for A5, while the B-points present a minimum of 4.87% (total time) in B5 and B6. Class 7 presents a consistent percentage, especially during the winter time and in the vicinity of the points A2 and B6, where values close to 31% are noticed.
The WPD directional distribution is illustrated in Figure 4 in terms of the diurnal and the nocturnal evolutions, considering some reference points from the two target areas. In the case of the Black Sea, we can notice that during the diurnal interval the point A4 indicates the northeast and southwest directions as dominant, compared to the point A8, where the western and southern sectors represent about 10% of the total distribution. The nocturnal conditions corresponding to the point A4 present a distribution of the northeast values located close to 15%, mostly coming from the southwest sector, which this time may reach a lower limit of 5%. As regards the point A8, these variations are not so severe, indicating the southern sector as dominant (22%) and also an increase of the wind conditions in the interval 130–450 W/m2. Going now to the Caspian Sea, the point B11 indicates the southeastern direction as dominant reaching in this case a maximum 20%, with the mention that during the nocturnal time these conditions illustrate clearer the above mentioned pattern. Regarding the point B11, we can notice that during the diurnal time most of the values are coming from the eastern sector, with a peak for the southeast direction, while during the nocturnal time these conditions are shifted to the northern sector, which corresponds in fact to the shoreline orientation.
WPD roses (diurnal/nocturnal) designed for some selected reference points from: (a) the Black Sea (points A4 and A8), (b) the Caspian Sea (points B2 and B11). The results correspond to the 12-year time interval (1998–2009), where the circle centers correspond to a value of 5% (from total WPD) and the exterior circles to a value of 20%.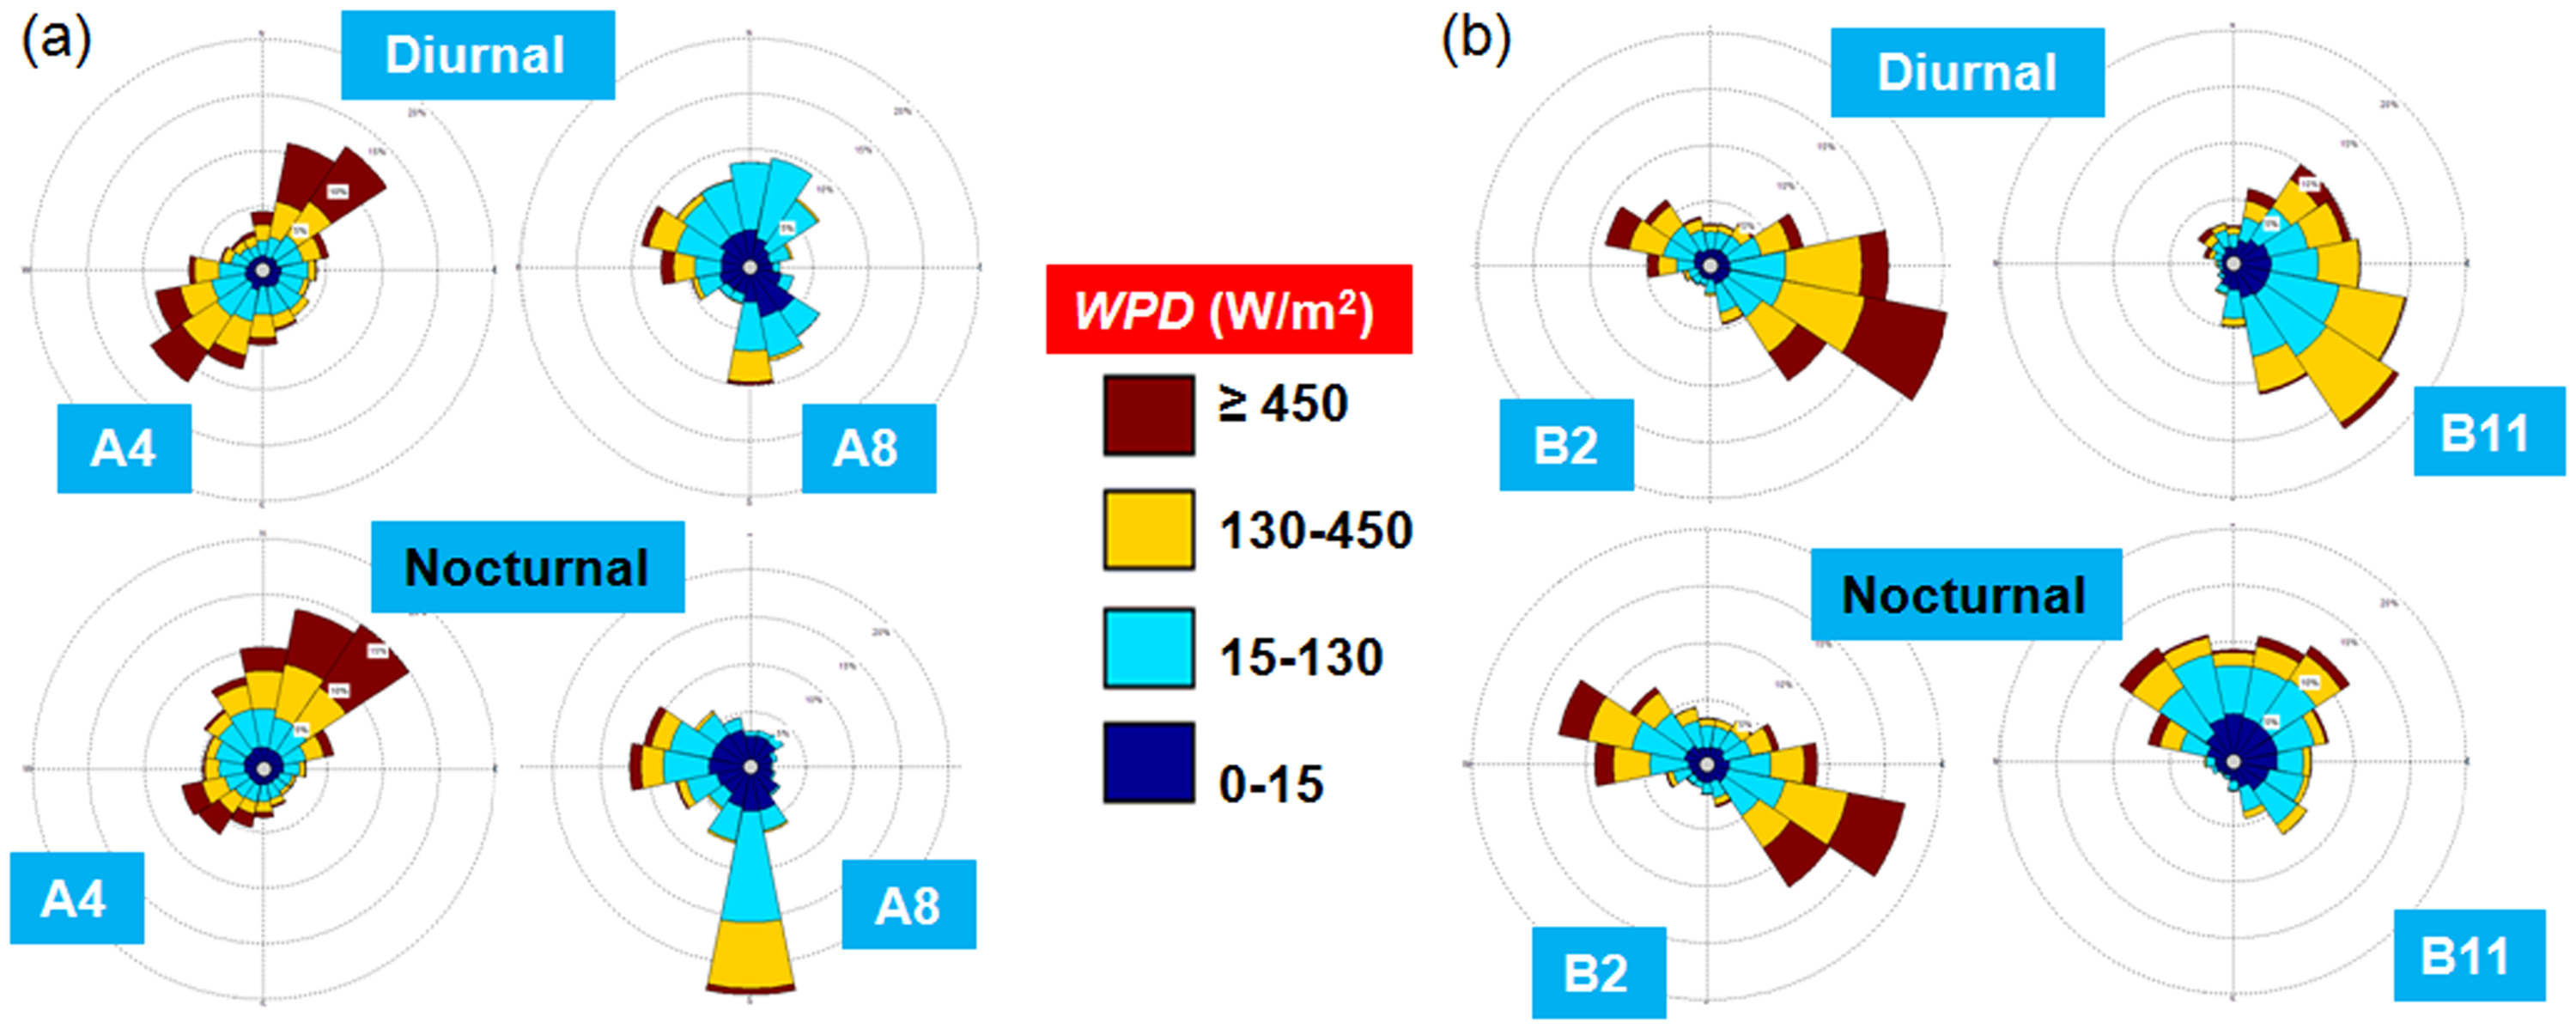
Assessment of the wind turbines performances
Figure 5 illustrates the performances of the turbines considered (as listed in Table 1) in terms of their power output, evaluated only for some reference points from the two areas targeted, which present more relevant wind potential. In order to compute this parameter, the wind conditions below the cut-in values (indicated in Table 1) were not taken into account, while the values higher than the cut-out limit were also removed from the analysis. In order to design a real scenario, the wind conditions between the rated wind speed and the cut-out interval, were considered to be equal to the rated value, since above this limit the turbine will have similar performances.
The power output (MW) of the wind turbines considered based on the data corresponding to the 12-year time interval (1998–2009), for: (a, c) the Black Sea and (b, d) the Caspian Sea. The results were structured according to the total winter time or to the diurnal–nocturnal intervals, in these last cases considering only the total time data.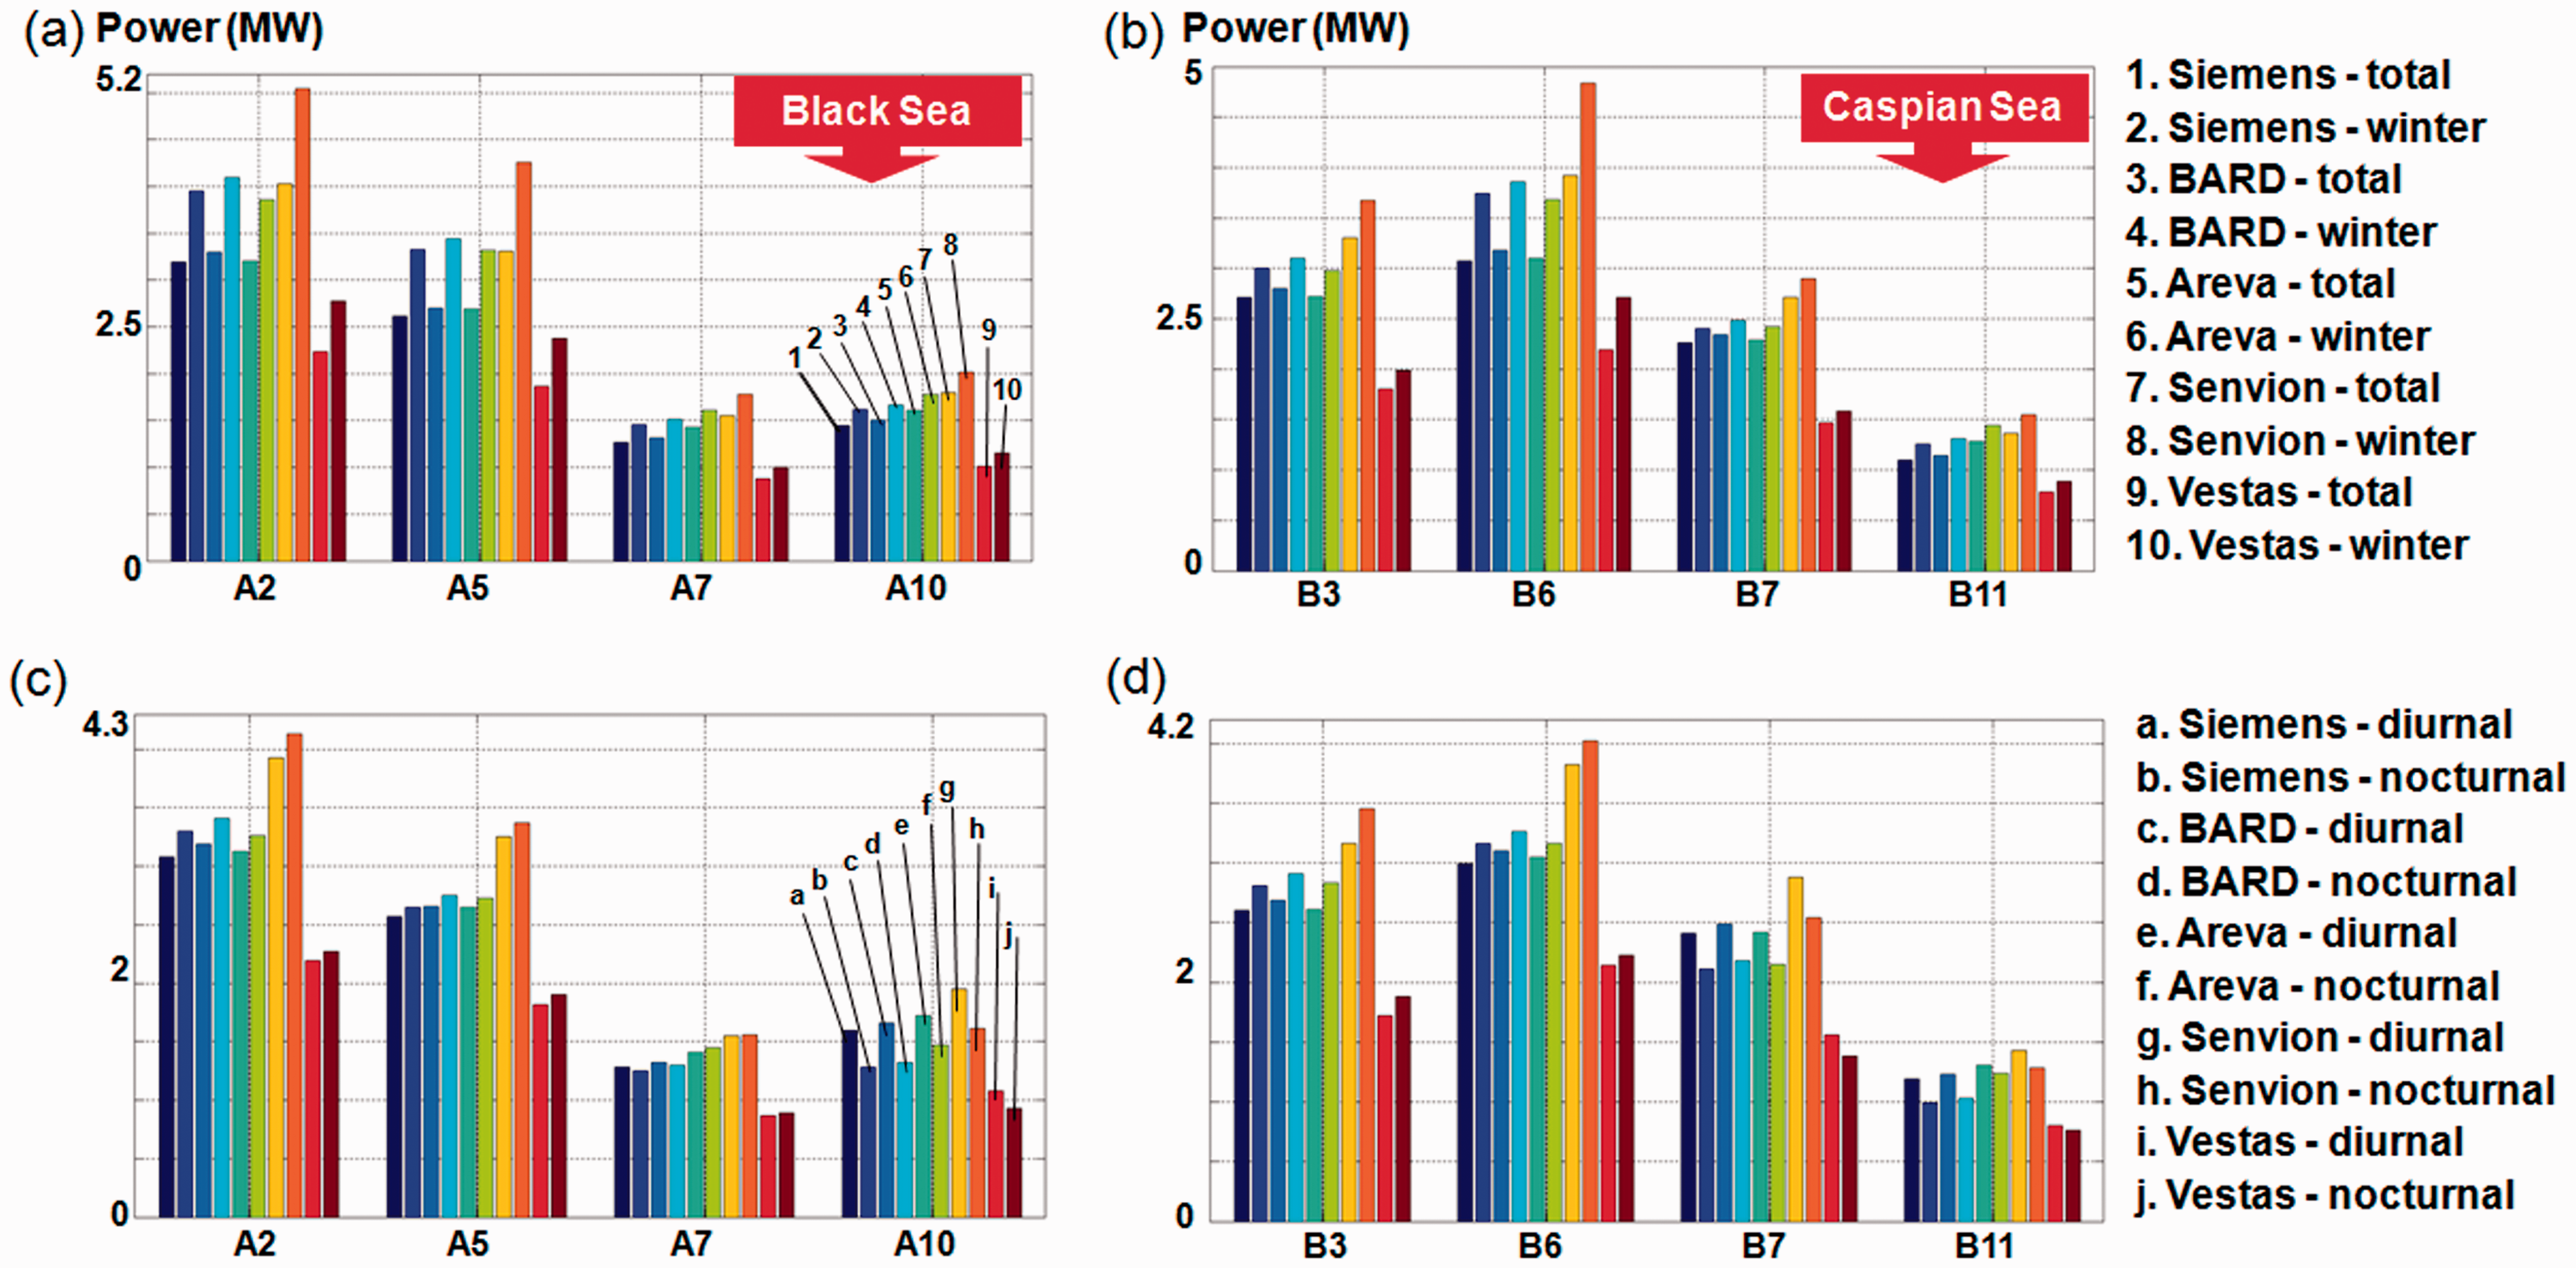
In order to provide a complete picture of the wind conditions from a regional perspective, the reference points corresponding to each target area were divided into four sectors defined by their geographical area, as follows: A1–A3/B1–B3 (northwest); A4–A6/B4–B6 (northeast); A7–A9/B7–B9 (southeast), and A10–A12/B10–B12 (southwest). The evaluations of the wind turbines were carried out only for the reference points which present a more relevant energy potential, as indicated by the results presented in (Figures 2 and 3).
As expected, the performances of the turbines are closely related to the wind conditions, as it can be noticed in Figure 5(a) related to the Black Sea area. In this area, the Senvion system reports during the winter time some energetic peaks for the point A2 with 5.04 MW and A5 with 4.26 MW, respectively. Excepting the system Senvion, during the total time the selected turbines present for the point A2 values in the range 2.23–3.3 MW, while during the winter these values can increase to a maximum of 4.09 MW for the BARD system. For the point A7, the values do not exceed 1.8 and 1 MW for the Vestas generator, while in the case of the point A10 a maximum of 2.02 MW is accounted by the Senvion system compared to a minimum of 0.88 MW accounted by Vestas.
Regarding the Caspian Sea (from Figure 5(b)), it can be mentioned that the Senvion system appears to be the most productive turbine, especially in the vicinity of the point B6, when it can be registered an expected power output of 3.92 MW during the total time and a maximum of 4.84 MW in the winter. This can be considered to be an expected result, since this generator is defined by a maximum rated power of 6.15 MW. Reported to the point B3, the systems: Siemens, BARD, and Areva present values in the range 2.6–3 MW, while the Vestas turbine does not exceed 2 MW, not even during the winter time. The point B11 is characterized by smaller variations of the power, between total and winter time, presenting values in the interval 0.76–1.55 MW. In Figure 5(c), the performances of the turbines during the diurnal/nocturnal intervals in the Black Sea area were evaluated. Based on these results, it can be mentioned that the points A2 and A5 indicate the nocturnal conditions as being more energetic. For the point A7, there are no significant variations, while for the point A10 the diurnal wind presents this time a significant value. By analyzing these results, a higher variation is encountered at the point A10, as follows: Siemens—0.32 MW, BARD—0.34 MW, Areva—0.25 MW, Senvion—0.34 MW, and Vestas—0.15 MW. Some other important variations can be observed at the point A2: Siemens and BARD—0.22 MW, Areva—0.13 MW, Senvion—0.2 MW, and Vestas—0.08 MW. For the point A5, a maximum difference of 0.12 MW is reported by the Senvion system. The diurnal/nocturnal variations of the Caspian points are illustrated in Figure 5(d), where it can be observed that the points B3 and B6 indicate the nocturnal wind as being more important, while for the points B7 and B11 a reverse trend it is noticed. For the points B3 and B6, the Senvion system indicates the maximum differences of 0.29 and 0.2 MW, for the point B7 the same turbine presents a variation of 0.34 MW, while for B11 the Siemens and BARD systems have a value of 0.2 MW.
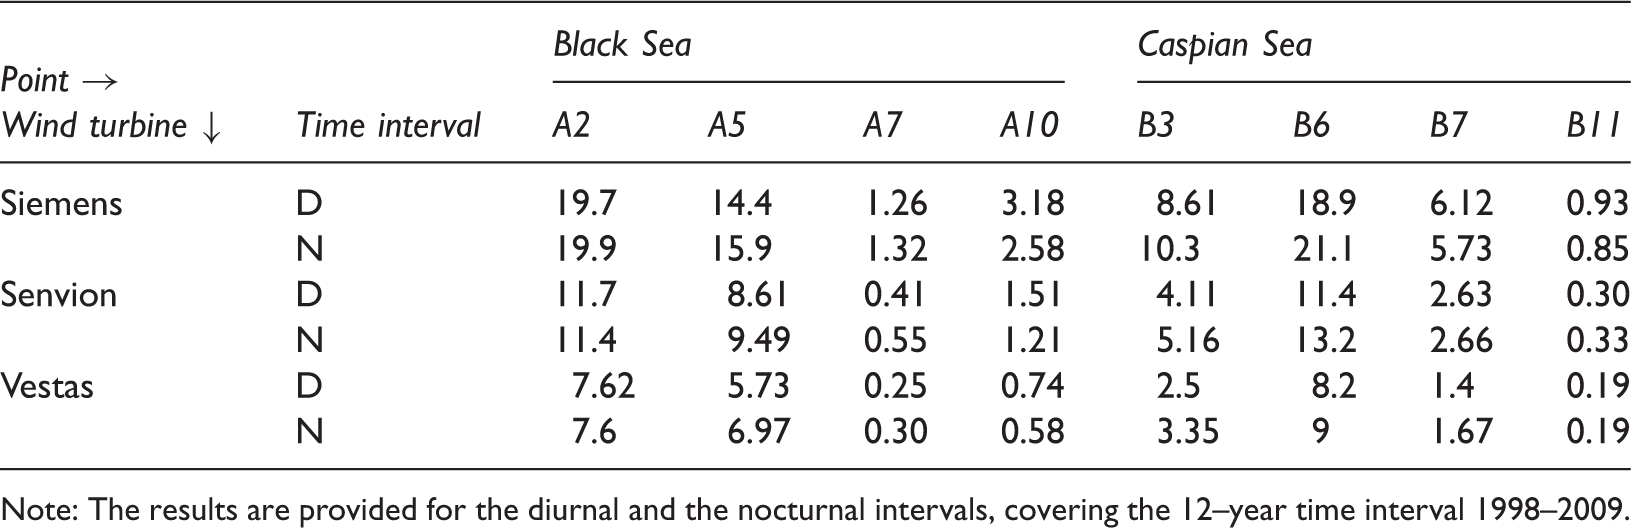
Main performances of the wind turbines considered in terms of average power output (MW) for the winter season.
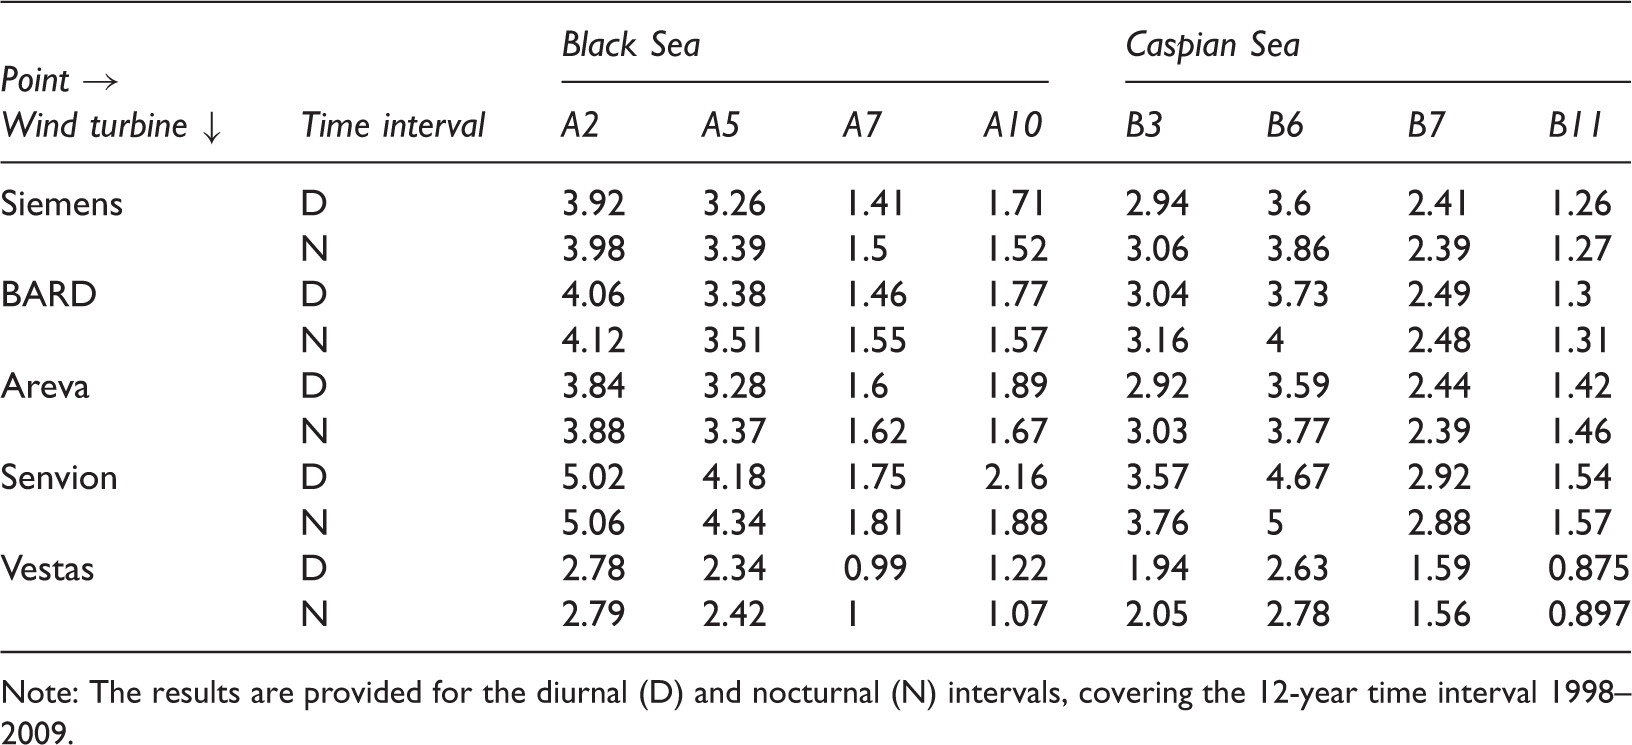
Note: The results are provided for the diurnal (D) and nocturnal (N) intervals, covering the 12-year time interval 1998–2009.
Another parameter, which could be considered, is the rated capacity index (in %). This is used to assess the time period for which the turbine will run on a full capacity, being based on the percentage of the wind speed distribution located between the rated wind speed and the cut-out value. Such an analysis is presented in Figure 6, where only the Siemens, Senvion and Vestas generators were taken into account. The BARD and Areva wind turbines were not represented, since they have similar rated wind/cut-out values with the Siemens turbine. The rated capacity of the Black Sea points is illustrated in Figure 6(a) considering the total and winter time periods, where it can be observed that the points A7 and A10 present values below 3%. Much higher values are expected during the winter time, when the wind turbines have the following performances: Siemens 19.8% (A2) and 15.2% (A5), Senvion 11.6% (A2) and 9.05 (A5), and Vestas 7.61% (A2) and 6.35% (A5). Regarding the differences between the total and the winter time, a maximum variation of 7% can be noticed at the Siemens system for the point A2, while a minimum of 0.27% is accounted by the Vestas turbine for the point A7. Regarding the Caspian Sea (Figure 6(b)), it can be mentioned that the best performances correspond to the Siemens system, which can operate in B6 at full capacity for a maximum of 20% of the winter time. In general, the point B6 is characterized by higher values, the wind turbines having percentages in the ranges: Siemens → (0.47–12.9%)/(0.89–20%) – (total/winter time); Senvion → (0.18–7.45%)/(0.31–12.3%) and Vestas → (0.1–4.96%)/(0.19–8.6%).
The rated capacity (%) of the wind turbines, based on the data corresponding to the 12-year time interval (1998–2009), for: (a, c) the Black Sea and (b, d) the Caspian Sea. The results were structured according to the total winter time or to the diurnal/nocturnal interval, in these last cases considering only the total time data.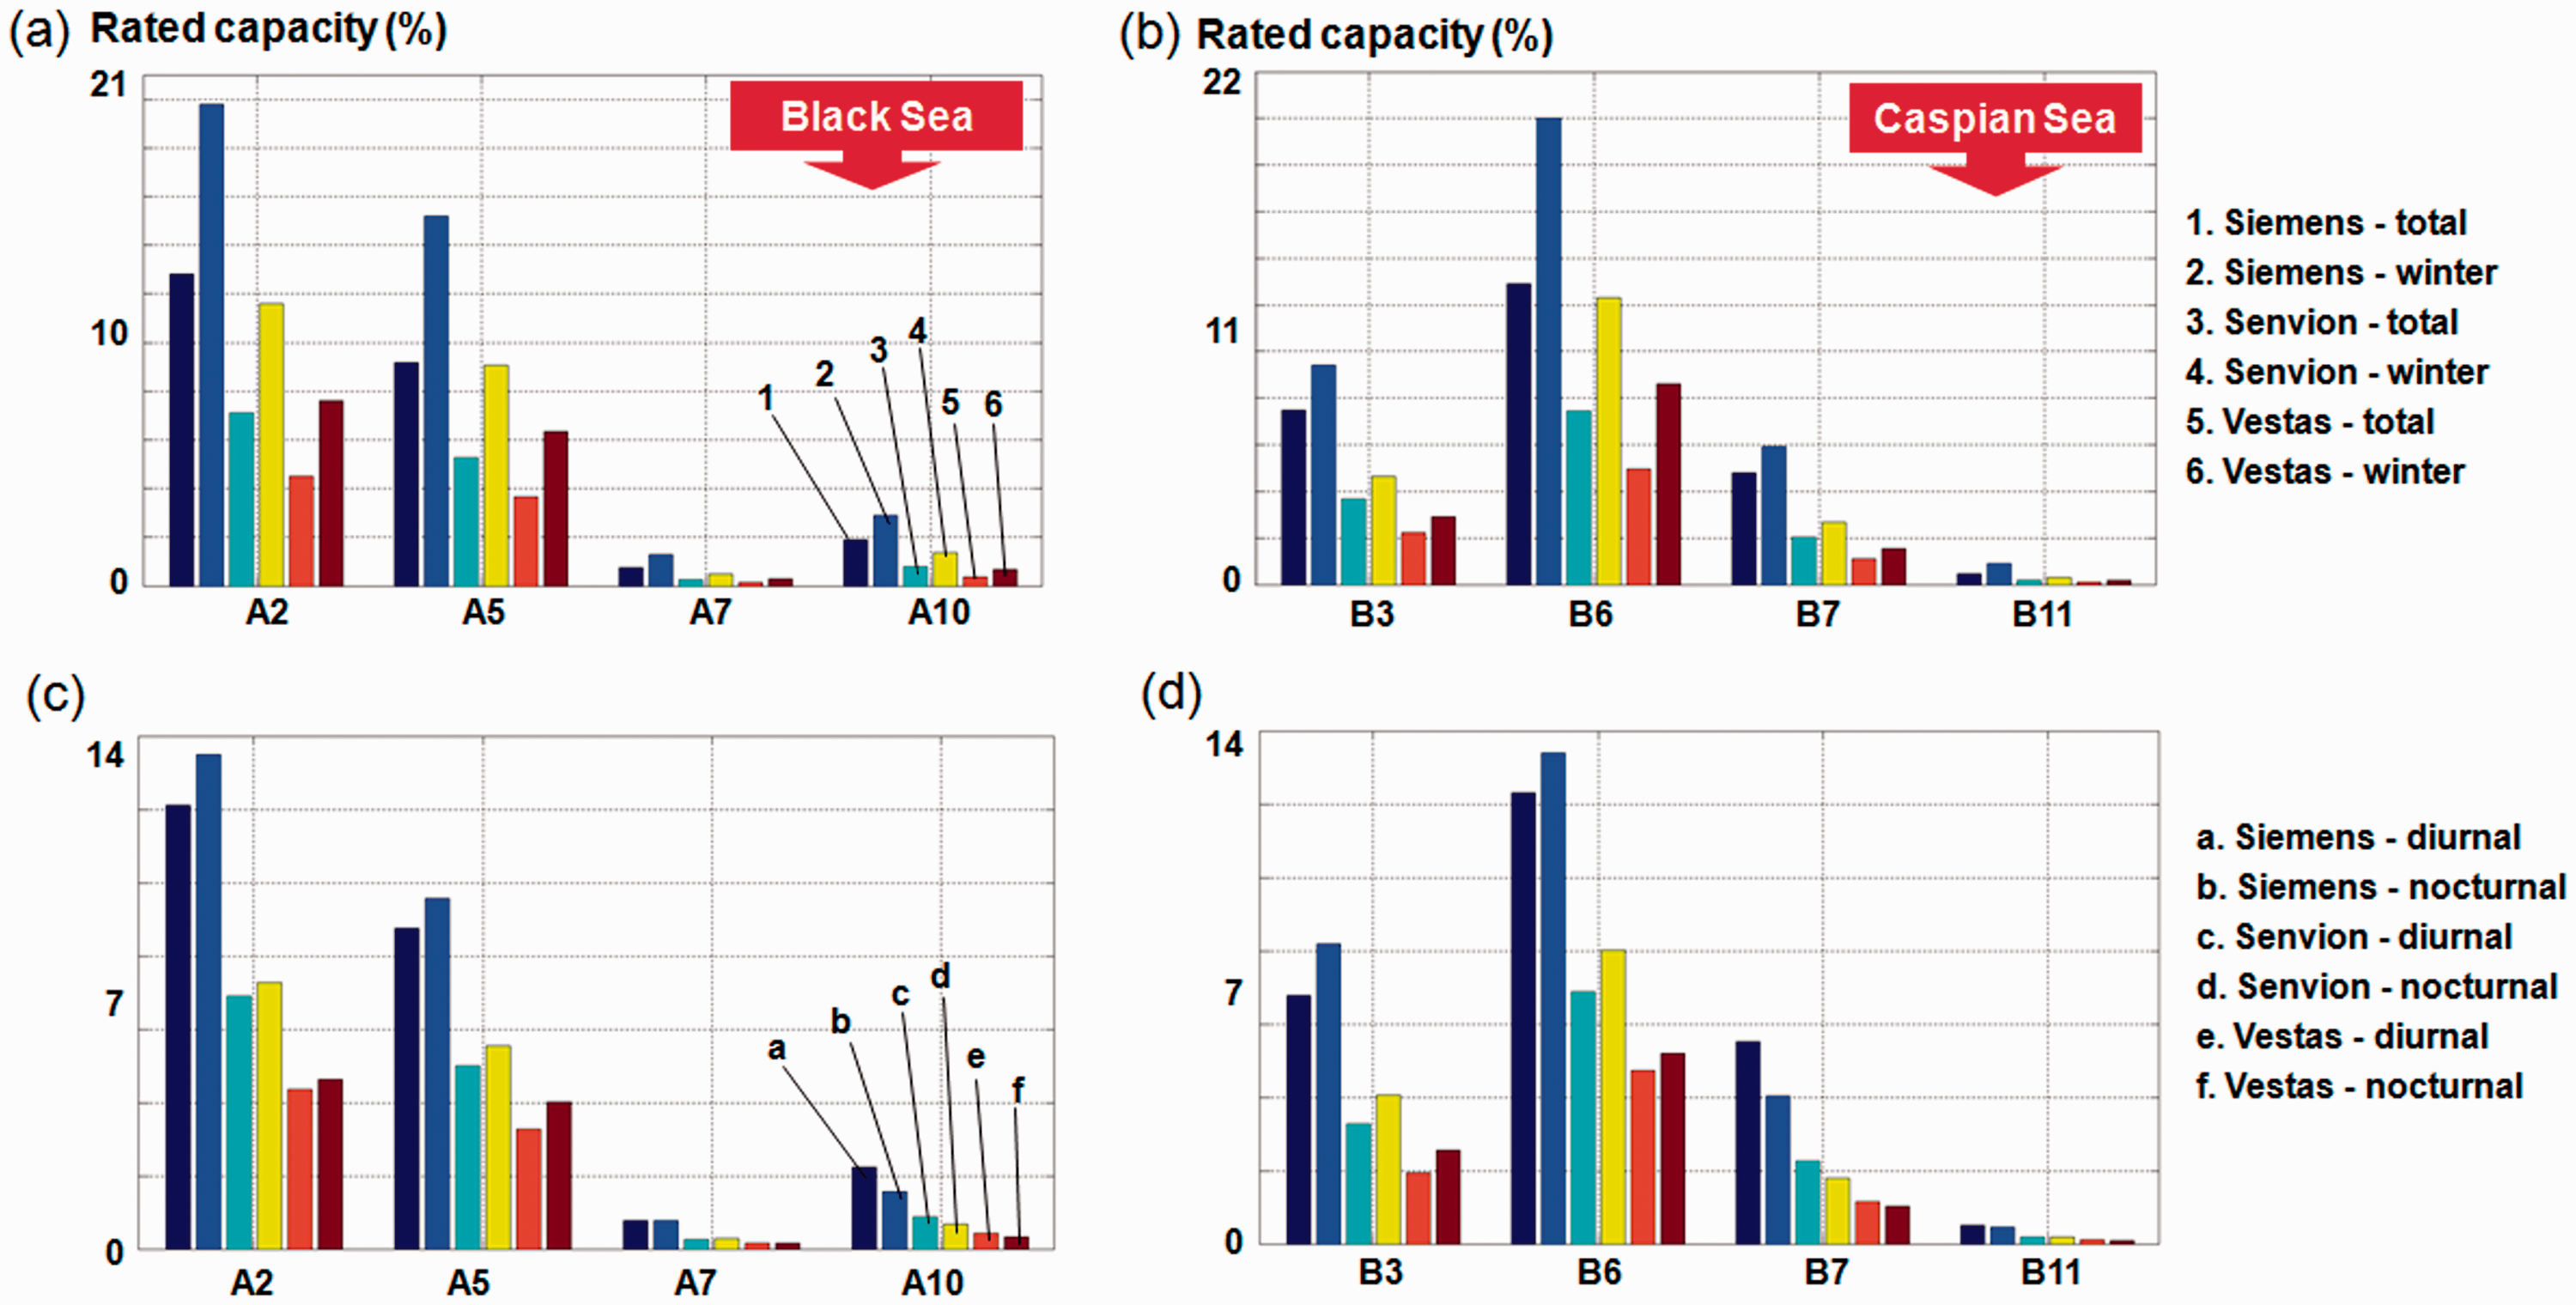
Regarding the diurnal/nocturnal distributions, the points from the Black Sea (Figure 6(c)) present higher values of the diurnal conditions in the vicinity of the points A2 and A5, located in the northern part of the basin. It is estimated that the Siemens turbine will operate at a maximum of 13.5% (in A2) and 7.3% (in A5), while for the points A7 and A10 the selected turbines do not exceed 1.6%, not even during the winter time. The Senvion turbine presents a maximum of 7.3% in A2, while the Vestas system indicates a value of 4.6% for the same point and a maximum of 4% for A5. A similar analysis is performed in Figure 6(d) for the Caspian Sea, where a similar trend is observed, in the sense that the Siemens turbine is more productive, while on an opposite side is the Vestas turbine. The diurnal values are more consistent at the point B7, indicating a maximum of 5.53% for the Siemens turbine and of 2.27% for the Senvion turbine. On the other hand, at the point B11 the diurnal/nocturnal variations are very small, the Siemens generator presenting a maximum difference of 0.05%.
Rated capacity (%) of the wind turbines, corresponding to the winter season.
Note: The results are provided for the diurnal and the nocturnal intervals, covering the 12–year time interval 1998–2009.
Discussion of the results
Based on the power output of each wind turbine and on the associated rated power, it is possible to identify the efficiency of each generator. This feature is associated with the capacity factor, being expressed as

Such an analysis is illustrated in Figure 7 for the two areas targeted, considering the total/winter period and also the diurnal/nocturnal intervals. In general, it can be noticed that the Siemens system is more efficient from this point of view. For example, when comparing Siemens with the Senvion turbine, which reports instead higher performances in terms of the power output (Figure 5). Regarding the Black Sea (Figure 7(a)), the wind turbines considered present during the winter time the following values: Siemens – (69.9%-61.8%-35.5%-36.5%) (A2-A5-A7-A10), BARD – (62.9%-54.4%-28.2%-29.8%), Areva – (62.9%-55.3%-30.6%-32.7%), Senvion – (60.5%-52.3%-27.1%-28.9%) and Vestas – (63%-55.4%-30.7%-32.7%). In the Caspian Sea (Figure 7(b)), more consistent values can be observed in the vicinity of the points B3, B6 and B7, while for the point B11 the capacity factor does not exceed 32%. During the total time, the wind turbines can register values in the ranges: Siemens – (55.6%-58.3%-49.5%-28%) (B3-B6-B7-B11), BARD – (51.5%-59.1%-43.1%-24.6%), Areva – (51.7%-59.6%-43.4%-27.4%), Senvion – (48.8%-57%-40.5%-23.9%) and Vestas – (51.8%-59.7%-43.5%-27.5%), respectively. The diurnal/nocturnal wind conditions in the Black Sea are illustrated in Figure 7(c), while a similar analysis is performed in Figure 7(d) for the Caspian Sea.
The capacity factor (%) of the wind turbines based on the data corresponding to the 12-year time interval (1998–2009) estimated for: (a, c) the Black Sea and (b, d) the Caspian Sea. The results were structured according to the total winter time or to the diurnal–nocturnal interval, in these last cases considering only the total time data.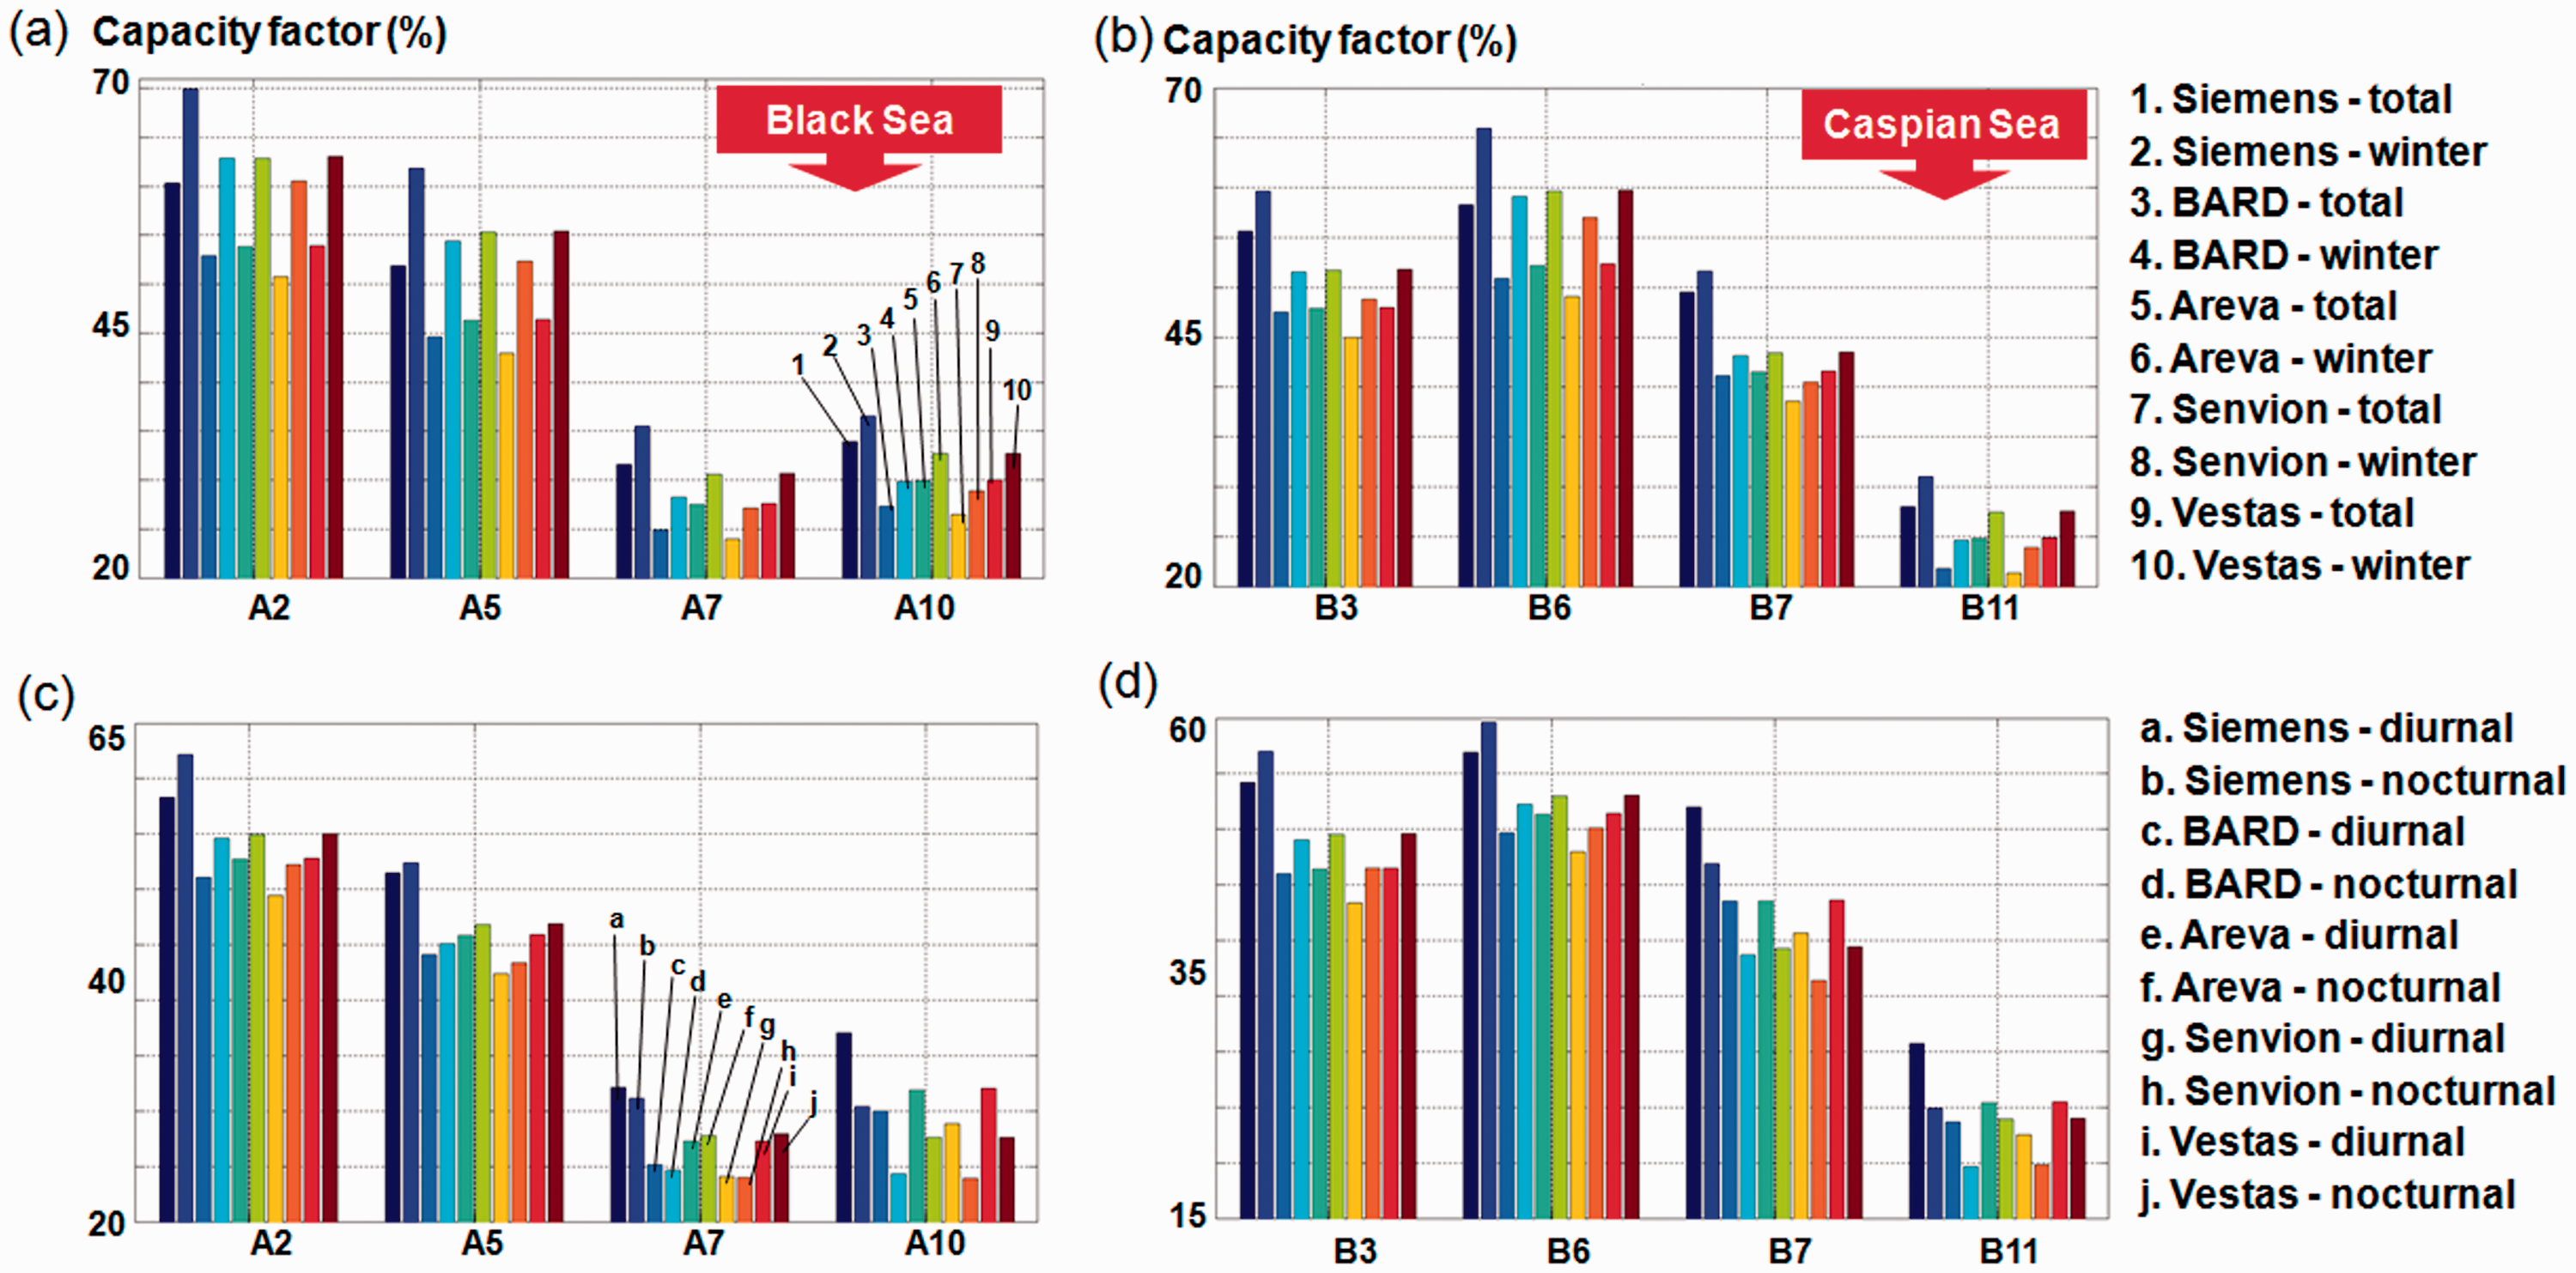
By analyzing a particular location (latitude and longitude) it is possible to identify some windy areas, but this will not establish in fact the wind potential over a large geographical region, which represents another objective of the present work. In order to provide an estimate, the data sets corresponding to the points from the NW, NE, SE, and SW sectors were grouped and considered for a further analysis. Such an analysis is performed in Figure 8(a) in the Black Sea area, where the monthly distribution of the parameter WPD (in terms of mean values) was represented. From the analysis of this distribution, we can notice that the northern sectors present more consistent conditions, which can reach maximum values in the range 558–707 W/m2 for the interval November–February. Compared, to these results, the southwest sector presents a maximum WPD of 241 W/m2 in February, while during the summer time the southern sectors do not exceed 140 W/m2. On an annual scale, the mean WPD values corresponding to each sector are: NW, 453 W/m2; NE, 386 W/m2; SE, 77 W/m2, and SW, 156 W/m2.
The regional distribution of the wind energy in the Black Sea, based on the data corresponding to the 12-year time interval (1998–2009), reported for the northwest (NW), northeast (NE), southeast (SE), and southwest (SW) sectors. Results structured in: (a) monthly variations, (b, c) WPD histogram (total winter) corresponding to the NW and SE sectors, respectively.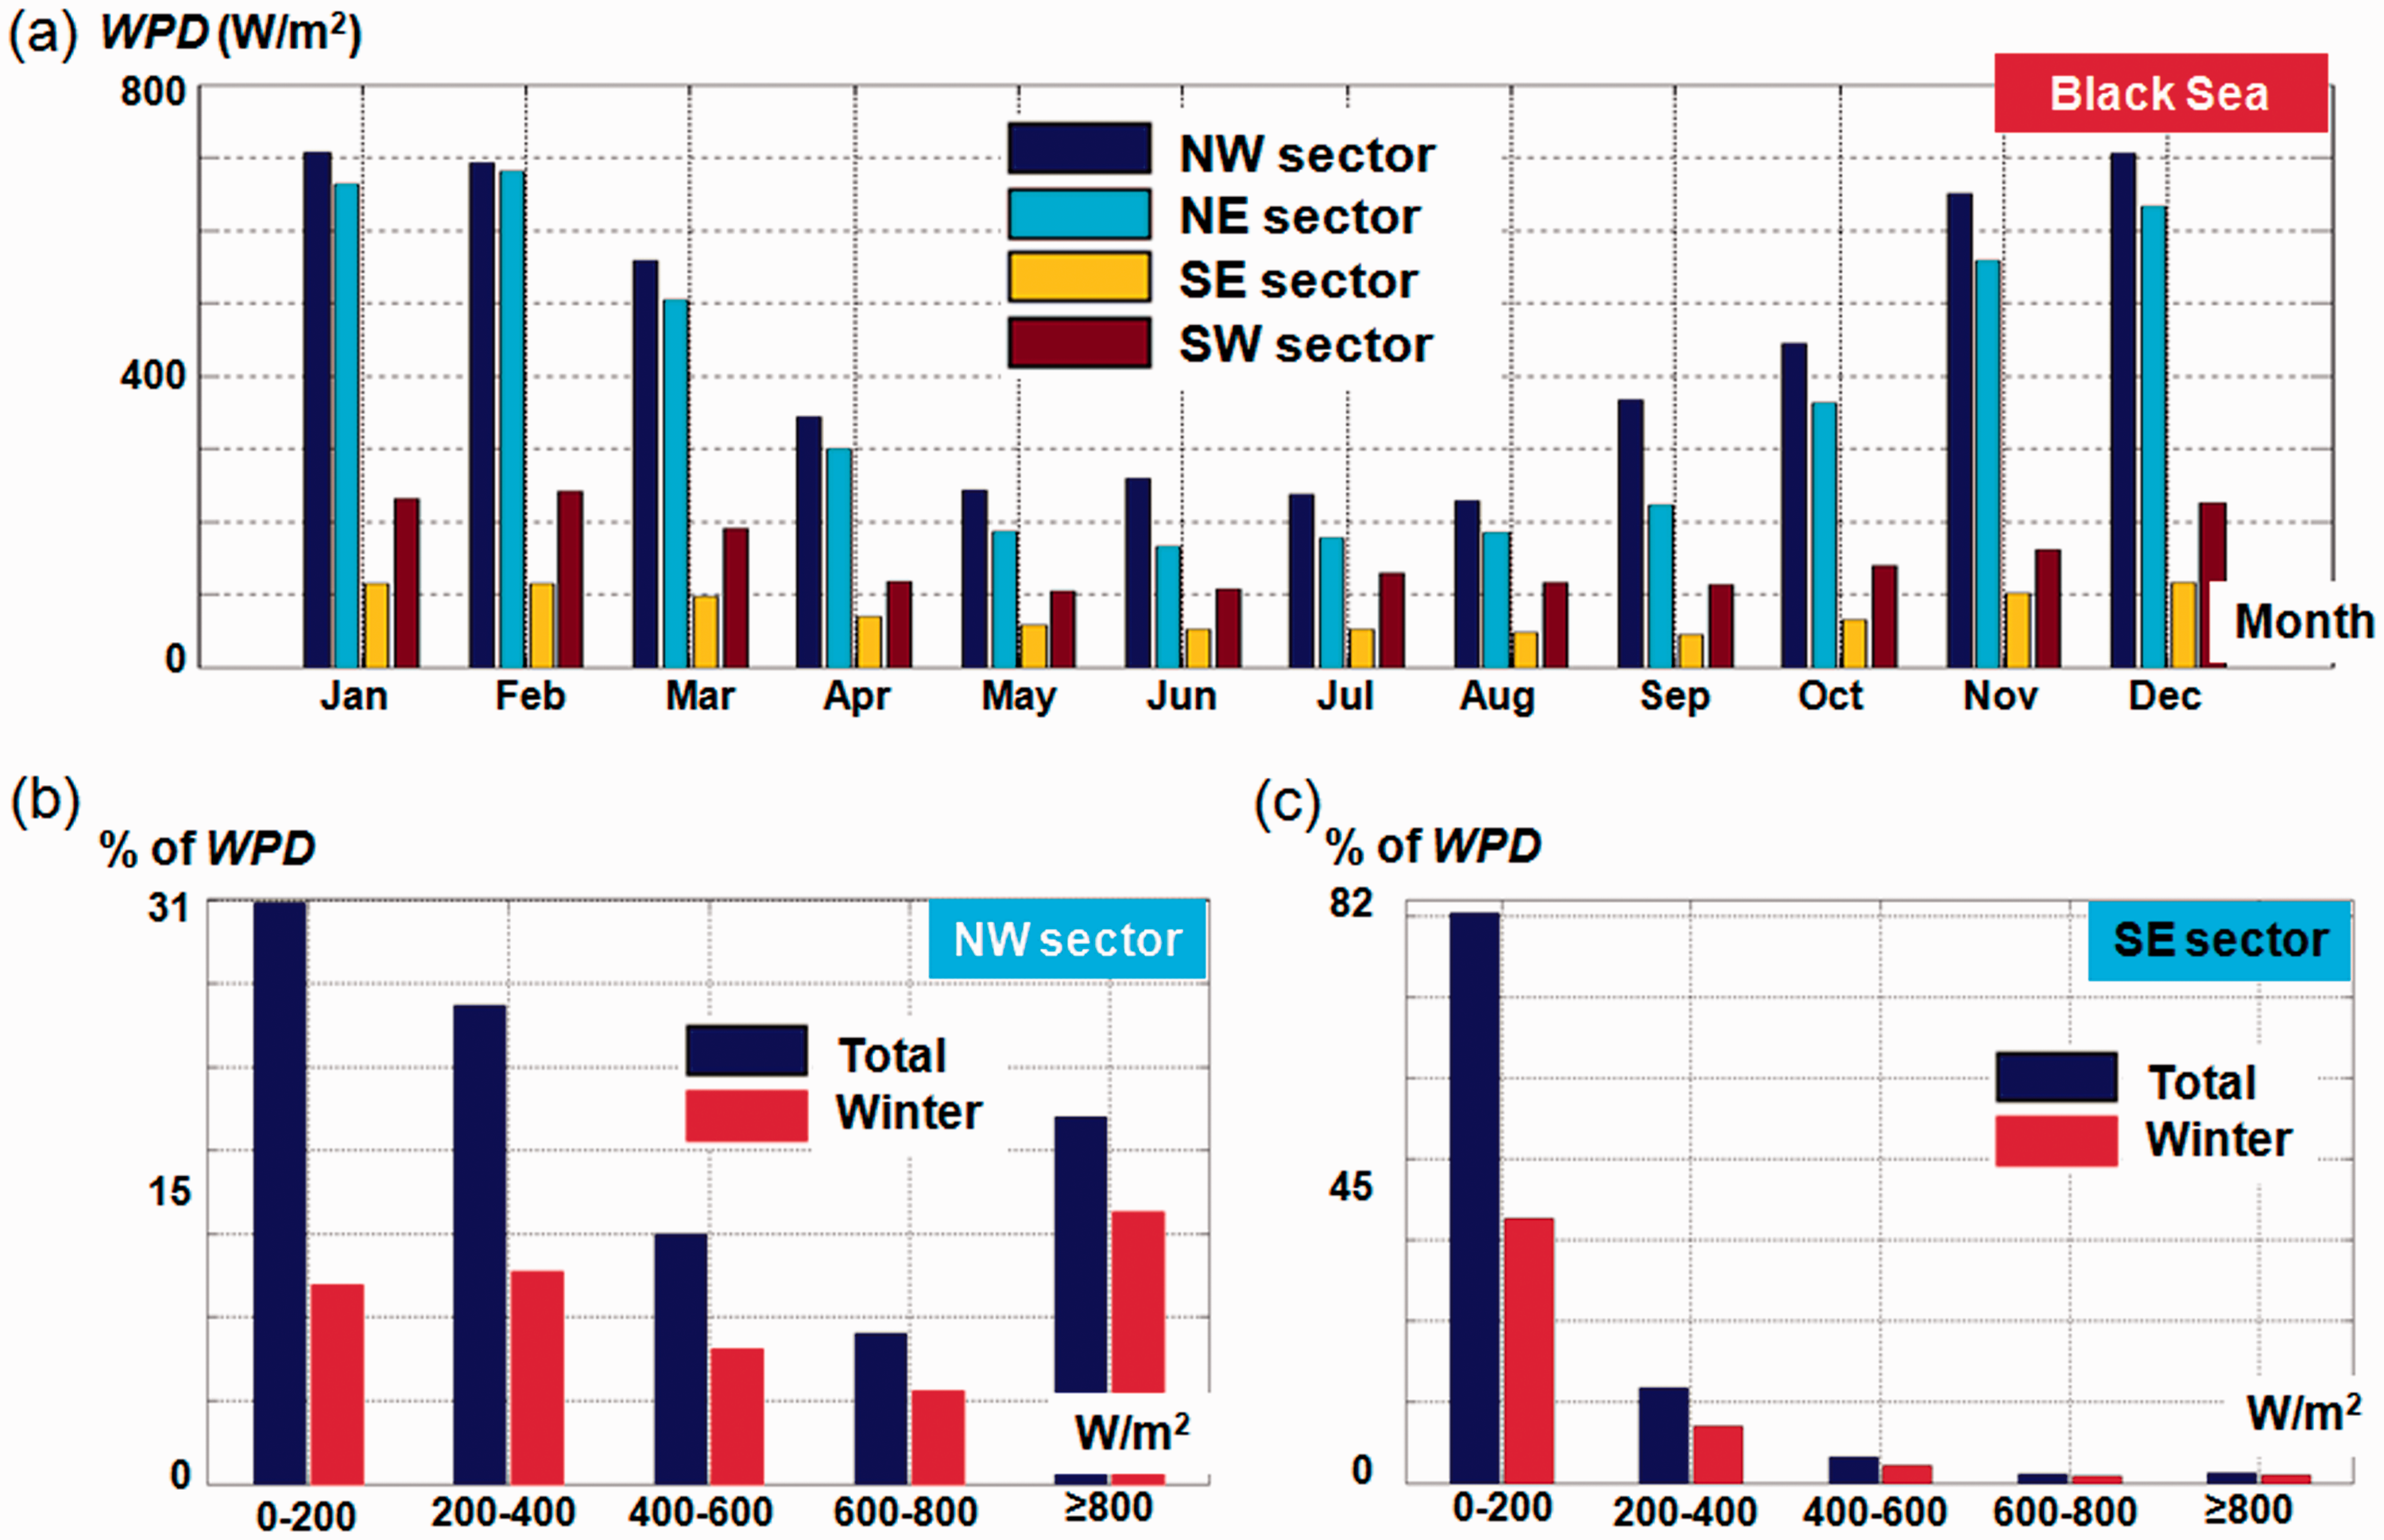
The WPD distribution to classes is presented in Figure 8(b) and (c), for the most and least energetic sector, respectively. From these figures we can notice that the NW sector presents a constant distribution of the values for all the classes, especially as regards the interval 0–200 W/m2 (31%), compared to the SE sector where the values exceeding the 200 W/m2 are less significant, including in this situation the winter season. With almost 82% of the values located in the range 0–200 W/m2, we can conclude that this sector is defined by a lower wind potential, which is not suitable for the development of an offshore wind project.
As regards the Caspian Sea, Figure 9(a) presents the monthly WPD distribution from which we can notice that the NE sector stands out with impressive values, being followed at a large distance by the NW sector. The NE sector presents during the winter time a maximum of 695 W/m2 in December, while during the summer time we can notice values of 420 W/m2 in the months April, June, and September. During the interval June–August, the SE sector presents WPD values higher than the NW sector, with a maximum of 220 W/m2. On the other hand, the NW region presents more energetic features during the winter time. The WPD histograms are presented in Figure 9(b) and (c), from where we can notice that the energetic features of the NE sector are provided by the wind conditions exceeding 400 W/m2.
The regional distribution of the wind energy in the Caspian Sea, based on the data corresponding to the 12-year time interval (1998–2009), for the northwest (NW), northeast (NE), southeast (SE), and southwest (SW) sectors, respectively. Results structured in: (a) monthly variations, (b, c) WPD histogram (total winter) reported for the NE and SW sector, respectively.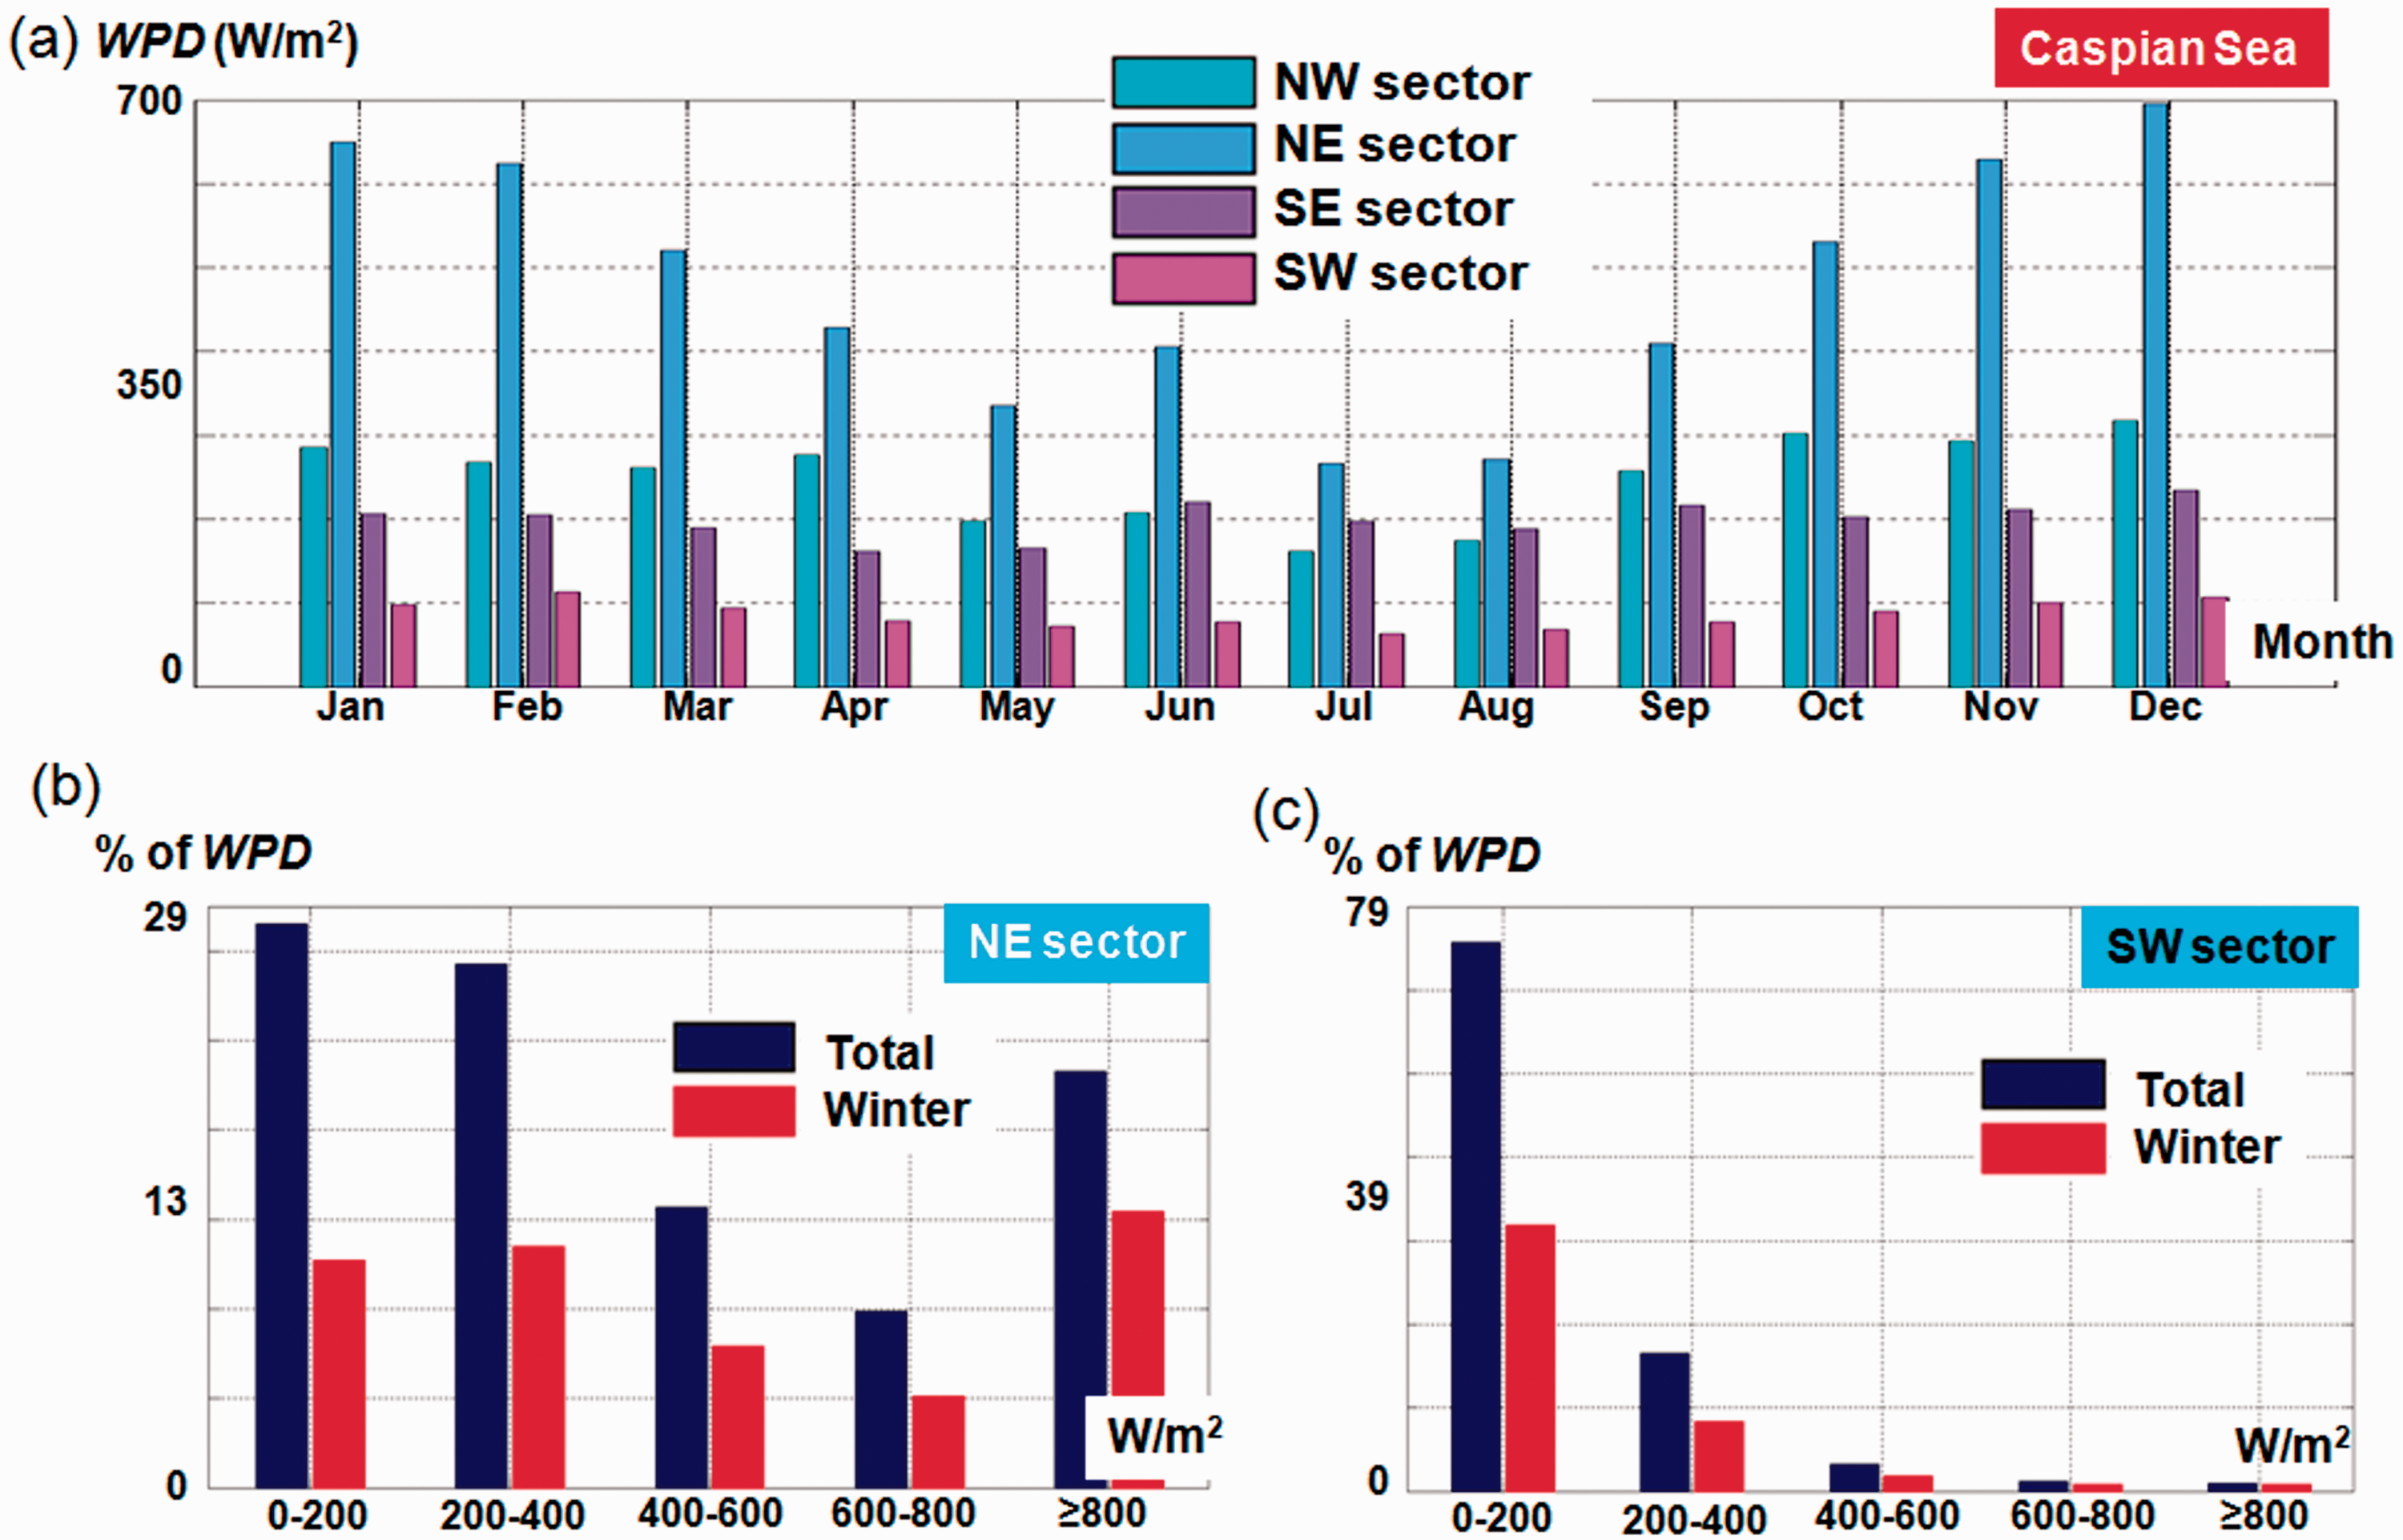
Since the Siemens wind turbine has the best performances in terms of the rated capacity (in %), in Figure 10 is presented such an analysis for the two target areas. For the Black Sea area (Figure 10(a)), we can notice that the northern sectors present similar values, which vary in the range 7.1–18.1%. During the summer time a minimum of 1.19% is noticed in the NE sector. Compared to these values, the sectors from the southern regions present a maximum of 3.9% during December, while in the summer season they are below 1.8% for the SW sector and 0.56% for the SE sector, respectively.
Monthly rated capacity (%) of the Siemens wind turbine designed for each sea sector, corresponding to: (a) the Black Sea, (b) the Caspian Sea.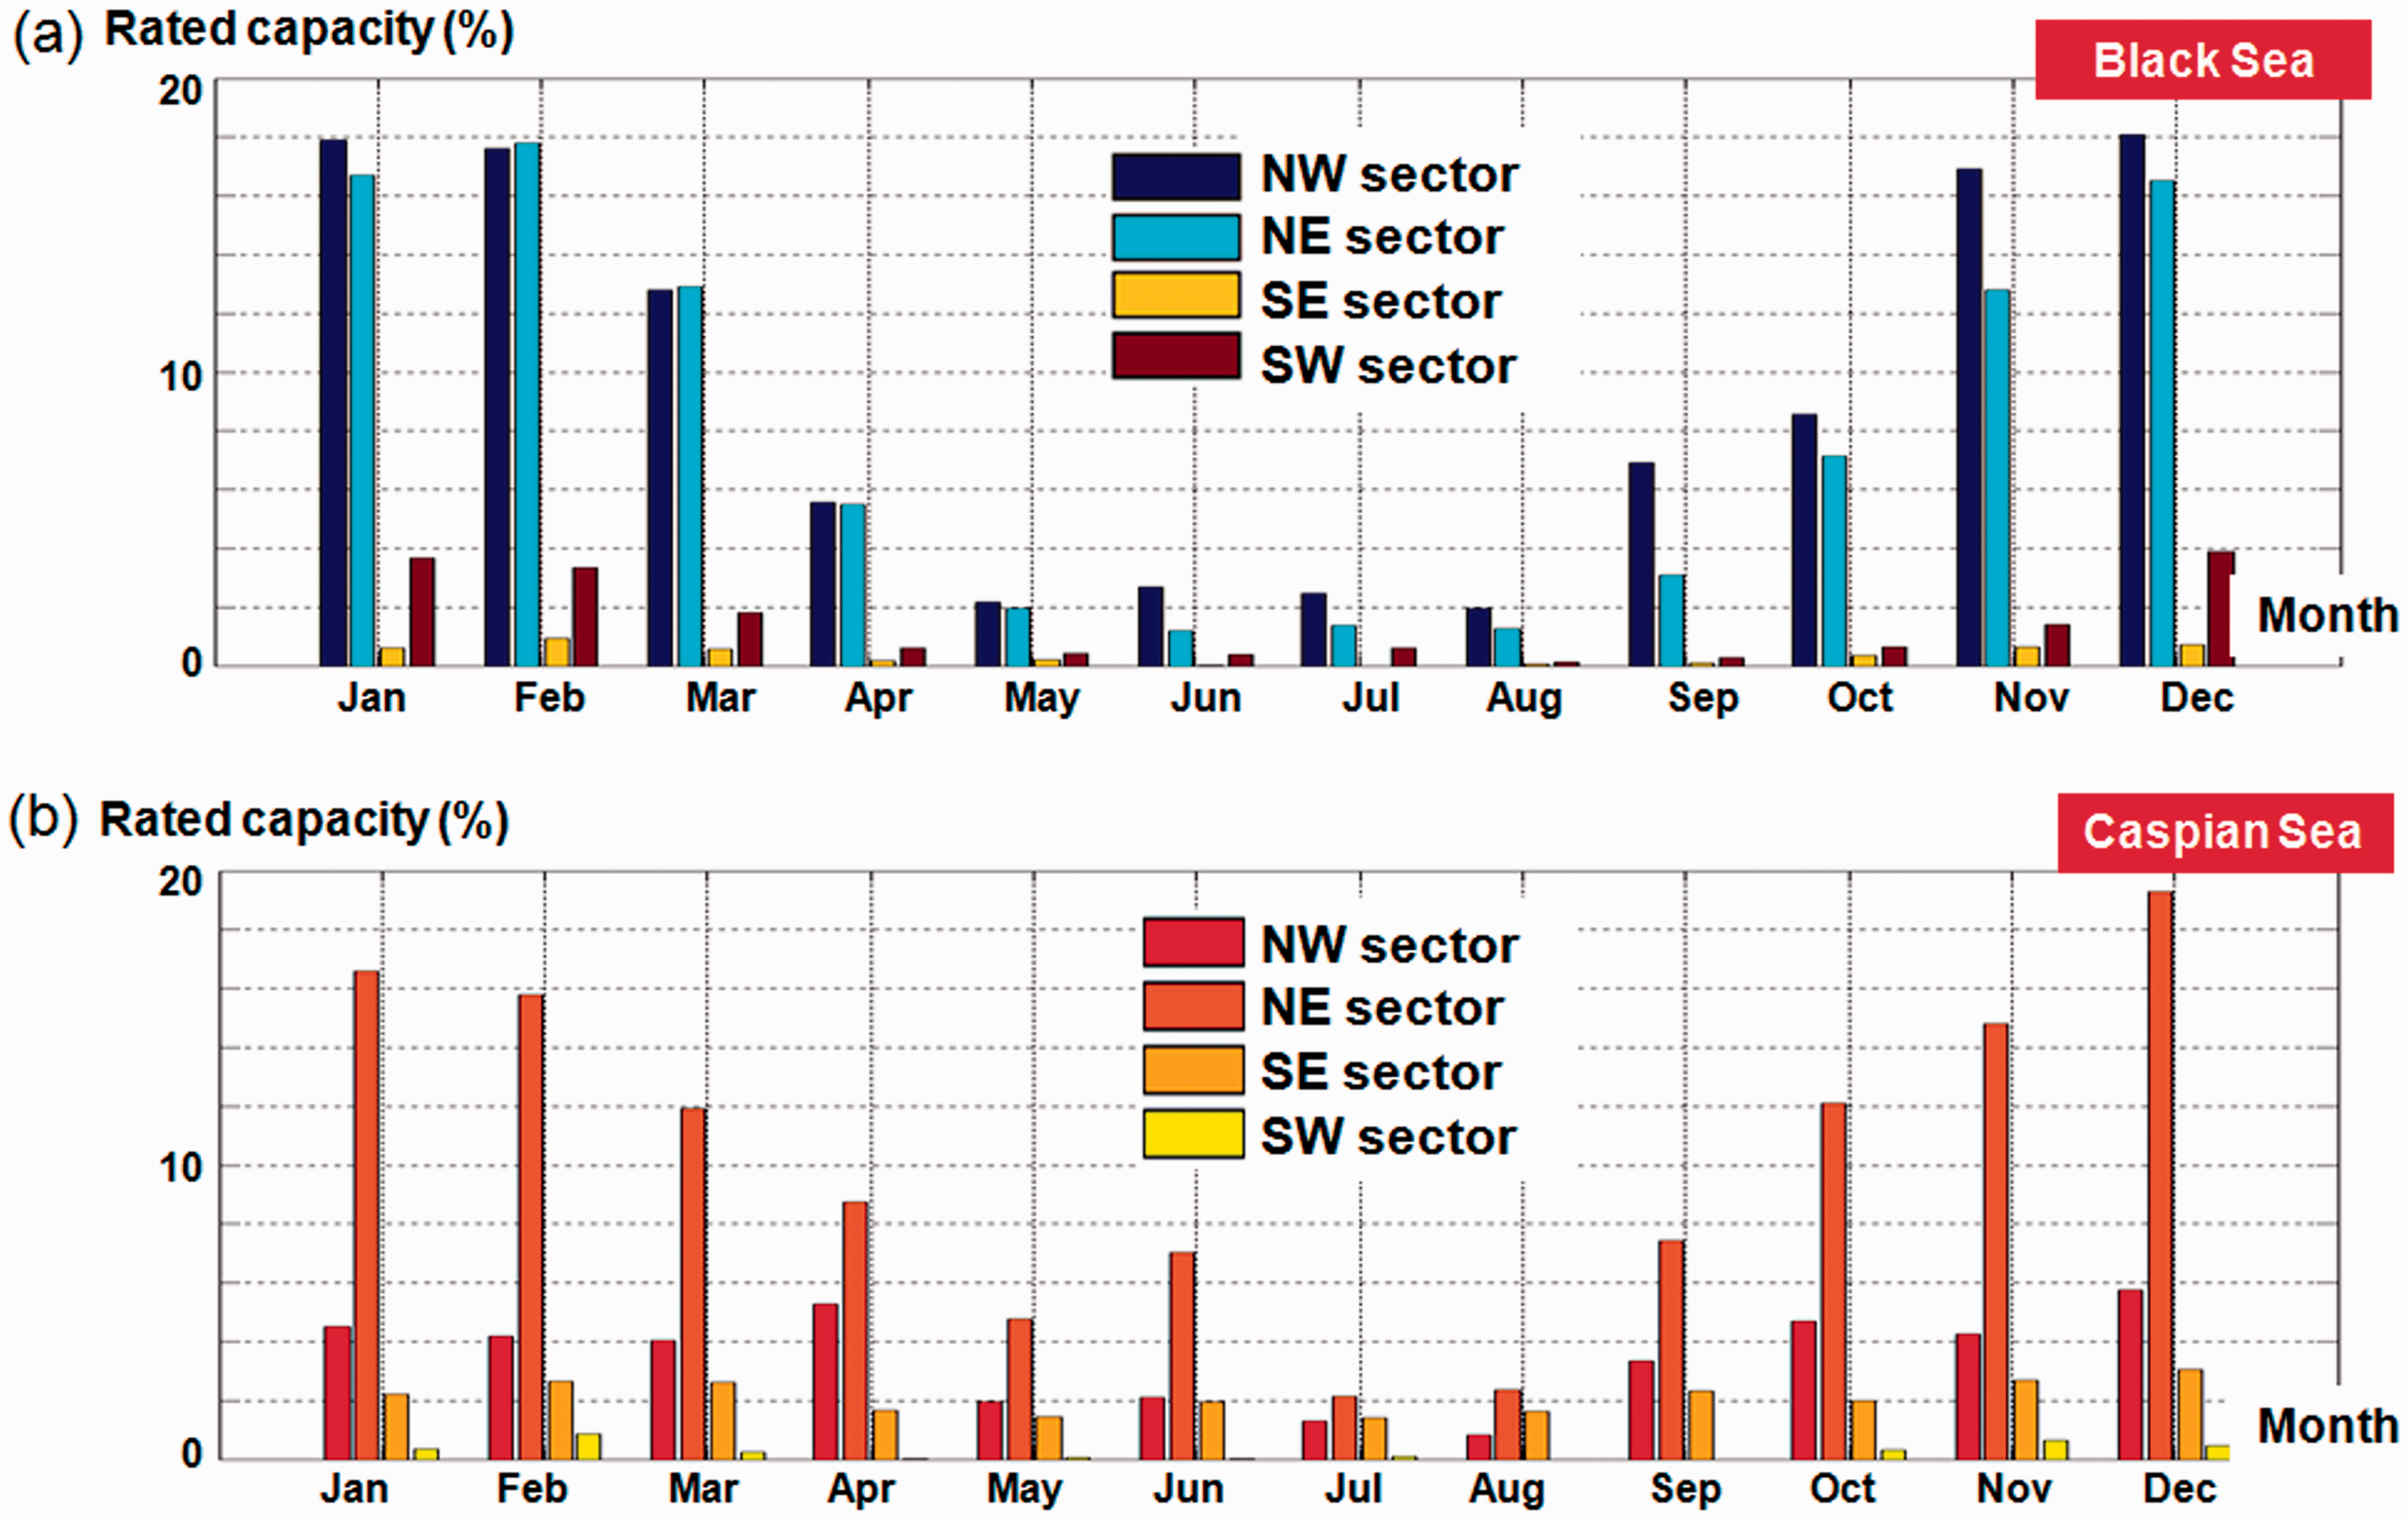
This wind turbine presents similar performances in the Caspian Sea (Figure 10(b)), where the NE sector indicates values in the range 2.15–19.3%, with a minimum in July and a maximum in December. For the NW sector values of about 5.5% are noticed in April and December, while in the sectors from the south the values do not exceed 3.1%, not even during the winter time.
Conclusions
In the present work, the wind energy potential in the Black and in the Caspian seas was evaluated taking into account the diurnal/nocturnal variation of the WPD parameter and the performances of some of the state of the art commercial wind turbines. All the results were reported to a height of 80 m ASL and they were computed by considering the reanalysis data provided by NCEP for the 12-year time interval 1998–2009.
In the case of the parameter WPD, it was found that the northern regions of the two seas present more important wind conditions, while from the analysis of the wind direction the diurnal/nocturnal fluctuations were highlighted. The wind direction seems to follow in some cases the orientation of the local coastlines. We must also mention that the structure of the wind classes remains the same during these intervals, some notable variations being reported only as regards the wind direction.
From the analysis of the wind turbine performances, it was found that the Senvion system has the best results in terms of power output, mainly because this generator has a low cut-in value (3.5 m/s) and a higher rated power (6.15 MW), being able to operate at a height of 120 m a.s.l. On the other hand, in terms of the rated capacity and the capacity factor, the Siemens wind turbine appears to be more efficient, especially for the points A2 and B3, respectively.
It is important to mention that the values of the capacity factor resulted in the present work can reach 70% in some cases (as the point A2), which can be considered to be overestimated if we take into account that most of the studies from this industry indicate values in the range 19–60%, more frequently between 20 and 40% (Boccard, 2009). Thus, a more realistic estimate would be to consider around half of these values, especially for the points which are characterized by higher wind conditions.
Finally, the present work can be considered significant since it brings into discussion the wind energy potential from the Black and Caspian seas for a renewable energy project, in the context when some offshore wind project are already operating in similar environments (e.g., the Mediterranean Sea and the Northern Sea).
Footnotes
Declaration of conflicting interests
The author(s) declared no potential conflicts of interest with respect to the research, authorship, and/or publication of this article.
Funding
This work was supported by a grant of the Romanian Ministry of National Education, CNCS – UEFISCDI PN–II–ID–PCE–2012–4–0089 (project DAMWAVE). The work of the first author has been funded by the Sectoral Operational Programme Human Resources Development 2007–2013 of the Ministry of European Funds through the Financial Agreement POSDRU/159/1.5/S/132397.