
Abstract
This study extends prior research assessing the impacts of advancements in automation on employment by focusing on the effect on various population groups. Employing a human capital and intersectionality lens, and a moderated-mediation analysis of Canadian 2016 Census data, this study finds the effects of automation differ significantly depending on the intersections of income level, gender and visible minority status, differences that for the most part are explained (or mediated) by human capital, especially education. The article discusses several public policy implications related to the roles of individuals, employers and governments in addressing the resulting labour market challenges.
Introduction
There is no question that automation is having profound effects on jobs, workers and labour markets. As computer and robotics capabilities get increasingly sophisticated, more and more functions and processes previously requiring human operations can now be accomplished via computer and automation (Brynjolfsson and McAfee, 2011). Such functions include automated cash registers, online and phone customer service, translation services, self-driving vehicles and industrial robots. Entire industries have been disrupted by automation and digitalization, including the book retail industry (Gilbert, 2015), the music industry (Sun, 2017), the transportation industry (e.g. app-based ride sharing; Sharma, 2020) and automobile manufacturing (Chigbu and Nekhwevha, 2020), just to name a few. While not always disruptive, automation affects almost all industries, even those that are not normally considered high-tech, including retail (Bollweg et al., 2020) and resource industries (e.g. oil and gas; Wanasinghe et al., 2021).
The impact of automation on the future of work is an increasingly prevalent topic, with the issue regularly appearing in news or other non-academic outlets. While few will dispute the many advantages and conveniences that come with automation, the topic of robots taking over most work in the future is often presented as a dystopian possibility (e.g. Kolhatkar, 2017). This is especially the case with the advancement of artificial intelligence and the development of sophisticated computer algorithms, as these technologies expand the scope of job functions that can potentially be taken over by computer technology, including functions that require cognitive and decision-making capabilities (e.g. artificial intelligence and machine learning).
Several studies have tried to estimate the current digital revolution’s effect on employment numbers. Recent much-cited studies (e.g. Frey and Osborne, 2013; Manyika et al., 2017) have predicted 47% of occupations to see a significant decrease in employment in the next 10–25 years and projected that 50% of work activities across all occupations can be automated using already-existing digital technology. However, many scholars have been critical of these dystopian predictions, suggesting that the impact of automation is over-hyped and that the effects of automation are qualitatively not substantively different than previous technological revolutions (e.g. Fadel, 2014; Wajcman, 2017). While views differ on the expected impact of automation on work and employment, most agree that the impact will be significant and that the potential effects must be taken seriously. As most existing current literature on this topic has primarily examined the degree of automatability, typically broken down into different occupational groups and industries (e.g. Frey and Osborne, 2013; Manyika et al., 2017), the associative relationships that different groups in society have with the automatability outcomes have been underexplored.
Using occupations, rather than jobs, tasks, or employees, as the unit of analysis, this article examines the extent to which the risk of automation associated with each occupation extends to various population groups and the intersections between them. The differential risk of automation among population groups has been an underexplored area in the literature. With a focus on the Canadian labour market, we test the relationships between a number of key occupational variables (income level, gender representation and visible minority representation) and the likelihood of the occupations being affected by automation, as estimated in the projections by the McKinsey Institute (Manyika et al., 2017). As a theoretical contribution, we combine the lenses of intersectionality (Collins and Bilge, 2016) and human capital (Mincer, 1970) to focus on the impact along the intersections of income, gender and visible minority, and the degree to which these effects can be explained by the level of human capital, including education, experience and training. While the occupation-level focus of this study, with concepts measured at a high level of aggregation, may not capture some individual-level nuances, the value and contribution of this approach is that it provides future research, which may be more micro-focused, a starting point from which to understand the broader aggregate themes and patterns that are present in these focal relationships of interest.
Theory and hypotheses
Empirical background: Automation, job redundancy and inequality
Most readers can think of occupations or industries that have almost or fully disappeared as a result of advances in technology and automation. Automation is even driving changes to individual jobs in seemingly non- or less-technical industries such as retail or hospitality or the resource sector, in addition to technical and computer-oriented sectors. Yet, technological change is not inherently problematic. For instance, if new technology allows a dangerous task to be carried out more safely, that could and should be seen as a win-win change for employees and employers. The bigger issue for workers and society is when technological change impacts the tasks of a given job or occupation to such an extent that substantial downsizing occurs due to obsolescence and these redundancies subsequently result in some of the workers having a challenging path toward re-entering employment.
In their much-cited study, Frey and Osborne (2013) analysed the impact of technological change on 702 different occupations. They estimated that 47% of occupations are at risk of substantial job loss due to automation over the next couple of decades. Jobs ripe for automation include those with manual and/or repetitive tasks, but Frey and Osborne also note how even problem-solving and non-routinized tasks are increasingly at risk of computerization and automation. That said, prognostications of the impact of technological change and automation vary sharply. For example, Manyika et al. (2017) estimate that half of all current work tasks can be automated with current technology, without necessarily predicting that the jobs will be eliminated. Reporting from a roundtable of experts, Fadel (2014) suggests that many of the tasks that can be automated with artificial intelligence and other new computer technology (see for example Frey and Osborne, 2013) will still require human involvement and oversight. Furthermore, the adoption of technology is typically much slower than initially anticipated. Wajcman (2017) has a similar view and expects disruption among many jobs, but for net job losses to be modest as new jobs and economic growth offset the decline in routinized jobs. Automation, even when it directly leads to workers being made redundant, does not necessarily mean net job losses. Typically, automation is implemented to achieve productivity gains that can lead to increased profitability or competitiveness at a firm level, and economic growth on an aggregated level (Autor, 2015). According to Autor (2015), automation has not yet led to substantial net job losses at an aggregate level, but if the pace and sophistication of technological advancements increase, so too does the likelihood of large-scale net job losses.
Labour market challenges
The impact of technology on labour in Canada mirrors that of most countries with advanced economies (Haugen et al., 2021). Using density of robot use as a measure of the rate of automation, Canada ranks well above the world average, though slightly lower than some European countries, such as Sweden, Denmark and Belgium. Germany, though, stands out in terms of high density of robotization, only to be exceeded by South Korea and Japan (Oschinski and Wyonch, 2017). While automation, to date, in Canada has occurred in a subset of industries (such as manufacturing), it is likely that technological advancements will affect other, and all, industries in the coming years (Haugen et al., 2021). In Canada, like elsewhere, low-paid jobs that are routinized and require relatively lower skill (and education) levels have been, and will be, more at risk of automation (Lamb, 2016). Since visible minority persons are over-represented among those in those lower-paid jobs (Employment and Social Development Canada, 2019) they tend to face greater risk of automation.
While the differences in the rate of automaton between advanced economies may be small, there is considerable difference in how countries respond to the resulting labour market challenges. The increasing levels of automation have been accompanied by increasing levels of outsourcing and offshoring, which some suggest together have led to a hollowing out of middle class occupations (e.g. Levy and Murnane, 2007). Computer technology has also contributed to the destandardization of work in many occupations (Spreitzer et al., 2017). How countries have responded to these changes has been significantly shaped by the extent they have adopted active versus passive labour market policies. As a liberal market economy (LME) (Hall and Soskice, 2001), Canada is characterized by relatively passive labour market policies. This is in contrast with the more active labour market policies of coordinated market economies (CMEs) (Hall and Soskice, 2001). One example of this difference is the flexicurity approach (originating in the Netherlands and Denmark and subsequently adopted, or promoted, by the European Union), which combines ‘liberal redundancy regulations, high unemployment benefits (UB), and active labor market policies (ALMP)’ (Bekker and Mailand, 2019). This approach is meant to make it easier for industries to adapt to the changing global and technological environment, without negatively impacting the working population. This is combined with CME countries’ higher levels of investment in education and training, which often results in reducing the burden on individuals in training and education decisions. In contrast, Canada has much less coordinated labour market, training and education policies, which also leave much more of the cost of training and education to individuals (e.g. The Premier’s Highly Skilled Workforce Expert Panel, 2016). In other words, while the impact of automation on jobs in Canada likely is similar to that of other advanced economies, the different policy environment is likely to have different implications for the labour market.
Population characteristics associated with automation risk
While views differ on the magnitude of the net effect of automation, there is general agreement that the impact on occupations will vary. According to the routinization hypothesis proposed by Autor et al. (2003), human labour is most likely to be substituted by computer capital for work that can be accomplished according to explicit rules, while computer capital is likely to complement work involving ‘nonroutine problem-solving and complex communications tasks’ (p. 1279; see also Shestakofsky, 2017).
Levy and Murnane (2007) further specify human skills into five broad categories that are impacted by computerization in different ways. Two of these, expert thinking and complex communication (including medical diagnosis, legal writing, persuading, selling and personal care and service), involve tasks that are low on predictability and rule-based decision-making, and thus are not good candidates for being substituted by computer technology. As these often involve a high degree of information processing, computers can provide a strong complementary function. That is, computers can enhance these functions rather than substituting for them. Routine tasks, whether cognitive (e.g. calculation, record-keeping, repetitive customer service) or manual (e.g. sorting, repetitive assembly), are prime candidates for computer substitution. For tasks that are rules-based, information processing can relatively easily be accomplished with computer programs, while robots are well suited for manual tasks that are highly prescribed. In fact, computers and robots will often perform these tasks more accurately. Lastly, non-routine manual tasks (such as janitorial, cleaning work and truck driving), which are very difficult to program, are poor candidates for computer substitution while also providing little opportunity for computer complementarities (see also Autor et al., 2003). It should be noted that as technology progresses, currently accepted categorization typologies will need to be revised. For example, advancements in artificial intelligence and machine learning have vastly expanded the range of cognitive tasks that can be computerized and are starting to include tasks such as truck driving, which Autor et al. (2003; see also Levy and Murnane, 2007) refer to as a manual task.
Since many of these characteristics are associated with particular occupations and because occupations tend to have variation in the representation of population groups (Employment and Social Development Canada, 2019), the impact of automation will likely be felt differently across different population groups. In the following, we discuss and hypothesize the relationships between the compositional characteristics of occupations (including income level, gender representation and visible minority status) and the automatability of those occupations. In building these hypotheses, we rely extensively on Canadian sources together with more general sources since automation, and its impact, is not a uniquely Canadian phenomenon.
Income
Economists have an established literature exploring the substantive and robust relationship between skills and income (e.g. Mincer, 1970; Riddell, 2006). Prior literature establishes that lower-skill occupations are most at risk of automation because they tend to have a higher degree of routinization (Autor et al., 2003). Automation typically involves eliminating repetitive tasks which are more prevalent in lower-waged, lower-skilled jobs, and Canadian and other studies have found low income to be associated with a greater risk of automation (Frenette and Frank, 2020) and computerization with increasing wage inequality (Kristal, 2020). In contrast, the jobs created as a result of new technology tend to be accessible to those with higher skill and education (or are otherwise credentialed) (Autor, 2015). Some literature suggests that automation has been associated with increasing labour market polarization, where the automation of routine work has hollowed out middle-skill and middle-income jobs at the same time as there has been a growth of low-paying service jobs, and some growth in technical, high-skill, high-paying jobs (Autor, 2015). However, other studies have found little evidence of such polarization (e.g. Oesch and Piccitto, 2019), and have found that it is generally occupations characterized by lower skill (and lower income) that are most at risk (OECD, 2019; Pouliakas, 2018). While at one point lower-skill jobs may have been less likely to be automated, due to the low cost of the labour and high cost of the technology required to enable the substitution, the cost of technology is continuing to fall while at the same time as the technologies available are becoming increasingly sophisticated. As we have seen with the increasing use of self-checkouts at retail stores and fast-food outlets, those low-income, low-skill jobs expected to increase according to the polarization hypothesis are now in decline.
Gender
In contrast to the low income and visible minorities groups (discussed below), prior studies have found that men are more at risk of losing jobs due to automation (Pouliakas, 2018). This is because men are much more likely to work in occupations that are manual and based on routine tasks (such as transportation, warehousing and manufacturing), and that pay relatively high wages despite modest formal educational requirements (Pouliakas, 2018). In contrast, many female-dominated occupations, such as elementary school teachers, early childhood educators, nurses and massage therapists, are less manual and less routine (and relationally more complex) (Statistics Canada, 2017).
Visible minority representation
Canada, while historically a majority white country, has seen an immense increase in its visible minority population since changes to immigration regulations in 1967 (Galabuzi, 2006). In Canada, visible minority refers to whether an individual belongs to a visible minority group as defined by the Employment Equity Act, where visible minority generally consists of the following self-identified groups: South Asian, Chinese, Black, Filipino, Latin American, Arab, Southeast Asian, West Asian, Korean and Japanese (Statistics Canada, 2017). The portion of visible minority individuals of the population increased from 4% in 1971 (Galabuzi, 2006) to 22.2% in 2016 (Statistics Canada, 2017). Of those that are visible minority, 64.5% are immigrants and 35.5% are Canadian born (while 63.3% of immigrants are visible minority; thus visible minority status only partially intersects with immigrant status) (Statistics Canada, 2017). In Canada, visible minority groups have in general fared worse in terms of labour market outcomes compared to other groups. While this gap has gradually narrowed over the years, significant differences remain (Block et al., 2019). According to the 2016 Census, the unemployment rate for the visible minority population was 9.2%, compared to 7.3% for the non-visible minority population, with a slightly bigger difference for visible minority women (9.6%) compared to non-visible minority women (6.4%) (Statistics Canada, 2017).
Visible minorities have also been found to be in more relatively precarious jobs (e.g. part-time and part-year) than the rest of the population (with aged 15 and over visible minority women and men reporting 56% and 47% part-time or part-year compared to non-visible minority women and men at 52% and 40%, respectively) (Chui and Maheux, 2011). Thus, these relatively higher rates of part-time work, particularly for the prime working age of 25 to 54, suggest a general precarity of employment and this is likely associated with lower labour market opportunities (Liu, 2019). As such, it is unsurprising that non-visible minority groups are over-represented in jobs at risk of disruption and redundancy (Means, 2017). At the same time, there are also indications that visible minorities are relatively well represented in many of the high-skill, high-income occupations that are not likely to be negatively affected by automation (e.g. doctors, dentists, engineers) (Statistics Canada, 2017). Furthermore, 40% of visible minorities have a university education, compared to 24% of those not belonging to a visible minority (Statistics Canada, 2017).
Importantly, many visible minority persons are immigrants as well, and studies (e.g. Liu, 2019) have consistently found poorer quality employment opportunities among immigrant workers in Canada despite their relatively high levels of skills and credentials, compared to Canadian-born counterparts. Immigrants, especially those from countries with predominantly non-white populations, often end up in lower-skill occupations even if they do come to Canada with post-secondary and graduate degrees, due to problems with having their foreign credentials recognized (Krysa et al., 2019). It is important to stress that this is a problem that cannot only be attributed to issues of immigration. In recent decades, the majority of immigrants to Canada (80% in 2011; Statistics Canada, 2014) have come from Asian and African countries (Krysa et al., 2019). Moreover, visible minority immigrants (Black male immigrants in particular) tend to experience significantly stronger labour market barriers than non-visible minority immigrants (Swidinsky and Swidinsky, 2002). Research using US data has shown that even among the non-white immigrant population, those with darker skin tones seemingly face incremental labour market risk and penalties, even when controlling for ‘race’ (Han, 2020). For these above reasons, we expect occupations with high visible minority representation, on average, to be more at risk of automation.
Based on the above discussion, we propose the following hypotheses for the relationship between population characteristics and automatability (i.e. portion of each occupation that can be automated) of occupations:
Hypothesis 1a: Income level of an occupation will be negatively associated with automatability.
Hypothesis 1b: Male representation of an occupation will be positively associated with automatability.
Hypothesis 1c: Visible minority representation of an occupation will be positively associated with automatability.
The role of human capital
A key premise of human capital theory is that increased human capital (that is knowledge, skills, abilities, experience, etc.) of the workforce will increase productivity and economic outcomes (Mincer, 1970, 1989; Riddell, 2006), as well as labour market outcomes, such as higher incomes, both at the individual (Berntson et al., 2006) and societal level (Riddell, 2006). The human capital literature has found such relationships in relation to literacy, education and experience (Mincer, 1974). In Canada, as elsewhere, human capital variables, such as education, have also been associated with more varied employment opportunities, lower unemployment, better health and increased life expectancy (Riddell, 2006). In terms of human capital and automation, Frenette and Frank (2020) found lower levels of education associated with greater automation risk, at the individual level.
At the occupation level, it is possible to associate automatability with the complexity of the tasks within any given occupation. The more routine the tasks within a job are, the easier it is for these tasks to be replaced by computer technology (Autor et al., 2003). Moreover, as computer technology becomes increasingly advanced, the relative complexity of tasks essentially declines as previously complex tasks begin to be considered ‘routine’. While manual tasks historically have been most at risk, computers are increasingly able to process cognitive and interactional tasks (Frey and Osborne, 2013). Customer service is one example of this development. In addition to automated self-serve store checkouts, online robots are now responding to customer service concerns. This is perhaps not surprising, considering that people working in these occupations have typically been trained to follow particular scripts, and as computers become increasingly able (with artificial intelligence) to interpret words and text, they become better able to figure out which of their programmed repertoire of responses best apply. The commonality among these occupations is that they require only a low or modest level of skill, experience or education. By extension, it follows that occupations requiring a high level of human capital investments (such as education, experience and training) are less likely to be negatively affected by automation. For these occupations, technology is likely to complement the efforts of workers instead of substituting human labour (see Shestakofsky, 2017). In contrast, it follows that occupations requiring a low level of human capital will continue to be among those most at risk.
Of the human capital factors, we expect education to be the most critical. This is because non-routine analytic and interactive tasks are associated with a higher level of cognitive processing (Autor et al., 2003), typically developed through formal education, and/or with occupations requiring at least some higher level of education (e.g. managers). However, we also expect experience and training to play a role (e.g. Card, 1999). As we have indicated, occupations requiring lower human capital levels have a higher risk of automation; thus, the human capital stemming from experience and training will also likely reduce the automation risk. Accordingly, we propose:
Hypothesis 2: The (2a) negative association of income level, (2b) positive association of gender (male) representation and (2c) positive association of visible minority representation with automatability is mediated by education, experience and training level requirements.
Human capital, intersectionality and automation
Whether we consider the direct relationships (Hypothesis 1) or the indirect relationships mediated by human capital (Hypothesis 2), the chosen independent variables are unlikely to be associated with automatability in isolation. For example, income levels, genders and visible minorities are not homogeneous groups (Croucher et al., 2018), and people within them cannot be expected to have identical labour market outcomes. Thus, differential outcomes depend to a large degree on whether examining low- or high-income men or women, and these intersectional differences are further complicated by whether visible minority or non-visible minority groups are considered. Accordingly, the categories of income, gender and visible minority interact in multiple ways that are associated with differential labour market outcomes.
The study of social inequality has increasingly employed an intersectionality lens (e.g. Collins and Bilge, 2016; Crenshaw, 1989). Intersectionality is based on the idea that the human and social world is complex and that experiences are usually shaped by multiple intersecting factors. Instead of looking at gender, race, class or disability as singular factors impacting social outcomes, intersectionality considers the real story to lie in the intersections between these categories. Stemming predominantly from feminist and critical race research and activism, intersectionality highlights that women’s experiences are not all identical, just as the experiences of all visible minority people are not identical.
Rather than considering people’s labour market precarity as being associated with neatly separate categories, intersectionality envisions these categories as intricately linked and overlapping (Acker, 2006; Flippen, 2014; Kronberg, 2014). Accordingly, the experiences of people belonging to one category are not the same. Women’s experiences vary significantly whether they are non-visible minority or belong to a visible minority group as well as their economic status. Similarly, visible minorities’ experiences vary significantly depending on their gender and economic status. Intersectionality has often been extended to include other axes of social division or exclusion. For example, when examining disability, intersectional analysis has shown that outcomes are dramatically affected by people’s economic status, gender and visible minority status (e.g. Berghs and Dyson, 2020).
In terms of employment and labour market outcomes, intersectionality-informed studies have found that Black men were at a particular disadvantage in the labour market (Hum and Simpson, 1999) and that economically disadvantaged Latino women in the US typically get stuck in particular niche occupations (Flippen, 2014). In Canada, Yap (2010) found that, on average, women and visible minorities have poorer terms of employment than male/non-visible minority counterparts, something that is compounded when gender and visible minority status intersect, with the bulk of that gap due to job level and occupational differences.
Human capital can also be examined from an intersectionality perspective. Studies have shown that human capital (in the form of education, experience, training and even literacy) can significantly improve employment outcomes of people that have otherwise been under-employed (e.g. Flippen, 2014; see also Riddell, 2006). Just as there are intersectional effects on the labour market and employment outcomes, including the risk of occupations becoming automated, there are intersectional effects on the degree to which people acquire human capital. As we have argued (in Hypothesis 2), human capital can provide a key explanation of the extent to which occupations become automated.
When we take an intersectional approach, we see that not all higher-income occupations are associated with high human capital (education, etc.). In Canada, men, for example, tend to have higher wages than women, even though they on average have lower levels of education (Moyser, 2017). This is illustrated by the disproportionate number of relatively high-wage male-majority occupations that require little formal education, as discussed above, and the many female-majority occupations that remain relatively low-wage despite relatively high educational requirements (Statistics Canada, 2017). Also, visible minority people are often stuck in low-skill, low-income (manual and routine) occupations with very low human capital requirements, notwithstanding having high human capital, on average. It is notable that a higher proportion (40%) of visible minorities have a university education compared to non-visible minorities (24%) (Statistics Canada, 2017). Furthermore, among visible minority populations, high education jobs are likely to be disproportionately occupied by men, while visible minority women are over-represented in low education occupations (Statistics Canada, 2017).
Based on the above discussion, we expect that human capital will provide the primary explanation for how these various intersections are associated with occupations being automated. Further, because of the interactions between income level, gender and visible minority representation, we propose the following moderated mediation hypotheses:
Hypothesis 3: The indirect relationship between each independent variable – (3a) income level, (3b) gender (male) representation and (3c) visible minority representation – and automatability (mediated by education, experience and training level requirement) will be moderated by the interaction with the other two independent variables.
Methods
Data
This article uses occupations as the unit of analysis to examine the relationships between various occupation-related variables and the likelihood of occupations being automated; thus, all of the variables and the analysis are at the occupation level. The key dependent variable, which is labelled ‘automatability’, is based on estimations done by the McKinsey Institute (Manyika et al., 2017) of the degree to which occupational tasks can be automated. These estimations have subsequently been translated to fit the Canadian context by the Brookfield Institute (Lamb, 2016) to create automatability estimates for each National Occupational Classification (NOC) occupation, as described below. The remaining data come from the Statistics Canada website and are based on data from the 2016 Census (Statistics Canada, 2017). The Census data provide raw employment numbers, which we have translated into proportions to use for this analysis. See Table 1 for means and standard deviations for each variable.
Means, standard deviations and bivariate Pearson correlations. a
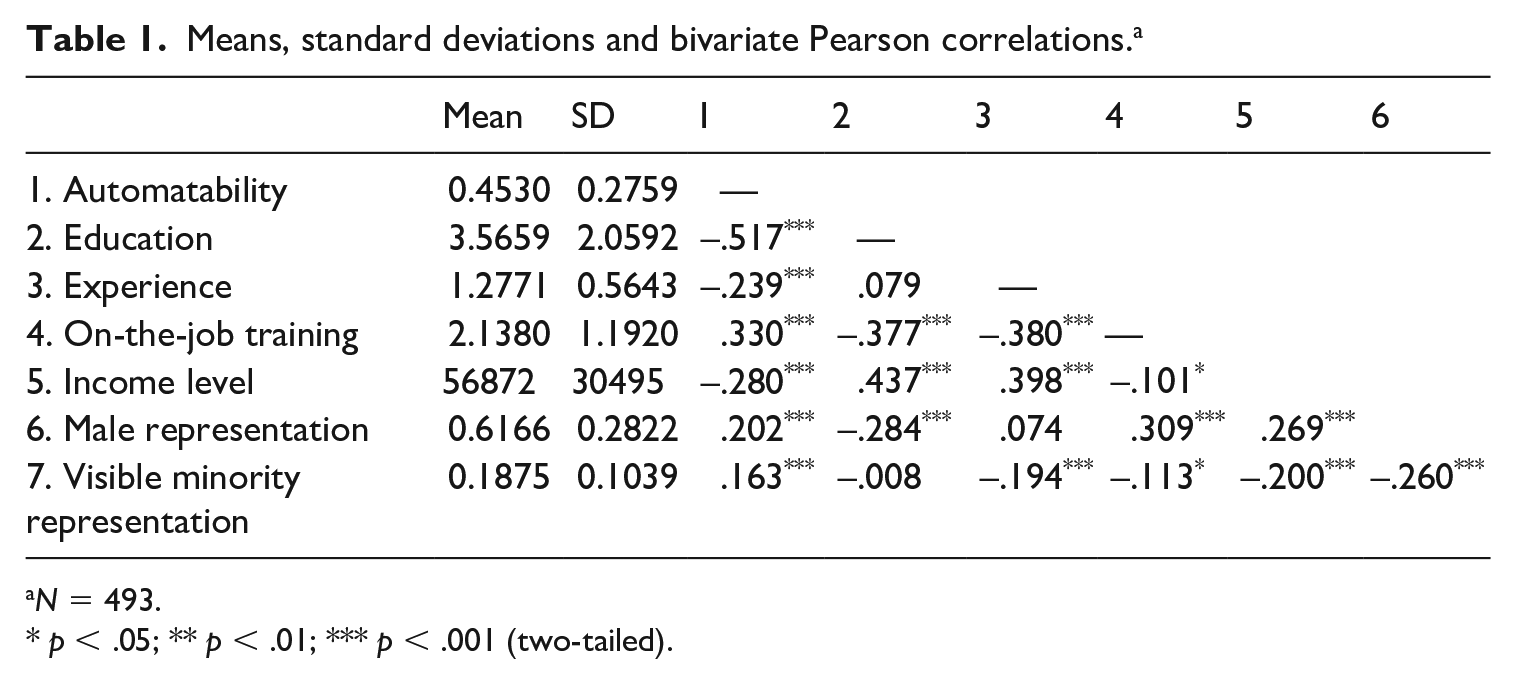
N = 493.
p < .05; ** p < .01; *** p < .001 (two-tailed).
Variables
Automatability
The McKinsey Institute (Manyika et al., 2017) conducted an extensive study to examine the likelihood of occupations being affected by automation, by analysing the activities associated with 800 occupations, as detailed in the US Bureau of Labor Statistics 2014 O*Net occupational database. They used input from academic and industry experts to define and rank the technical requirement and potential 18 capabilities associated with each activity. The resulting ranking was then used in a machine-learning algorithm to score all the work activities associated with the occupations and then score the automatability potential of each occupation. The Brookfield Institute (Lamb, 2016) has subsequently translated the McKinsey Institute numbers to provide an automatability likelihood estimate for all occupations as classified by NOC codes in Canada; these data are used as the dependent variable in these analyses, where a higher automatability value implies a higher likelihood of automation.
Human capital
As measures for human capital, we used the ‘typical levels of education needed for entry in the occupations’, ‘work experience in a related occupation’ and ‘typical on-the-job training needed to attain competency in the occupation’ for each O*Net occupation as estimated by the US Bureau of Labor Statistics (2019a). We translated the levels for the O*Net occupations to NOC occupational codes using the ‘crosswalk’ provided by the Brookfield Institute (NOC to O*Net Crosswalk, 2020; Vu, 2019). In the instances where more than one O*Net occupation (with different educational, experience and training requirements) corresponded to one NOC occupation, we computed the average level of these O*Net occupations to find the NOC level to use in the analysis. Educational requirement is coded using a scale from 1 to 8, ranging from 1 = No formal educational credential to 8 = Doctoral or professional degree. Work experience is coded using a scale from 1 to 3, with the values indicating the following: 1 = None, 2 = Less than 5 years and 3 = 5 years or more. On-the-job training is measured on a scale from 1 to 6, ranging from 1 = None to 6 = Internship/residency (for more detailed explanation and definitions see US Bureau of Labor Statistics, 2019b).
Gender (male) representation
To measure the level of gender representation in each occupation we used the Canadian 2016 Census data to compute the percentage of men and women working in each occupation. The Census question asks respondents to indicate their ‘sex’. As such in this study reported sex is being considered a proxy for gender. Nonetheless, we recognize that conceptually ‘sex’ is not identical to ‘gender’, where sex at birth is typically considered a biological trait and gender is an identity, even though there is considerable proportional overlap between these categorical classifications (Statistics Canada, 2019). For the analysis, we used the percentage of males as an independent variable because of the proposition that male representation would be more strongly associated with automatability. The female percentage representation is calculated by taking 1 minus the male percentage representation.
Income
The independent variable income is the derived average income associated with each occupation according to the Canadian 2016 Census. Across all occupations, the average incomes ranged from a low of CDN $9250 to a high of CDN $228,412 per year.
Visible minority representation
We used the Canadian 2016 Census data to compute the representation (as a percentage) of visible minorities in each occupation. This percentage representation ranged from 0% to 56% across all occupations.
Analysis
In addition to the descriptive statistics and bivariate Pearson correlation analysis, for the regression, we used the PROCESS macro for SPSS to test for mediation and moderated mediation specifications, as prescribed by Hayes (2018). PROCESS is a regression-based macro that makes it possible to simultaneously test for mediating and moderating effects by allowing several regression models to be run simultaneously. A unique feature of PROCESS is that it uses bootstrapping to avoid problems associated with non-normal distributions and to produce more precise confidence intervals. We ran the PROCESS macro to test the indirect effect of each independent variable, each time controlling for the effect of the other relevant variables. We further tested for interactions between the three independent variables, using the conditional process analysis (or moderated mediation) method (Hayes, 2018). In the regression analyses, all variables except for the automatability outcome variable are z-score standardized, so that changes in the variables can be interpreted as changes in +/− standard deviation units, this was done to enhance the interpretation of the analyses.
Results
The bivariate correlation table (Table 1) shows that automatability is significantly correlated with all the other variables. Male representation (r = .202, p < .001) and visible minority representation (r = .163, p < .001) are positively correlated with automatability of an occupation, while income level (r = –.280, p < .001) is negatively correlated with automatability. These findings indicate support for Hypotheses 1 (b, c and a, respectively).
Mediation results
As shown in Figure 1, all human capital variables are significantly associated with automatability, with educational requirement having the strongest relationship (β = –.117). Of the hypothesized mediator variables, education requirement also has the strongest association with the independent variables (R2 = .365; F(3, 489) = 93.53), compared to R2 = .176 (F(3, 489) = 34.70) for experience requirement, and R2 = .136 (F(3, 489) = 25.63) for on-the-job training. Of the total relationship for income level (β = –.092), most can be explained by education requirement (β = –.064), with a considerably smaller portion being explained by experience requirement (β = –.014) and on-the-job training (β = –.006). There was no significant direct effect. Of the total relationship for male representation (β = .094), about half can be explained by education requirement (β = .051) and a small portion by on-the-job training (β = .010). (It should be noted that in contrast to education requirement, on-the-job training was positively associated with automatability.) There was no significant mediated effect for male representation through experience requirement with automatability, but a significant direct effect (β = .031). Of the total relationship for visible minority representation (β = .051), the only significant mediated effect was through experience requirement (β = .005), as most of the overall relationship was explained by a direct effect (β = .047). In sum, Hypothesis 2 is mostly supported, with education requirement being the strongest mediator, i.e. explaining most of the relationships between the independent variables and the dependent variable, with experience requirement a weaker mediator. On-the-job-training, with its positive association with automatability, was the weakest mediator in the opposite direction than predicted. For visible minority representation, the relationship was almost entirely direct, and for male representation, the direct effect was about the third of the overall relationship. All direct and indirect effects are illustrated in Figure 1.
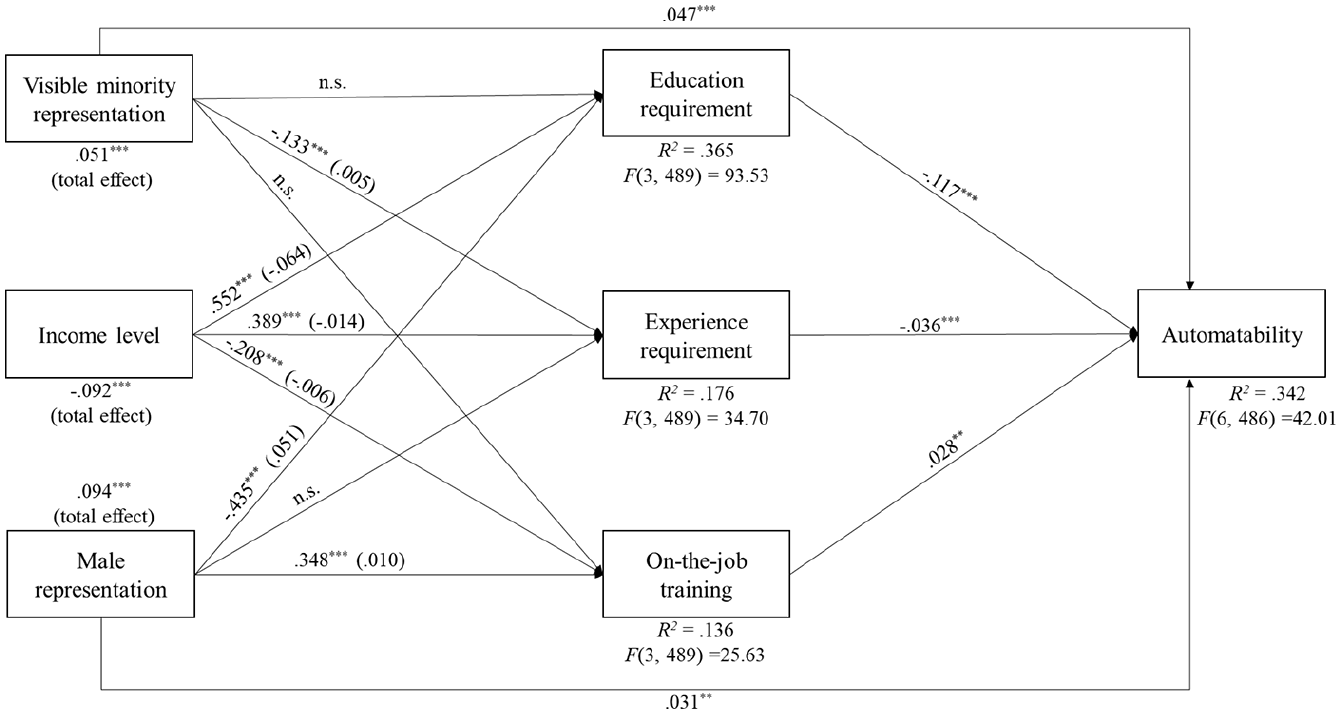
Unmoderated mediation model.
Moderated mediation results
As shown in Table 2, all the interaction terms were significant for at least some of the models. All interactions were significantly associated with educational requirement. For the experience requirement model (2), the interactions between income level and male representation and between income level and visible minority representation were both significant. For the training requirement model (3), the interaction between male and visible minority representation and the three-way interaction were negative and significant. As for the direct (not mediated) relationship with automatability, all interactions (except for between male and visible minority representation) were significant, at least at the p < .10 level. These results provide general support for Hypothesis 3.
Moderated mediation models.
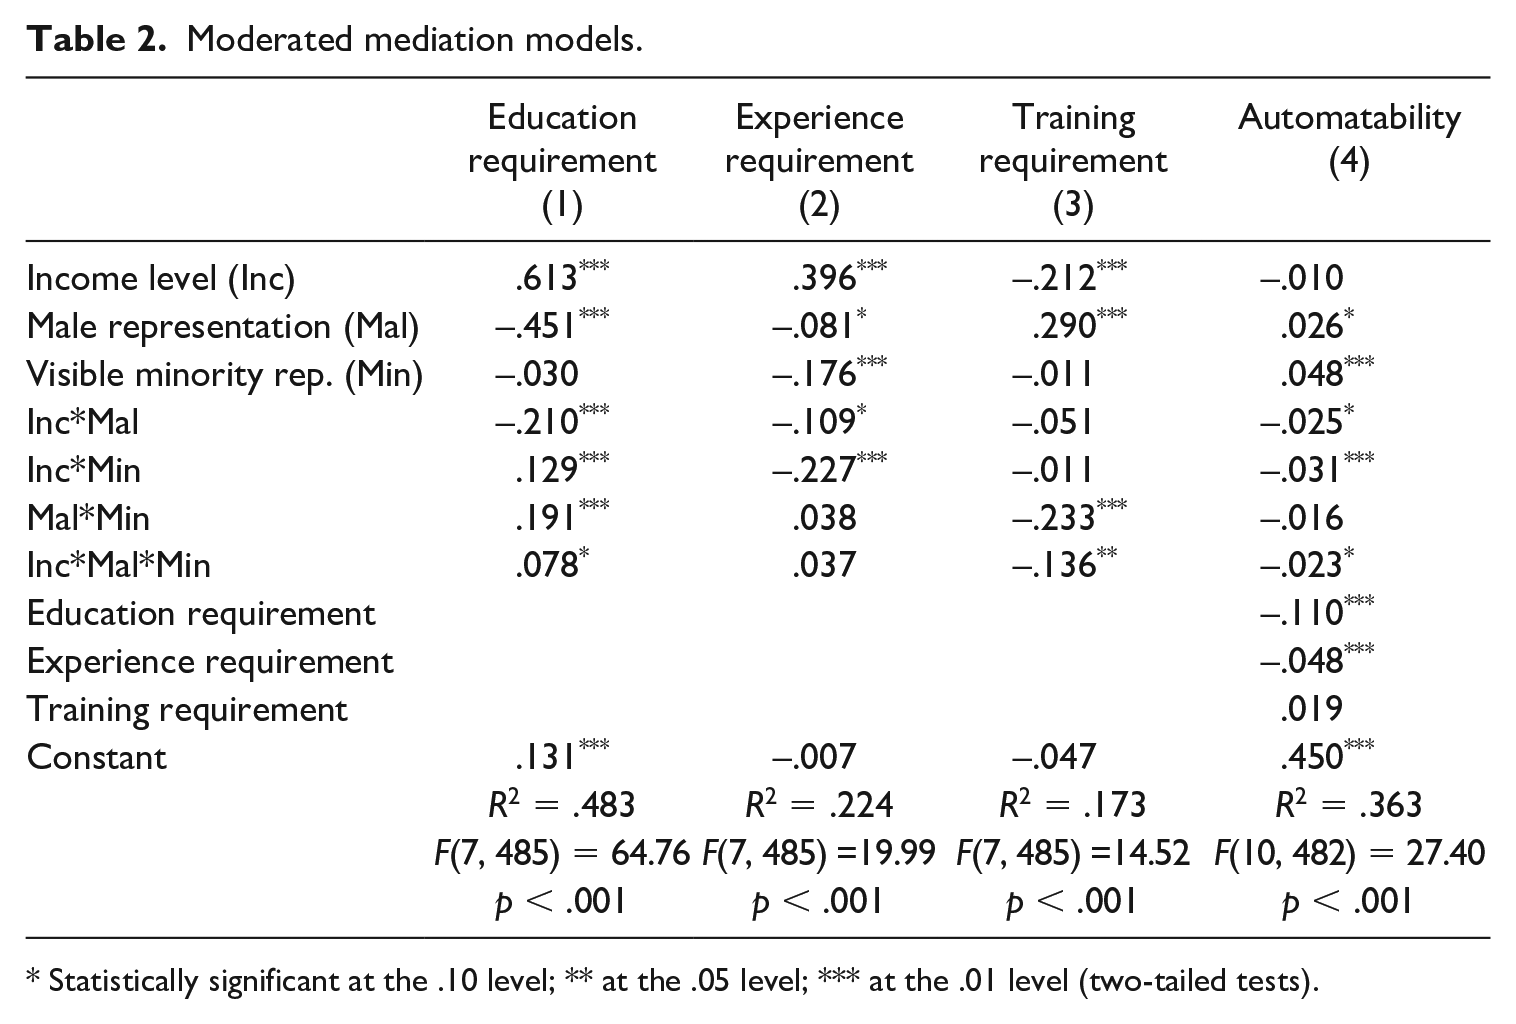
Statistically significant at the .10 level; ** at the .05 level; *** at the .01 level (two-tailed tests).
Intersectional effects
In this section, we probe the interactions, mediated and non-mediated, and each of the independent variables is presented in turn. Table 3 lists the direct and indirect effects (significant in bold) at various levels of the moderators. The output in Table 3 evaluates the strength (and direction) of the direct and indirect relationships between each of the focal variables (income, male representation and visible minority representation) and automatability. For each of the focal variables, Table 3 presents first the unmoderated effects (as in Figure 1), followed by the effects conditional on four possible intersecting combinations of low and high (e.g. 16th and 84th percentiles; in other words, these are conceptually similar to ± one standard deviation for a normal distribution) for the remaining variables. For each focal variable, as well as each intersection, Table 3 represents the total, direct and mediated effects. In the following paragraphs, we highlight some of the most important findings at the specific intersections that provide nuance and deeper insights beyond what the unmoderated results provide.
Direct and indirect effects for the automatability model moderated mediation.
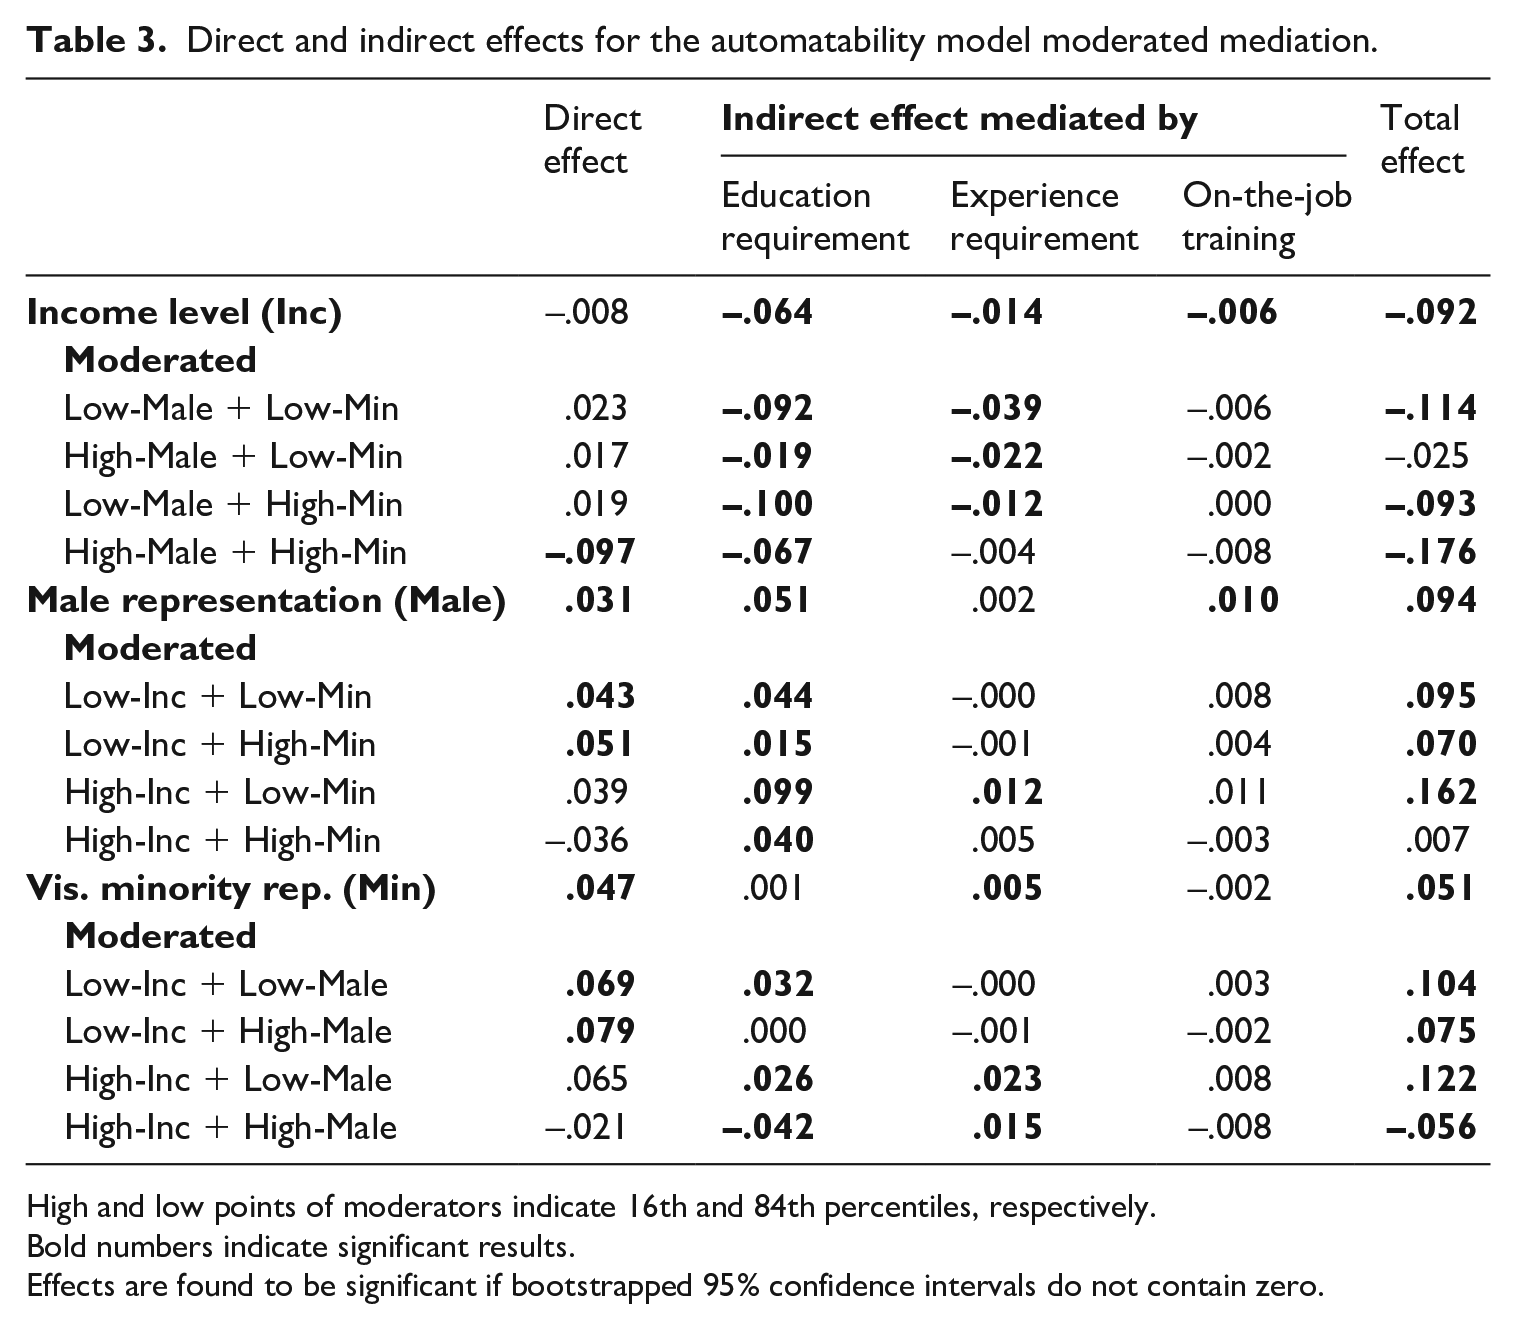
High and low points of moderators indicate 16th and 84th percentiles, respectively.
Bold numbers indicate significant results.
Effects are found to be significant if bootstrapped 95% confidence intervals do not contain zero.
Income level
For income, the effects at the various intersections for the most part mirror the unmoderated effects, illustrated in Figure 1. The main differences include a non-significant total effect among high-male, low-minority occupations (β = –.025, n.s.). There also is a much stronger total effect of income among high-male, high-minority occupations (β = –.176), of which the majority (β = –.097) is a direct effect, i.e. not explained by the human capital variables.
Male representation
For male representation, the unmoderated effects are partly echoed by the intersectional effects. For low-income occupations, the intersectional effects mostly mirror the unmoderated effects, but with education requirement only as a weak mediator (β = .015) for low-income and high-minority occupations. For high-income, high-minority occupations, there is no significant total effect, while the total effect is strongest for high-income, low-minority occupations (β = .162), the majority of which is mediated by education requirement (β = .099). In contrast with low-income occupations, there is no direct effect for high-income occupations.
Visible minority representation
The intersectional effects of visible minority representation provide less of a mirror of the unmoderated effects than was the case with income and male representation. Most notable is that while there is a positive relationship between visible minority representation and automatability at most intersections, the relationship is negative for high-income, high-male occupations (β = –.056, total effect). Also notable is that while education requirement proved not to be a significant (unmoderated) mediator, as it was with both income and male representation, it is a significant mediator for visible minority representation at specific intersections. Education requirement is a positive mediator among low-male occupations, both low (β = .032) and high income (β = .026), but a negative mediator among high-income, high-male occupations (β = –.042). The results also showed there to be no significant direct effect for high-income occupations.
Margin analysis
To examine the impact of the interactions on automatability more directly, we ranked the overall (not mediated) interactions in terms of their estimated risk of being automated (see Table 4). The median risk of automation is .460, which implies that for the typical occupation, 46% of tasks can be automated with the technology available today. These estimates vary significantly depending on the various interactions of the independent variables. The numbers in Table 4 illustrate the interactions at the selected low, median and high points (i.e. the 16th, 50th and 84th percentiles) of each variable. Of the occupations most likely to be affected by automation those with high male representation, high visible minority representation and low income rank the highest (margin = .676; i.e. 67.6% of tasks can be automated with the technology available today). In contrast, the occupations with the lowest risk of automation (.199) are those with low male and low visible minority representation, but with high income. If we look at the list of interactions, we see that of the six intersections most likely to be affected by automation (with an average automatability estimate of .600) five include high male occupations, four are low-income occupations, and five have either high or median visible minority representation. Of the six intersections least likely to be affected by automatization (with an average automatability estimate of .264), all are female dominated, most have low visible minority representation (3 low vs. 2 median, and 1 high), and most are high income (3 high, vs. 2 median and 1 low). Thus, examining the top and bottom five sets of automatability estimates enables the identification of the groups that are potentially most impacted by automatability.
Analysis of margin at various intersections of the independent variables.
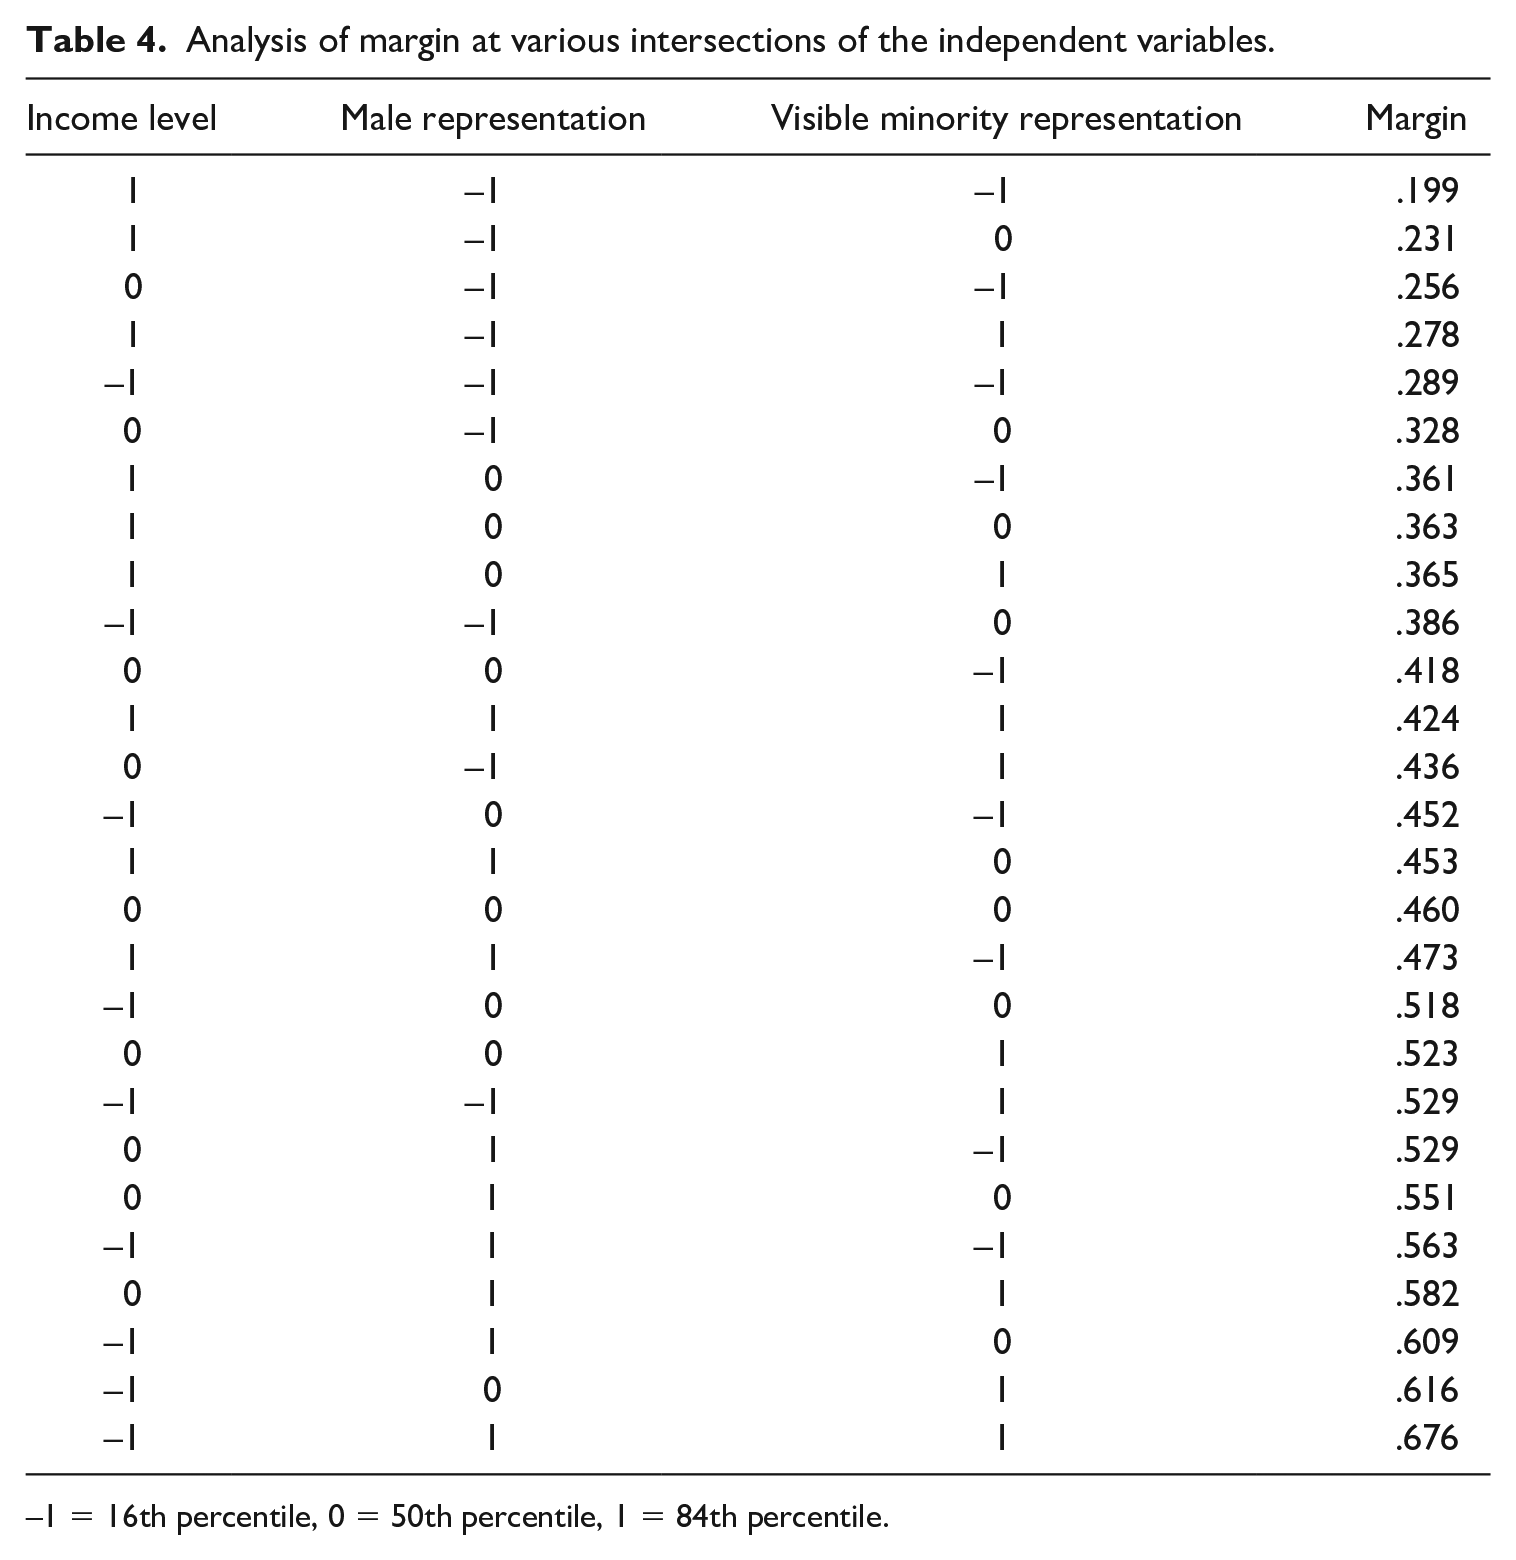
–1 = 16th percentile, 0 = 50th percentile, 1 = 84th percentile.
Discussion
The purpose of this article was to examine the degree of risk from automation across different population groups, particularly regarding the impact along the intersecting categories of income, gender and visible minority status. With occupations as the unit of analysis, the findings demonstrate that the risk of automation does indeed vary along these lines, with differences in automatability for the most part being explained by varying degrees of human capital, especially education. We found that low income, high male representation and high visible minority representation are all associated with higher risk of an occupation being automated. These findings are consistent with previous research related to income (Frenette and Frank, 2020), males (Pouliakas, 2018) and visible minorities (as a result of marginalization) (e.g. Han, 2020; Liu, 2019). However, the risk of automation varies greatly depending on the combinations of specific levels of characteristics for these same variables. In sum, the findings from this study show that occupations characterized by low income, high male and minority representation are at increased risk of automation. This risk is further amplified at the intersections of these categories, with some notable exceptions, such as high-income, minority, male-dominant occupations. Most of these relationships can be explained by the relative human capital (especially education) requirement for each occupation, except at some specific intersections (i.e. low income and visible minority).
Human capital explained all of the relationship between income and automatability, most of the relationship for male representation, and a portion of the relationship for visible minority representation. These findings are in accordance with the routinization hypothesis (Autor et al., 2003) and our hypothesis that those occupations with lower levels of routinized tasks would require a higher level of human capital, implying higher levels of human capital would be negatively associated with automatability.
Of the human capital variables, educational requirement was by far the strongest mediator, whereas experience and training, while significant, had very modest overall effects. In particular, the experience requirement was a more substantive mediator at some intersections of the independent variables, while training was not a significant mediator at any point. In contrast to education and experience, training had an overall positive association with automatability. This suggests that on-the-job training is more common in more routine (and manual) jobs that are more at risk of automation. This is perhaps unsurprising since organizations typically provide on-the-job training so that employees can develop organization-specific human capital; however, it is also likely that the capabilities that emerge from this training can be more easily automated when the processes are of a manual nature. This also reflects the finding of training being negatively correlated with both education and experience. Thus, education (and to a smaller extent experience) is a key factor insulating people from being affected by automation.
As reviewed in the literature above, labour-force participation and wage outcomes are in part determined by human capital levels, with higher human capital levels regularly leading to better labour market outcomes, at both the individual and societal levels. Our study identifies that these relationships also hold for the risk of automation. In other words, relatively higher human capital levels are generally associated with lower risk of automatability.
It is notable that occupations with a higher proportion of non-visible minority men, many in relatively well-paying jobs, appear to be significantly at risk of automation, despite being a group not generally associated with employment precarity. Again, the low education requirement for many of these jobs seemingly explains this risk, even though these occupations have traditionally not been considered precarious. Our findings suggest that increasing technological sophistication could gradually reduce the need for some of these occupations. We have already seen multiple examples of relatively high non-visible minority representation jobs being reduced in many sectors, with manufacturing being a prime example (Cellan-Jones, 2019). While non-visible minority men are commonly seen occupying a privileged position in society (e.g. Etchells et al., 2017), our findings suggest that their relative ease of getting into decent-paying occupations with little formal education (as per the findings in this study) makes them vulnerable to automation. This is in contrast to female-dominated occupations (including those with low human capital requirements) that are characterized by service and care tasks, which face a low risk of automation. Whether or not a population group has historically been marginalized or privileged, increased human capital, especially through education, is likely to provide strong protection against the risk of automation.
Non-human capital explanations
While the human capital factors appear as key variables in explaining automatability, the direct relationships (i.e. those not explained by human capital) need to be considered. These occur for visible minority representation, male representation, and at one particular intersection (high-visible minority and high-male) for income.
In terms of male representation, there is a direct relationship only for low-income occupations, indicating that the difference between the automatability risk between male and female jobs is less about human capital (especially education) differences, but rather differences in the routine (and manual) nature of these jobs. Our margin analysis demonstrated that low-income, male- and visible minority-dominated jobs were more at risk of automation. Even though human capital does not provide the full explanation for these particular occupations, increasing human capital will improve employment prospects in the face of increased automation risk, as it will help individuals into occupations that are less at risk. This is also the case for men in low-income occupations (and to some extent median income, except median-income, high-minority), and while education does provide some of the explanation at this intersection, it appears that men are at greater risk because the occupations they are typically drawn to tend to be more manual and routine than the female-dominated occupations. This difference does not exist for higher-income occupations where education provides almost all the explanation for automatability risk, or lack thereof. Finally, there is the direct negative (i.e. reduced risk) relationship between income level and automatability that only exists for high-male and high-minority occupations.
This study’s findings correspond with the prior literature which suggests visible minorities tend to be over-represented in more precarious jobs (Chui and Maheux, 2011) and at greater risk of job disruption and redundancy (Means, 2017), including the risk caused by technology and automation. However, this appears not to be the case for higher-income occupations, mainly as a result of the higher human capital associated with those occupations. Thus, there appears to be a strong polarization in the visible minority labour market where many who are better paid and more highly educated face substantially lower risk of automation while those at the low-income end of the spectrum (especially males) are at the most risk of all the intersections investigated in this study. As human capital provides only a negligible portion of the explanation for the risk to low-income visible minorities, it suggests that there are alternative factors at play, which may include possible systemic or even direct discriminatory factors (e.g. Chui and Maheux, 2011). Given the scope of this study, the exploration of alternative explanatory factors is left to future research. One factor that should receive more attention in future research is the problem of recognition of foreign credentials, something that appears to be a bigger problem for visible minorities than for non-visible minority immigrants (Krysa et al., 2019). This finding aligns with some of the critiques of human capital theory as an extension of the neo-classical assumption of individuals as free agents, thereby ignoring the systemic barriers that exist (Galabuzi, 2006).
Policy implications
The policy implications emerging from our findings can be varied, and could include immigration policy, minimum wage, collective bargaining, and possibly also universal basic income, for example. However, for brevity, we focus on human capital and educational issues, while these other policy-oriented topics are left to future research. While automation may not (depending on whose projections come to pass) lead to a net decrease in the need for human labour, it seems clear that future labour markets will require an increased number of workers with higher education (or even new forms of credentialed learning), something that will be of both individual and societal benefit (Riddell, 2006). The question is then: how are we as a society to achieve such an increase in human capital?
Formal education is one of the main ways human capital can be increased. Improved formal education levels are critical because, in addition to low-education occupations being the most at risk of automation, the growth in future employment that comes from technological advancement will in most cases be in higher-skill occupations with higher education requirements. Furthermore, general education attainment is an indicator of trainability and a signal for unobserved productivity, and thus people with formal education will (or at least be perceived to) be better able to adapt to work with new technology (Riddell, 2006).
The idea of building human capital to improve labour market outcomes (Riddell, 2006) and employability (Smith, 2010) can be illuminated with a comparison between labour market policy regimes. The contrast is illustrated by the labour market policies of ‘coordinated market economies’ (CMEs; Hall and Soskice, 2001), such as in Scandinavian countries, versus the ‘liberal market economies’ (LMEs), such as in the USA, Canada and the UK. CMEs will tend to see education and other human capital development as a collective state responsibility, while LMEs will leave this more as a responsibility of individuals, a trend that is increasing in the context of the individualized ‘new economy’ (Smith, 2010). This difference is demonstrated in the different approaches to the funding of higher education, where CMEs often will have free tuition and generous education grants, while LMEs typically will have high tuition costs to be paid by individual students and most financial support of students comes in the form of loans rather than grants.
Leaving human capital investment decisions and outlays mainly at the individual level raises several concerns. First, individuals of a young age, which is when most education decisions are usually made, will rarely have a clear sense of what exact skills will be in demand one or two decades (or more) in the future. Second, from a cost-benefit perspective, education may not be a worthwhile investment for those who have a decent-paying job as an immediate alternative. This may be the case, even where education is heavily subsidized, though more affordable education will certainly shift the cost-benefit equation toward education. Finally, for many, vocational training that leads directly to a job is going to be seen as a better investment in the short to intermediate term. Given these realities, one could imagine a greater role for coordination between governments, industry and individuals to have a more focused macro talent management approach (King and Vaiman, 2019).
It is worth stressing that pursuing higher education, however, is not always a choice individuals are in a position to make. Many individuals, especially those from marginalized segments of society, do not have the social, economic, or even cultural capital (Bourdieu, 1977) to be in a position to build human capital (such as through training; e.g. Lindsay et al., 2013). As we have discussed, these individuals are already marginalized in terms of their lower-income status and precarity of work, and risk of automation, as our results indicate, is likely to marginalize them further. Thus, if countries are serious about trying to mitigate the risks from automation, they will have to engage in planning, policy development and effective implementation that, at least in part, consider a macro-level human capital talent management strategy for the country (e.g. King and Vaiman, 2019).
Conclusion
Our findings have illustrated how the lens of intersectionality (Kronberg, 2014) aids in shining light on population groups that are at significant risk of automation. While we find human capital to be an important protection against such risk, it also appears that other factors may be at play, such as possible systemic or direct discrimination. Intersectionality provides a more nuanced understanding of the role human capital plays in the future of work, as it relates to technological development and automation. By choosing the occupation as the unit of analysis, this study has been able to contribute to the literature by demonstrating strong aggregate-level patterns of the impact of automation; and as such, it provides a solid basis for future research that could examine more individual-level factors thereby enabling a more nuanced exploration. While this study is based on Canadian data, we believe the findings will be representative (and replicable) of the phenomenon in other similar jurisdictions. In fact, Canada is well-suited for this study due to its high ethnic, cultural and racial diversity, especially in terms of the broad range of human capital attained in the visible minority population.
Footnotes
Declaration of conflicting interests
The authors declared no potential conflicts of interest with respect to the research, authorship, and/or publication of this article.
Funding
This project received financial support from Petroleum Research Newfoundland & Labrador, Atlantic Canada Opportunities Agency, Mitacs, Memorial University of Newfoundland, and the Munk School of Global Affairs, University of Toronto.