
Abstract
The Swedish Model on the labor market has been celebrated as a way to combine mobility with low unemployment and small wage gaps. As part of the model, relocation allowances were pioneered from the late 1950s. The program expanded thereafter and as much as 1% of the population in the high-unemployment north moved with assistance in the 1960s. Today, migration incentives are discussed to address pressing unemployment problems in Europe and the United States. What can Sweden’s experience tell us about the prospects of such programs? This article studies the usage of relocation allowances through a case study of Västernorrland County from 1965 to 1975. The analysis shows that there was a strong selection into the program by younger persons, recent graduates and from sectors with good employment prospects. The experience from Sweden highlights the difficulty of implementing programs to induce migration for those with the highest risk of unemployment.
Introduction
Adjusting to structural changes by shifting labor out of declining industries and into expanding economic activities is necessary for fast growth and low unemployment. These processes are not spatially neutral but entail large migrations from places with contracting employment to those with a shortage of labor. In the United States, most of the regional adjustment to such shocks have historically taken place through lower incomes and out-migration. In continental Europe, in contrast, migration has been less responsive, which has come at the cost of larger differences in unemployment and labor force participation across regions (Blanchard and Katz, 1992; Decressin and Fatás, 1995). While Americans still are more willing to migrate than Europeans, there is also increasing evidence that internal migration in the US has been falling steadily over the last couple of decades, which has resulted in increased worries of polarization between places with rapid income growth and those falling further behind (Kaplan and Schulhofer-Wohl, 2017). In this context, the Swedish Model has been viewed as a possible alternative (Freeman et al., 1997). The model was based on the notion that mobility from high- to low-unemployment areas could be achieved without large wage differentials if active labor market policy was used to aid in the movements across places (Storrie and Nättorp, 1997).
Sweden pioneered the use of relocation allowances on a large scale from the late 1950s. While the Swedish Model and the associated labor market policies have received a lot of attention in the research literature, very little is known about the actual implementation and effectiveness of this program, especially in regard to what role it played for the large out-migrations from northern Sweden in the 1960s. At this time, as much as 1% of the population in the northern counties, where unemployment was high relative to the expansive south, moved with support from the program. However, subsequently, the program was downsized, in part as a response to political pressure, and in part because internal migration fell overall in the 1970s (Molinder, 2018; Molinder et al., 2017).
In Europe and the United States, pressures from technological change and international trade have reduced employment opportunities in regions reliant on old industries while jobs are growing rapidly in urban areas specialized in human capital-intensive sectors. In this context of increased polarization of incomes and unemployment across places, mobility subsidies have been discussed by researchers and policy makers alike as a possible way to increase migration and to reduce regional disparities (Bell et al., 2018). A research report presented to the European Commission suggested, for example, that costs related to moving make it a good policy to compensate job-seekers through economic incentives to move (Bonin et al., 2008; see also Baas et al., 2014). However, the report also cautions that ‘[t]o avoid deadweight loss, these measures have to be targeted properly’ (Bonin et al., 2008: 121). Similar ideas have been presented recently for the United States as well (see for example Banerjee and Duflo, 2019; Moretti, 2012). Moretti (2012) writes, for example, that in order to induce mobility: ‘Unemployed people living in areas with above-average unemployment rates should receive part of their unemployment insurance check in the form of a mobility voucher that would cover some of the costs of moving to a different area’ (Moretti, 2012: 162).
The discussion to date, however, lacks perspectives from previous attempts to introduce mobility subsidies. So far, relocation assistance has only been tried on a small scale in Europe and the United States, meaning that Sweden in the 1960s is the only case that can inform us of the potential effectiveness when expanding the program to affect a larger fraction of the workforce. Given this new interest and the potential pitfalls, what can the experience from Sweden’s pioneering period tell us about the prospects for such programs today?
In this article, the Swedish experience is analyzed through a case study of Västernorrland County during this pioneering period. Västernorrland was one of the northern counties that experienced substantial out-migrations in the 1960s. While the focus is on one specific county, my belief is that the results show parallels to a broader context of migration. To study the implementation of the program, I draw on previously unused material from the County Labor Market Board of Västernorrland (Länsarbetsnämnden i Västernorrland) on all persons receiving any form of relocation allowance in 1965, 1970 and 1975 as well as information on persons registered as unemployed at the public labor exchange in the county in November of 1965 and 1970. The dataset allows me to track who moved with an allowance during those years and in what county and sector they ended up after the move. I observe this from the peak in out-migration in the mid-1960s to the turnaround in the 1970s, when Västernorrland along with the other northern counties instead became net receivers of internal migrants. The information from both the relocation allowances and registered unemployed at the labor exchange office gives a unique possibility to compare the age and sector composition of the two groups.
To look at the patterns of allowance migration in Västernorrland, I will use two complementary approaches. The first is to examine the general patterns by cross-tabulation for ages, sexes, and industries. This approach will provide an overview of the basic patterns so I can compare the allowance migrants both to the general workforce and to the unemployed. The second approach is to use multinomial regression. By applying this technique, the outcome of interest can be related to several underlying variables (such as age, sex, occupation, etc.) instead of just a few such variables, as the case with cross-tabulation. This will give a more precise picture of the factors that account for the choice that individuals made.
The joint result from these two approaches indicates that the age structure of allowance migrants in Västernorrland followed very closely that of regular migrants, and that they were substantially younger than the unemployed. Thus, the clear discrepancy in terms of age between those registered as unemployed and those receiving relocation allowances suggests large deadweight losses with support given to those that are likely to have moved anyway.
The same is true for sectors. The cross-tabulation indicates that positive employment prospects in the sector outside of Västernorrland played a larger role than the unemployment situation in the own sector within the county. Therefore, the policy does not seem to have been particularly effective in selectively migrating unemployed workers from declining sectors into expanding ones in other parts of the country.
In total, the results show the difficulty of designing and expanding relocation assistance programs that effectively target the unemployed and which avoid deadweight losses though subsidies of moves that would have taken place anyway.
The rest of the article is organized in the following way. The next section surveys the literature on the Swedish Model and subsidies to mobility. Then, I present the data material from the County Labor Market Board of Västernorrland that I use in this article. After this, the case of Västernorrland is presented. In the fifth section I present the results by cross-tabulation. After presenting the results by cross-tabulation, I continue by using regression analysis in the sixth section to extend the tabulations. Finally, in the final section, I discuss the results and conclude.
The Swedish Model, mobility subsidies and regional migration
In the early postwar period, unemployment in Sweden fell to a record low and the pressure on wages and prices grew. In an attempt to curtail these inflationary pressures, the Trade Union Confederation (LO) agreed to a wage freeze in 1950, but the only result was that prices ballooned when wage negotiations were once again freed. This made the two trade union economists Gösta Rehn and Rudolf Meidner doubtful about the prospects of wage restraint as a way to maintain low inflation and export competitiveness. Instead, they suggested an alternative path which was presented comprehensively for the first time in a report to the LO congress in 1951 and further developed in a report for the congress in 1961 (LO, 1951, 1961).
Their plan, often referred to as the Rehn–Meidner plan or simply as the Swedish Model, sought to combine full employment with low inflation, small wage differentials and rapid real-wage growth. It had three pillars. First, centralized wage negotiations between LO and the Employers’ Association (SAF) should be used to facilitate a rational wage structure according to the principle of ‘equal pay for equal work’, independent of the geographical location of the worker or the ability to pay by the individual firm. Second, a tight fiscal policy should ensure that inflationary pressures were mitigated. Third, workers that were dismissed in regions with declining employment and unproductive firms should be relocated to expansive regions and industries through state expenditure on active labor market programs (ALMPs), especially retraining programs and mobility subsidies (Erixon, 2001, 2010; Hedborg and Meidner, 1984). As a consequence of the wage policy of solidarity, active labor market policies with the aim to improve labor-market mobility were needed to stimulate the reallocation of labor to expanding industries and regions. The plan built on the notion that policies should increase security on the labor market rather than at the current job (Erixon, 2018). This sentiment was echoed in the 1961 LO report stating that: ‘It falls on labor market policy to make the necessary adjustment attractive for workers through the use of positive mobility incentives’ (LO, 1961: 144).
By the mid-1950s, the program had won support from the Social Democratic government and during the recession of 1957–1958 expenditures on active labor market policies increased significantly (Rehn, 1988; Wadensjö, 2001). Evidence of the extent to which the Rehn–Meidner plan now influenced government policy can be found in the conclusions from the parliamentary committee with the task of working out the principles for an economic stabilization policy. Their final report read: ‘In a full employment society an active labor market policy, with the aim to achieve higher and constantly maintained labor mobility, is one of the most important tools of economic policy’ (SOU 1961:42: 257).
The emphasis on labor mobility was strongest in the 1960s, while sentiments shifted in the 1970s. Responding to intensifying critiques of the strong emphasis on regional relocation, there was an increasing will from politicians to conserve the regional population structure and to lessen the emphasis on geographical mobility. The focus of public policy thus shifted from incentives to migration towards training and stimulation of local demand though regional subsidies and government takeovers in sunset industries (Erixon, 2018; Molinder et al., 2017). Erixon (2010) consequently denotes the period from 1956 to 1973 as the ‘Golden age’ of the model.
A program of mobility subsidies, such as the relocation allowances in the Swedish case, can be understood theoretically from several viewpoints. One view presupposes some sort of externality from mobility that does not accrue directly to the individual. These externalities come in two forms: those that exist naturally and those that exist because of public policy interventions (Bonin et al., 2008). Public support schemes, such as unemployment insurance and other welfare provisions, are indirectly subsidies to immobility, and relocation allowances have been suggested as a possible remedy for this distortion (Janiak and Wasmer, 2008). By creating a wedge between the benefit for the individual and for society, mobility becomes less prevalent than would be optimal for the economy. From society’s point of view, it could therefore be worthwhile to subsidize mobility if the subsidy could be targeted to persons that at present are indifferent between staying or moving.
Recently, the meaning of these ‘natural’ externalities has been given more attention in the research literature. This has been aided by the increased interest in the role of networks in the labor market (Beaman, 2016; Granovetter, 1973). These theories introduce two types of externalities: network and neighborhood. Network effects result from information about, for example, job openings circulating amongst an individual’s social contacts. Neighborhood effects are a specific type of network effect resulting from people interacting more with those in the same geographical area. If, for example, employers use a parochial rule of thumb when recruiting, they may disregard applicants from a certain area based on the average characteristics of people in that neighborhood. In practice, these two forces exist simultaneously and interact with each other to produce network externalities. If a person’s social network consists disproportionally of people living in their proximity and there is a large plant closing, the quality of the individual’s referral network will deteriorate. The spatial mismatch between workers and firms is reinforced since the social network is tied to an area where jobs are no longer available. In this context, the role of public labor exchanges in matching workers and firms across space is obvious; if combined with subsidies to migration, it is a way to reduce the cost of disconnecting from the local social network (Topa and Zenou, 2015).
The potential effect of mobility subsidies can also be understood from the perspective of search and matching models of the labor market. In such models, an individual looking for a job chooses in each period between continued search or accepting a job offer, and the search takes place both in the home region and in other geographical areas. The individual’s reservation wage is determined in the model by the distribution of wage offers, the amount of offers available, the discount rate, the cost of searching and the alternative cost of continuing to look for jobs. The alternative cost of continued search is then the income that the individual forgoes by not accepting a job offer less the cost of moving and the value of the time in unemployment (see for example Mortensen, 1986; Rogers, 1997). Factors such as subsidies to mobility that lower the cost of migration can in this case affect the likelihood of finding employment in two ways. First, by increasing the alternative cost of continued search, and second, by stimulating individuals to allocate a large share of their search effort to outside regions (Lindgren and Westerlund, 2003).
There are several reasons why those with the smallest job prospects in the home region are also those that are the hardest to target using mobility subsidies. Demand for an individual’s labor is also a key determinant in the job finding process and there are many reasons why certain individuals might find it harder to find employment. Employers, for example, often discriminate against certain job applicants. There is ample evidence showing that the elderly are less likely to receive callback from a job application than younger individuals (Ahmed et al., 2012; Baert, 2018). Given the significant transaction costs involved in the hiring decision, the incentive to migrate is also larger for young workers than for older, since the latter will reap the benefits of a new job for a much shorter period (Becker, 1964; Schultz, 1961). This, of course, influences the willingness to migrate to find a new job.
Given the many difficulties facing the most vulnerable groups on the labor market, the Swedish pioneering experience with mobility subsidies took place under relatively beneficial circumstances. During the 1960s the labor market in southern Sweden was very tight, unemployment in the southern regions reached below 1% in many years. Consequently, there was less scope for employers to be meticulous about who to hire. In Europe and the United States today, even in the tightest regional labor markets, unemployment seldom falls below 2% (Eurostat, 2020; US Bureau of Labor Statistics, 2021). Positive selection into the Swedish program of mobility subsidies by younger individuals and those with relatively good labor market prospects would thus be a signal of the difficulty of selectively migrating just the precarious labor force that were the real target of the program. Given the low level of unemployment at the time, the prospects for employment for these groups subsequent to migration would likely have been better in Sweden in the 1960s than they are in most cases today.
The few direct evaluations of the Swedish program of relocation allowances have suggested small or nonexistent effects (Storrie and Nättorp, 1997; Westerlund, 1998). Nevertheless, recent developments within the empirical evaluation literature suggest that we might need to reconsider these older findings. Starting in 1998, Germany has introduced a program of mobility subsidies that was later expanded as a part of the larger supply-side oriented ‘Hartz Reform’ of the labor market. A recent evaluation of the German program by Caliendo et al. (2015), which pays careful attention to problems with selection into the program, found positive effects on the probability of employment and that more time was spent in job search in distant labor markets. A large recent survey of the literature on labor market policy also suggests that public job-creation schemes have no or negative effects on employment while job-search assistance, training and subsidizing mobility are effective (Bonin et al., 2008). Caliendo et al. (2017), looking at the German program, argue that given the large costs of vocational training, relocation assistance is a more effective program. They find that the positive return of relocation assistance does not differ between demographic and labor market groups, but that there is a strong selection into the program of younger and higher educated workers without family. Their conclusion is that the program should be targeted and expanded to groups outside the regular recruitment base. What can the Swedish experience teach us about the prospect of such an expansion?
Data
I make use of three sets of data. The first set consists of primary material from the County Labor Market Board of Västernorrland on all persons granted any form of relocation allowance in 1965, 1970 and 1975. The second set consists of primary material on all persons registered as unemployed at the public labor exchanges in Västernorrland from the same source for the month of November in 1965 and 1970. Unfortunately, no comparable data exist for 1975. The third set consists of secondary printed information on demographic and industry characteristics at the county level in Sweden in 1965, 1970 and 1975. These data come primarily from the Population and Housing Census published by Statistics Sweden (SCB). These are used to compare the county of Västernorrland with other parts of country as well as for the comparison of the allowance migrants and the unemployed to the general workforce.
The lists on persons granted relocation allowances and on registered unemployed from the County Labor Market Board of Västernorrland are printed as reports for every month and were sent in from each local labor exchange office. The number of offices in the county varied from 16 in 1965, 13 in 1970 to seven in 1975. The total number of persons that received an allowance was 2,539 in 1965, 2,383 in 1970 and 1,712 in 1975. The reports for 1965 give information for each person granted an allowance: the date of birth, occupational code before the move, sex, sector of the new job and receiving county. In addition to this information, the lists for 1970 and 1975 also give information on the occupation after the move and the sector the person belonged to before the move.
The lists with information on persons registered as unemployed at the local labor exchange office were produced and coded in a similar way. Due to the workload involved in hand coding these data, it has only been possible to extract the information for one month each year. November was chosen for two reasons. First, it is the same month that the census was taken. Therefore, if there were changes in employment and demographic structure during the year, the figures for November should be the most comparable with the census. Second, November represents an average month in terms of seasonal unemployment, which was present especially in the construction sector and in agriculture.
Once the information on the lists was hand coded, the data were processed in a number of ways before any analysis was done. First, it was necessary to rearrange the sector classification. While continuous between 1965 and 1970, the classification was changed between 1970 and 1975. For this reason, the sectors have been reorganized to ensure the highest possible comparability over time. For all three years, the sectors are grouped into those shown in column 3 of Table A1 in Appendix A. For convenience, the sectors have been further aggregated to the one-digit level, shown in column 2, as well as the broad classification into the primary, secondary and tertiary sectors shown in column 1.
The information on occupation (before the move in 1965, and before as well as after the move in 1970 and 1975) is coded according to the Nordic Classification of Occupations scheme (Nordisk yrkesklassificering: NYK). The occupational codes consist of three characters denoting the person’s occupational category and is followed by a punctuation mark and number for the exact occupation. Table A2 in Appendix A shows the occupational codes at the one-digit level.
The program of relocation allowances
The relocation allowances came in many forms, but the starting assistance grant (starthjälp) was by far the most important program in terms of both quantity and cost. It stood for about 90% of all cases and 93% of costs in the present dataset. However, the program of relocation allowances also included the travel grant (respenning) and the staying away grant (bortavistelsebidrag) which was replaced in 1966 by the family grant (familjebidrag). A relocation allowance was meant to be given to a person who was either unemployed or at risk of being unemployed or could be assumed not to be able to find work in proximity to the place of residence. Support could be given to recently graduated students if there was high unemployment in their field or in ‘special circumstances’ (AMS, 1972: 35–36). Both AMS nationally and the local county labor market boards were given great liberties in the implementation of the specific programs.
The travel grant, in turn, consisted of coverage for travel costs (reskostnadsersättning), a daily allowance (traktamente) and compensation for moving (flyttningsersättning). The coverage for travel costs could be given for journeys to the prospective new employer if it was necessary for the recruitment to take place and for travel upon starting the new job. It could also be given for daily travel costs between the home and the working place for a maximum of three months. The compensation for moving could be given to compensate for ‘reasonable expenses’ in connection with the move to the new home. Daily allowance was given to cover costs associated with trips during the job-seeking process. The travel grants were less generous than the moving assistance, but the conditions for receiving it were more liberal. The staying-away grant and family grant could for example be given to a head of household that had to live in two places for a period of time (Olli Segendorf, 2003: 92–105; Storrie and Nättorp, 1997: 56–62).
Table 1 shows the median and mean amount paid each year in the dataset, given in 2016 Swedish kronor. The first thing to notice is the increase in the median and mean between 1965 and 1970 and to a lesser extent between 1970 and 1975. The second point is the absolute level of the grant; as a reference the yearly mean wage within the SAF–LO frame agreement in 1970 was SEK 215,000 and SEK 245,000 in 1975, both in 2016 amounts. The second column in the table also gives information on the usage of the program in Västernorrland. The ‘Out-migrants’ column shows the total number of people who moved out of Västernorrland each year and the number who did so with the support from the program for relocation allowances. As indicated in the table, there was a drop in out-migration by about 20% between 1970 and 1975, but this was also reflected in a corresponding drop in the number of allowance out-migrants. Thus, the share of people who moved with support from the program remained constant at about 20%. The third column shows the number of persons who moved within Västernorrland using the program. While there are no comparable data for regular migrants in this case, the number of within-county allowance migrants dropped in a similar way to the number of out-migrants between 1970 and 1975, suggesting that the pattern was similar for this group. When interpreting the results, it should therefore be kept in mind that the economic situation differed between the three years. For example, business cycle conditions varied, with the tightest labor market in 1965 and somewhat higher unemployment in 1970 and 1975 (Forslund and Holmlund, 2003). This, of course, also affected migrants’ probability of finding a job subsequent to the move.
Cost for relocation allowances and number of regular and allowance migrants, 1965, 1970 and 1975.
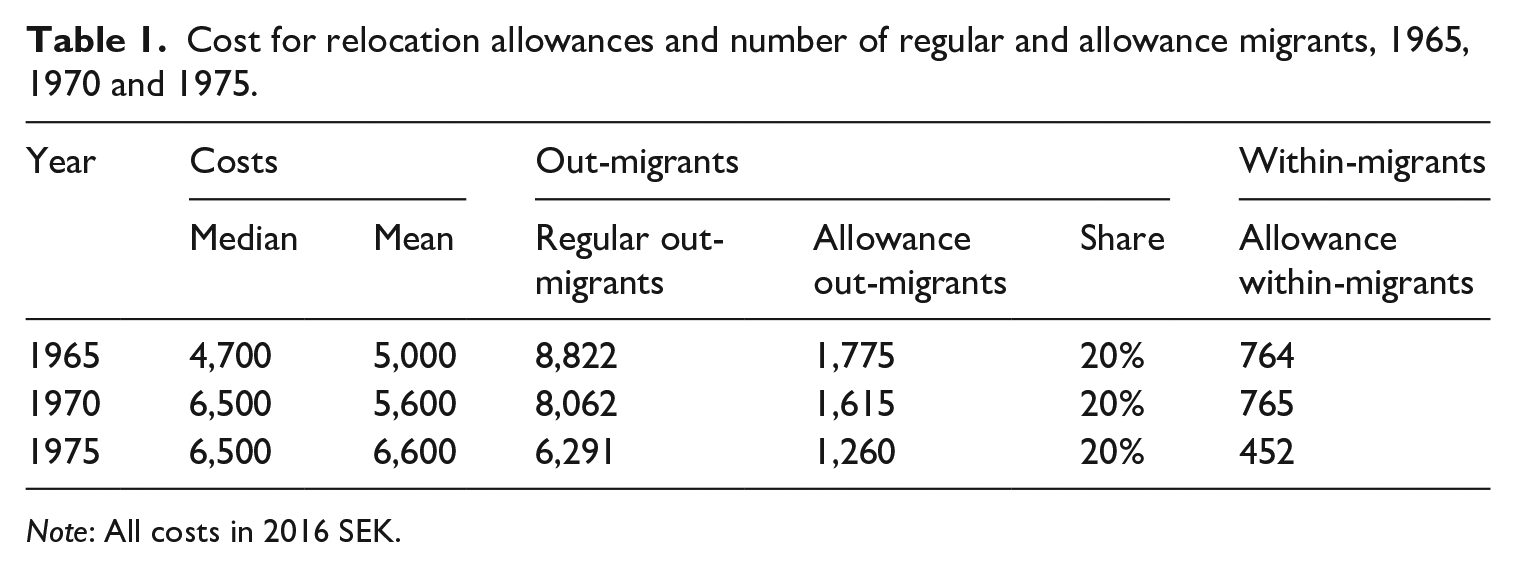
Note: All costs in 2016 SEK.
The case of Västernorrland in context
In this section, the case of Västernorrland is presented in greater detail. The county of Västernorrland is situated to the east in the geographic center of Sweden. It is one of the four Norrland counties along with Jämtland, Västerbotten and Norbotten. These counties are unique in Sweden due to their late settlement by migrants from the southern part of the country. The distribution of population and industries in the county has been strongly tied to its two most prominent natural resources: water and forests. This is evident from the map in Figure 1b. The urban centers are all situated alongside one of the rivers that flows from the inland to the sea. The three biggest cities, Sundsvall, Härnösand and Örnsköldsvik, are all located close to river mouths.
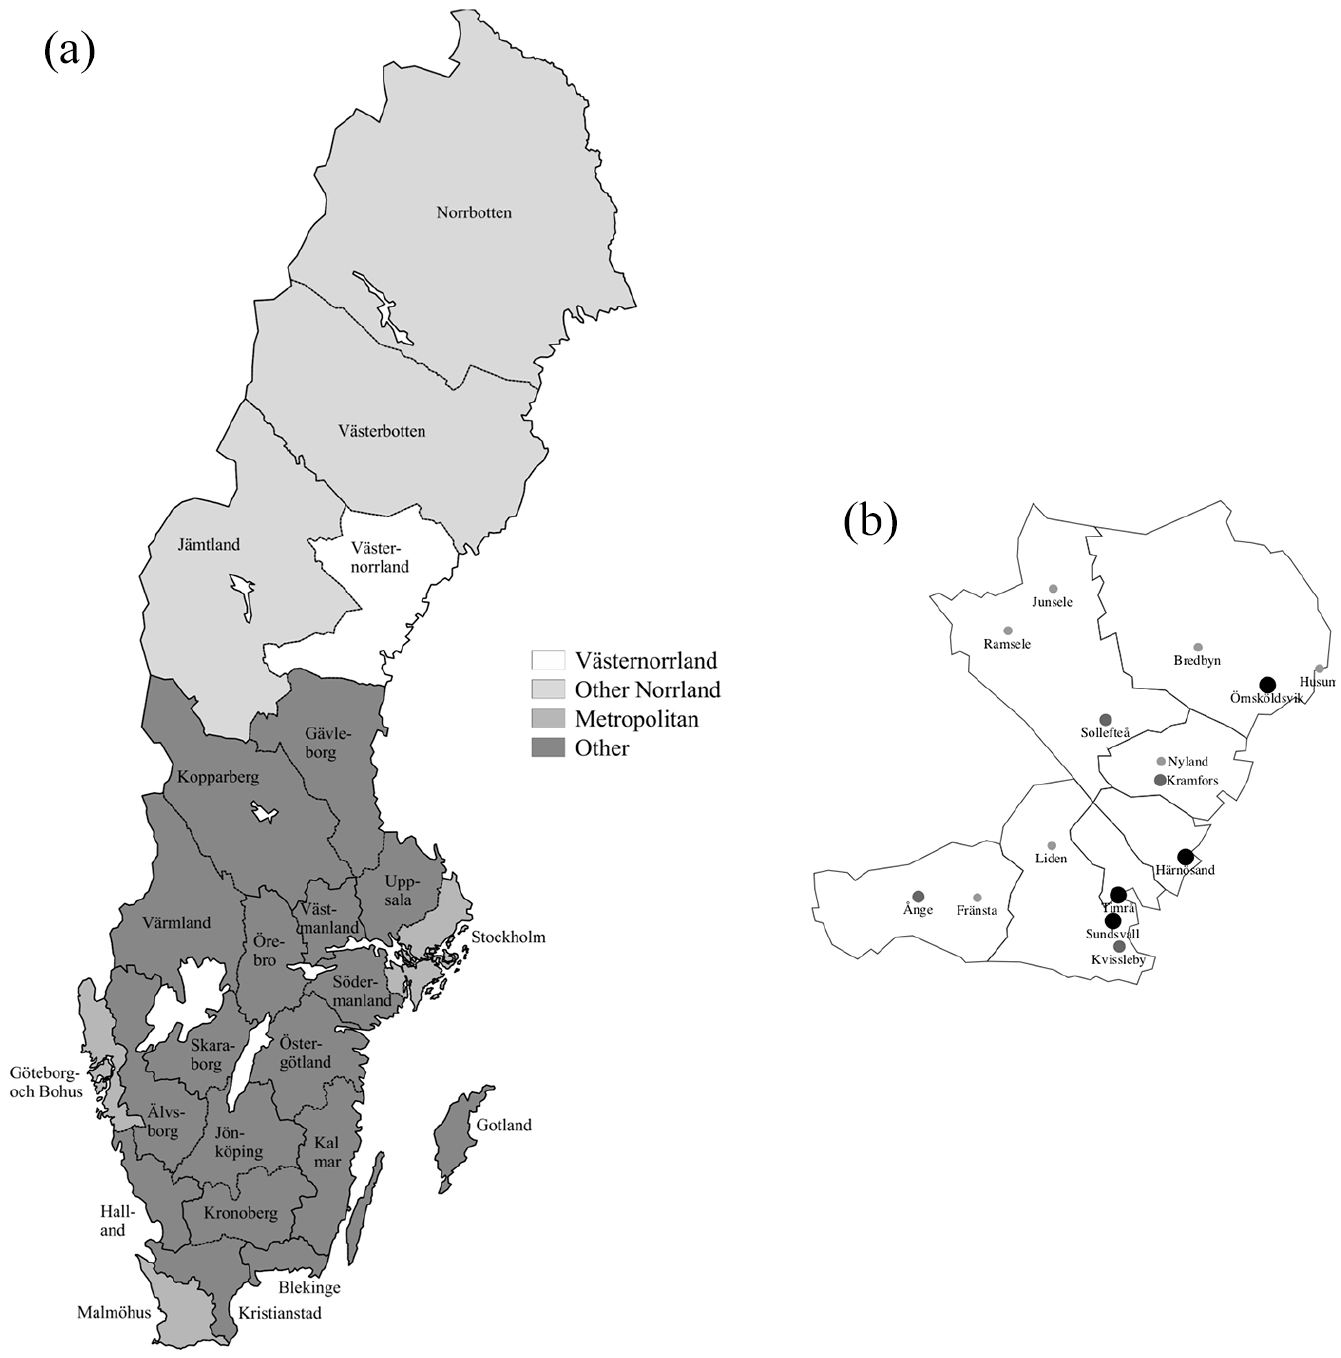
Map of regional division and map of Västernorrland with municipality borders.
Figure 1a shows the regional division used in the article. It groups the counties, excluding Västernorrland, into three groups: the Other Norrland counties, Metropolitan counties and Other counties.
In terms of migration, the development for Västernorrland followed the general pattern for the Norrland counties during the postwar period. In the 1950s, there was slow but consistent net migration out of the county at around −0.5% of the population each year, but in the early 1950s the situation was slightly better in Västernorrland than in the Other Norrland counties. In 1952, the county even registered positive net migration. In the early 1960s, the situation worsened in all the Norrland counties, in many cases reaching −1% of the population per year. While the situation improved slightly in the later part of the 1960s, net migration remained strongly negative throughout the decade. Around 1970, however, there was a swift change in migration patterns, as net migration became positive. This was mirrored by negative net migration from the Metropolitan counties for the first time in the postwar period. In 1975 Västernorrland, as well as the Other Norrland counties registered positive net migration rates at around 0.25% while the Metropolitan counties saw a negative net migration rate approaching −0.5%.
What did the employment structure look like in 1965? The reliance on agriculture was still relatively strong in Norrland. Within the manufacturing sector, there were also some notable differences between Norrland and the Metropolitan counties. First off, the Metropolitan counties were more specialized in consumption industries, such as food and textiles, and in the engineering industry, while the Norrland counties were more specialized in the wood industry. Västernorrland also stands out from both the Metropolitan and the Other Norrland counties with its strong specialization in the pulp industry. This industry was characterized by large energy-intensive plants located along the mouths of the large rivers, where they had easy access to the raw material as well as cheap energy and overseas markets.
Characteristics of allowance migrants compared
Who were the allowance migrants? To consider the success of the Swedish subsidies in targeting those that were not likely to have moved in the absence of the program, in this section I compare the age and sector of allowance migrants to regular migrants and the unemployed.
Figure 2 compares the age structure of allowance migrants to regular migrants and to the unemployed in November of 1965 and 1970. As the figure shows, the age structure of the allowance migrants did track fairly well the structure for regular migrants, although there are some differences between the sexes. For men (Figure 2a), the regular migrants were slightly older, peaking at the age of 20–24, while the allowance migrants were more likely to be 19 years or younger. For women (Figure 2b), the overrepresentation of ages 24 and younger was even stronger than for males: 50% of the female allowance migrants were 19 years or younger. The general age pattern for females also followed closely that of regular migrants.
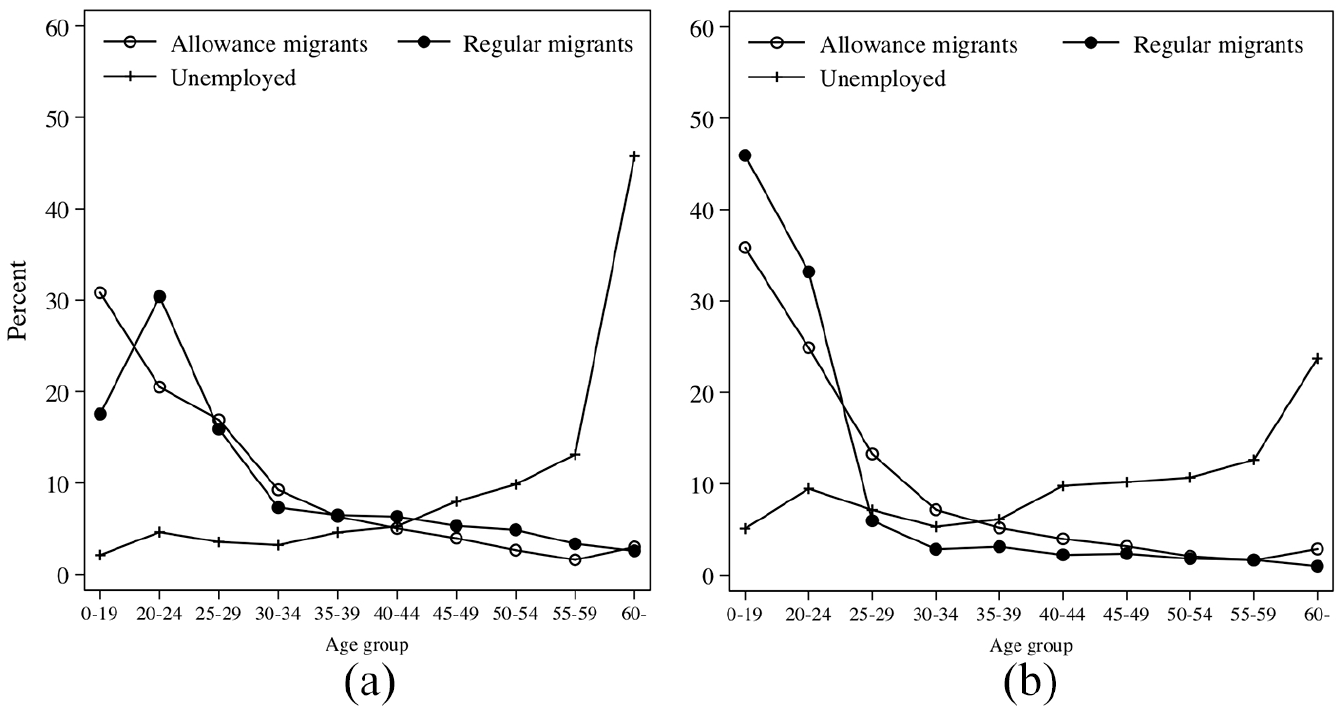
Age structure of allowance migrants compared to regular migrants and to the unemployed in November 1965 and 1970, male (a) and female (b).
For both sexes, the difference in age structure is striking when allowance and regular migrants are contrasted with those registered as unemployed. In the case of men, more than 40% of the unemployed were 60 years old or older. For women, there is a similar overrepresentation of older persons, but the unemployed are more evenly spread across the groups aged 35 and older.
One of the main objectives of the program of relocation allowances was to aid workers in the shift out of declining industries and into expanding economic activities. If the program was successful, industries with a higher number of unemployed should have registered more allowance migrants. It would also have been interesting to compare the sectoral origin of the allowance migrants to that of the regular migrants. Unfortunately, official statistics do not give any information on the economic sector of regular migrants. With my material, however, it is possible to compare the sector of origin of the allowance migrants to persons registered as unemployed and to the regular workforce.
Figure 3 plots the sector composition of the allowance migrants compared to the employed and the unemployed in November of 1970. This is the year that I have information both on industry before the move and on registered unemployed from the public labor exchanges.
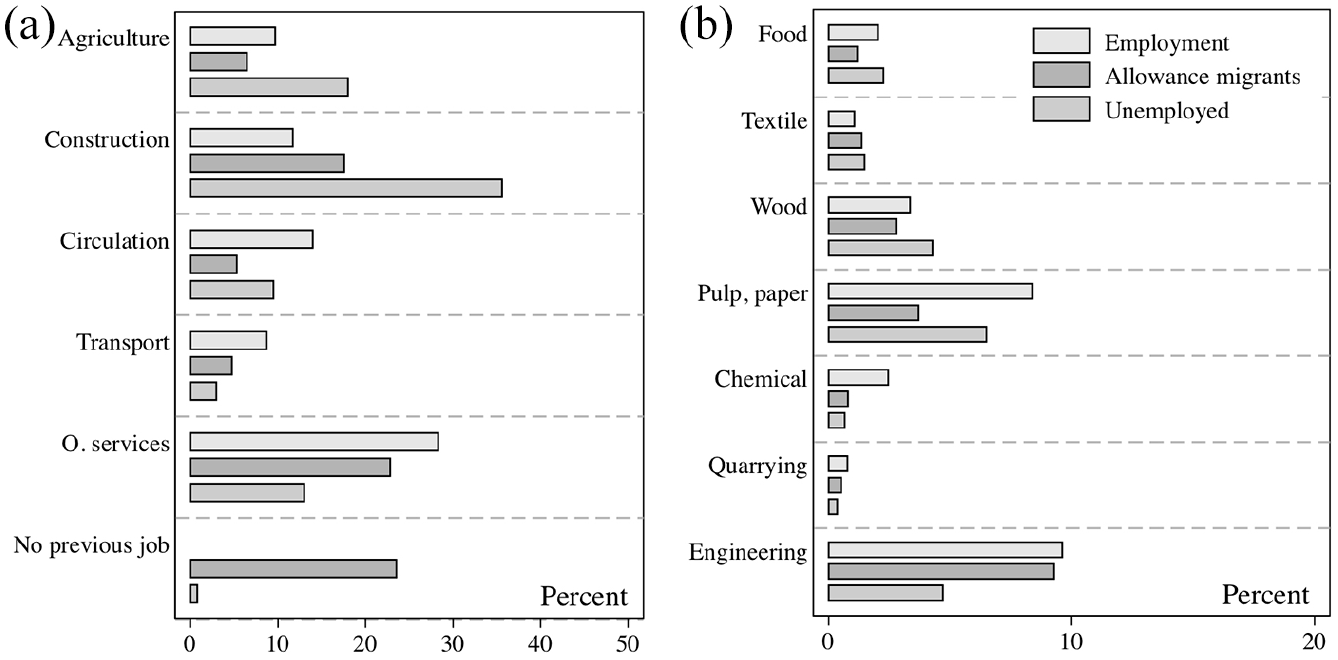
Sector composition of employment compared to allowance migrants and to the unemployed in November 1965 and 1970.
As the figure shows, both agriculture and construction were overrepresented among the unemployed compared to the number of employed. Over 20% of all unemployed came from agriculture and 40% from construction. Reflecting this high unemployment share, construction was also overrepresented in the number of allowance migrants compared to the number of employed. This was not true for agriculture, however. While 25% of all persons registered as unemployed originated from agriculture, only 10% of the allowance migrants did so. The sector was strongly male dominated and the low rate of allowance migration could therefore reflect the fact, shown previously in Figure 2a, that the unemployed males were disproportionally older than those who migrated.
Given the low share of unemployed in engineering, this industry is overrepresented in the number of allowance migrants. Allowance migration tracks more closely the share of that sector in overall employment in the county. On the other hand, the pulp and paper industry is underrepresented when the same metric is used. This likely reflects the job market prospects workers faced in those sectors outside the county of Västernorrland. For an engineering worker, there were relatively ample job opportunities in other parts of the country at this time, as the sector was expanding and there were many job openings. The pulp and paper industry, on the other hand, was declining in terms of employment and was relatively concentrated to Västernorrland.
The high rate of allowance migration by persons employed in the engineering industry runs contrary to the notion that the program was shifting workers from contracting to expanding industries, since unemployment in this sector was low also in Västernorrland. Lastly, the fact that almost 20% of the allowance migrants registered no previous job versus almost zero for the unemployed (and by definition for the employed), suggests that the critique that the program was overused by recently graduated students seems to be validated to some extent.
Regression analysis
In the previous section, I examined the patterns of allowance migration from Västernorrland using cross-tabulation and through a comparison of allowance migrants, regular migrants, the unemployed and the general workforce. The analysis showed that the allowance migrants were similar in age to regular migrants but deviated significantly from the unemployed who were generally much older. While the pattern across sectors was mixed, the employment opportunities outside of the county appeared to matter more than the unemployment situation in Västernorrland.
There are, however, many factors that could influence these general patterns identified from cross-tabulation. If, for example, the age structure or sex composition differed between sectors, this would affect the number of allowance migrants from that industry without having anything to do with particularities of that sector. To account for some of these potentially influencing factors and to get a clearer picture of what influenced allowance migrants’ decisions, I will perform a regression analysis that models the choice of destination and sector by the allowance migrants as the outcome of a number of underlying variables such as age, sex and occupation. In doing so, I can examine the effect of a specific factor, while holding other things that influence the decision constant. An important restriction, however, is that I can only analyze those who received relocation allowances and, consequently, the patterns within this group.
When performing the regression analysis there are also several compromises that have to be made. The outcome that I will focus on has the following four alternatives: ‘1. Staying in Västernorrland and not changing sector’; ‘2. Moving out of Västernorrland but staying in the same sector’; ‘3. Staying in Västernorrland and changing sector’; and, finally, ‘4. Moving out of Västernorrland and changing sector’.
In the case with nominal outcomes that cannot be ranked, such as those here, the number of outcomes must be restricted, and therefore the possible outcomes have been limited to these four fairly coarse categories. This is also the reason the definition of sector has been restricted to the three broad categories of primary, secondary and tertiary.
To analyze the determinants of these four nominal outcomes, I use a multinomial logit regression model. In such a model, the log odds of the outcome are modeled as the function of the independent variables. In addition to restricting the detail of the outcome variable to four outcomes, such models put a limit on the number of controls and interactions that can be added as independent variables. Therefore, I have chosen to use a fairly simple baseline model that controls for age, the square of age, sex, year and occupational code at the one-digit level. In addition to this, the model includes interactions of age and year, age squared and year and sex and year. It is also important to note that I will not use the model to make statistical hypotheses testing, but simply use it to ‘decompose’ the different factors that explain the general patterns observed previously. As there is no information on the sector before the move in the data for 1965, the model can only be estimated and used for 1970 and 1975.
In the case of logit and probit models, there is no average treatment effect as in regular linear regression, and the estimated probabilities will therefore vary depending on the values of the other independent variables. When presenting the results, I will accordingly keep all other variables at the mean of their value in the sample. In practice, this results in a mean age of 28 and a 64% share of men for the baseline model estimated on the data for 1970 and 1975.
The equation that I will estimate is the following:
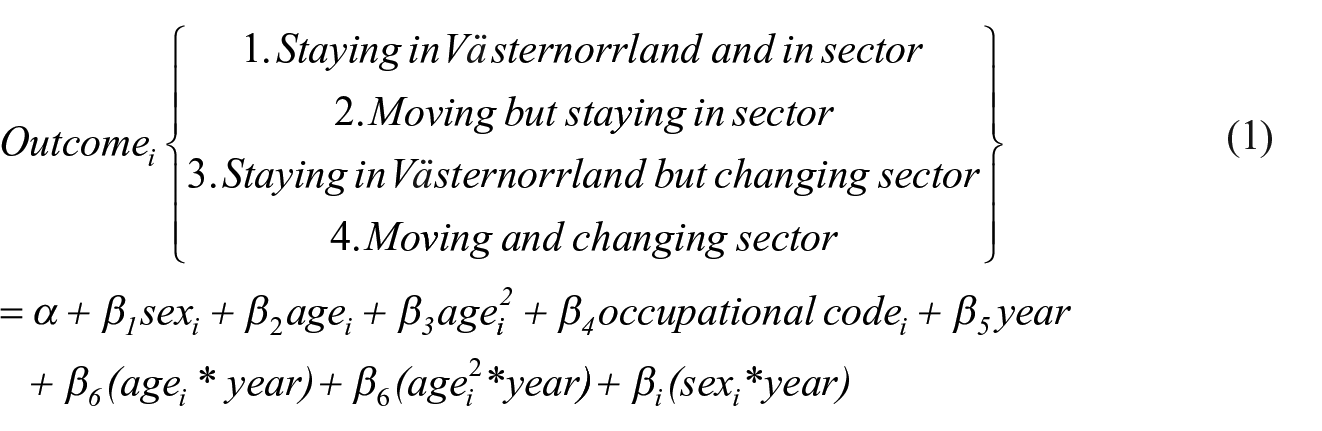
where Outcomei is one of the four outcomes. The variable sexi is a binary indicator that takes the value 0 if the person is a male and 1 if the person is a female; agei is a continuous variable measuring the age of the person with a lowest value of 15 and a highest of 72 in the dataset; occupational codei is a set of dummy variables for each occupational code (11 occupations, 10 dummy variables); year is a dummy variable that takes the value 0 if the year is 1970 and 1 if the year is 1975. The other variables are interactions of these variables. The two interaction terms agei*year and
In Figures 4a and 4b, the probabilities I plot are those for each outcome if all other variables are held constant at the mean values of the sample. The full regression results are available in Table A3 in Appendix B.
It was clear from the cross-tabulation that there were differences across sectors in the propensity to migrate using relocation allowances. Some sectors had more allowance migration relative to their unemployment, while for some sectors the opposite was true. To what extent was the willingness to migrate using the program different for various groups? Looking at how the relative likelihood for each of the four outcomes in the model differed among occupations, while holding age, sex and year constant, can offer some hints about this. Starting with differences across occupations, Figure 4a and 4b plot the probability of the four outcomes for each of the 11 occupational groups included in the model. A few patterns stand out in the figures. For administrative staff the probability of Outcome 2 was especially high. This is unsurprising given that this occupational group consists of highly educated persons with perhaps fewer employment possibilities if staying in Västernorrland but who otherwise had good employment prospects.
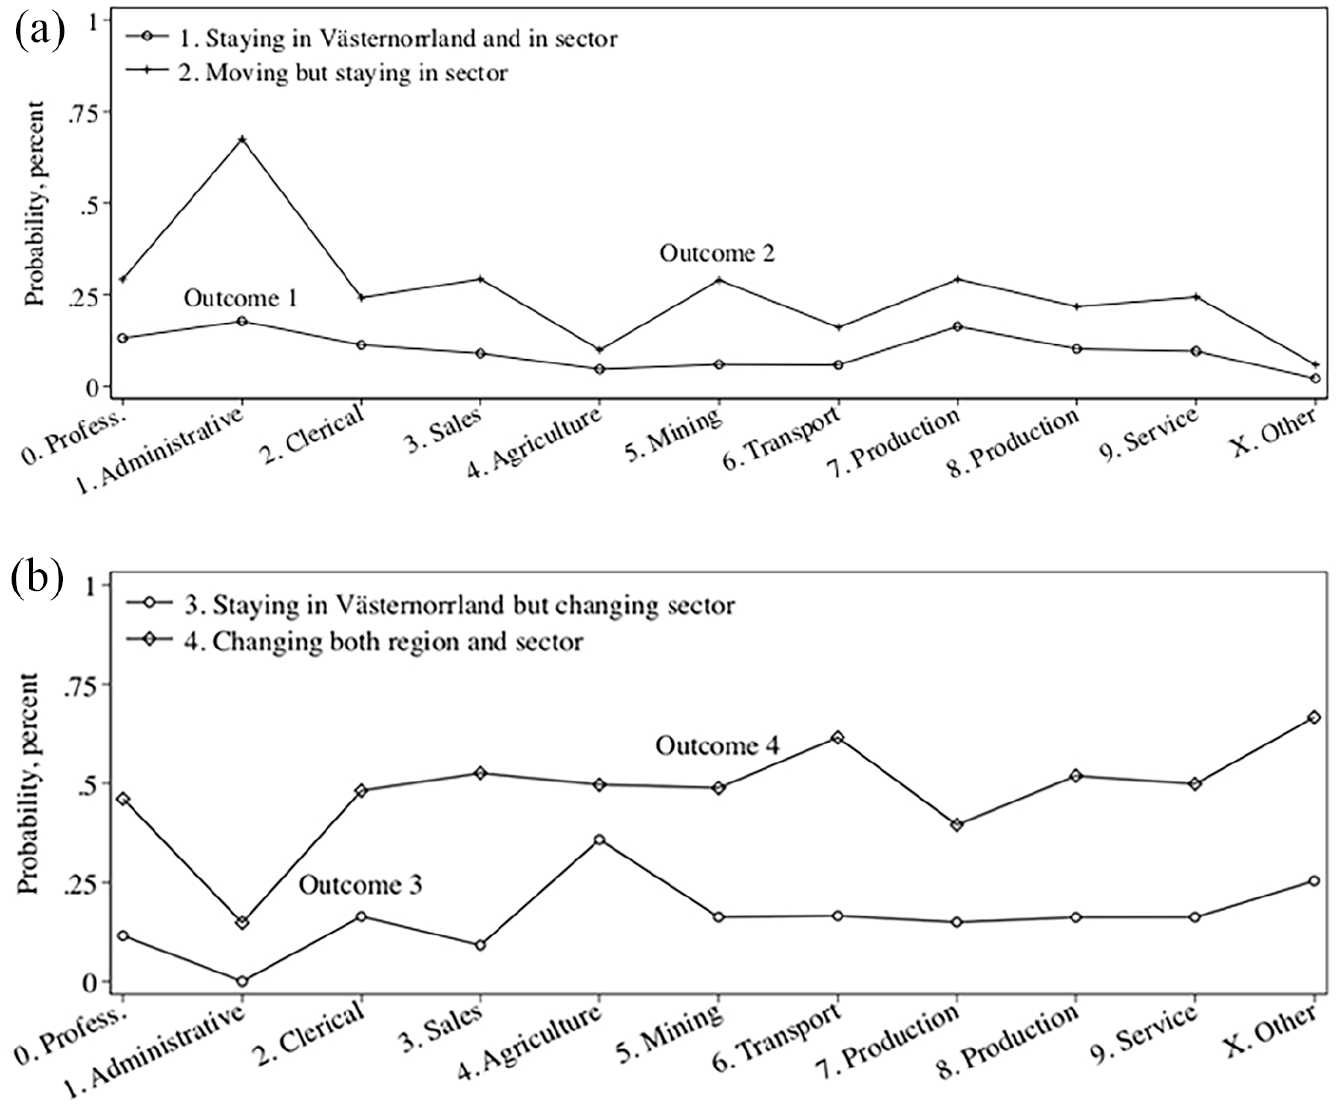
Probability for each of the four outcomes by occupations.
For persons previously occupied in agriculture, the probability of Outcome 2 was, on the contrary, very low. This is likewise not very surprising since assumed gains in employment opportunities from moving while staying in agriculture were relatively low. The probability of Outcome 1 or Outcome 4 does not differ in any notable way for persons occupied in agricultural work versus other occupations, however. Instead agriculture stands out by the high probability of Outcome 3.
What characterized those occupations that were most likely to move away from Västernorrland and to change sector at the same time? The probabilities of Outcome 4 were highest for people employed in transport and for those in the ‘other’ category, consisting mainly of students with no previous job. In the case of transport workers, this is also mirrored in a lower probability of Outcome 2. This could reflect the fact that employment opportunities in this sector were perhaps relatively evenly spread across the country and, therefore, moving without changing sector was not logical for this group. The fact that Outcome 4 was so likely among students (included in the ‘other’ group) is also a consequence of persons in this group not having had a job before, so therefore they automatically ‘changed’ sectors when entering the labor market.
In Figure 2, there was a vast difference in the age structure between those who migrated using the relocation allowances, on the one hand, and those who were registered as unemployed at the public labor exchange office, on the other hand. Within the group who did move using relocation allowances, how did the probability of the four outcomes vary according to age? The pattern across ages, when holding all other variables constant, is shown in Figure 5.
The first thing to notice from the graph is that there is no dramatic change in probabilities across any age below 50. The propensity of Outcome 4 is highest at lower ages and declines slightly over time, especially after age 60. The propensity of Outcome 3 is inversely related to the propensity of Outcome 2. The former was more common among persons of prime working age while staying in the region yet changing sector increased strongly after 50 years of age. This indicates that persons of prime working age were more mobile across space, while older persons were less geographically mobile but relied more on internal flexibility instead (i.e. staying in Västernorrland but changing sectors). The probability of Outcome 3 increases substantially after age 50 from around 25% to about 50%, but the number of people of this age in the material is not large (compare with the age structure in Figure 2).
Taken together, however, age seems to have had a fairly small effect on the decision of allowance migrants under the age of 50, after controlling for other factors. As was clear from Figure 2, the propensity to migrate for persons of age 50 and older was very low overall, and the group who did so was small.
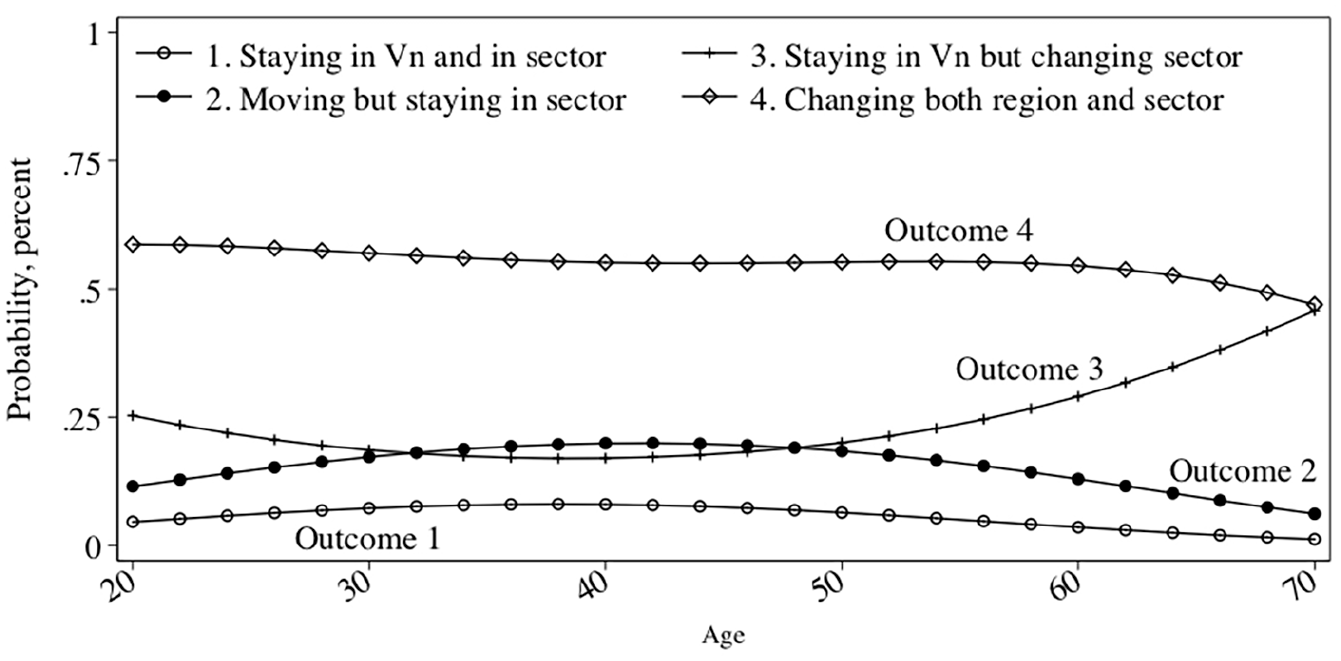
Probability for each of the four outcomes by age.
The results presented in this section indicate some interesting patterns. The most important variable in influencing the outcome appears to have been the person’s occupation prior to the move. Changes in probabilities as people became older were fairly small up until age 50. After 50, the probability of moving within Västernorrland without changing sector became more common, suggesting that persons of prime working age were more mobile across space, while older persons were less geographically mobile and relied more on internal flexibility instead.
Discussion and conclusions
Among academics and policy makers in Europe, and more recently in the United States, falling rates of geographical mobility and increased polarization across regions caused by technological change and international trade have spurred a renewed interest in mobility subsidies as a means to reduce regional disparities in incomes and unemployment. While such programs have only been tried on a smaller scale, the consequence of increasing their scope is uncertain. Sweden’s pioneering experience with such programs can help to shed light on the likely problems involved in designing and expanding mobility subsidies. An essential part of the Swedish model was the relocation allowances that were introduced on a large scale in the late 1950s. In this article, I have examined Sweden’s experience in the 1960 and 1970s to draw lessons for today’s policy discussion.
The results from the cross-tabulation indicated that the allowance migrants in Västernorrland were substantially younger than the unemployed. In fact, the age structure of allowance migrants closely followed that of regular migrants. Thus, the close correspondence in terms of age between regular migrants and those receiving relocation allowances suggests large potential deadweight losses with support given to individuals that are likely to have moved anyway. The previously mentioned general belief that young people were the ones mostly using the program, discussed by Westerlund (1995) and underscored by the vast amounts of recently graduated students who used the program, is confirmed.
The pattern for sectors also suggests that the program did not succeed in targeting those with fewer employment prospects. The cross-tabulation showed that some sectors, such as engineering and other services, were overrepresented in the number of allowance migrants compared to the number of unemployed, while other sectors, such as agriculture, construction and pulp and paper, were underrepresented. Judging by the sectors that were over- versus underrepresented, it appears as if the employment situation in the sector outside of Västernorrland played a more significant role than the unemployment situation in the home sector within the county. Therefore, the policy does not seem to have been particularly efficient in selectively migrating unemployed workers from declining sectors into expanding ones in other parts of Sweden.
The results from the multinomial regression elucidated how age and occupation affected the decision of allowance migrants when holding the other factors constant. The probability of moving out of the county while staying in the sector became slightly more likely from ages 20 to 45. However, the most significant change was the increased probability of staying in Västernorrland while changing sector after age 50, suggesting that persons of prime working age were more mobile across space, while older persons were less geographically mobile and relied more on internal flexibility instead – corroborating the results from the tabulations.
While the similarity in age between regular migrants and allowance migrants suggests that deadweight costs were large, it could still be argued, however, that the program worked in a different way from what was intended. By stimulating migration of individuals with a stronger position on the labor market, it might have opened possibilities for those staying behind. The fact that older individuals and those previously employed in the primary sector were more likely to move within the region is a testament to this possibility. However, it is still likely that there were significant unneeded costs associated with the program, since many of those that moved with support were likely to have migrated anyway without the subsidy. It is therefore far from certain whether the situation in this instance would have been different without the program. It should be noted, however, that the present study does not allow for the evaluation of such counterfactual scenarios. This would require a proper experimental design, with random assignment into the program. I am likewise not able to speak to any general equilibrium effects of the intervention.
While evaluations of the recently introduced German program of mobility subsidies have shown positive effects on those that gained access to the grant, these assessments also find that there is strong selection into the program of younger and higher educated workers without family (Caliendo et al., 2015, 2017). The Swedish experience raises the question of whether an expansion of the German program will be able to prevent the problems of targeting vulnerable groups on the labor market when it expands its recruitment base.
Why wasn’t the Swedish program more successful in avoiding selection and potential deadweight losses? The field of implementation studies might give us some insights into this. Characteristic of the Swedish program was that the law gave clear directions for who should be the target group for the subsidy, but local officials were given great liberty in the actual implementation of the program. The independence of local officials and the flexibility it gives has previously been highlighted as a strength of Swedish labor market programs (King and Rothstein, 1993). However, it might also have given the local officials tasked with the realization of the program scope to give out support to groups that were not in fact the primary target. Street-level bureaucrats might not have a good overview of the overall implementation of the program, and the aggregate result from many individual decisions might deviate from those intended by the policy makers. Street-level bureaucrats could also be guided by other objectives than those set though policy directives. Individual interests and professional norms might be at least as decisive in determining their actions (Meyers and Vorsanger, 2007). The difficulties associated with implementing these types of programs must therefore be borne in mind when considering the expansion of mobility subsidies in the EU, the United States and elsewhere.
Given that the labor market in the southern regions of Sweden, to which most migrants went, was very tight during the time of this study, the prospects for migrants to find jobs subsequent to the move were also likely very high compared to what is often the case today. For this reason, the apparent difficulty in the Swedish case of selectively stimulating the migration of those with the least potential if remaining in the region is likely an obstacle to the success of renewed attempts to stimulate migration.
What, then, should countries aiming to stimulate geographical mobility do? The Swedish experience suggests the need for strong mechanisms ensuring that the support is given only to those at the margin of making a move. Modes of implementation also seem to be important, where local autonomy in decision making might result in larger selection issues. It might also be easier to target more precisely if the size of the program is kept small, while trying to reach a larger share of the workforce could intensify selection issues. The subsidy could potentially also be tied to the unemployment insurance system, as suggested by Moretti (2012). Such a setup would mean automatic payouts to unemployed workers that relocate, limiting the need for discrete decisions from local bureaucrats. It might, however, be difficult to administer a more extensive program without giving local officials some role in the implementation.
Taken together, the results indicate that the Swedish experience provides a note of caution to policy makers wishing to expand mobility subsidies a means to combat unemployment. It is likely that such programs will be ineffective in targeting those who are at the margin of moving to take up a new job and will instead devote a large share of resources to individuals with already good labor market prospects.
Footnotes
Appendix A
Occupational codes.

| Occupational code | |
|---|---|
| 0. Professional, Technical and Related | 6. Transport and Communications |
| 1. Administrative | 7–8. Production and Related |
| 2. Clerical and Related | 9. Service |
| 3. Sales | X. Other |
| 4. Agricultural, Forestry and Fishery | |
| 5. Miners, Quarrymen and Related |
Appendix B: Regression model
Declaration of conflicting interests
The author declared no potential conflicts of interest with respect to the research, authorship, and/or publication of this article.
Funding
The author disclosed receipt of the following financial support for the research, authorship, and/or publication of this article: This work was supported by Jan Wallanders och Tom Hedelius Stiftelse samt Tore Browaldhs Stiftelse [P2013-0274:1].