
Abstract
Accurate estimation of water demand in buildings is essential for designing safe, efficient, and sustainable water supply systems. Conventional design approaches often lead to significant overestimations of water demand, resulting in water supply systems that are frequently oversized. This study introduces the Water Demand Estimation Model (WDEM), a novel stochastic model developed specifically for application to non-residential buildings. The model integrates statistical data on sanitary appliances and user behaviour using extensive Monte Carlo simulations to generate realistic scenarios of simultaneous appliance usage. In addition to appliance properties, WDEM accounts for building occupancy, an essential factor in design flow rate estimation. It provides a set of user-friendly design equations, as an essential step towards future application in practice. Application of WDEM to three diverse case study buildings revealed substantial reductions in estimated design flow rates, ranging from 63% to 73%, compared to current UK design guides. These findings demonstrate WDEM’s effectiveness in estimating water demand and thereby avoiding system oversizing, which is crucial for designing water supply systems that are cost-effective and have improved water quality.
Practical application
The WDEM provides a new approach to estimate water supply design flow rates by combining occupancy-based usage with appliance-efficiency ratings to derive explicit design equations. The outcomes include preliminary design equations which, once validated, should support improved estimation of design flows without running the simulation. In practice, WDEM may support faster early-stage decisions, potentially smaller pipework and storage volumes, reduced capital costs and pumping energy, and lower stagnation and water quality risks.
Introduction
A reliable water supply system is essential for all types of buildings, ensuring adequate water delivery to all appliance draw-off points. The primary challenge when designing these systems is accurately estimating the maximum simultaneous water demand. This becomes even more challenging in large-scale buildings, where the number of possible combinations of simultaneous water demand increases exponentially with the number of appliances. As a result of population growth and urbanisation, large-scale buildings, especially high-rise buildings, have become increasingly common in recent years.1–3 Thus, it is important to provide an accurate approach to estimate water supply design flow rates, which form the basis for sizing pipework and all other components in both water supply and wastewater drainage systems. In designing water supply systems, when the water demand estimate is inaccurate, this can lead to either (i) underestimation, resulting in a system that is too small and an inadequate service provision; or (ii) overestimation, resulting in oversizing the entire system beyond actual needs. Such oversizing not only increases costs,4,5 but also increases the risk of biofilm formation and microbial contamination, such as Legionella,6,7 ultimately leading to unsustainable systems. 8
Conventional design methods mainly originated from Hunter’s approach, introduced in the 1940s, which employed probability principles and fixture units (FUs) to estimate water demand. 9 Although influential, Hunter’s method is increasingly recognised as leading to systems that are oversized due to outdated appliance and user behaviour parameters. The significant evolution in water appliance efficiency and user behaviour (notably enhanced by environmental awareness and commitments to water conservation) underscores the limitations of traditional estimation methods.10–12 Therefore, many international design codes have been recognised as leading to oversizing of building water systems, including those used in the USA, 13 the Netherlands, 14 the UK, 15 and Brazil. 16
Most studies on water demand, including those involving artificial intelligence (AI), have focused on estimating water demand at large temporal scales, for example, daily consumption.17–19 By contrast, only a few address the precise estimation of water demand in litres per second (l/s), which is essential for accurately sizing water supply systems such as the recent work by Fernandez et al. 20 In addition, research on oversizing of water supply systems has mainly focused on residential buildings, while far fewer studies address non-residential buildings, which represent a substantial share of the built environment and are often large-scale.
To address oversizing and support better design of water supply systems, this paper introduces a novel stochastic model specifically developed to estimate water demand in non-residential buildings. The WDEM model integrates up-to-date statistical data on sanitary appliances and user behaviour using Monte Carlo simulation to generate realistic scenarios of simultaneous appliance usage. By applying the WDEM to representative case study buildings, this study quantifies the potential reduction in design flow rates and demonstrates possible improvements in water supply system design and operation.
Statistical models for estimating design flow rate
Examples of international design codes for water supply system design and their related statistical models. 21
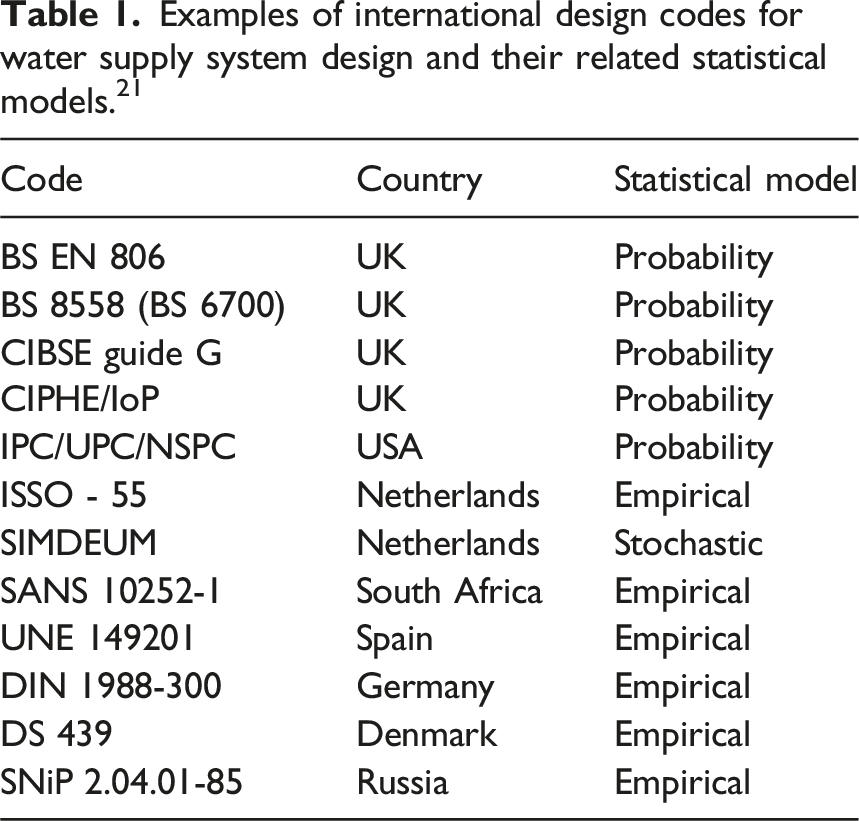
Probabilistic models rely on assumptions and probability distributions to derive mathematical expressions, tables, and graphs. Hunter’s method was among the first successful probabilistic approaches. Hunter used factors such as average appliance flow rate, duration of water use, and interval between operations to estimate the design flow rate. Despite ongoing debates regarding its accuracy, Hunter’s method remains the foundation for many international design codes. 22 Empirical models are more straightforward in their setup and application, typically generating a single result for a given set of parameters. These models derive formulae, tables, and charts by exploring mathematical relationships between input and output data. 21 Despite their simplicity and accuracy, their applicability is limited by a short validity period, as changes in parameters such as user behaviour or appliance efficiency directly affect model performance. Stochastic models, on the other hand, represent the uncertainty in a dynamic system using probability theory. 23 They are traditionally used to test scientific theories when processes, observations, or boundary conditions are subject to stochasticity. 24
In response to concerns about fixture unit methods, there has been a sustained effort to develop improved approaches for estimating design flow rates. For instance, in the United States, the Water Demand Calculator (WDC) offers a modern alternative to Hunter’s method for sizing water supply systems in residential buildings.25–28 The WDC is now recognised in practice, having been codified as Appendix M of the Uniform Plumbing Code (UPC), published by the International Association of Plumbing and Mechanical Officials (IAPMO). 29 In the Netherlands, the Simulation of water Demand, and End-Use Model (SIMDEUM), an end-use stochastic model has been developed and applied by Dutch water utilities and researchers.14,30–32 This approach underpins procedures for deriving design rules for peak cold and hot water demand in water supply systems, informing current practice in the Netherlands.
To improve water supply system design in the UK, this study presents the WDEM, a stochastic modelling framework for estimating building design flow rate. Conceptually, WDEM aligns with SIMDEUM in adopting a stochastic, end-use style approach that represents variability in occupant behaviour and appliance use. This differs from the WDC, which is primarily a probabilistic sizing tool and has been developed and calibrated using practice and datasets from the USA. In contrast to both, WDEM has been developed in two formats (i) in a building-specific form using the installed or proposed sanitary appliances and their flow-rate characteristics, or (ii) in a generalised form in which design flow is related to user numbers and overall appliance water-efficiency level, consistent with UK design guidance. Explicit integration of sanitary appliance efficiency, together with dynamic occupancy patterns, allows WDEM to reflect key characteristics of modern plumbing systems and to capture the variability and uncertainty of building water use.
Water Demand Estimation Model (WDEM)
After evaluating various modelling approaches and assessing resource availability and accessibility, a stochastic framework was adopted to develop WDEM, with a specific focus on non-residential buildings. This choice was supported by previous research demonstrating the effectiveness of stochastic models in simulating water demand and improving the accuracy of design flow rate estimation, for example, in Italy,33,34 in Australia, 35 in Brazil, 36 and in Mexico. 37 The primary focus of the study is the design of main water supply pipes, particularly in high-rise buildings, where accurate demand estimation is critical for ensuring system efficiency, sustainability, and maintaining water quality.
The WDEM is implemented in MATLAB and is designed for application to any non-residential building, using sanitary appliance parameters to estimate the design flow rate across the whole water supply system. Recognising that oversizing most commonly occurs in large-scale buildings, particularly in the main supply pipes, the model has also been generalised to estimate the total design flow rate directly for buildings. In this general form, WDEM provides closed-form design equations as explicit functions of building occupancy, enabling straightforward sizing without running the full simulation.
The model integrates user behaviour with sanitary appliance data, employing probability distributions to reflect potential simultaneous usage scenarios. The three-stage framework underpinning the WDEM first defines building types and allocates sanitary appliances based on user numbers in line with UK standards. It then uses a binomial distribution to characterise random water usage events and applies Monte Carlo simulations, involving extensive random sampling to generate realistic water use scenarios. This simulation approach is well-established for capturing uncertainty in complex systems
38
and underpins the model’s ability to reflect real-world variability in water demand. Finally, regression analysis is performed on simulation outputs to derive new design equations for estimating flow rates. Figure 1 summarises the methodological stages of the WDEM, from initial assumptions through to regression analysis and equation derivation. WDEM methodology and derivation of design equations.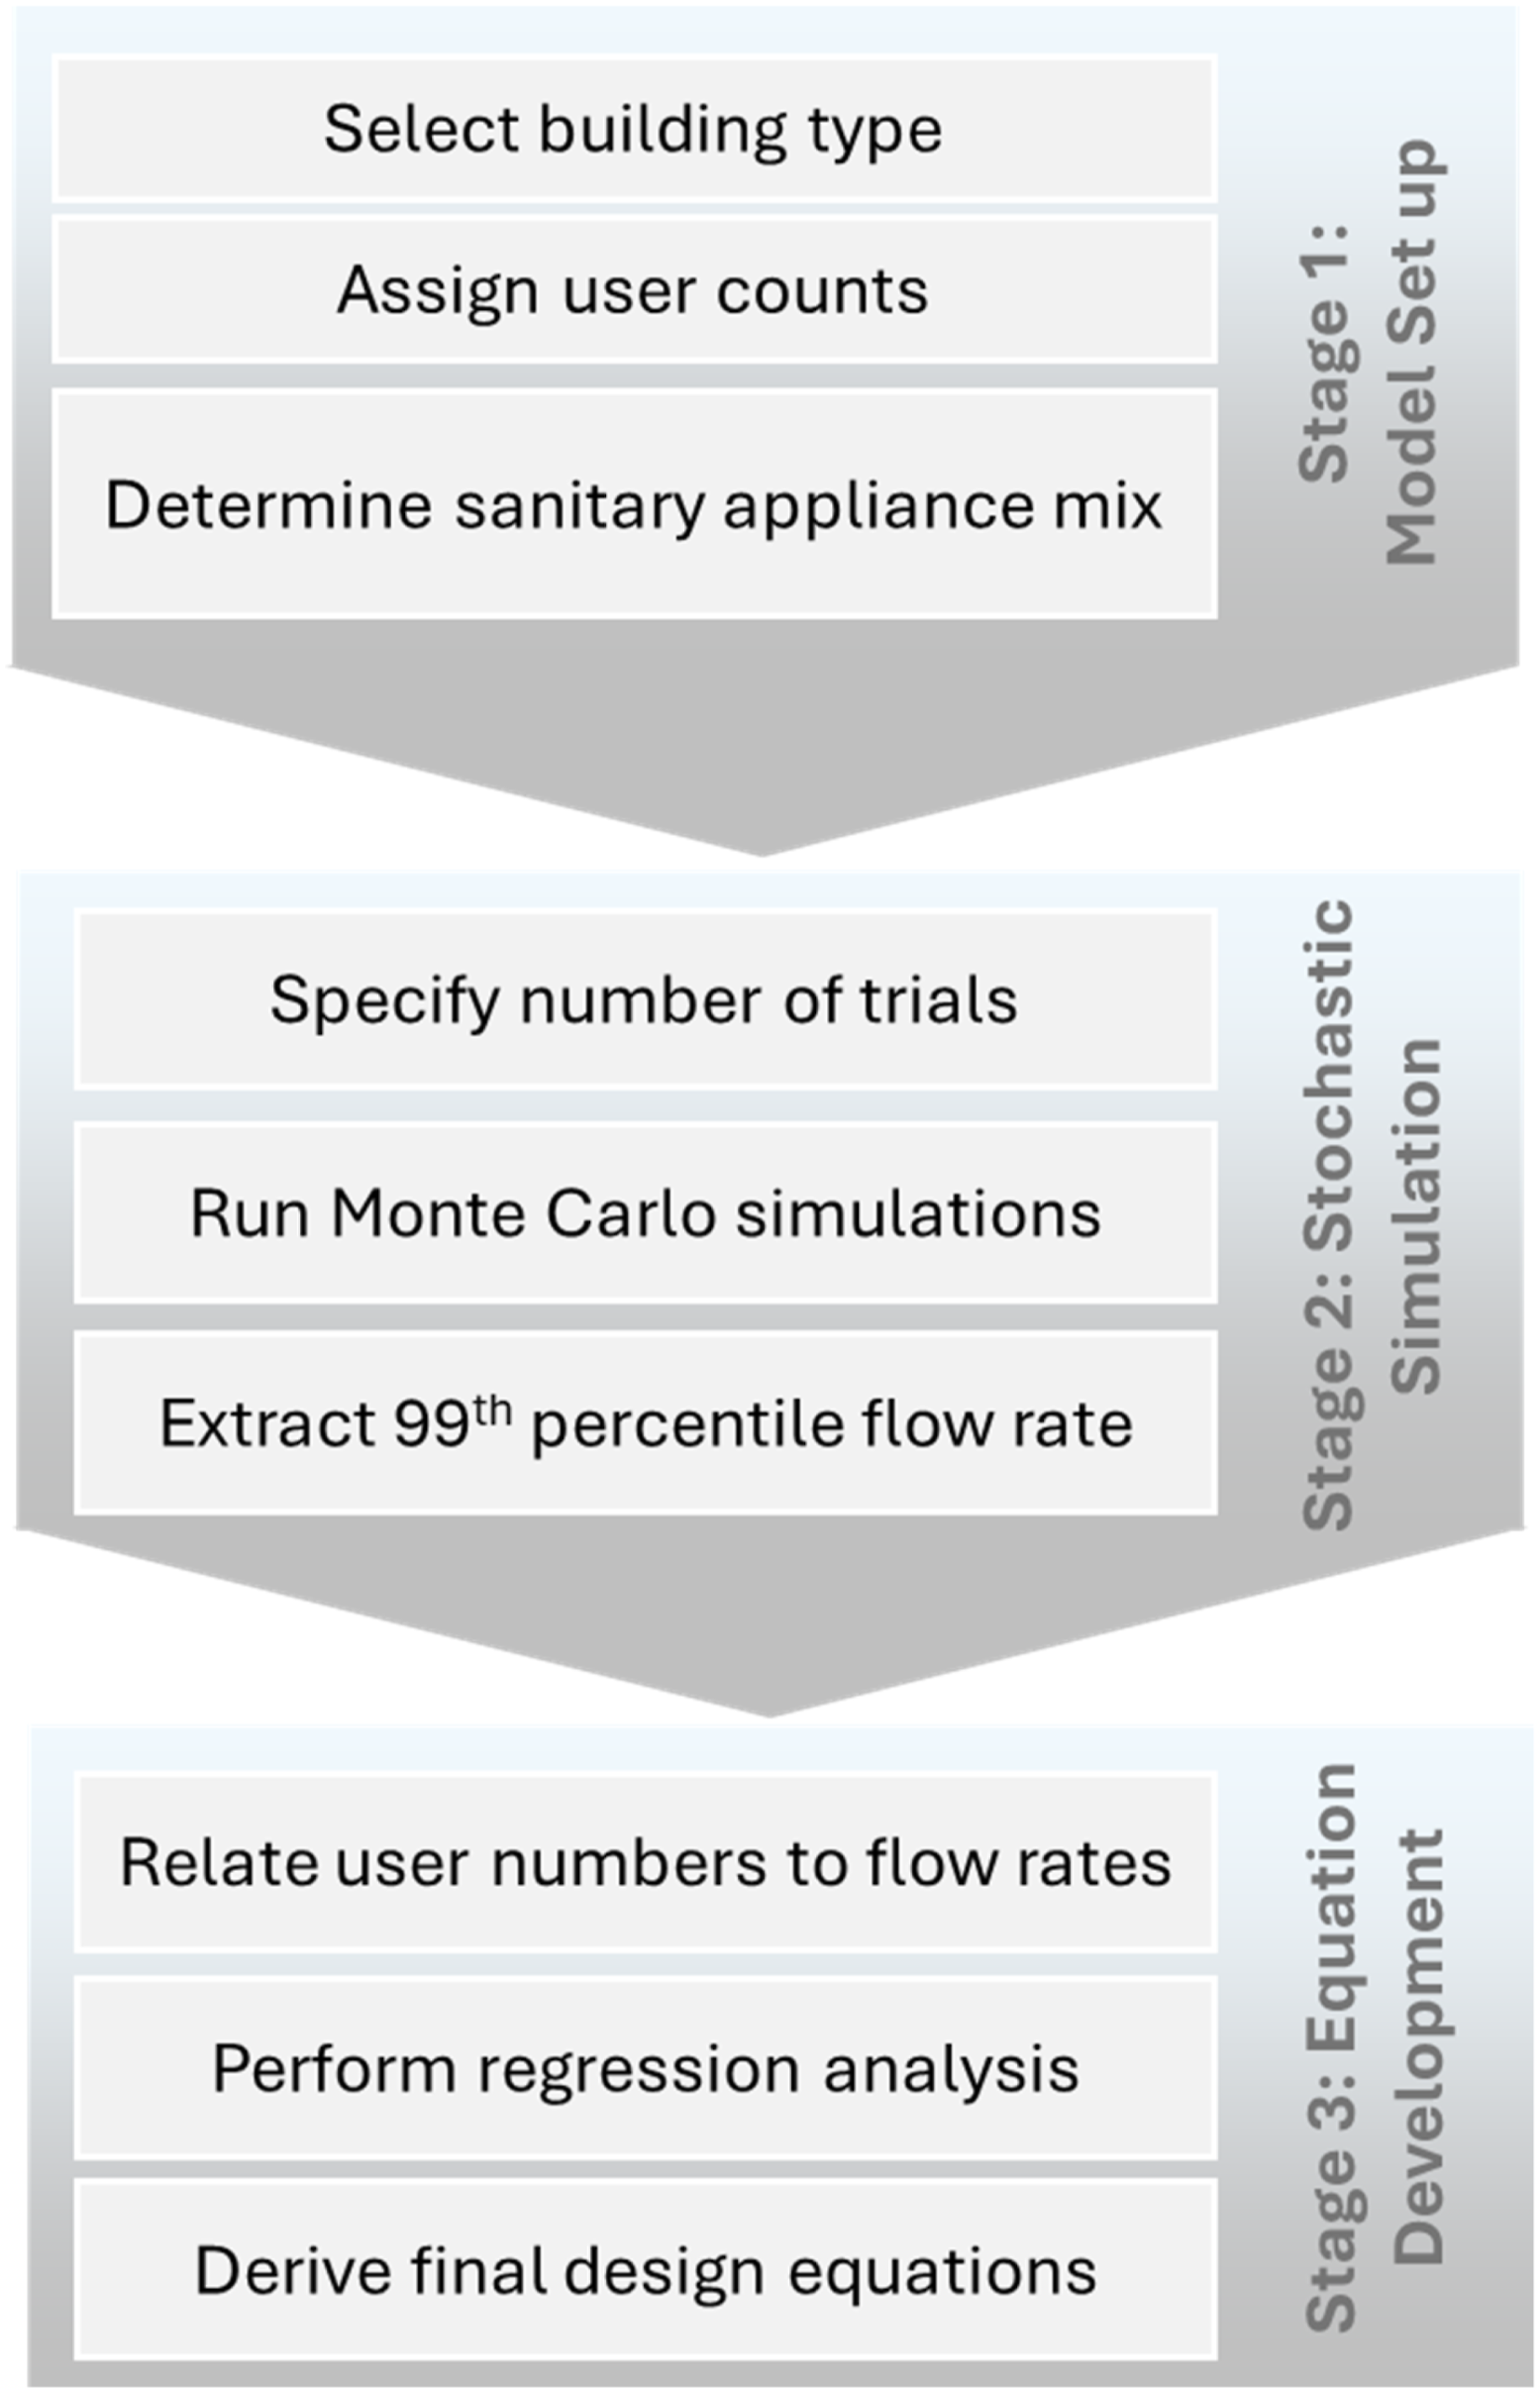
Number of users and provision of sanitary appliances
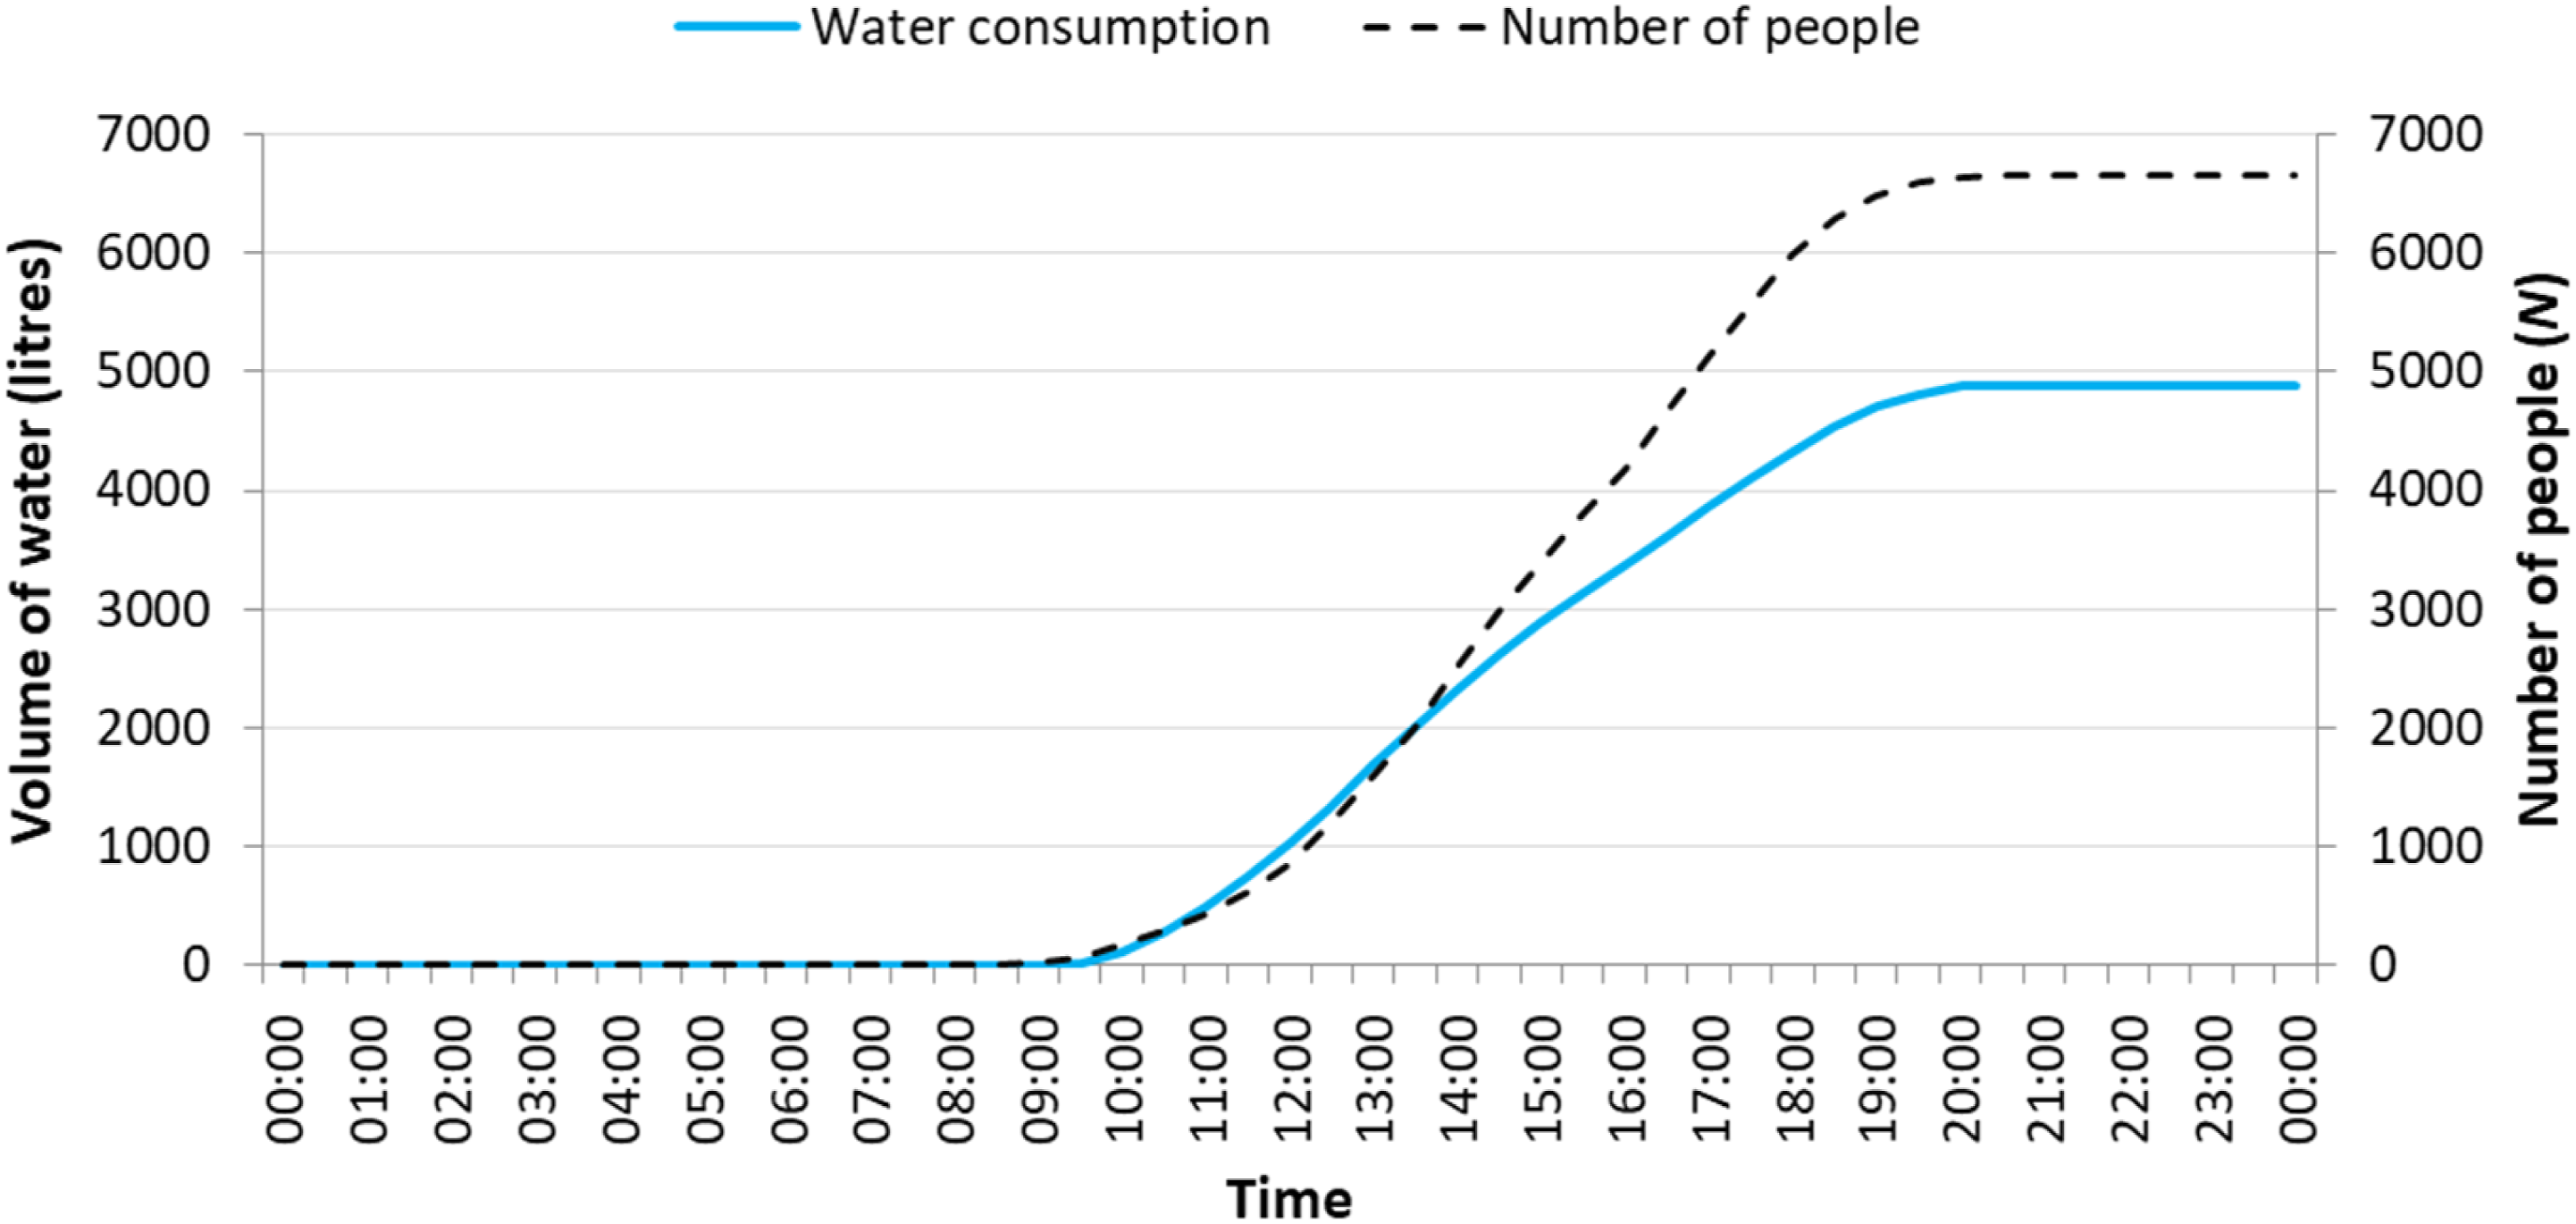
Stage 1 of the model involves establishing relationships between user numbers ( Relationship between occupancy and water consumption in the case study building. Cumulative functions of occupancy and water consumption patterns in the case study building.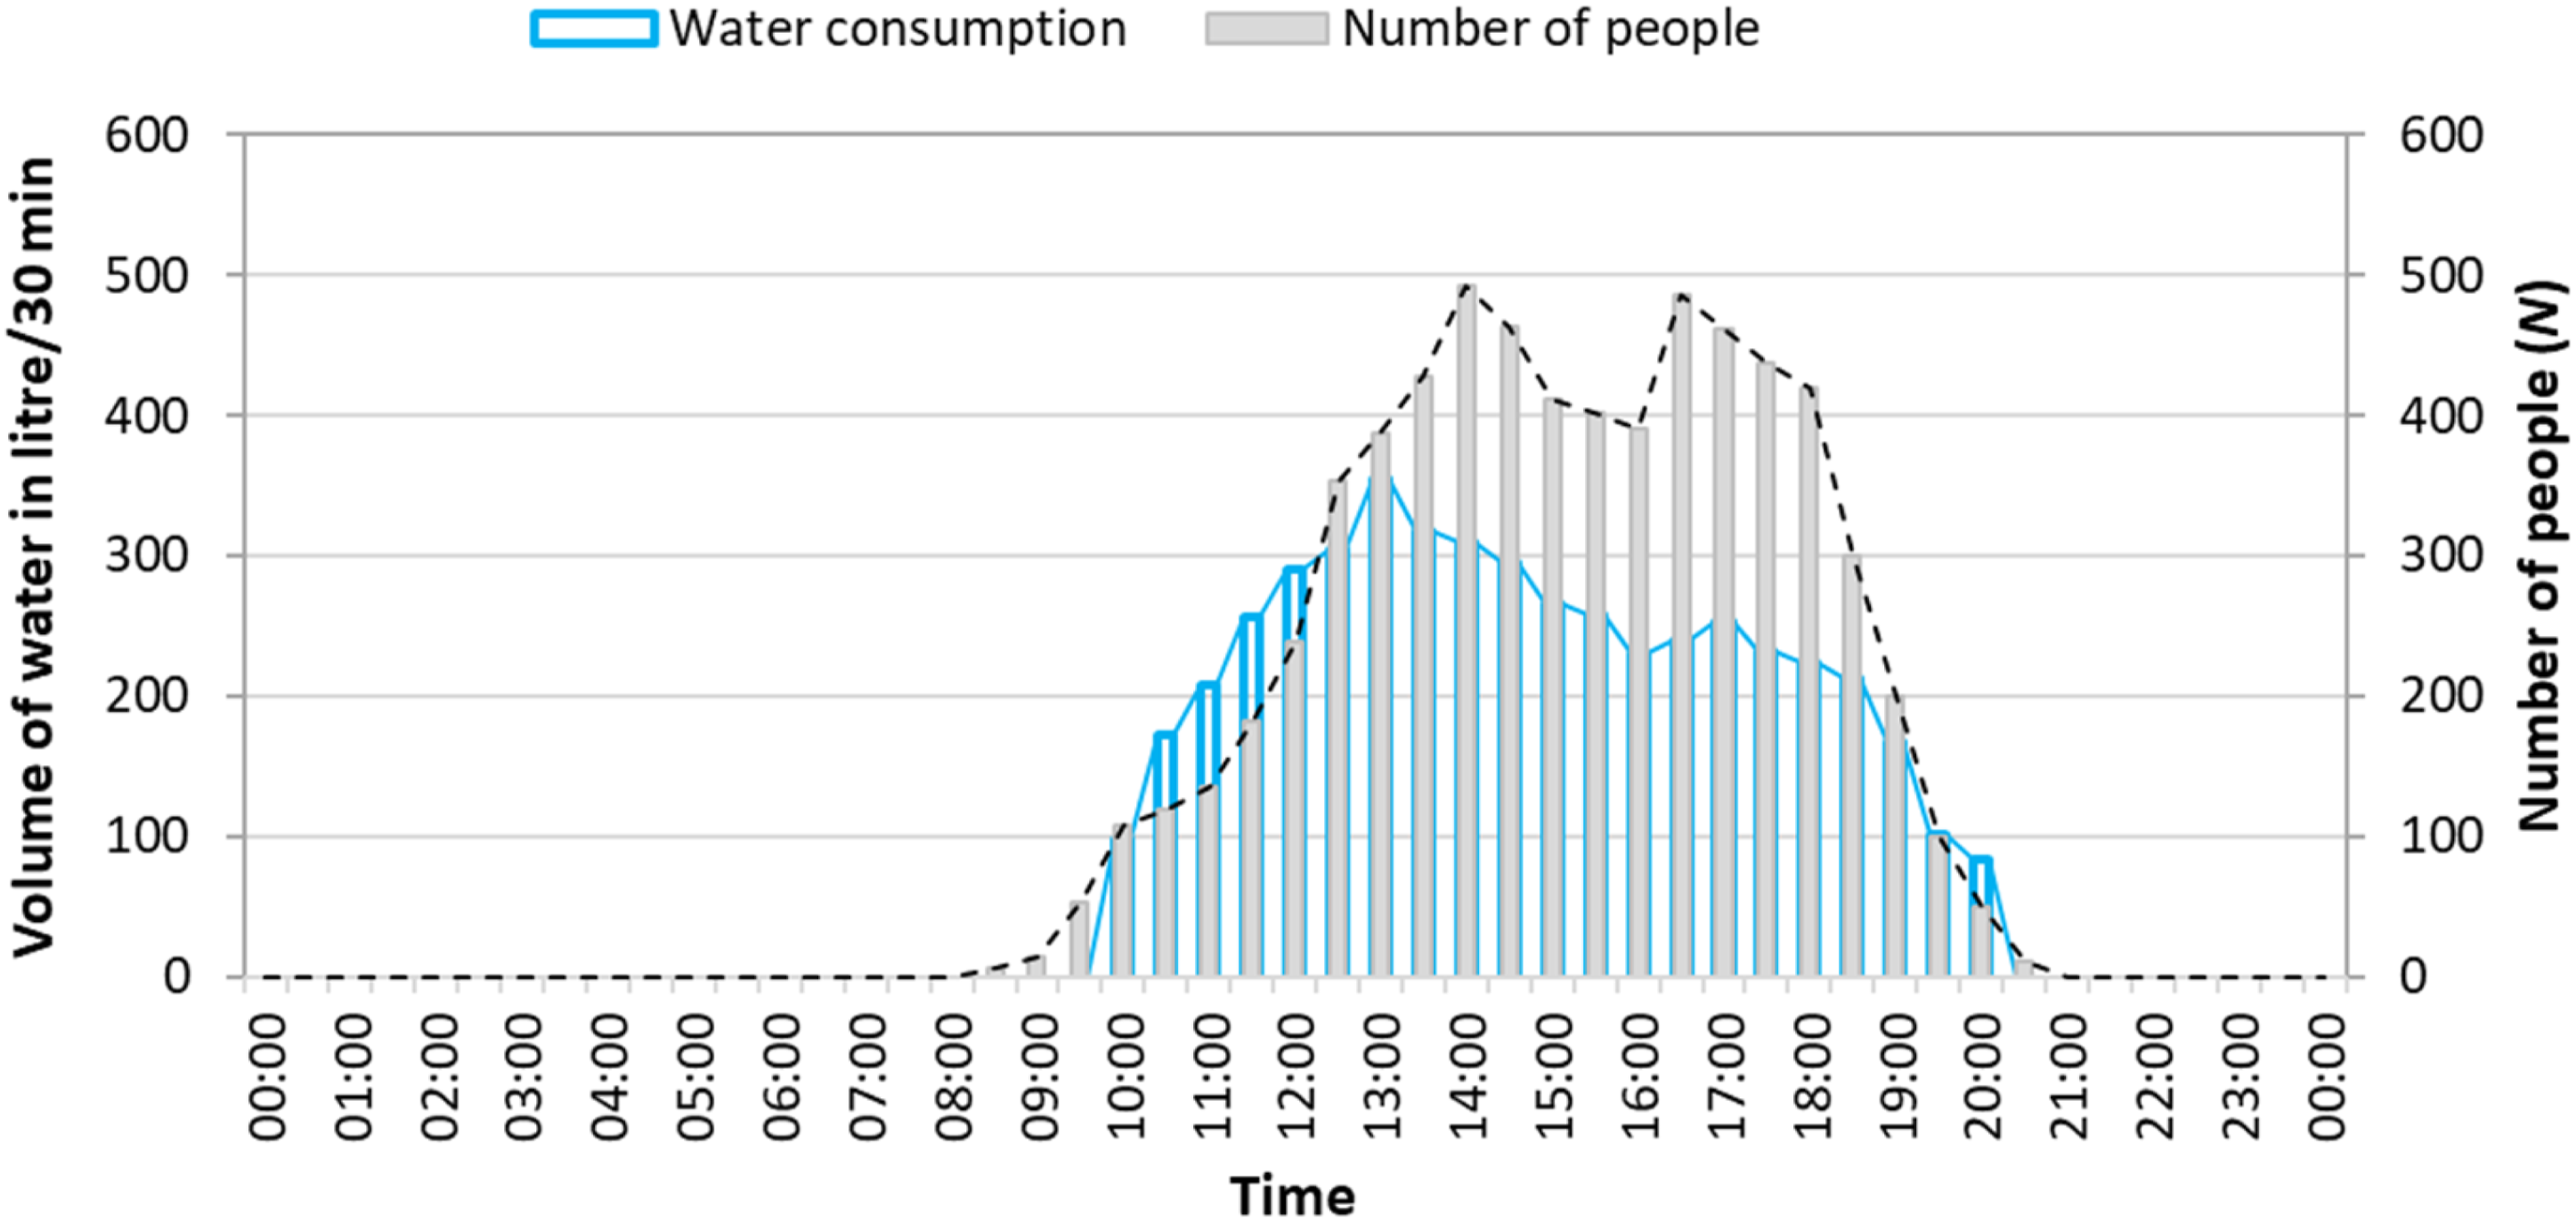
Accordingly, the WDEM was developed to accurately estimate water supply design flow rates by accounting for essential usage variables. For this purpose, the number of appliances installed in non-residential buildings was derived based on user numbers in accordance with the UK standard BS 6465. 40 This standard provides recommended numbers of appliances depending on anticipated occupancy levels and building type. Further details regarding the number and type of appliances, male-female ratio, and building capacity can also be found in BS 6465. At this stage, for any specified number of users, the corresponding numbers and types of appliances are defined and prepared for simulation.
Generating appliance-use events
In stage 2, the model simulates water usage via probability distributions for appliance operations. Each appliance usage event is treated as a Bernoulli trial, defined by binary outcomes: active (on/in use) or inactive (off/idle). Each appliance has a defined usage probability (p-value), a value that is statistically independent of other appliances. Accordingly, water usage in this context can be defined as a Bernoulli trial, assuming that water usage follows a binomial process under the following conditions: (i) the experiment/event can be repeated for any specified number of trials; (ii) each event is independent; and (iii) each trial has two possible outcomes (on or off). In statistical terms, the probability of an appliance being active or inactive is defined as follows:

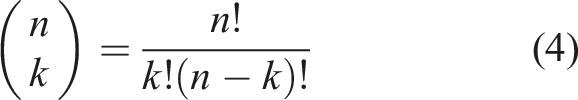
The probability that exactly P(k): probability that exactly k appliances are simultaneously active out of n n: total number of appliances of the same type considered k: number of active appliances out of n p: per-appliance usage probability (p-value) f: per-appliance inactivity probability, defined as 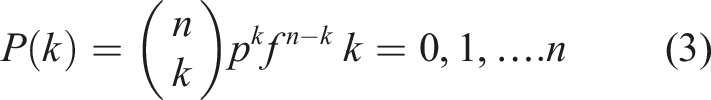
Equation (3) may also be expressed in compact form as:
Model parameters and assumptions
In the WDEM approach, the design flow rate is estimated using three primary inputs, selected for their impact on overall building water demand. This section defines each parameter, states the associated modelling assumptions and explains how each input affects the predicted design flow rate.
(i) The number of appliances, which directly influences the overall design flow rate, since a higher number of appliances increases the total demand and therefore increases the simulated total flow rate. In the generalised version of the model, appliance numbers are linked to building scale and occupancy, because larger user populations typically require a greater provision of sanitary appliances. Overall, the model is most sensitive to occupancy level and the associated number of sanitary appliances. (ii) Appliance discharge values
In this stage, the flow rate calculation framework is established using the full set of input parameters. In the generalised model, these inputs are expressed in terms of user counts
Resultant probability distribution and cumulative distribution function CDF
The Monte Carlo technique provides an optimal means of generating the broad range of simultaneous use scenarios necessary for robust water demand estimation. In this study, 400,000 iterations were run to capture a wide range of appliance use combinations and represent realistic usage. This high repetition rate significantly reduced variability between successive runs and produced stable outputs. In each iteration, appliances were randomly assigned on/off states, and the corresponding total flow rate was calculated as the sum of the flow rates of all active appliances. Thus, varying combinations of simultaneously active appliances produced a distribution of total flow rates. Initial simulation outputs generated a wide range of flow rate values, ranging from zero (no appliance active) to a maximum (all appliances active). To characterise these outcomes, the simulated flow rates were counted across all iterations to quantify how frequently each combination of appliance uses occurred in the simulation, forming an empirical probability distribution. These probabilities were then cumulatively added and plotted against their respective flow rate values to generate a Cumulative Distribution Function (CDF). The CDF provides a full probabilistic representation of simulated water flow rates and supports design at a chosen reliability, which is the probability that demand does not exceed the design flow rate. Thus, reliability ranges from 0% (always fails to meet demand) to 100% (always meets demand). By using this comprehensive CDF, flow rates at any desired reliability level can be accurately identified. For practical design applications, the 99th percentile flow rate ( Example of a CDF and extraction of 99th percentile simulated flow rate.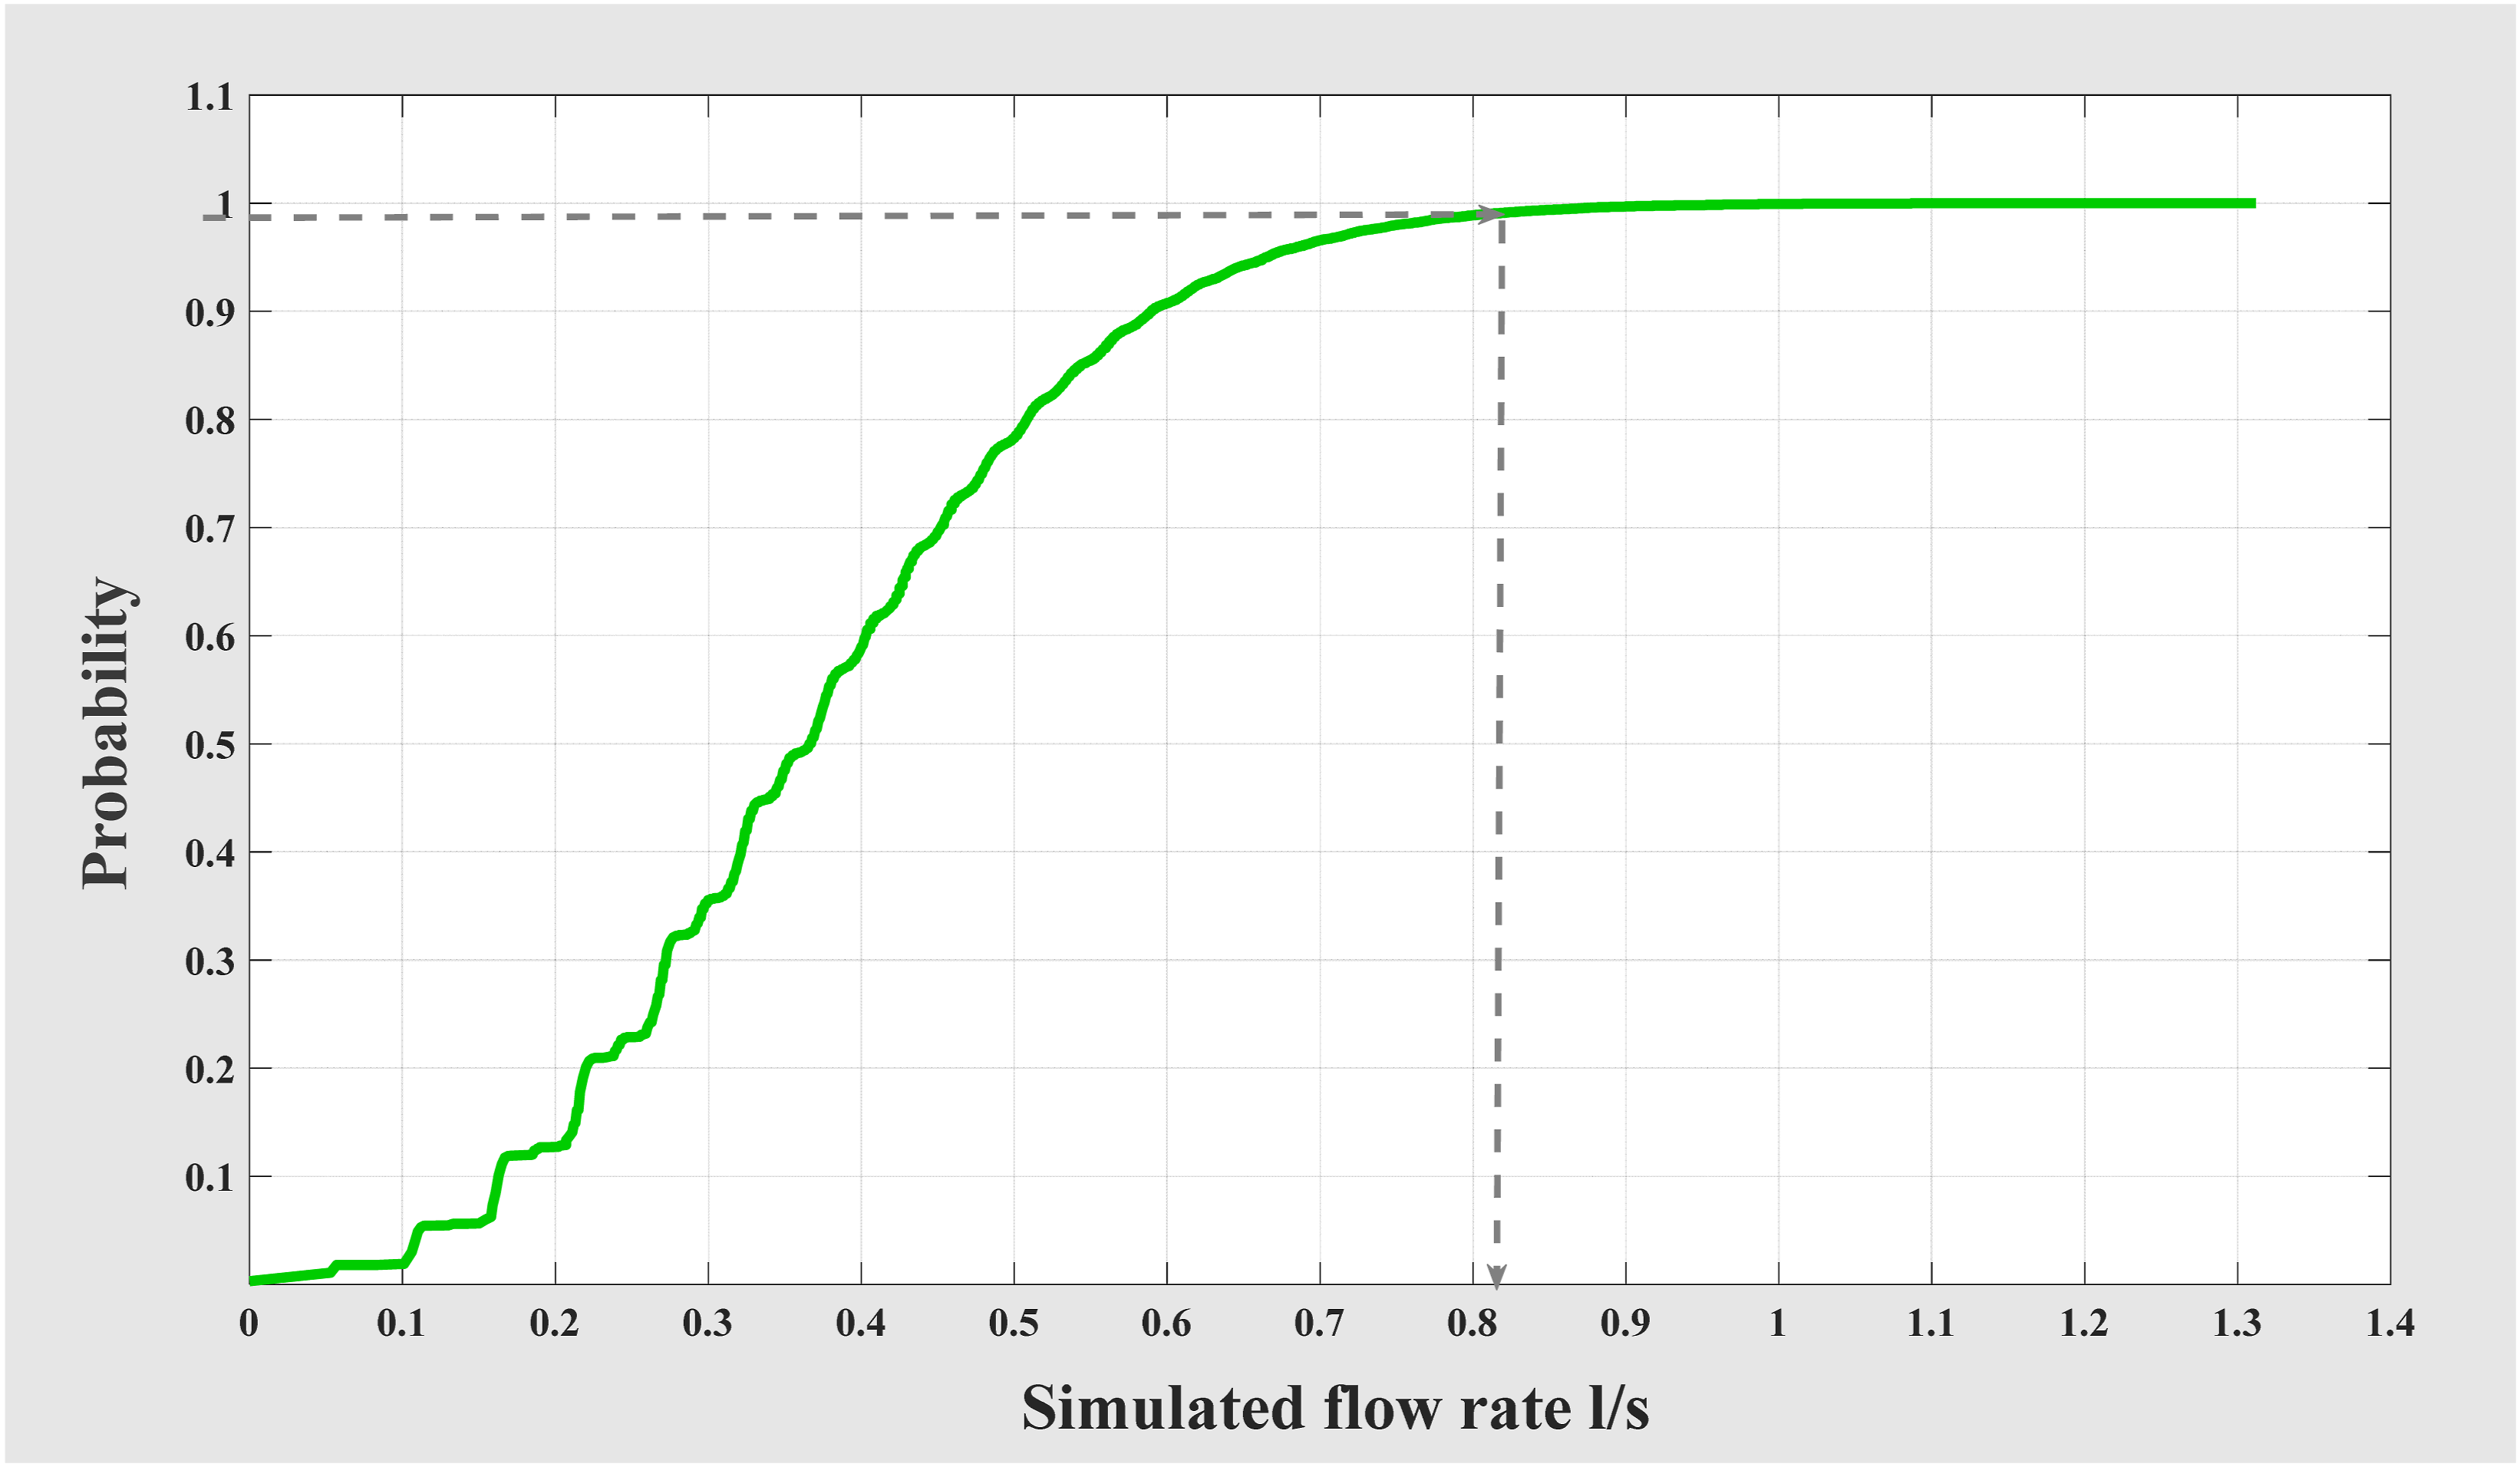
However, the model is designed to accept mixed appliances and can be applied to a specific building by using the installed or proposed combination of sanitary appliances, regardless of flow rate levels. The generalised form of the model expresses the design flow rate as a function of the number of users and appliance water-saving levels. Where a building contains appliances with different water-saving efficiencies, the input can be appliance-specific flow rates entered directly in WDEM or professional judgement can be applied by selecting a representative efficiency level (i.e. between the design lines) that best represents the appliance mix.
In the generalised model, design flow rates were simulated for all efficiency groups (A–E). For each efficiency group, the same method was applied iteratively to calculate new design flow rates across various occupancy levels (up to 2000 users). Figure 5 presents the simulated design flow rates as a function of user numbers for each appliance efficiency category. Simulated 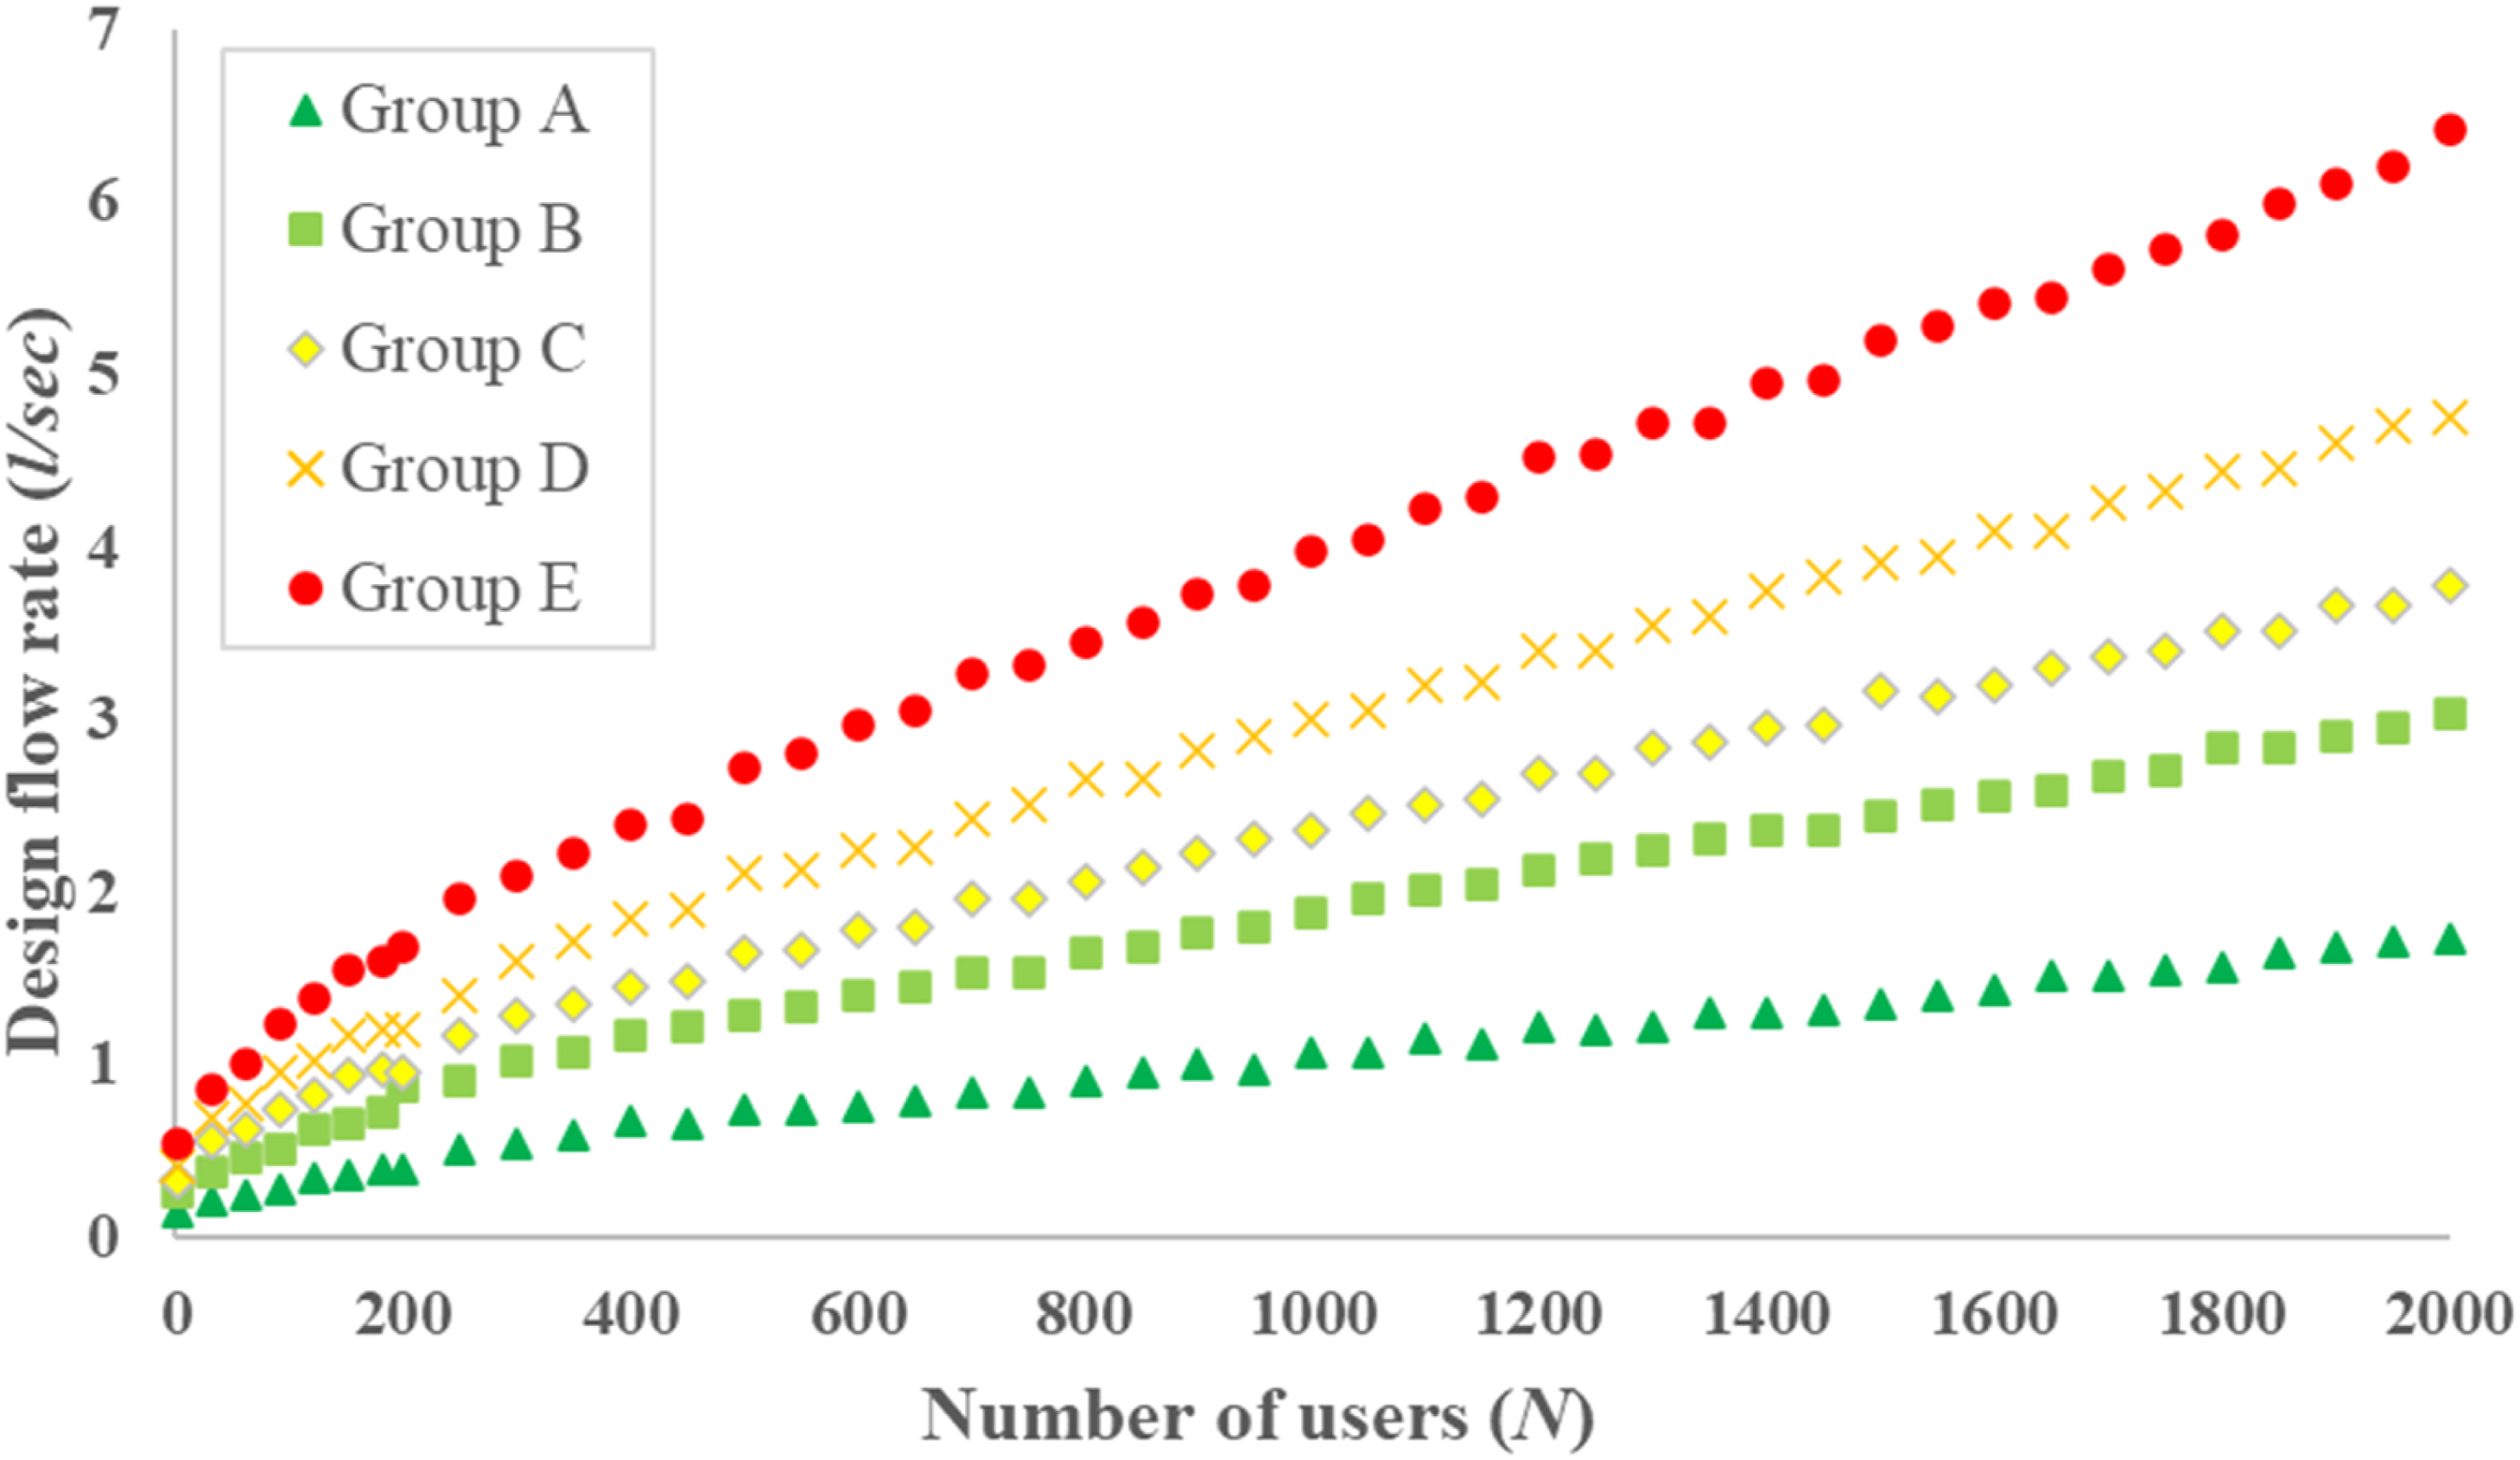
Regression analysis and establishing design equations
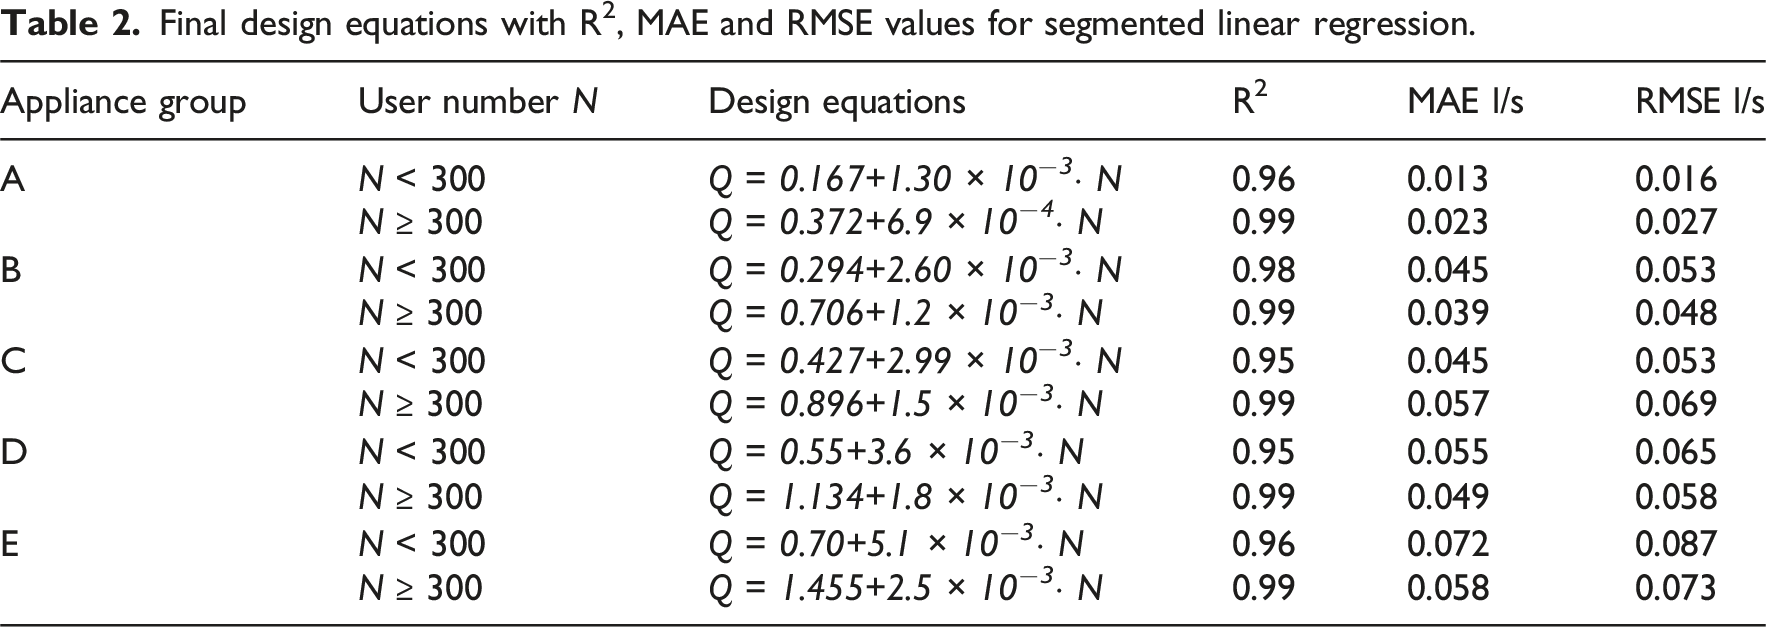
Final design equations with R2, MAE and RMSE values for segmented linear regression.
Impact of WDEM on reducing overestimation of design flow rate
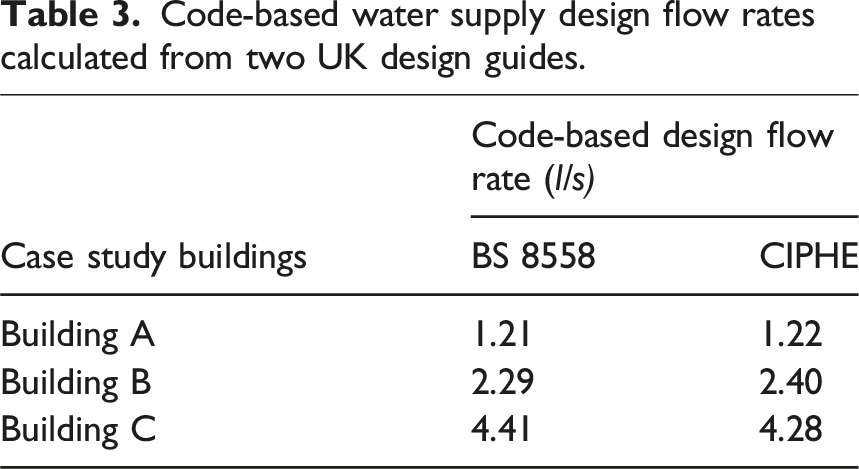
While the WDEM can, in theory, be applied to any building type given appropriate sanitary appliance input data, this stage of the research focuses on its application to non-residential buildings, assessed based on occupancy and appliance water efficiency levels. For this purpose, a comparative analysis was conducted between WDEM-derived flow rates and those obtained from widely used UK design guides. Three diverse case study buildings (A, B and C) at Heriot-Watt University were selected to represent varying building scales, occupancies, and functionalities: (i) Building A - a small, two-storey office building primarily serving university staff and visitors, accommodating approximately 50 occupants; (ii) Building B - a medium-sized, three-storey mixed-use building comprising offices, lecture rooms, social areas, self-catering facilities, and a coffee shop, with a maximum occupancy of approximately 450 people; and (iii) Building C - a large, three-storey mixed-use facility incorporating offices, retail spaces, a canteen, and coffee shops, with an occupancy of up to 1200 people.
Design flow rate based on the design guides
Code-based water supply design flow rates calculated from two UK design guides.
Comparison of flow rates obtained from WDEM and the design guides
Following the calculation of code-based design flow rates, WDEM-based design flow rates were determined for all the case study buildings. For this purpose, the installed appliance efficiencies in each building were assessed to assign the appropriate WDEM design equations. Most appliances in case study buildings B and C correspond primarily to efficiency group A. Building A featured a mix of appliances mainly within groups A and B, with a few appliances classified in group C. Accordingly, flow rates for buildings B and C were compared with the group A design curve, and building A with the group B design curve at the relevant occupancy levels.
For visual comparison, Figure 6 plots design flow rate (l/s) against the number of users. The triangle, square and diamond markers show average code-based flow rates for buildings A, B and C, respectively. The dotted trendline is a best-fit through these code-based points, illustrating how the conventional method scales with increasing occupancy. The two lower curves are the WDEM-derived design curves; the solid line is group A, and the dashed line is group B. The circular markers on the WDEM curves denote the exact design flow rates for the case study buildings at their corresponding user counts. Comparison of flow rates obtained from the design guides and WDEM results.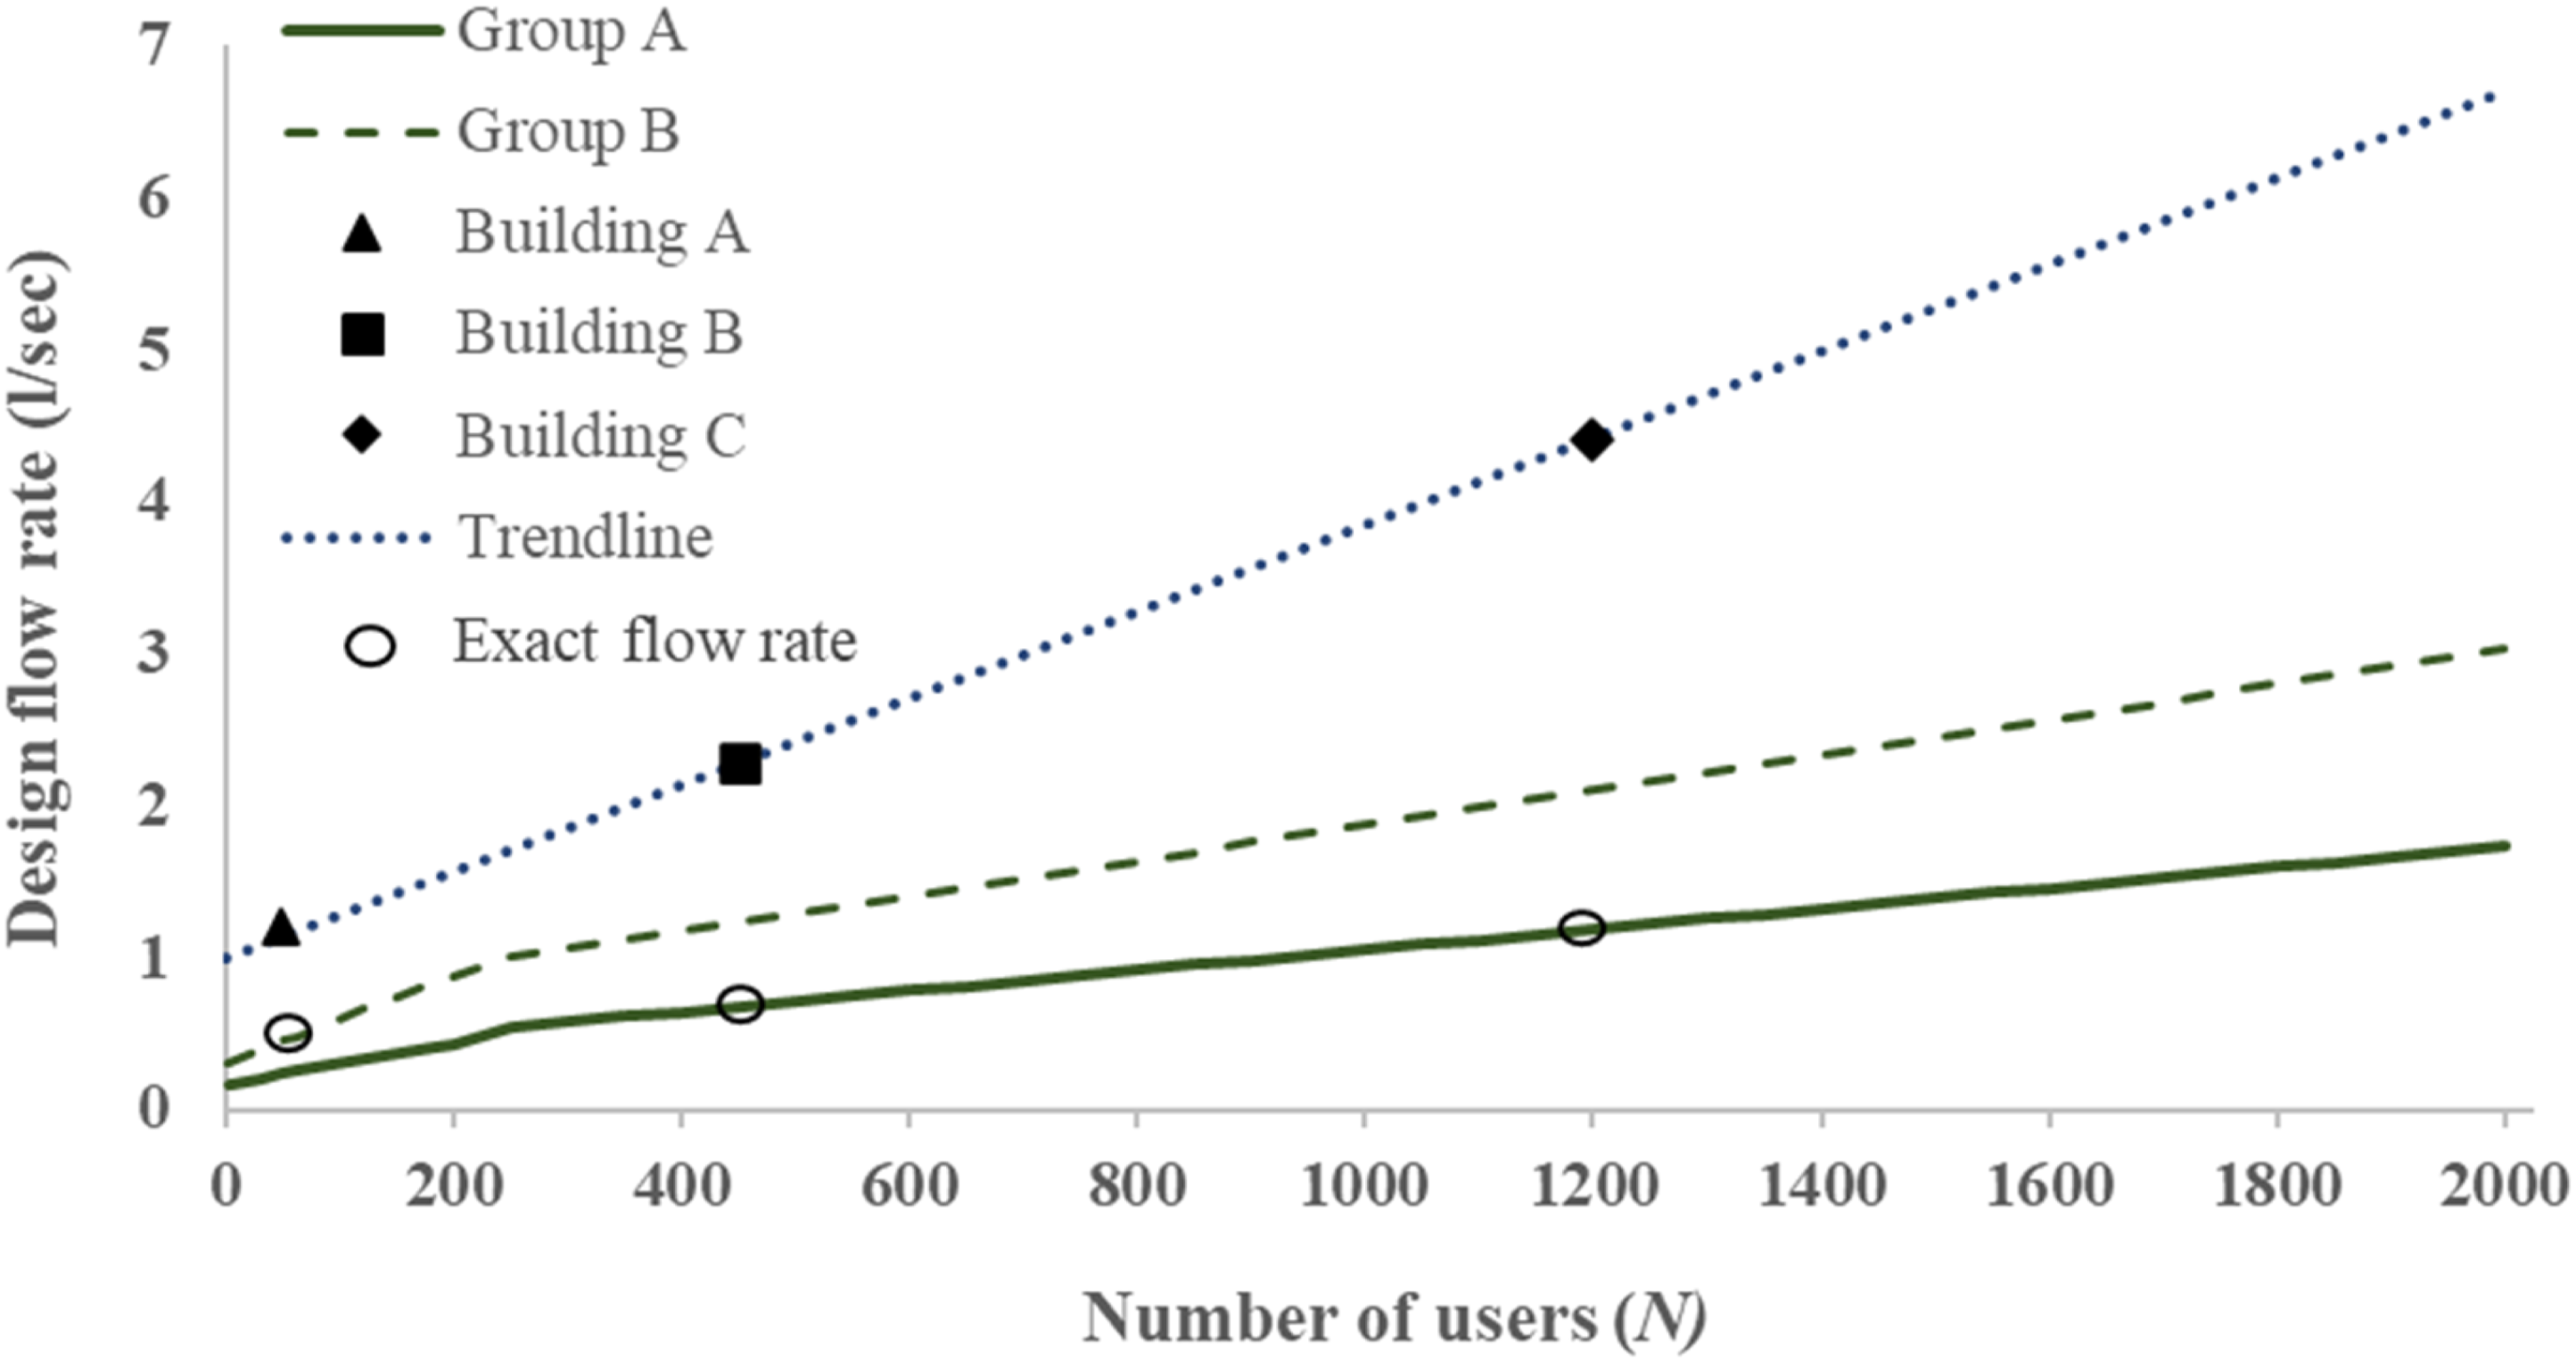
The results show that the WDEM curves generally predict lower design flow rates compared with the current design codes across all observed occupancies. The WDEM-based design flow rates are approximately 0.5 l/s for building A, 0.7 l/s for building B, and 1.2 l/s for building C, indicating design flow reductions of 63%, 72%, and 73%, respectively, for the case study buildings. These reductions demonstrate how the application of WDEM reduces total design flow rates across different building scales. In addition, the widening gap between the code-based trendline and the WDEM curves, especially at higher user counts, highlights the growing risk of oversizing when current design codes are applied to large-scale buildings. This systematic overestimation underscores the potential of WDEM as a robust and evidence-based approach for sizing water supply systems more accurately, once fully validated.
Conclusion
This study introduced WDEM, an innovative stochastic approach developed to address persistent oversizing in water supply systems for non-residential buildings. The WDEM incorporates contemporary data on sanitary appliance efficiency and user behaviour, using extensive Monte Carlo simulations to produce robust and realistic water usage scenarios. Through a comprehensive comparison of WDEM-derived flow rates with those obtained from the UK design guides in three case study buildings, this research clearly demonstrates the significant reductions in design flow rates, ranging from 63% to 73% depending on the building size. These reductions indicate the model’s effectiveness in reducing predicted design flow rates and mitigating the risk of oversizing in water supply systems in buildings. The WDEM is proposed as a framework for estimating building-specific design flow rates in non-residential buildings. Alternatively, the generalised form suggests initial design equations to estimate the design flow rate based on occupancy and the relevant appliance-efficiency rating. The fitted design equations showed strong agreement with the simulation outputs (R2 = 0.95–0.99) and low errors (MAE = 0.013–0.072 l/s; RMSE = 0.016–0.087 l/s). These design equations enable more reliable estimation of building design flow rates and help reduce the risk of oversizing pipework during system sizing. Thus, WDEM supports more robust and sustainable design decisions and represents a step forward in water demand modelling, aligning system sizing with modern efficiency standards and user behaviours.
While the model performs well compared with current design guides, validation against measured flow rates from real buildings was beyond the scope of this study. Future work should therefore focus on collecting measured flow rate data and comparing the results with WDEM predictions, to allow validation before adoption. This will allow uncertainty bounds to be quantified and any differences between simulated and measured demand to be examined, supporting model refinement and improvement based on real-world operating conditions. In addition, although the model demonstrates strong potential for broader application in non-residential buildings, further work is recommended to assess its suitability and extend its applicability to other building types and usage patterns.
Footnotes
Funding
The authors received no financial support for the research, authorship, and/or publication of this article.
Declaration of conflicting interests
The authors declared no potential conflicts of interest with respect to the research, authorship, and/or publication of this article.