
Abstract
Dry bulb air temperatures are increasing especially in the UK. On top of this there is the urban heat island intensity (UHII), the temperature difference between rural and hotter urban temperatures. This is important as most new and existing buildings are in urban areas subject to the urban heat island (UHI)., In this paper is an analysis of weather data in Manchester city centre is compared to the CIBSE Design Summer Year type 3 (DSY 3) weather data. The latter, based on weather data from the Meteorological Office at a non-urban contains little if any UHII data. The DSY3 is based on a very warm year but the lack of the UHII data severely underestimates city centre night time temperatures and overestimates the winter minima temperatures. This underestimates the heating effect for net-zero design for urban buildings. A simple algorithm, which has been derived from Manchester and London data, is shown to give a useful method of adding in the UHII.
Practical application
Some standard weather files underestimate night-time urban temperatures and this has potential for inaccurate heating and cooling predictions for new net-zero building designs. By comparing Manchester city-centre data with CIBSE DSY3 and applying a simple urban heat island intensity algorithm, designers can more accurately model real urban conditions, improving the reliability of thermal performance assessments and supporting better-informed building design decisions.
Introduction
CIBSE for its design weather data for designing buildings plant and assessing energy (contained in Guide A and updates 1 ) uses reliable UK Meteorological Office (Met Office) data. But Met Office sites are in flat grassy areas away from urban areas so that buildings and trees do not influence the measurements. Airports are almost ideal, but most buildings are in urban and city areas. In these urban areas there is often a rise in temperature due to the urban heat island (UHI) effect. The effect is measured by the UHI intensity (UHII) the difference between the urban temperature and the Met Office site closest. This paper examines the temperature data, both rural and city centre for Manchester, UK and compares it to the CIBSE Design Summer Year (DSY) for Manchester. It finds the lack of the UHII data in the DSY is a serious impediment to accurate design. The paper also finds that the UHII is not increasing significantly after the Covid blip even with the rapid change in the construction of tower blocks in Manchester City centre.
The urban heat island intensity (UHII)
The urban heat island 2 is generated by a number of factors, including the absorption of solar irradiance on urban fabric and its heat storage within the urban fabric as well as the heat generated from human activity in the urban areas, including the outputs from heating and cooling systems.
Urbanisation is increasing in the world. 3 The greater the urbanisation the greater the increase in the urban heat island intensity (the difference between urban and the rural temperatures). 3 This has been shown to be happening in Manchester City centre in a previous paper. 4 Hence the concern of the UHII adding to the increasing climate change temperatures of the future.
Figure 1 shows the daytime UHII in the centre of Manchester (China Town). The China Town air temperatures are measured by a temperature sensor, an i button which communicates using the 1-Wire protocol, requiring momentary contact with a reader to exchange data. The i button is hooked into a radiation shield made in the university. The shield is attached to a lamppost about 3m above the pavement. About 60 shields and i buttons were placed around Greater Manchester. Full details are in are in Cheung.5,6 Figure 2 shows an i button and a shield. The rural air temperature is from the nearest Met Office site, Rostherne, in rural Cheshire. China town UHII daytime 2022. i button on base plate and hook which is hooked into the radiation shield, right, attached to a lamppost by ties around the aluminium bar, right, and the lamppost.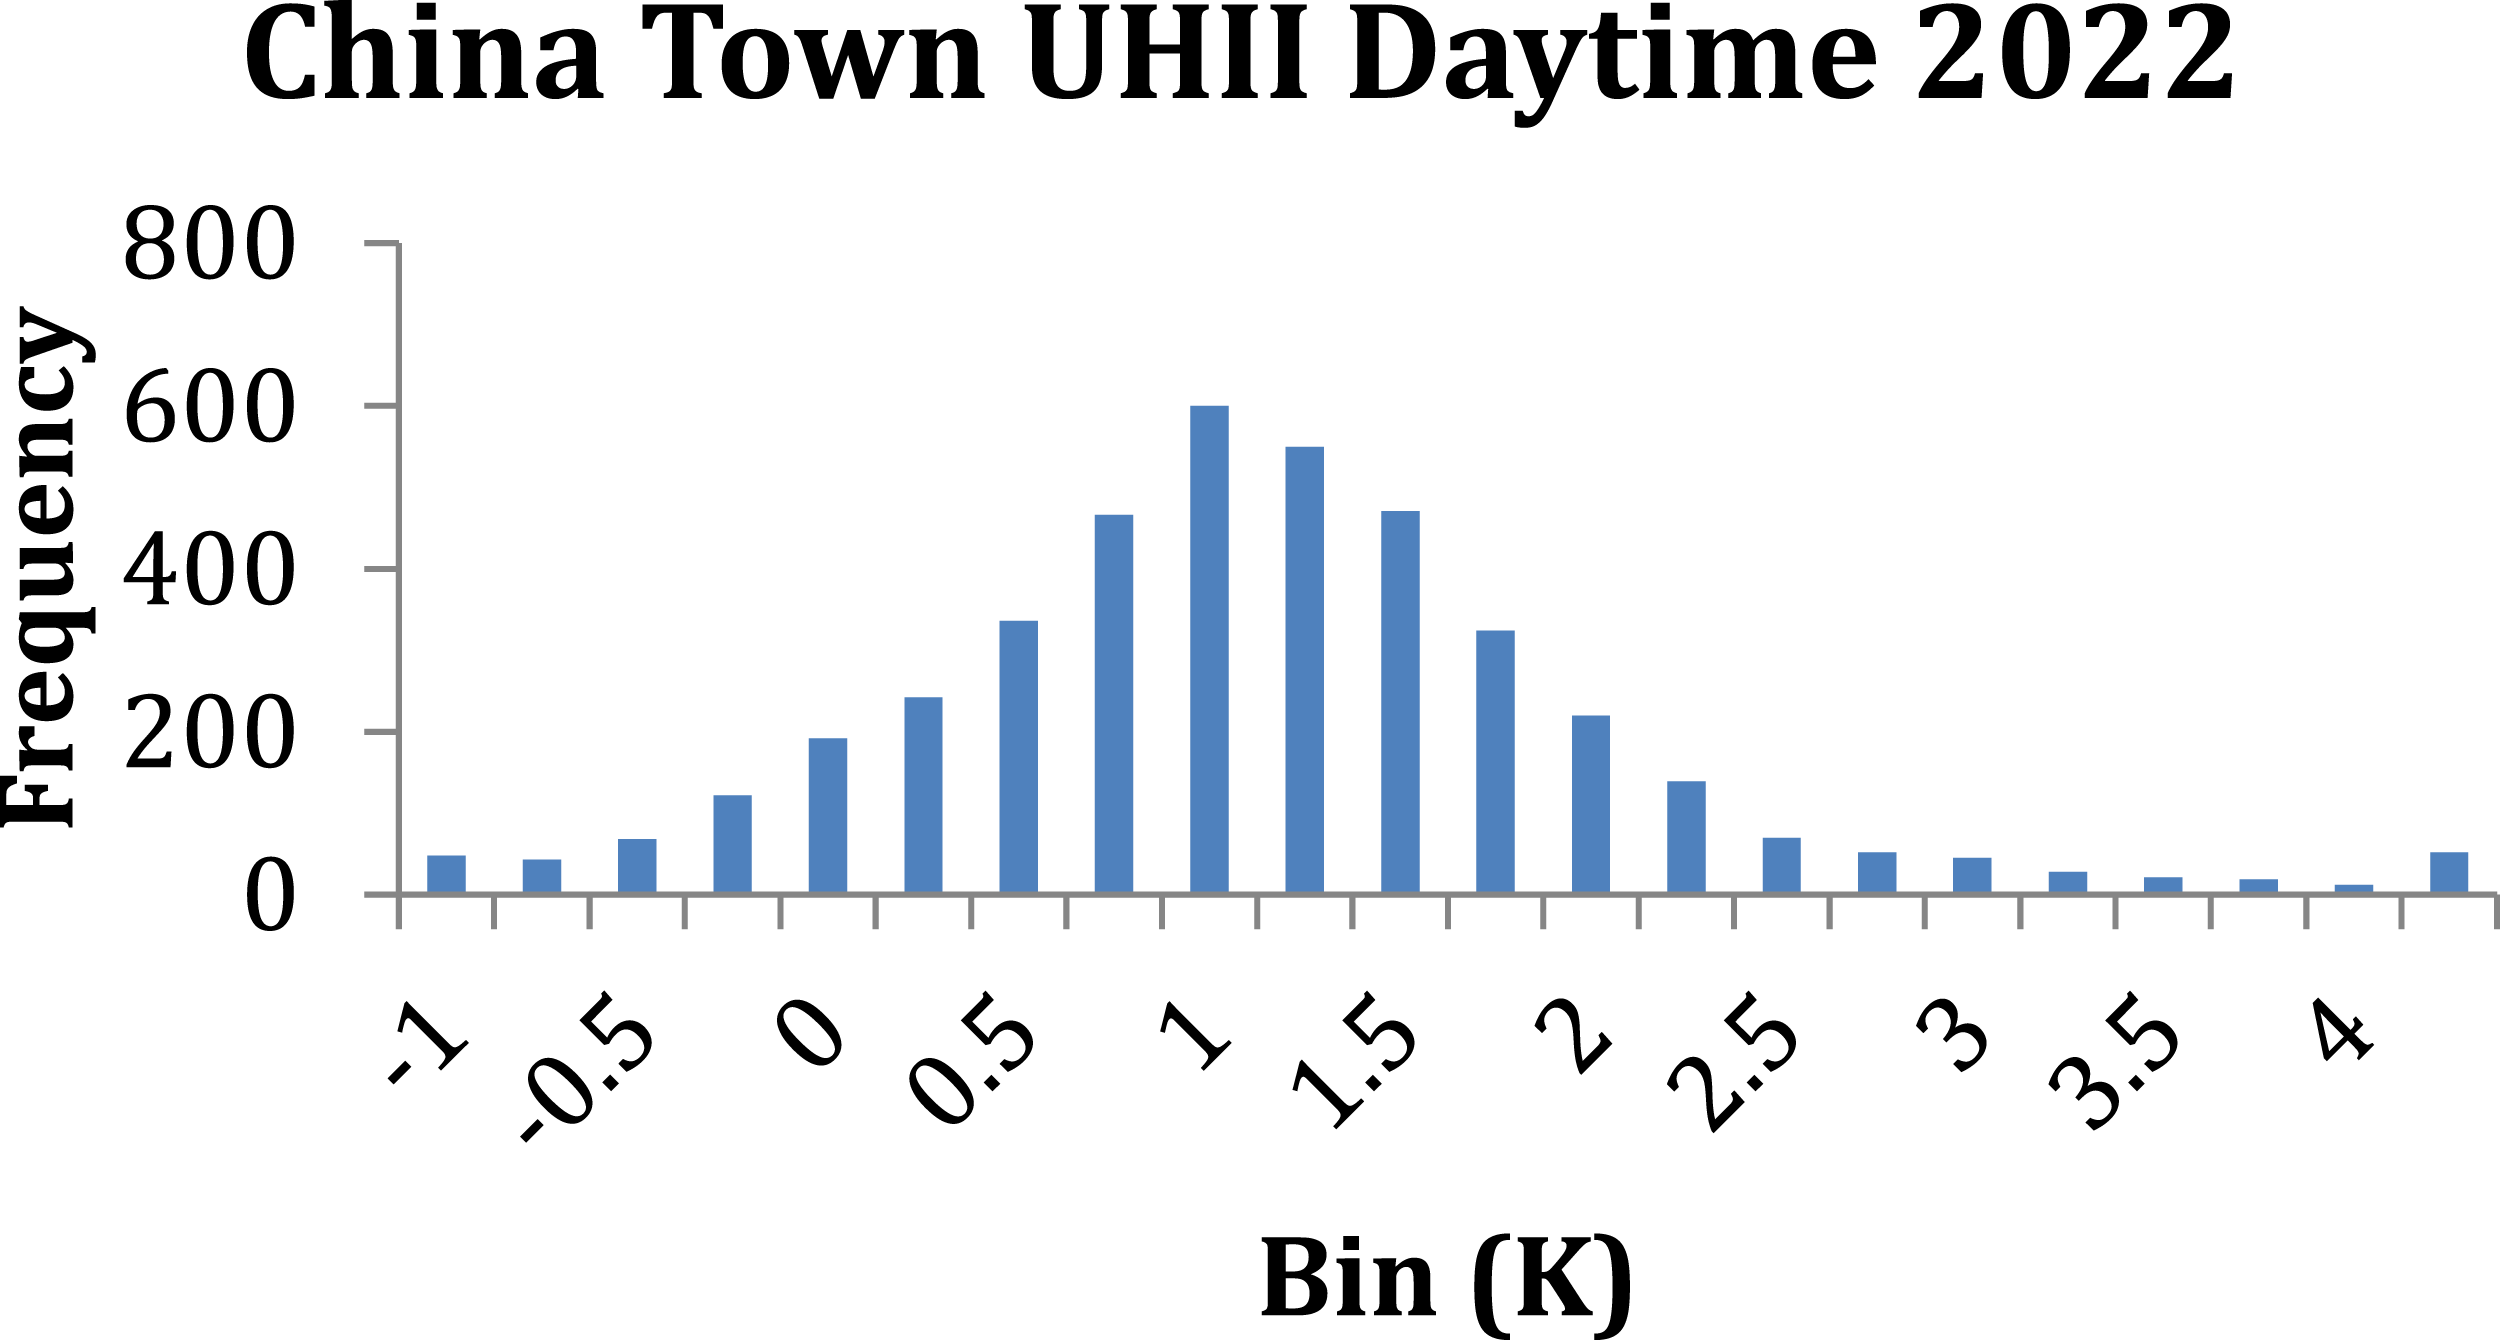

Measurements of the accuracy of the 60 i buttons used in the project yielded a standard deviation of 0.034°C (at 30°C test temperature, warm test) and 0.021°C (at 5°C test temperature, cold test). 5 Comparing a representative i button with a calibrated i button (certified to standard EN 13,005 and ISO 17,025) showed a difference of 0.026°C (warm test) and −0.333°C (cold test). The “clock” in the i button did drift over time and each download (about every 3 months) the clock was reset. The Met Office use platinum resistance thermometers for temperature measurement with an accuracy of ±0.1°C. 7 However, for both the Met Office sensors and the Manchester i buttons, they were placed in a Stevenson screen and radiation shield respectively. The radiation shield performed well against the Stevenson screen. 5
Referring to Figure 1, the highest frequency of the UHII is 1K with values going up to 4K and down to -1K (the urban area for a very short time actually providing an urban cool island).
Figure 1 is for the daytime (defined below). Figure 3 shows the UHII for China Town for the nighttime (defined below). It is a very different distribution from Figure 1. This is primarily because on clear, cloudless nights there is radiation from the earth to the clear sky through the earth’s infrared (8 μm to 11 μm) atmospheric window.
8
Without the solar irradiance the atmosphere is more stable and a temperature inversion occurs over the rural site. However, this is far less pronounced over the urban area where the buildings shield the view of the “cold” sky. In fact, in China Town the sky view factor, or the fraction of a hemispherical sky that can be seem from street level is 37%. Added to which the stored heat from the surrounding buildings keeps the air temperature warmer. As a result, the UHII values are higher, the modal value being 1.5 K. The daytime is defined as the when the measured global horizontal irradiance over the hour is ≥50 kJ m−2h−1, nighttime as <50 kJ m−2h−1. Hence the frequency is related to the 4126 daylight hours and 4634 night time hours. The nighttime modal value in the 1.5 K bin has a frequency of 1,034 hours whereas the daytime modal value in the 1.0 K bin is 600 h. China town nighttime UHII 2022.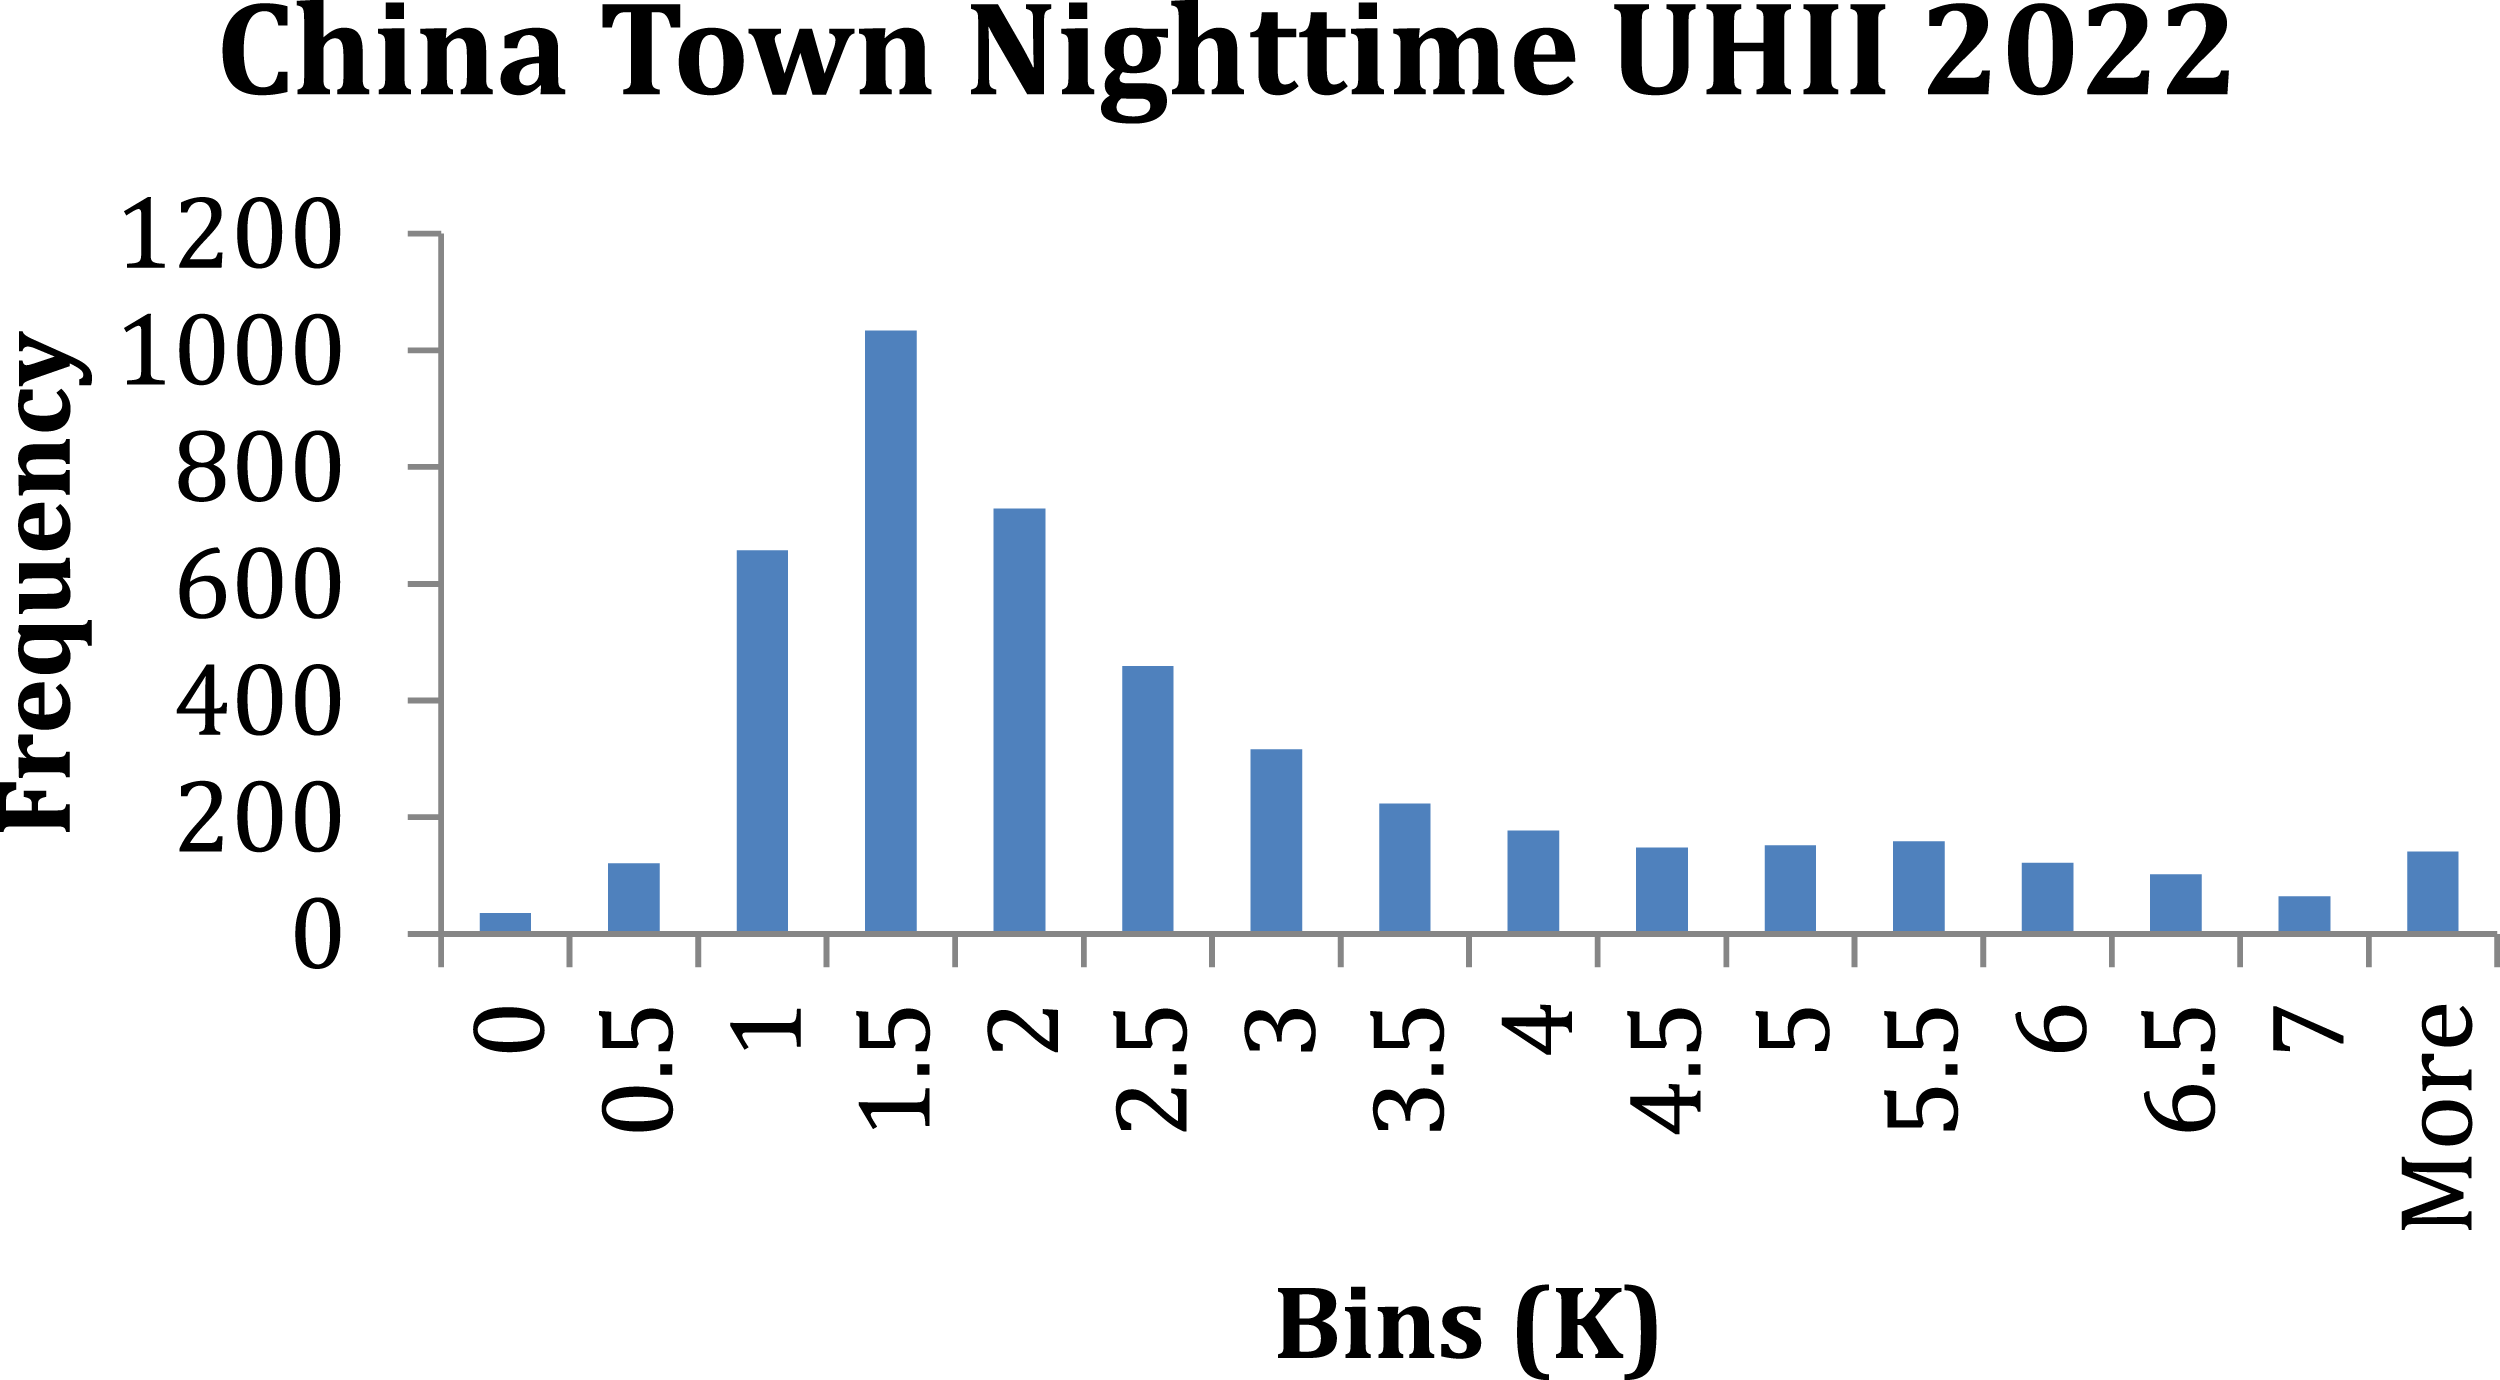
Design summer years
For design using simulation hourly values of meteorological data is required. With modern highly insulated buildings overheating in summer is now a problem rather than underheating in winter. For summer conditions a near-extreme year is required for adequate design to assess overheating in the UK. 9 Overheating risk assessments are conducted by using dynamic thermal simulation models running a near-extreme year, the CIBSE Design Summer Year (DSY). The DSY is a historical year, originally selected on the basis of being the year with the third warmest April–September period from a set of 20 years. Originally the DSY for London was 1989 and the weather data used was from the Met Officeffice London Heathrow Airport site. However, a better method of assessing the DSY has now been developed taking account of likely thermal discomfort. The method is fully explained in the CIBSE (2014) TM 49: Design Summer Years for London. 7 TM 49 now defines three DSYs. One with a moderately warm summer, one a year with a long period of persistent warmth, and a third with a more intense single warm spell. As the method is also used with future climate data from the UKCP09 Climate Change Projections 10 the DSYs are probabilistic DSYs or pDSYs. 11 The moderate summer one is referred to pDSY-1, the “long period of persistent warmth” pDSY-2 and the third, pDSY-3.
The method of determining the pDSYs has been subsequently been improved 12 and more modern climate change data based on UKCP18. 13 New pDSYs have also been determined for other cities around the UK. Although most of them are probabilistic for the future there are those based on historical data, referred to as DSYs. The historical data has been updated 14 to a new baseline, 1994-2023, which has produced new DSYs. For Manchester the new DSYs are: DSY-1 1983, DSY-2 1976 and DSY-3 2022 based on weather data from the Met Office site Hawarden, an airport site near Chester. As the Manchester City centre measurements undertaken by the authors only started in 2011, only the DSY-3 for Manchester can be compared.
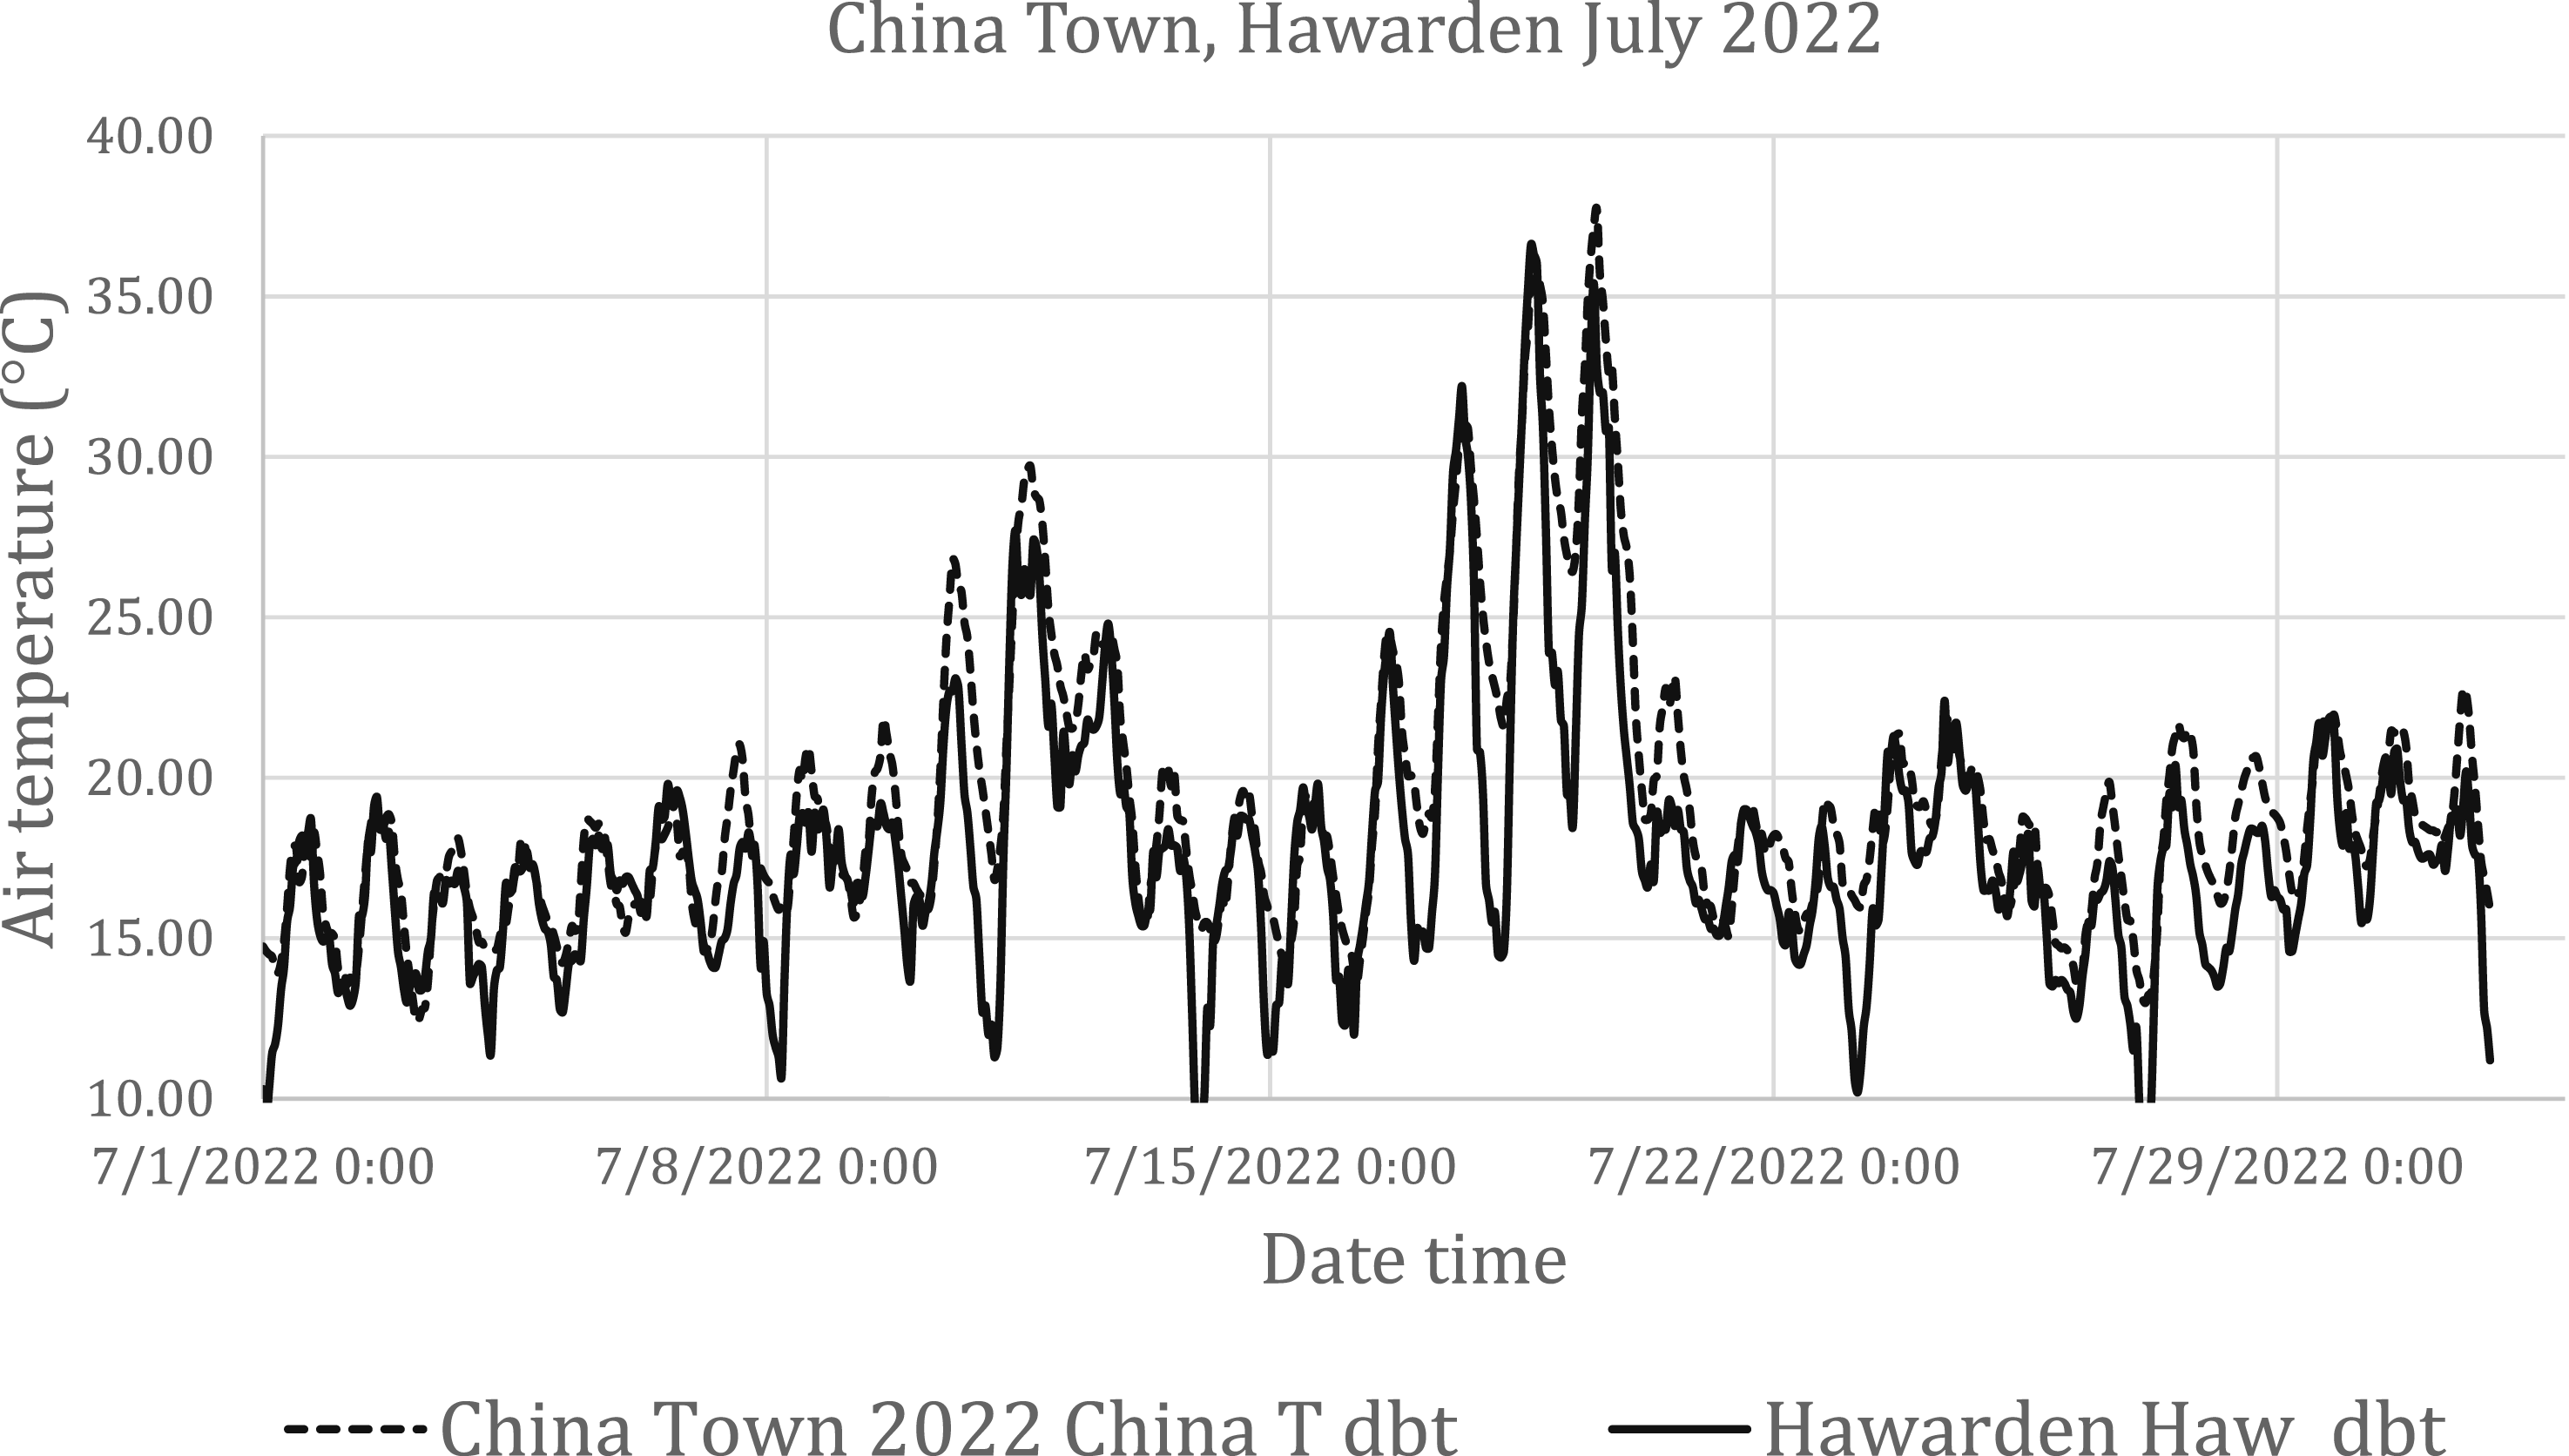
Figure 4 compares the Met Office Hawarden for January 2022 with measurements in the centre of Manchester (China Town). Figure 5 shows the two sites for July 2022. The differences, especially at the peaks and troughs, are significant. China town and Hawarden January 2022. China town, Hawarden July 2022.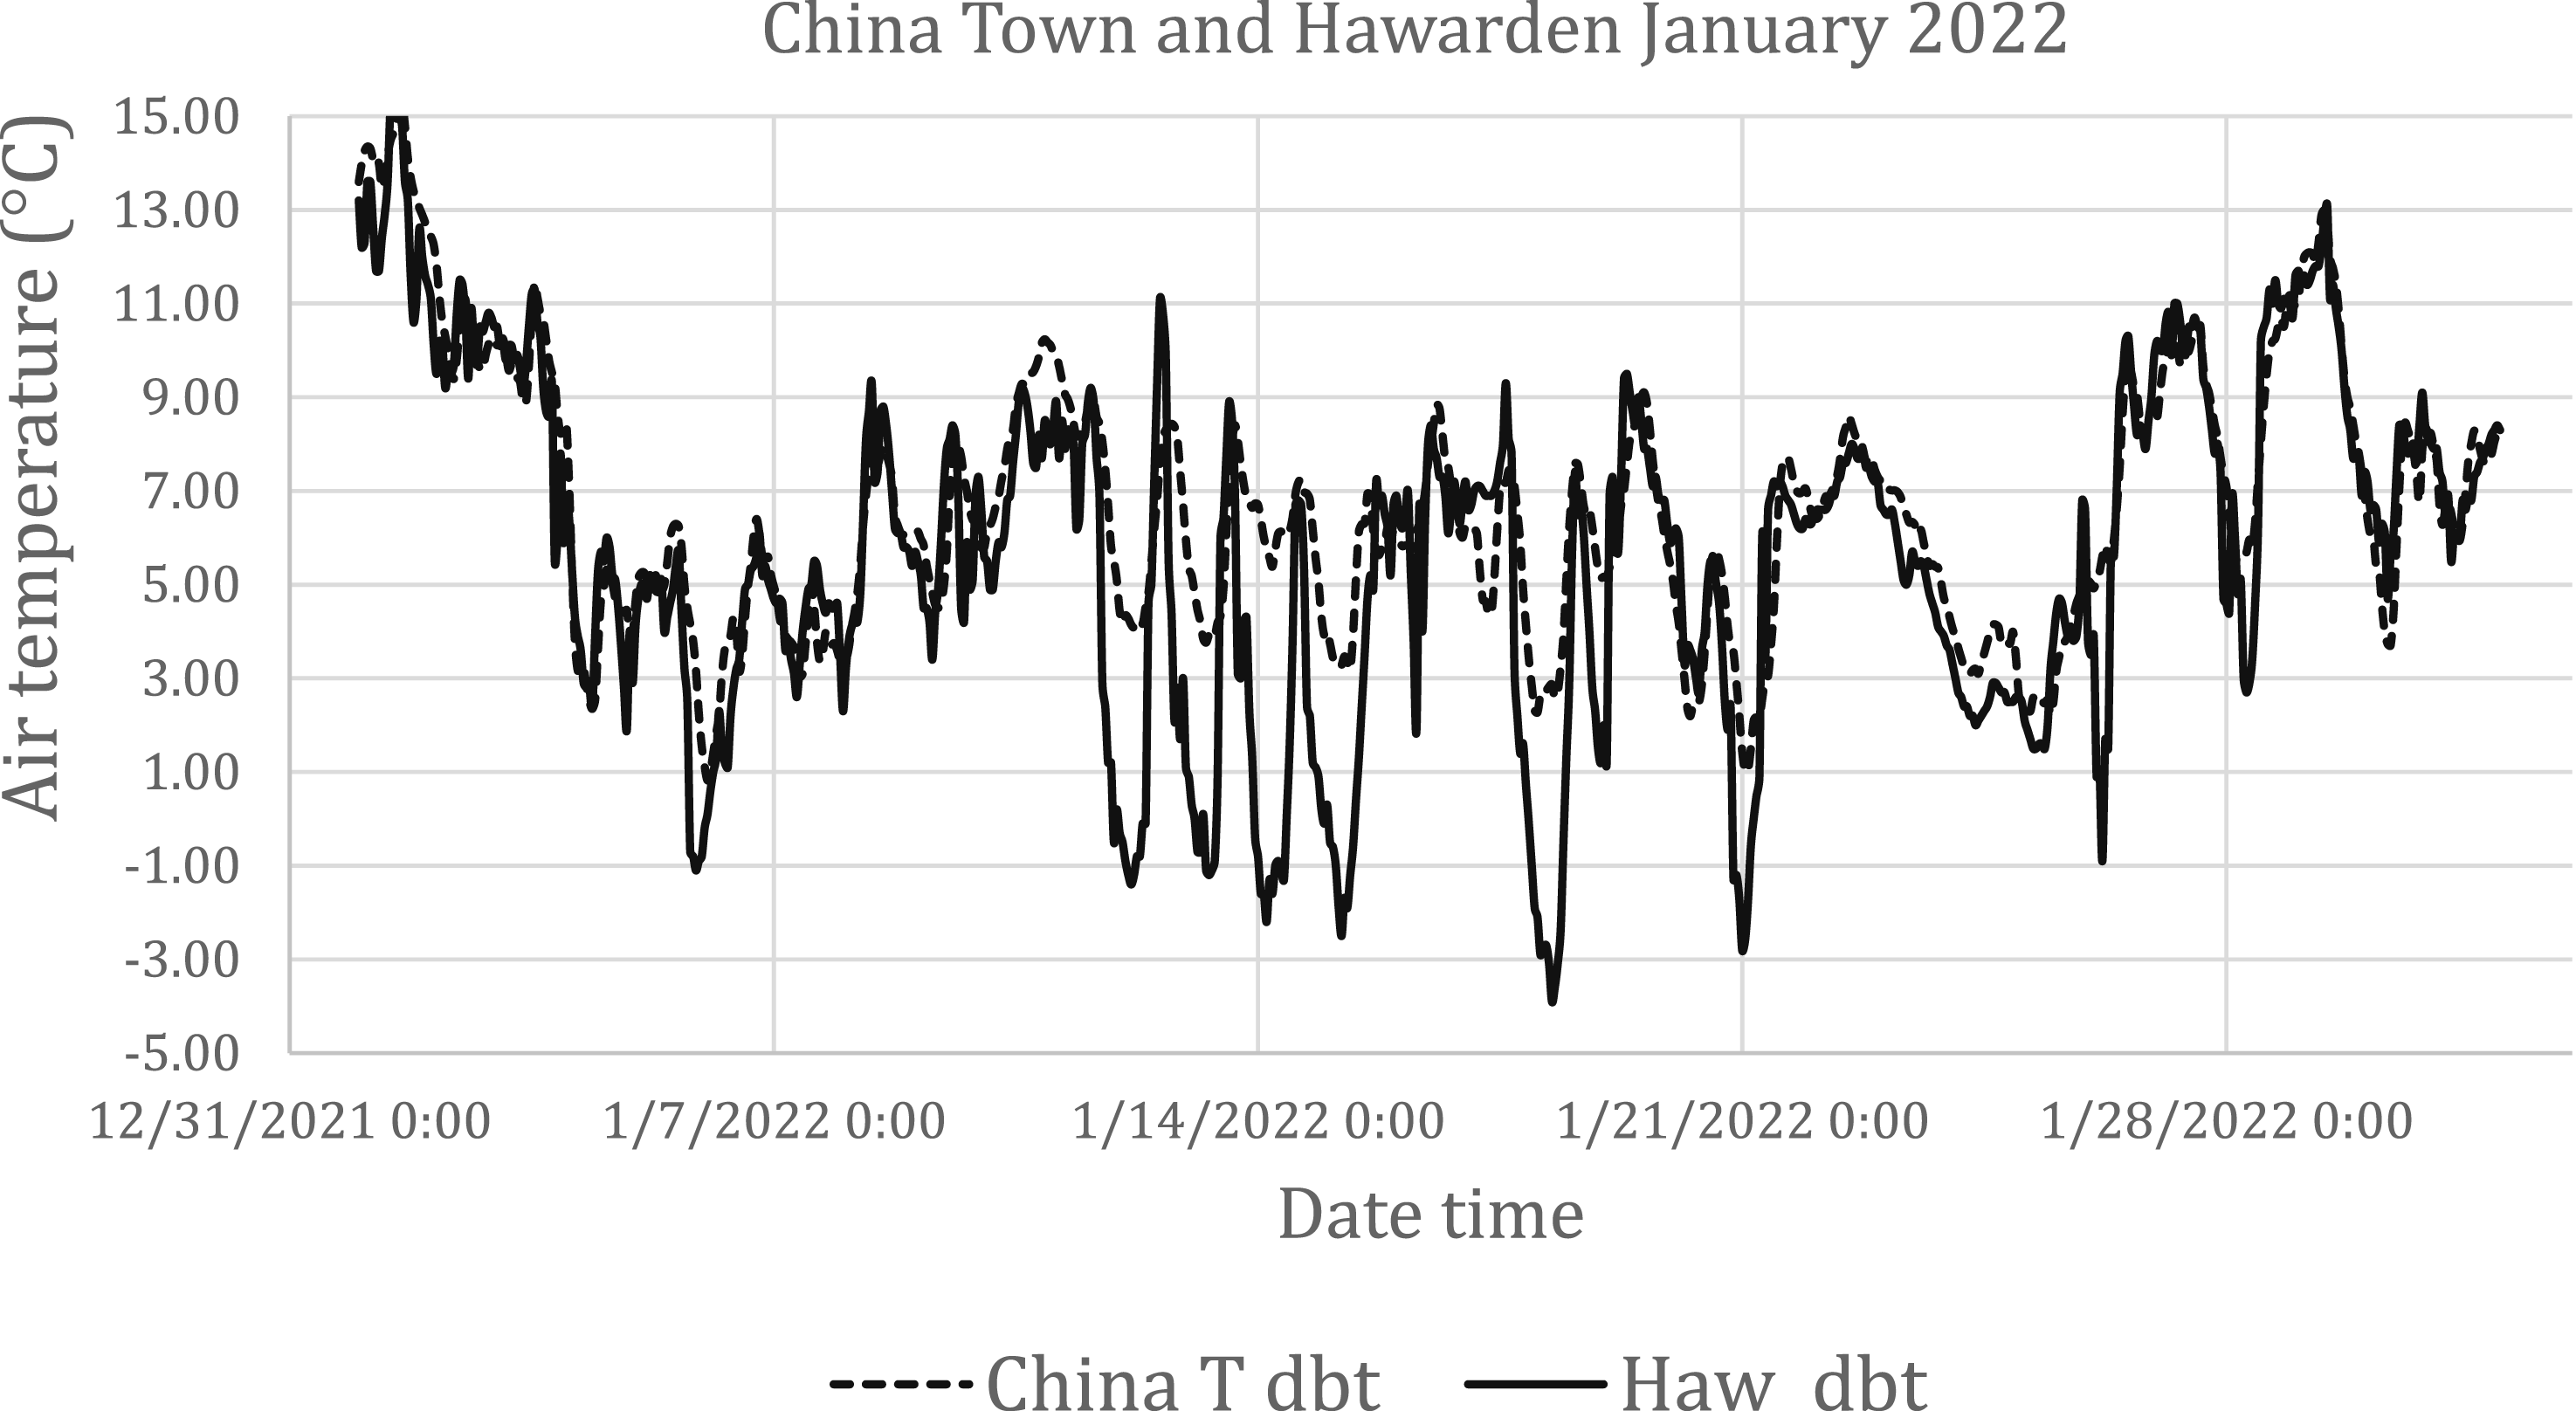
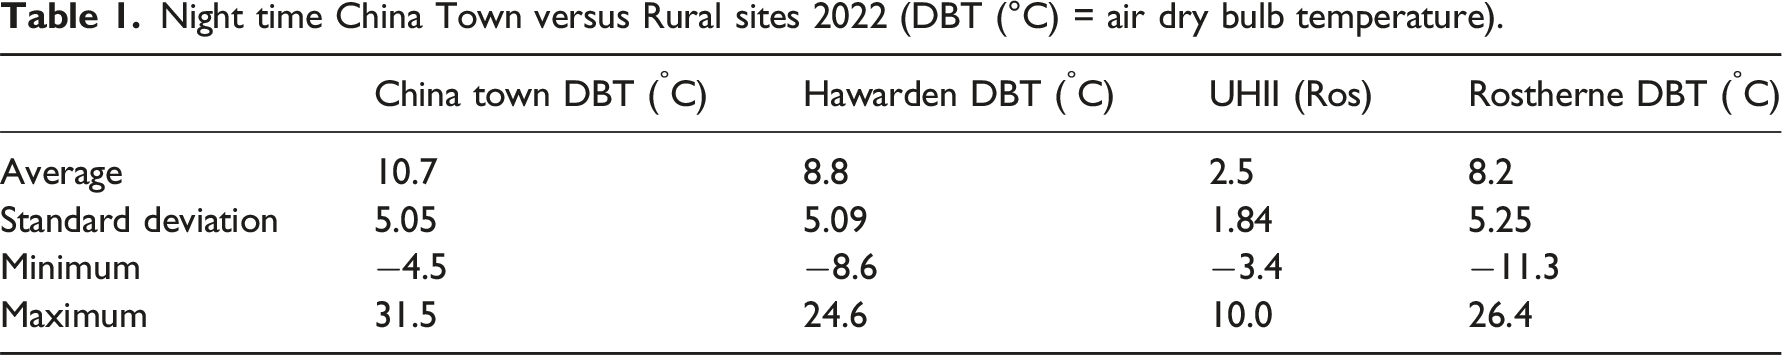
Night time China Town versus Rural sites 2022 (DBT (°C) = air dry bulb temperature).
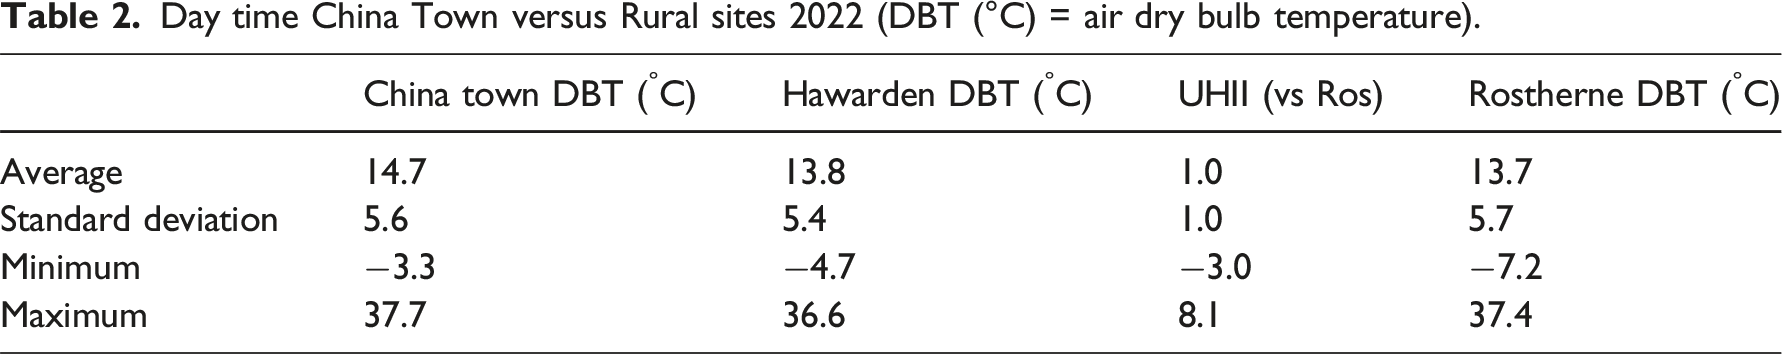
Day time China Town versus Rural sites 2022 (DBT (°C) = air dry bulb temperature).
London pDSY sites
The first pDSYs were developed for London. To include the UHI the London Weather Centre site’s data was used. This site was based on the rooftop of a building in Holborn. It was not an ideal meteorological site and has been discontinued. However, it probably included a significant UHII and represented an “inner urban” site. 7 The main site used by CIBSE for London was the Met Office Heathrow site, at the airport. This indeed has its own UHI 15 and the Met Office Gatwick site is used as a rural site.
Manchester pDSY site
The Met Office Manchester site used for determining the pDSYs is at an airport at Hawarden, near Chester. The authors for their UHI work used the Met Office Rostherne site, in the middle of a large field, closer to Manchester city centre. However, the Rostherne site has only been used since 2011 and so does not have the 30-year period needed for analysing near extreme years, whereas Hawarden has been in use for over 30 years. Figure 6 shows that there is little difference between the sites for 2022, although the average monthly minima temperatures for Rostherne are significantly lower than for Hawarden. 2022 is shown as that is the year chosen for the CIBSE DSY-3. The DSY -1 and DSY-2 are years before the Manchester UHI work by the authors started. Rostherne and Harwarden average monthly values for 2022, the Manchester DSY - 3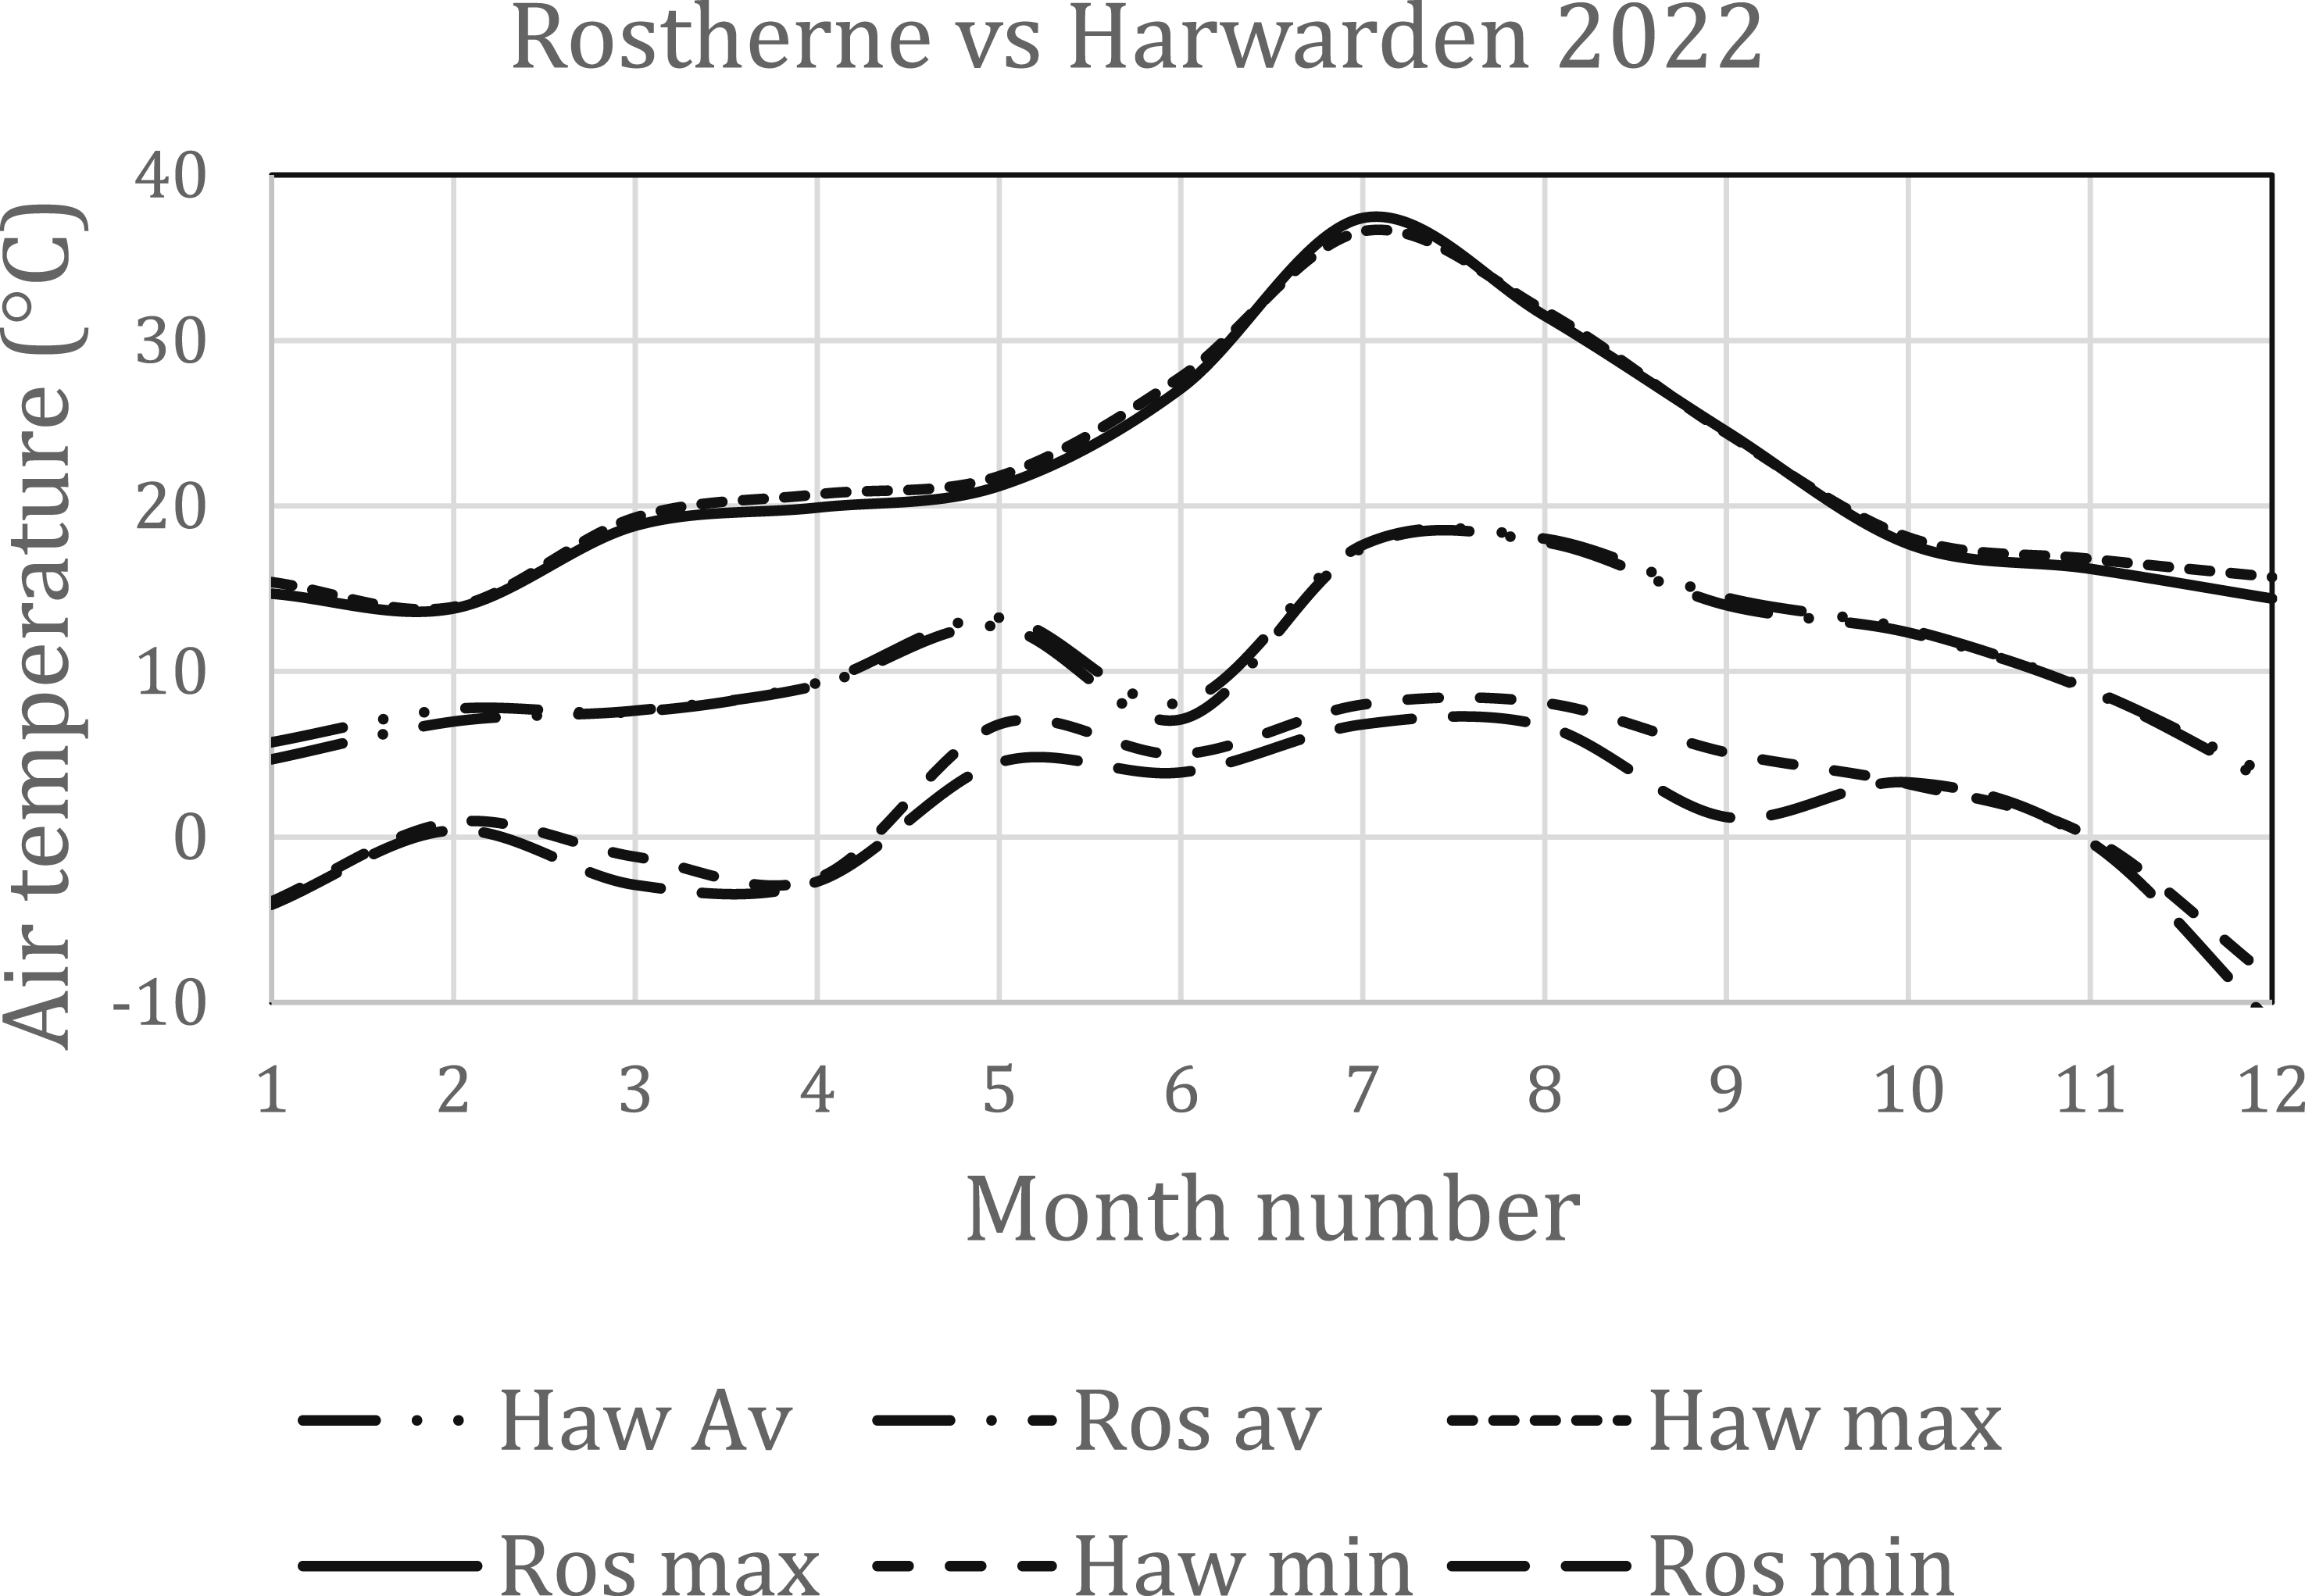
Comparison of the CIBSE manchester DSY - 3 (2022) with manchester city centre data for 2022
Figures 4 and 5 show the differences for January 2022 and July 2022 respectively. Figure 7 shows the average monthly values for 2022 for China Town and Hawarden. It also shows that the minimum average temperatures are lower for Hawarden, whereas the average maximum values are very similar. Manchester city centre (China Town) and Harwarden average monthly values for 2022, the Manchester DSY - 3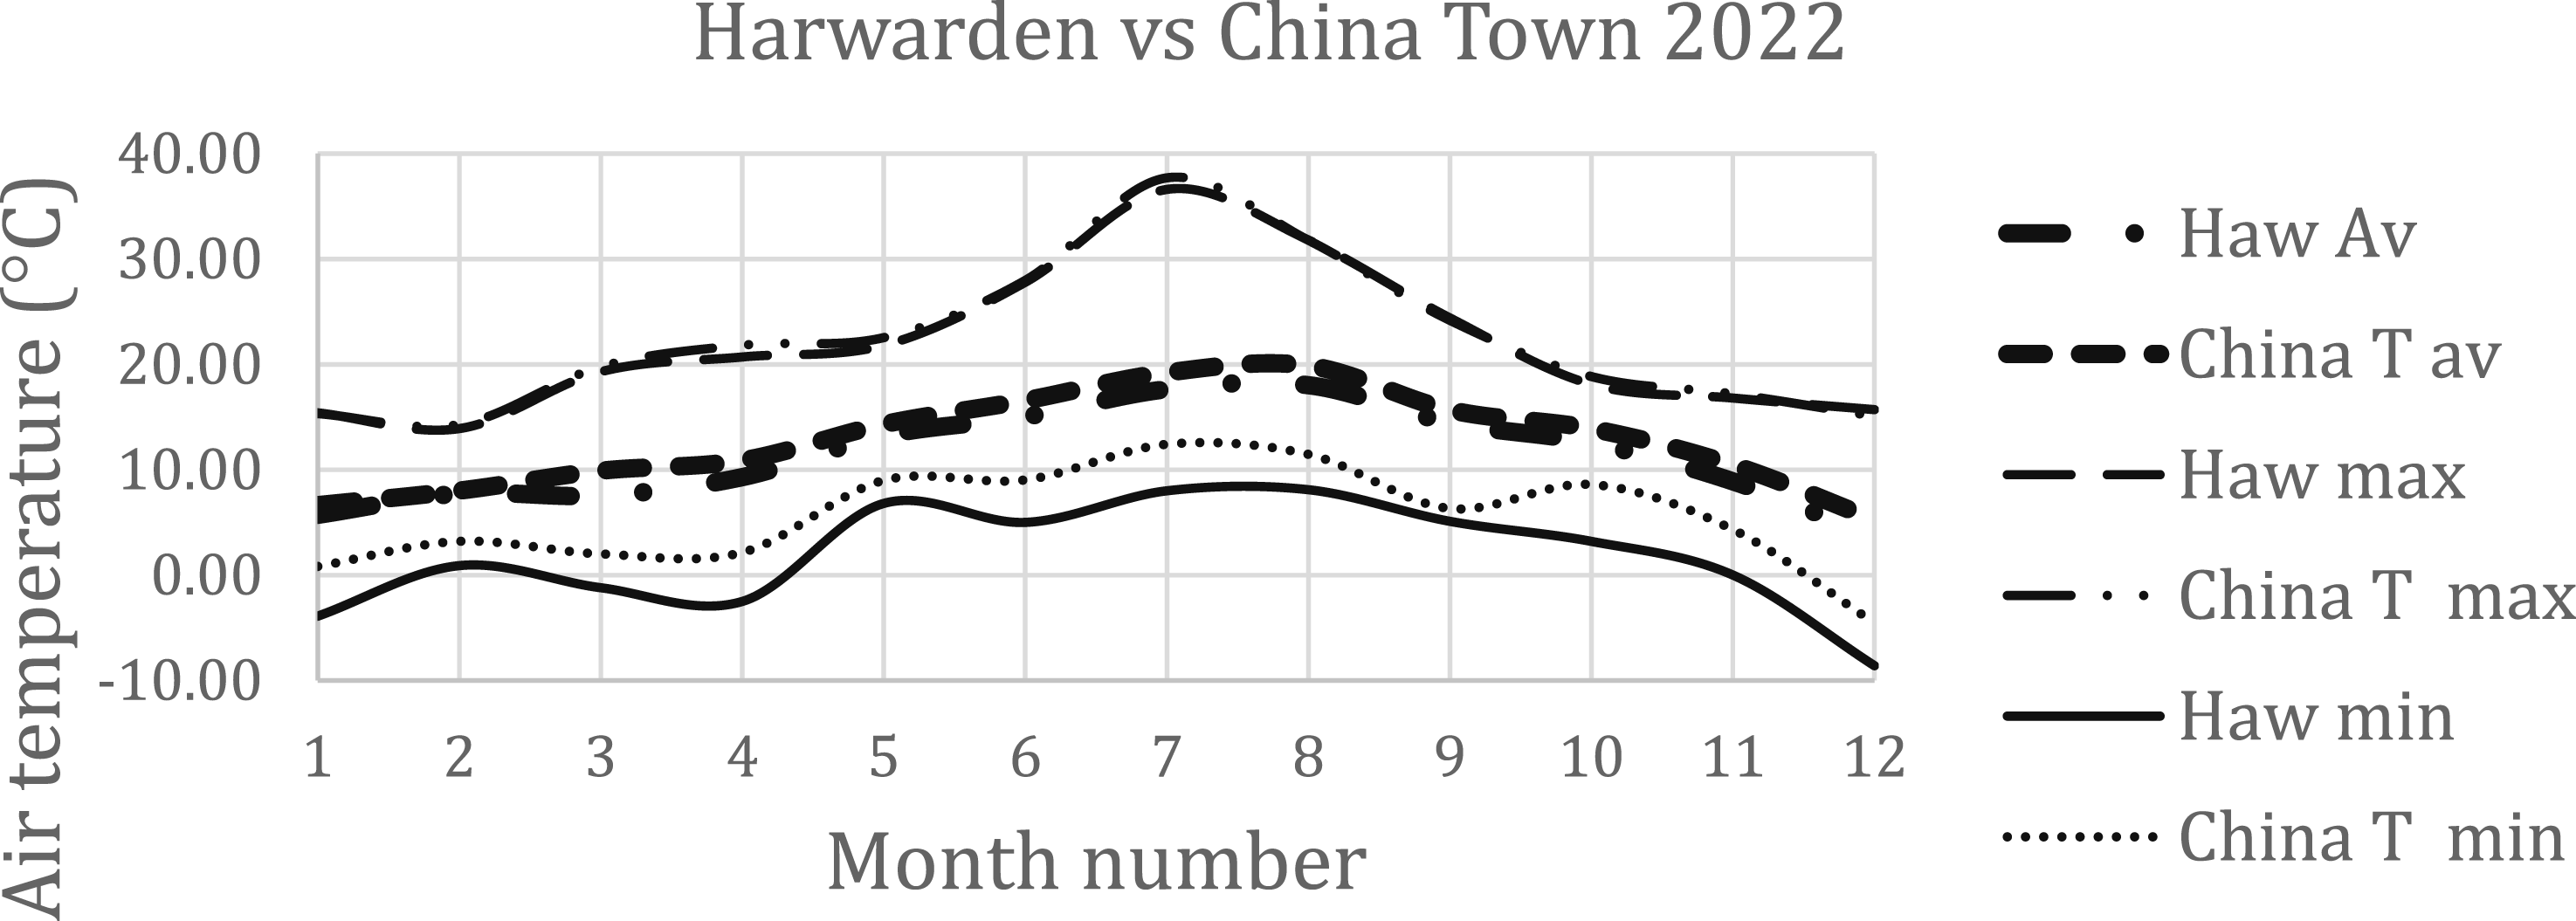
The consequences for design of not using city centre data for city centre buildings
The Manchester City centre air temperatures are warmer than the rural CIBSE DSY – 3. But does this make much difference to the design of buildings in Manchester? An indication of the error can be addressed by comparing the cooling degrees hours. The cooling degree hours are the number of hours that the temperature is above a base temperature, it being assumed that above this temperature the air conditioning is switched on or the room becomes uncomfortable.
Cooling degree hours comparison
Figure 8 shows the cooling degree hours to the bases of 25°C (clg25) and 22°C (clg22) for China Town, Rostherne (Ros) and Hawarden. They are for complete days rather than separating day and night. Cooling degree hours for China Town, Rostherne (Ros) and Hawarden 2022.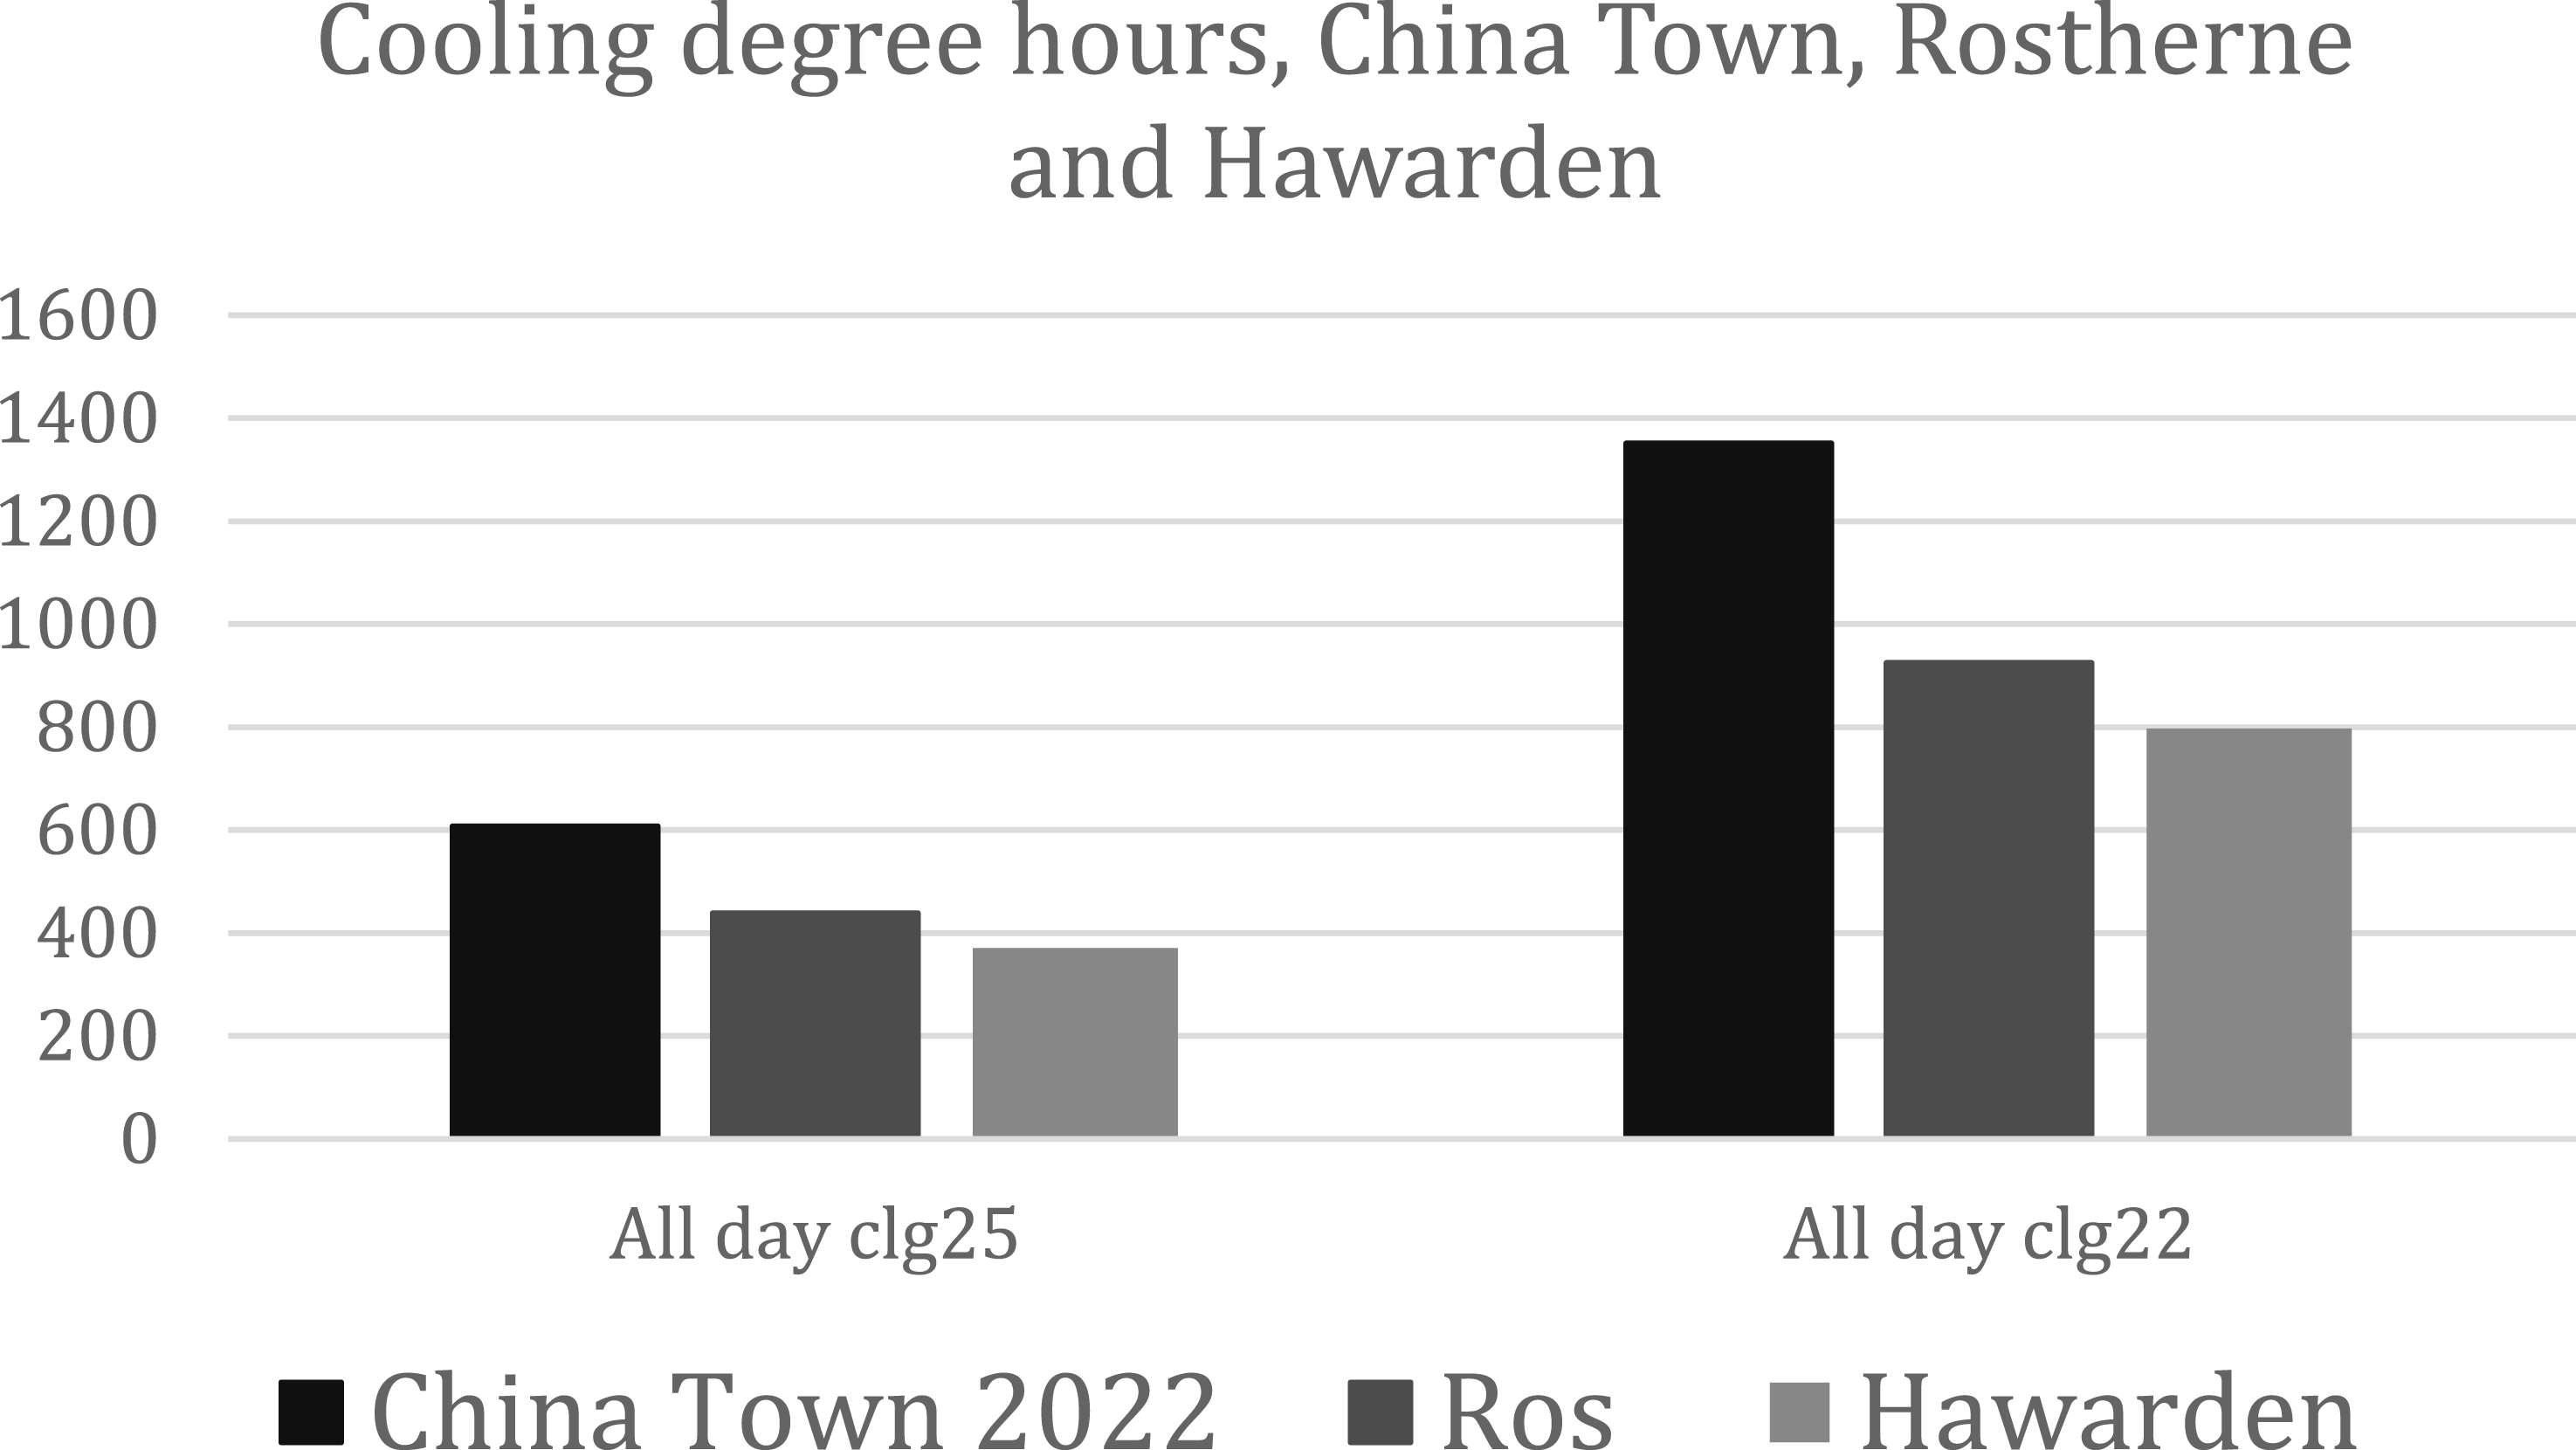
The clg25° h for China Town, Rostherne and Hawarden are 607 Kh, 429 Kh and 371 Kh. The Hawarden cooling degree hours are almost 40% lower than those for China Town.
Heating degree hours comparison
Figure 9 shows the heating degree hours. As China Town is warmer the heating degree hours are less than for Hawarden and Rostherne. The heating degree hours base temperature (below which the hours are counted) is taken as 18°C. This gives China Town 52,078 Kh compared to 66,118 Kh for Rostherne and 62,561Kh for Hawarden. This would correspond to a saving in heating energy in the city centre compared to the rural sites. At all sites the heating degree hours are much higher during the nighttime. Heating degree hours for China Town, Rostherne (Ros) and Hawarden 2022.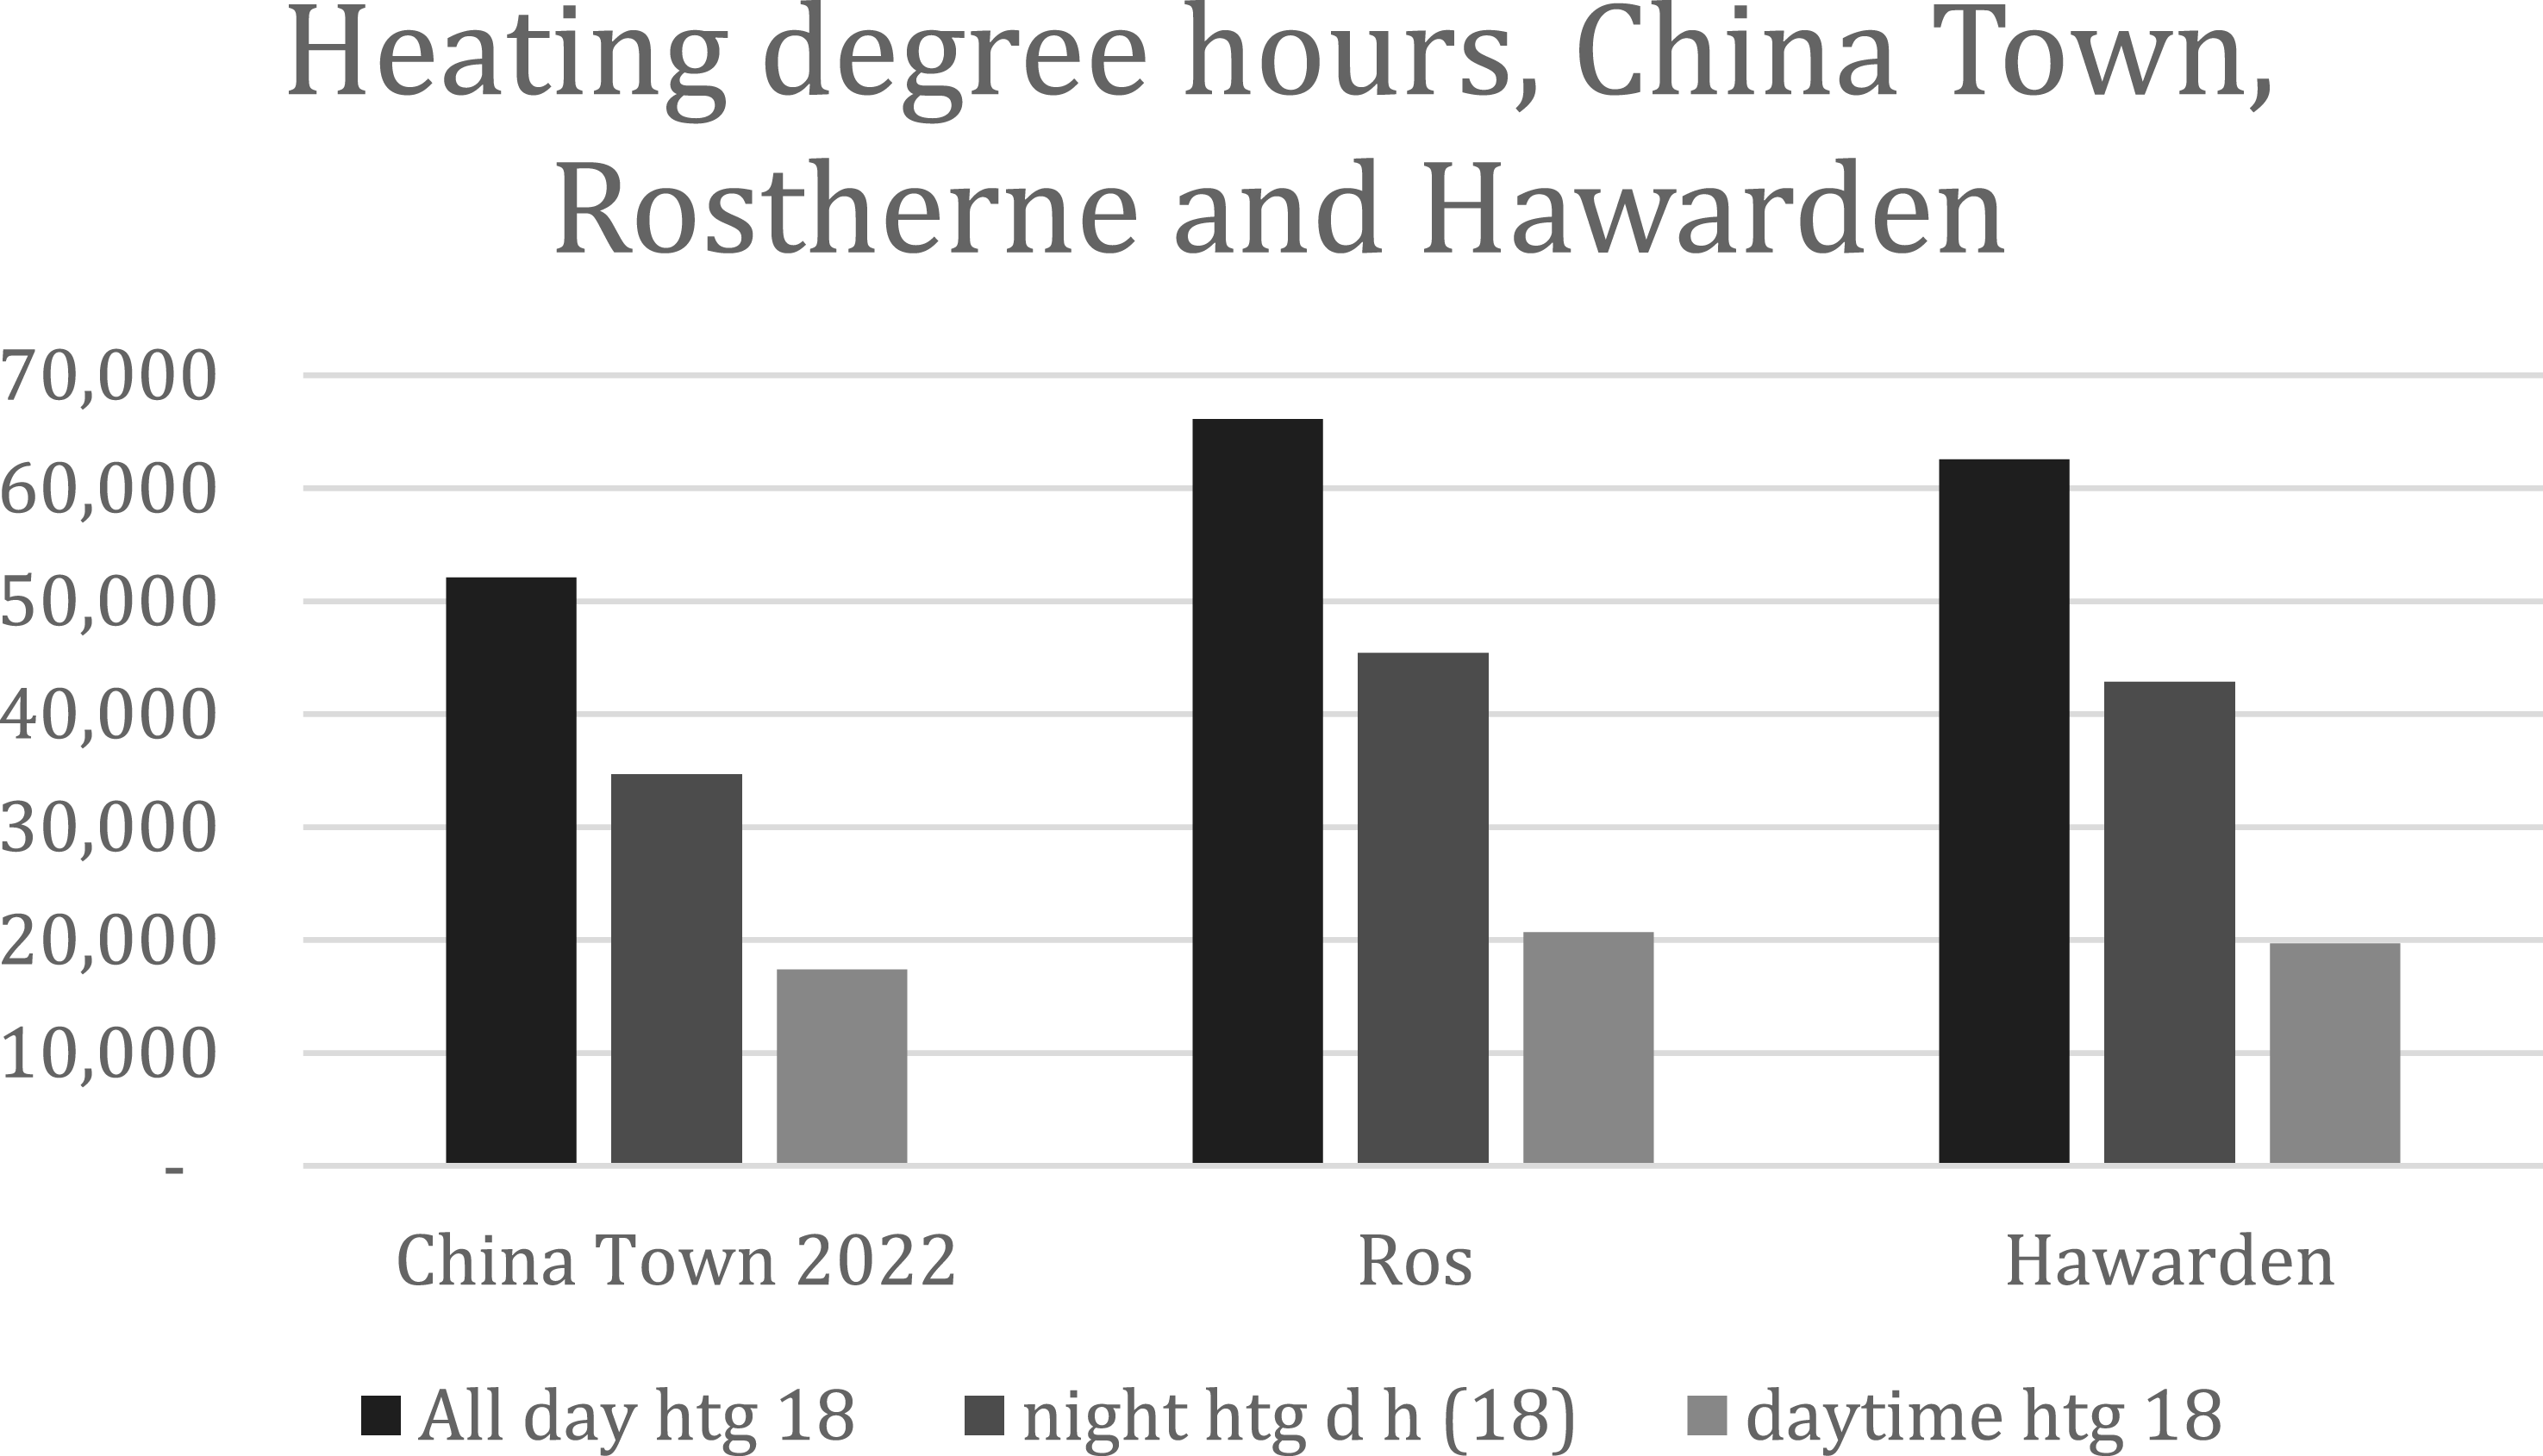
Adding in the approximate urban heat island intensity to the CIBSE DSY – three
Although it has been shown that there is a need for adding in the UHI for most CIBSE UK weather data (London has some UHI in its pDSY) more data can only be found from significant UHI measurements in urban sites. However, as shown in a previous paper 16 there can be differences of up to 0.5 K between Manchester City centre sites. A simple approximate algorithm that works for London and Manchester can be applied 17 to the hourly data.
The model has the simple form:
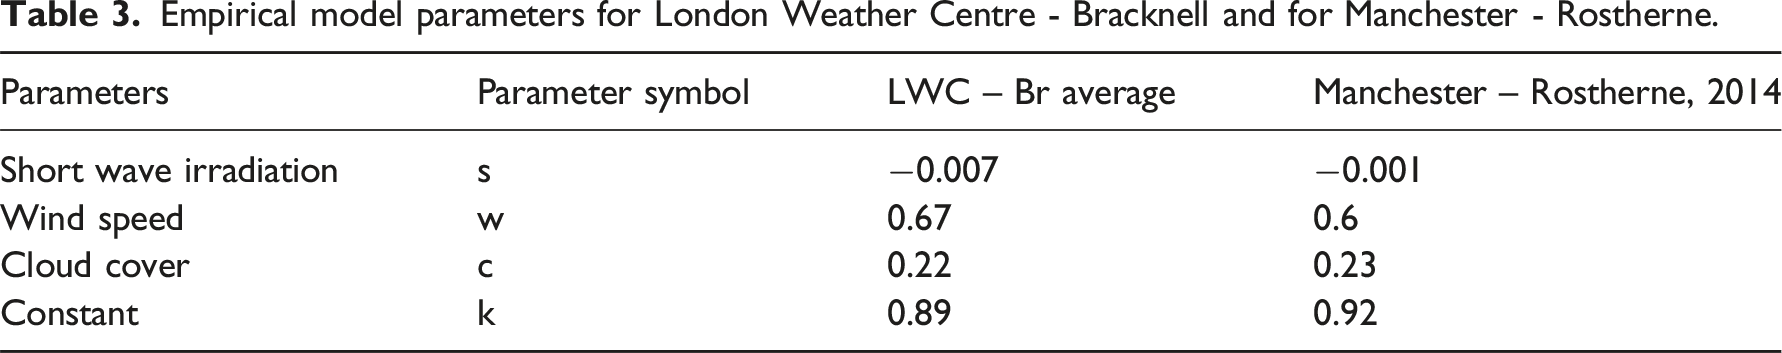
The three coefficients w,c,s and the constant k are now determined by fitting the model to the measured UHII. This was done for Manchester 14 for the year 2014 giving s = 0.001, w = 0.60, c = 0.23 and k = 0.92.
Empirical model parameters for London Weather Centre - Bracknell and for Manchester - Rostherne.
As the cities are quite different (size, population, rivers and green spaces) this bodes well for applying the model to other UK cities. However, as the weather for each year can be quite different (heat waves, rain, storms etc) the model for each year may vary a little. The data for London is rather dated as the London Weather Centre closed
Using the Manchester-Rostherne parameters in Table 3 for the UHII model and applying it to the Rostherne data (wind speed, cloud cover etc), Figure 10 shows the excellent overall correlation (r2 = 0.55, t = 104, 0.1% level of significance) between the 2022 Rostherne year modelled UHII and the actual UHII in Manchester City centre. The measured Manchester City UHII and the UHII modelled from the Rostherne data, all for 2022.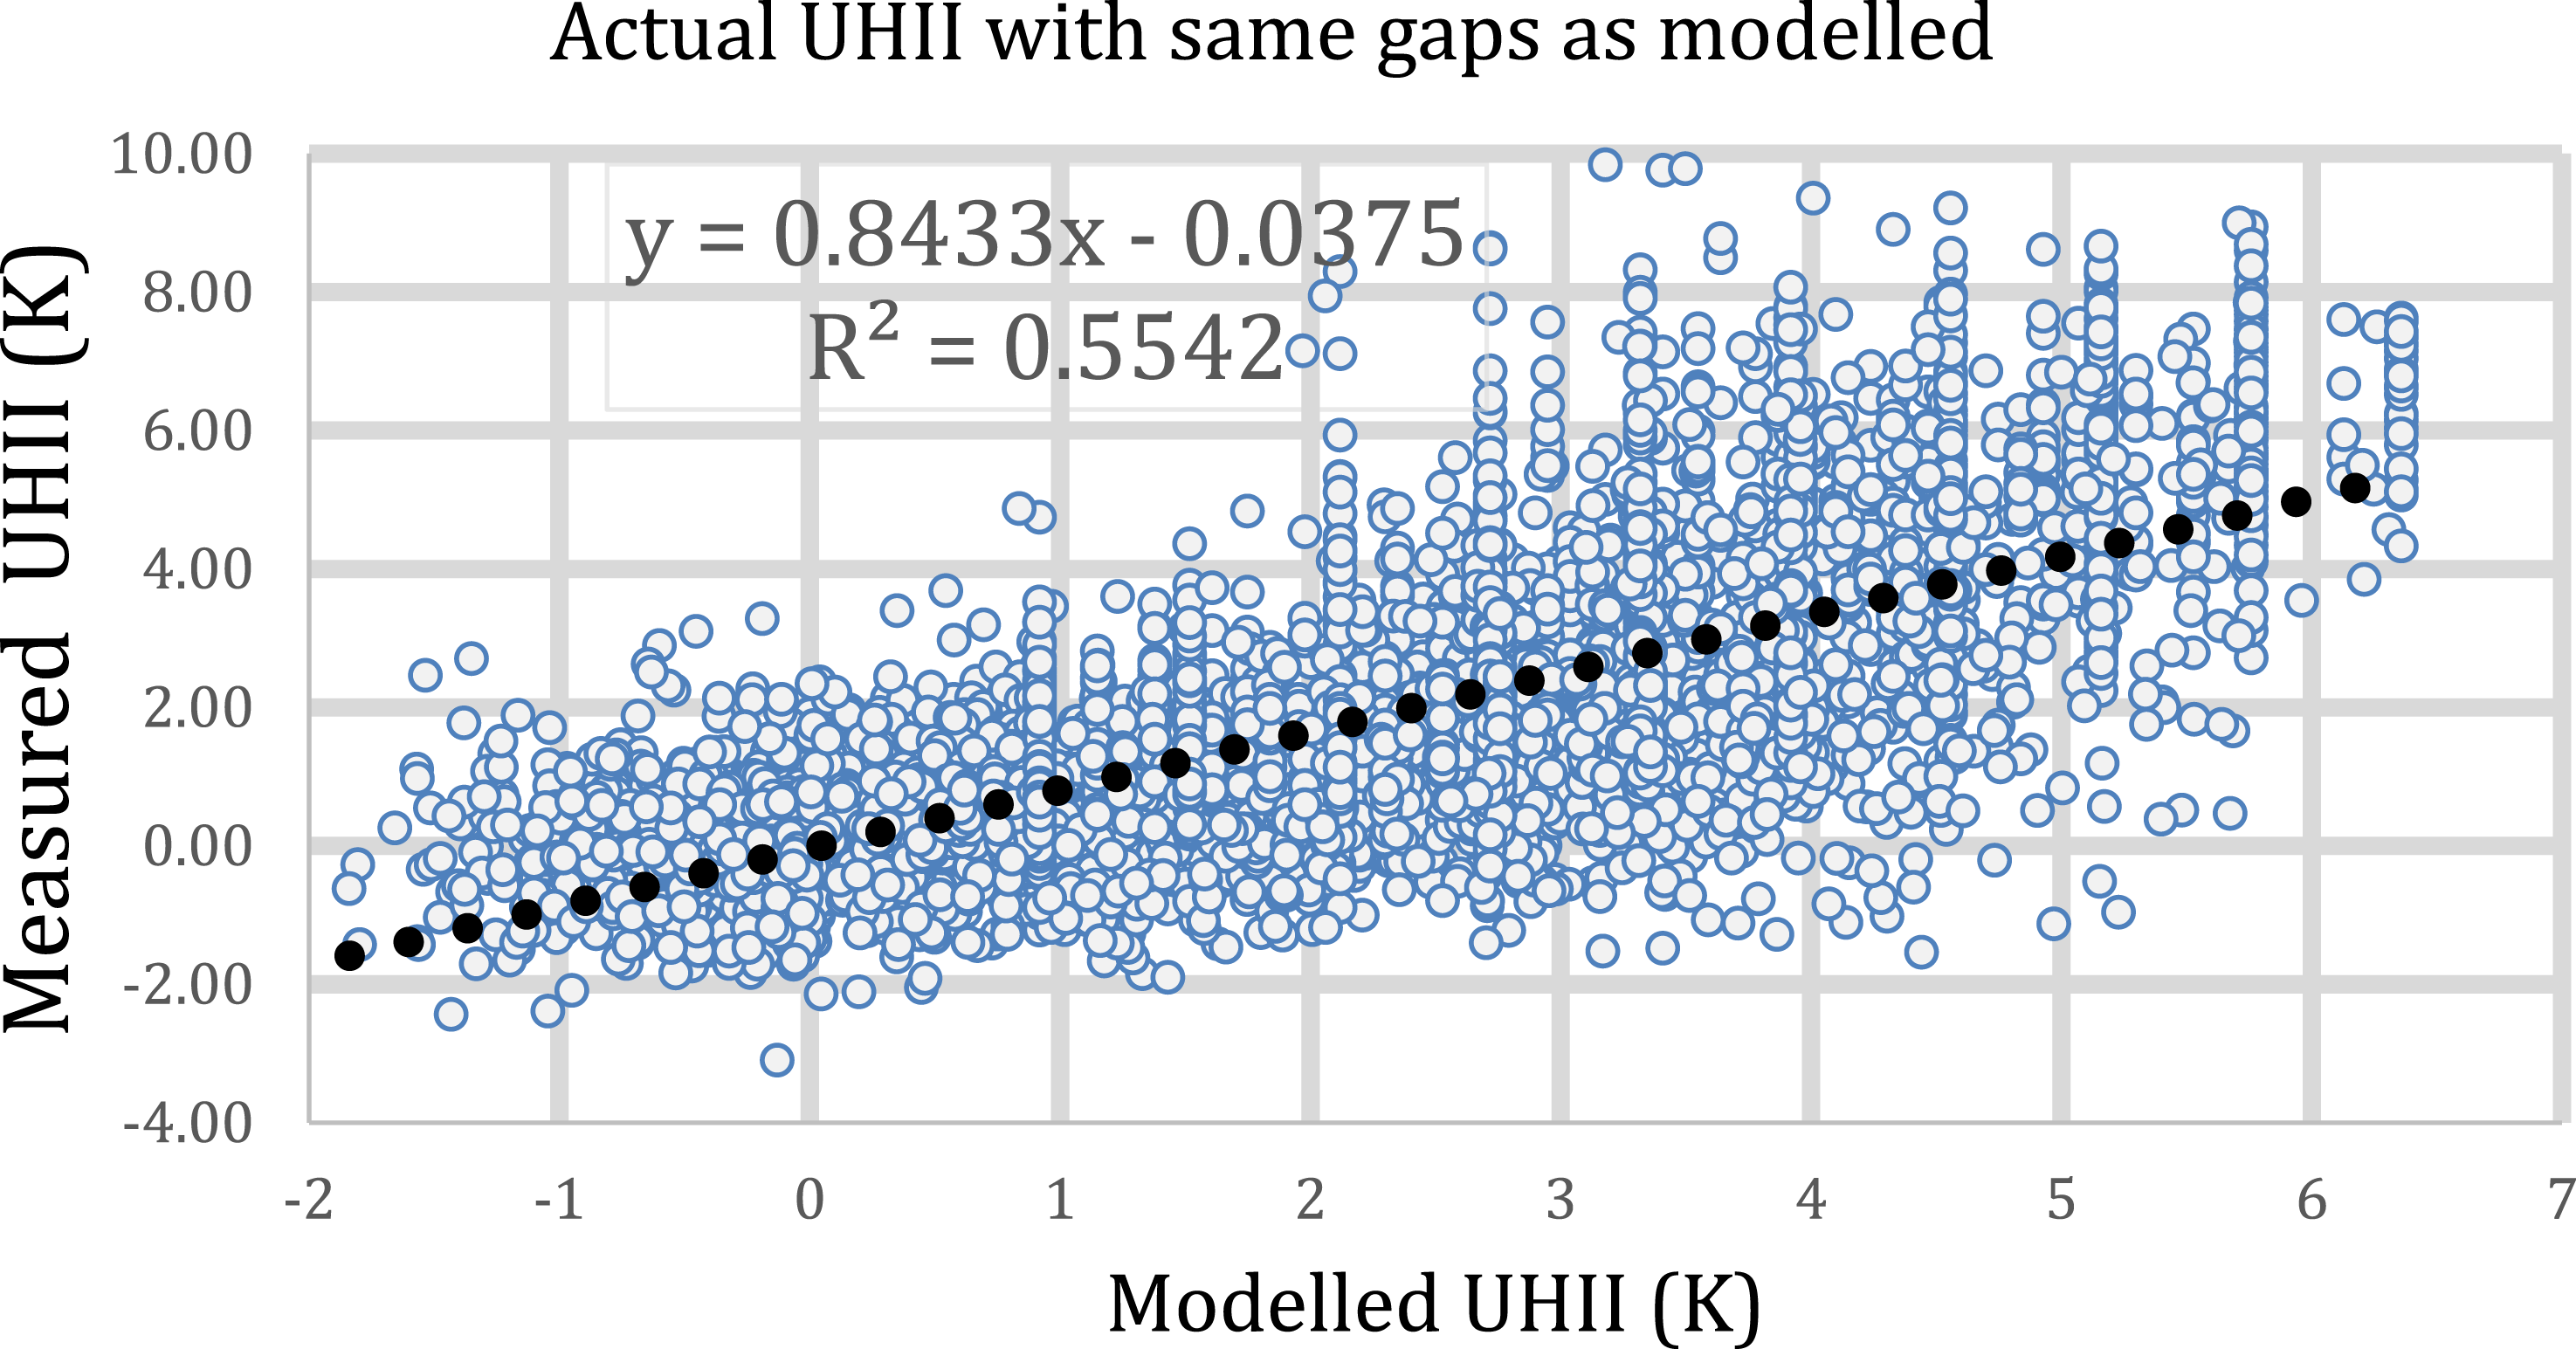
Design implications
The heating degree hours are lower in the city centre (China Town, Figure 8) indicating a lower heating consumption for the city centre. However, the cooling degree hours are higher indicating a higher cooling consumption.
Design percentiles for 2022 for rural Rostherne and City Centre, China Town.
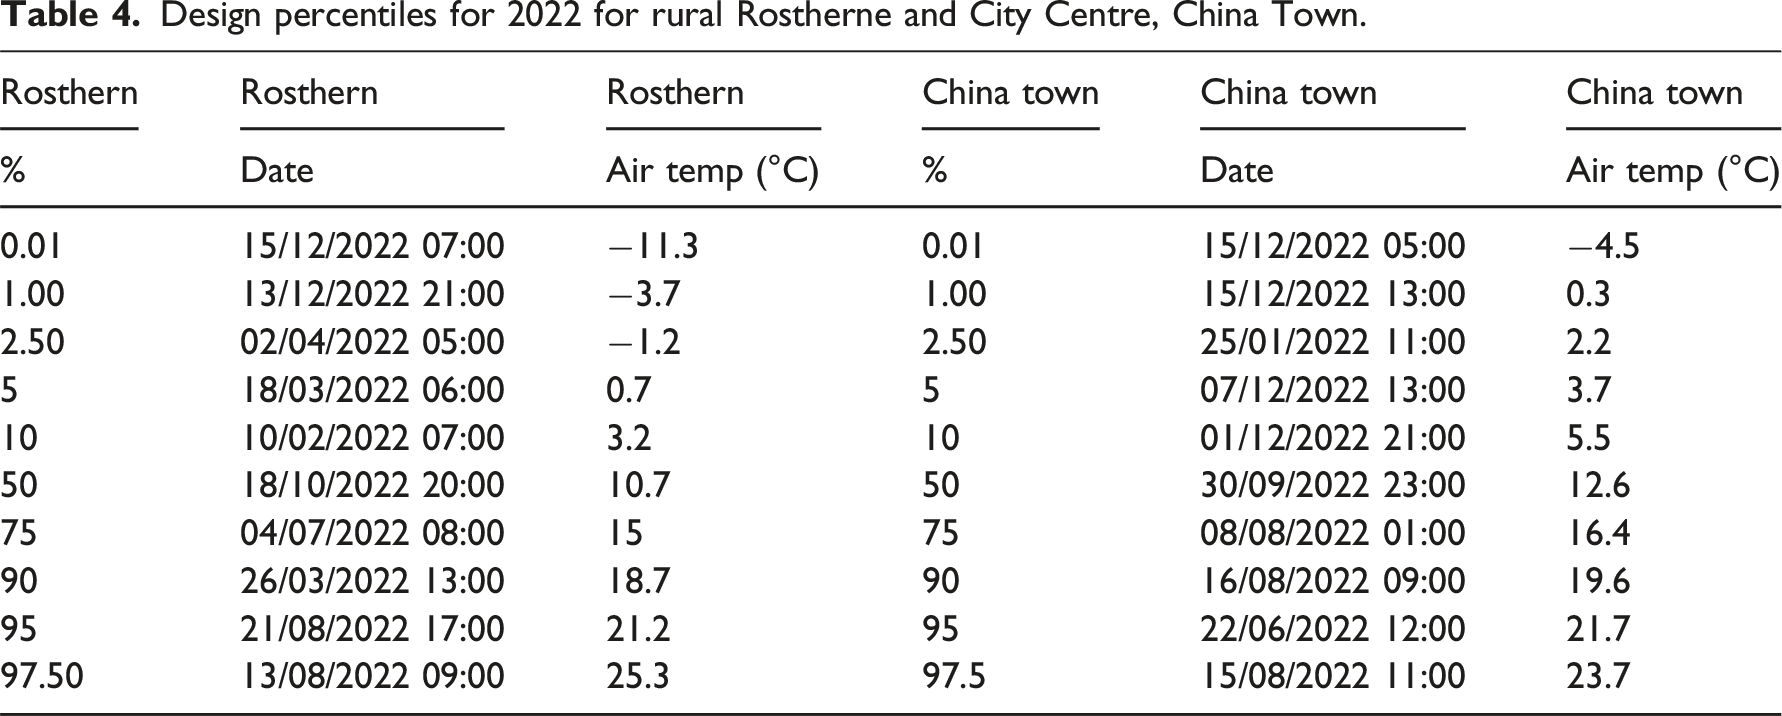
The lower percentiles show that the city centre is indeed warmer than the rural area. At the 5th percentile and 10th percentile the city centre heating system are 15% and 10% respectively oversized based on the rural data. For the cooling the 90th percentile and the 95th percentile the city centre cooling system are 16% and 6% undersized. It is interesting that the rural and city centre percentiles are often on different days and different times. This is because maximum urban heat island intensity (UHII) is often just before sunrise. It should also be noted that high UHII values often occur on cloud free days producing sunny days. The solar gain to some buildings is considerable.
Conclusion
Comparing the DSY – three for Manchester, which is the year 2022, using the Met Office Hawarden site data, to the data measured in the City Centre by the authors, shows that the urban heat island effect in Manchester makes the city significantly warmer in both the summer and winter. Not taking the UHII into account will produce poor designs for buildings and plant in the city centre. As all the other UK city DSYs do not include data for the UHII, apart from London, similar design errors will occur. There is therefore a need to provide this data either by measurement of by modelling. However, in the meantime the use of the empirical UHII model, as shown in this paper, is a very good approximate solution.
Footnotes
Acknowledgments
There was no external funding for the work outlined in this paper. Thanks are due to the Centre for Environmental Data Analysis (CEDA) with the Met Office MIDAS Open: UK Land Surface Station Data for dry bulb temperatures and solar irradiance data.
Declaration of conflicting interests
The authors declared no potential conflicts of interest with respect to the research, authorship, and/or publication of this article.
Funding
The authors received no financial support for the research, authorship, and/or publication of this article.