
Abstract
Classical pressure profile data for building drainage systems (BDS) represent a temporal snapshot of the pressure regime within the system following an event such as a water discharge from an appliance, and therefore can be an indicator of system performance. This research describes, for the first time, a method of predicting the pressure profile using FF(Feed Forward -PSO(Particle Swarm Optimization) artificial neural network (ANN) algorithm. The ANN model was validated against two sets of data: the first from a dedicated 32-storey building drainage experimental test rig at the National Lift Tower (NLT) test facility in Northampton, UK, and the second set of data from a validated numerical model, AIRNET. Both data sets were used to assess the FF- PSO-ANN Model. Calculation errors were minimized by refining weight vectors with a PSO scheme. The convergence of the PSO algorithm was managed through adjusted inertia weights, population size, damping factor, and acceleration coefficients. A generic prediction model was developed using a database of similar building drainage types and configurations. This algorithm refines and trains the ANN model, enhancing its applicability across various applications. The study confirms that the FF-PSO ANN model effectively predicts BDS pressure profile data and system performance.
Practical application
The ANN model presented develops a new approach with which to assess performance of a BDS at design stage. The model is based on the philosophy of a natural search algorithm which helps to attain global optimisation by refining the weight vectors. It is envisaged that this model can form a part of the assessment of designs at an early stage and provide useful information on the performance of the system. The in-built learning of the model allows accuracy to be improved as the database of existing pressure profiles increases, thus making the tool more relevant with time.
Introduction
The analysis of fluid flow found in Building Drainage Systems (BDS) are describable using of unsteady transient multiphase flow ( air and water) techniques. These transient conditions are created by the random discharges which occur throughout the building as people use sanitary appliances. The net effect of these random discharges is to produce a varying and unsteady air pressure regime within the system to balance the need for air and to facilitate the safe removal of the waste from the building.
1
Understanding that this pressure regime is both dynamic and unstable is crucial. However, it is challenging to accurately represent the system’s performance under such variability. The classical pressure profile, where the air pressure response at a specific moment following a surge flow event (such as a toilet flush) provides insight into the system’s air and water management and proves to be an effective way to assess performance, as illustrated in Figure 1. Additionally, improper system design can lead to cross-contamination and airborne diseases Therefore, the pressure profile needs to be investigated to ensure optimal system performance and safety.
2
Air pressure distribution profile in building drainage system following an event. Note: this accepted form of pressure profile is a snapshot in time.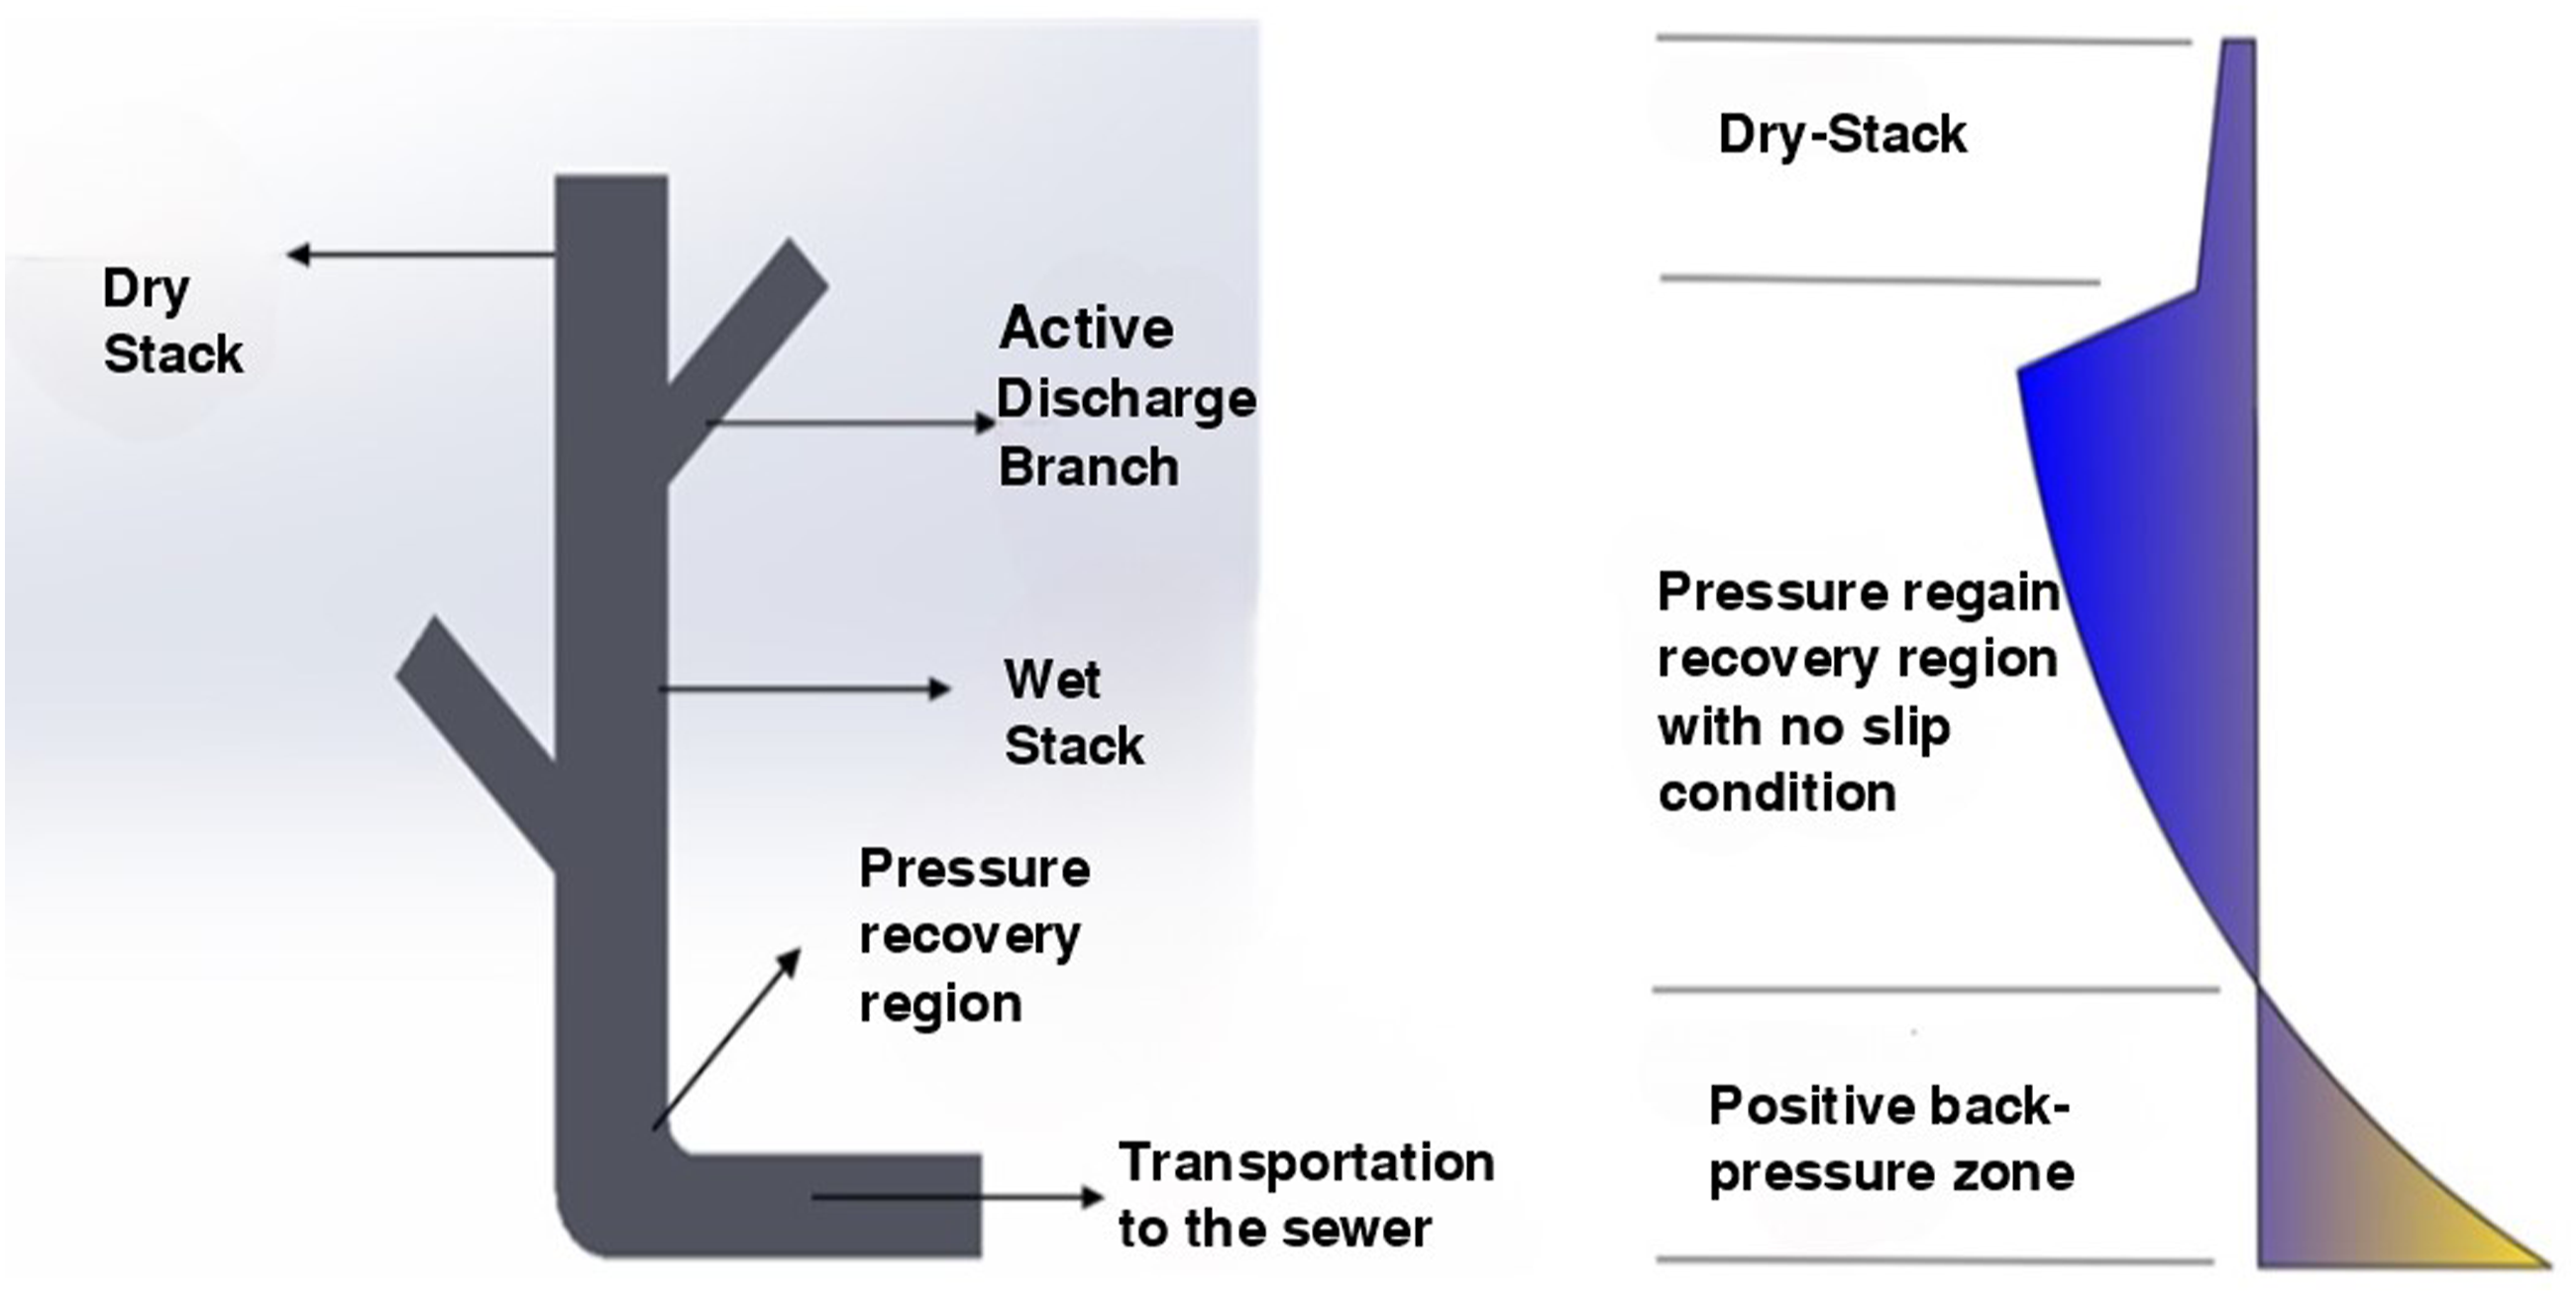
The improper design of drainage systems and the depletion of trap seals contributed to the outbreak of Severe Acute Respiratory Syndrome (SARS) in early 2003 at Amoy Gardens in Hong Kong, where 342 cases were confirmed, resulting in 42 deaths in a 50-storey building. 3 This crisis highlighted significant flaws in building service installations and prompted a re-evaluation of drainage system design and operation. Investigations into the site revealed issues with backflow and foul gas emissions, 4 and tracer gas measurements were used to assess upward air movement. Additionally, a field study was conducted to trace gas flow from the drainage system into living spaces. While this outbreak did not escalate into an epidemic, it underscored the critical role of drainage systems in safeguarding public health. The COVID-19 pandemic, caused by the SARS-CoV-2 virus, further emphasized the importance of these systems.5,6 Although it is now understood that drainage systems do not significantly contribute to respiratory virus transmission, concerns remain about bacteria residing in water trap seals, which can pose risks to occupants5. The mismanagement of the drainage and ventilation systems in Amoy Gardens also led to the development of numerical models to simulate unsteady flow conditions. 3 Given the hazardous effects of such mismanagement, a model was proposed to predict pressure regimes under various operating conditions for a 16-storey building. 7 This numerical modelling, utilizing the method of characteristics, effectively addresses unsteady airflow conditions caused by pressure fluctuations within drainage system.8,9 The understanding of the pressure fluctuations leads to avoid the trap seal failure which consequently help to mitigate the spread of sewage-related diseases in a BDS. This motivates the researchers to find out appropriate methods that is experimental, numerical and ANN models to predict the pressure profiles in a BDS. The following sections addresses different investigations schemes in the field of BDS.
ANN model
The artificial neural network (ANN) is a powerful machine learning tool that can model and solve complex physical problems not easily described by simple mathematical models. The ANN model, as noted by Bar et al., 10 excels at simulating both linear and nonlinear relationships by learning from data. This allows for accurate input-output mapping, saving time compared to traditional methods and enabling hypothetical scenario results. ANNs are parallel computational frameworks for complex problems but can overfit data and lack transparency in input-output relationships. Additionally, they lack engineering judgment and do not explain the underlying physics, making them black-box models. It effectively handles indeterminate factors and can replace traditional analytical methods. 11 An ANN model to study the frictional pressure drop across a U-bend for two-phase flow. 12 Various ANNs have been applied in this area, with the PSO-ANN technique proving to be particularly efficient. 13 This technique, derived from the flocking behaviour of birds, is used to determine the volume percentage of two-phase flow. Kennedy and Eberhart 14 introduced Particle Swarm Optimization (PSO) for predicting non-linear functions and highlighted its computational efficiency in terms of speed and memory. Kennedy 15 further described PSO as a technique that simulates human brain-like knowledge, optimizing the weights of neural networks.
Clerc and Kennedy 16 discussed finding optimal space through interactions with individual particles and controlling model convergence with specific coefficients. Karaboga 17 noted that the PSO-ANN model is highly organized and adaptable, offering optimal solutions to various problems. Gordan et al. 18 demonstrated that the PSO model is highly effective in optimizing ANN weights and biases, exhibiting superior performance compared to standalone ANN models. Keykhah et al. 19 applied the PSO model to improve heat transfer efficiency in nano-fluids across porous mediums inside tubes, using porosity, internal radius, external radius, and frictional coefficient as inputs, while Nusselt number and frictional factor were outputs. Similarly, PSO-ANN to predict thermophysical properties with acceptable accuracy. 20 As per Valinataj-Bahnemiri et al. 21 focuses on optimizing heat transfer in a two-dimensional, incompressible laminar flow of nanofluids within a duct. A two-phase model is used to examine various governing parameters. For the optimization process, the study employs the recently colonial algorithm. The results demonstrate high accuracy when compared to another well-known heuristic method, particle swarm optimization (PSO). The position vector that plays a vital role in improving the performance of the PSO Model. 22 The position vectors are updated based on the second personal best and global best, which improves the PSO Model. Not only Shin and Kita 22 explained improving the PSO model but also Liang et al. 23 employed comprehensive learning particle swarm optimization for updating velocity position. The results obtained from CLPSO generates better quality solution in comparison with the PSO model. The PSO-ANN model is opted for the optimisation process and can organise itself and can adapt to any kind of situation. Also, that the PSO-ANN model gives the best optimal solution to the problems undertaken. 17 The PSO model to be a robust form of optimisation technique used to improvise the weights and bias of the ANN model. 24 The PSO-ANN model has higher performance capability than the ANN model. 18 The evolutionary algorithm model was applied to the hydrocracking fractionator unit in an oil refinery. This unit is essential for maintaining product quality and needs optimization. However, optimizing it is difficult because measuring the naphtha product quality with online sensors is challenging. To overcome this, a naphtha dry point model was introduced as a soft sensor for the control strategy. 25 Carvalho and Ludermir 26 drew inspiration from Zhang and Shao 25 and introduced an alternative methodology that enhances control through the adaptive refinement of weights. Aiming with low architectural complexity and training error, the model has evolved and been applied for specific issues in the medical science. According to their findings, they concluded that employing a PSO-based method is a viable approach for optimizing architectures. Similar to the approach have been endeavored to optimize both the weights and architecture simultaneously.26,27 During their investigation, they developed a variable-length PSO with an optimized architecture and a dynamic strategy.
However, some researchers highlight the limitations of swarm optimization techniques, such as computational complexity and sensitivity to parameters. Optimization techniques combining GA and PSO have been used to detect fluid flow across heat exchangers with fins, aiming to minimize heat flow effectiveness by maximizing entropy generation. Due to its simplicity, the PSO technique has been applied to fluid flow across heat exchangers. 28 The PSO technique effectively handles real number randomness and global particle communication, making encoding and decoding straightforward. The PSO being an natural algorithm used for minimizing the error because of the guessed weight vector in the back propagation. This prompts the author to develop a hybrid model of Feed Forward (FF)-Particle Swarm Optimisation (PSO) ANN.
AIRNET
A computer-based simulation package, AIRNET, is a mathematical model that uses the Method of Characteristics to solve the continuity and momentum equations in a finite difference scheme. It is capable of simulating waste, vent, and drainage conditions in buildings. As described above, some research added the impacts of temperature and detergents to AIRNET. Quasilinear hyperbolic partial differential equations of continuity and momentum, which can be solved numerically using the method of characteristics, was used for representation of the propagation of air pressure transients. 8 In order to further simplify the system, it must be understood that air pressure transients propagate as a result of changes in water flow conditions. It is well known that negative pressure constituents can produce siphonage, which lowers trap seal levels. The spread of positive air pressure transients caused by branch or stack surcharge is more problematic. Some research has already been modelled by the origins of positive air pressure transient propagation and shows how these transients can be modelled by the unsteady flow St Venant equations. The method of characteristics and boundary conditions, which reflect the individual parts of a building’s drainage and vent system, are used to provide solutions. These methods of characteristics and boundary conditions have been proven effective. 29
Other research looked at the water’s driving force, extending it to include that not all of the discharge was due to an annular film but rather that some of it appeared as droplets dropping in the centre of the air core. In order to produce a more accurate AIRNET model that takes the effects of detergents, temperature, and droplet fraction into account, this article includes these changes and links to earlier work on non-dimensional analysis. 30 Rapid entire system testing is made possible using AIRNET, a 1D Method of Characteristics based model; nevertheless, the boundary condition for the water trap seal within the model is currently based purely on steady state circumstances, neglecting system dynamics. 31
The AIRNET is used for studying airflow and accompanying air pressure regime in BDS. The building drainage system’s unstable pressure regime is not replicated by the present water trap boundary condition in the AIRNET model, which has a steady laminar frictional flow relationship. In order to create a reliable, dynamic prediction approach for the response of the water trap seal to applied air pressure waves, Gormley and Beattie 32 an alternative, empirically derived friction factor and significantly simplifies the calculation process. It will be understood that based on the building size, kind, and configuration, this can further cause the system to respond in an uneven manner based on design and functionality, it is obvious that one or more appliances could discharge at the same time. Overall, branch connections, offsets, and the stack base all contribute to the formation of both positive and negative air pressure transients through their effects on individual and combined variable discharge flows as well as any blockage or hindrance to airflow. 8 Even Swaffield and Campbell 7 developed a model to include the air entrainment and stack base pressurisation effects of an unsteady descending water film, including the consequences of sudden intermittent stoppage of the induced air flow, resulting in air pressure transients whose actual magnitudes are dependent on the configuration of the system. The previous research work mentioned above identifies about the AIRNET model which simulates for different kind of configuration with various boundaries condition. Due to the need to prevent smell penetration, the supply of outwardly relief valves to manage positive pressure propagation is not an option, hence exterior open vents are the preferable solution. 29 Positive or negative pressure variations must not be produced by the vertical movement of water and waste or by the connection to a horizontal collecting drain in order to prevent the trap seals from being destroyed or contaminated air from being forced through them. Similar to this, the stack’s design must be able to accept the entire building’s downflow with little chance of a backup in the lower floors. Building drainage and vent systems may experience either, or both, positive and negative pressure changes in response to flow conditions that are accelerating or decelerating. Therefore, it needs a simulation of the device using the method of characteristics solution of the St Venant equations and an experimental program to demonstrate proof of concept. 33 As the experimental investigations are cost prohibitive, few simulations using AIRNET software are employed to establish appropriateness of ANN models.
As experimental investigations are cost prohibitive, the investigations are limited for different flow conditions and different building heights. In absence of experimental data, the published pressure profile data using AIRNET simulation software has been employed as the target data for the ANN model. As per the above the literature review, there is a need of suitable ANN model to predict the pressure profile in a BDS. The literature indicates the satisfactory performance of PSO-ANN model in various real field problems. In order to overcome the possibility of the local optimization using the steepest descent method (for backpropagation in FFBP-ANN) was replaced by a global optimization (PSO)-ANN scheme. The PSO being an natural algorithm and it is used for minimizing the error. This prompts the author to develop a hybrid model of Feed Forward (FF)-Particle Swarm Optimisation (PSO) ANN and examines its suitability under different flow conditions.
Methodology
Governing equation of two-phase in BDS
As illustrated in Figure 1, the wet discharge from the active branch entrains air, resulting in a two-phase flow. This two-phase flow phenomenon in the vertical stack of a BDS is described by the continuity and momentum equations as follows.
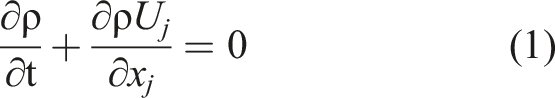
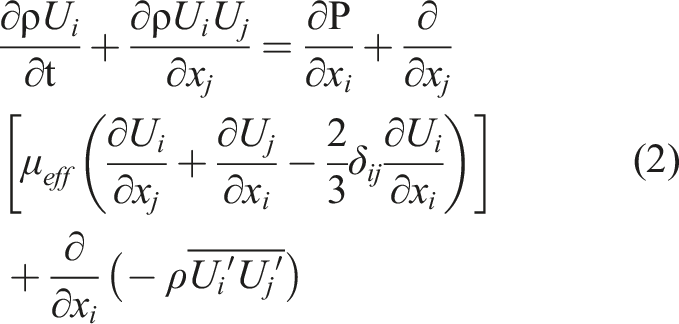
Upon application applying the Volume of Fluid (VOF) method to a two-phase fluid domain, a set of equations dependent on the volume fractions of air and water is solved. These volume fractions are related to the fluid properties such as density (ρ) and dynamic viscosity (μ). The density (ρ) and dynamic viscosity (μ) of the two-phase fluid in relation to the volume fraction can be expressed as:


Method of characteristics
Simpson
34
indicated about the methods of Characteristics using partial differential equation which are limited two independent variables. Swaffield and Galowin
35
suggested about the flow across the pipe which is partially filled and unsteady in nature are solved using methods of characteristics applying finite difference scheme. They also explained about the numerical model which is based on the flow depth, velocity and wave speed which demonstrates the unsteady flow in the partially filled pipe. The Figure 2 below explains about the method of characteristics. Method of characteristics.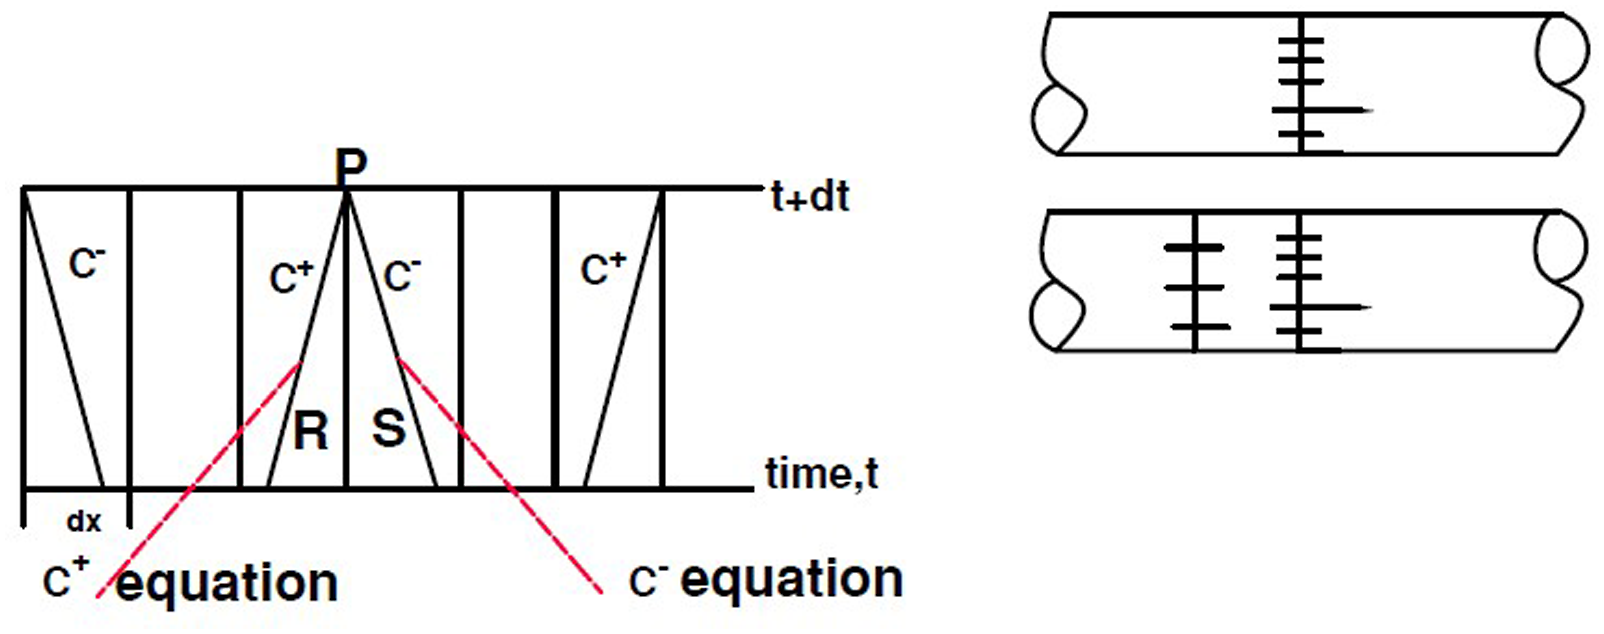
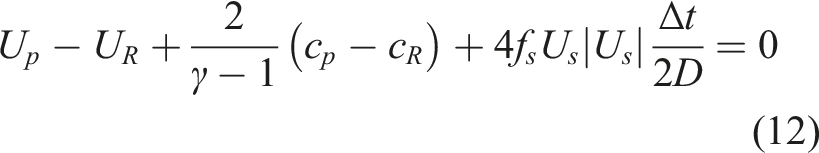
The equations of continuity and momentum for unsteady flow within a building drainage system expressed in c and u, which can be described as:

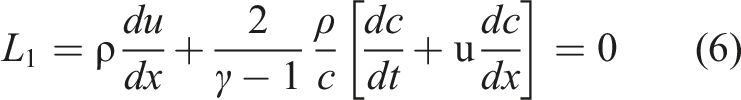
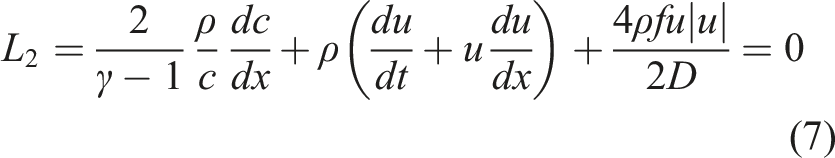
Further, this reduces to the following differential equations as
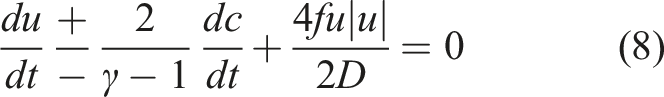
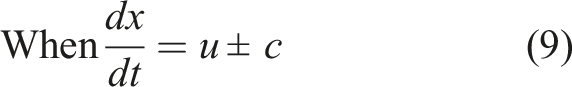
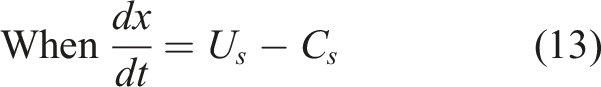
The grid formed in the two-dimension depends upon x and t. The conditions can be downstream and upstream nodes which explain the characteristics equation. The time step depends upon the combination of the wave speed and length of the pipe at the internode distance. The characteristics equations
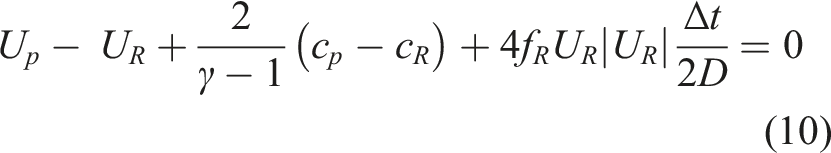
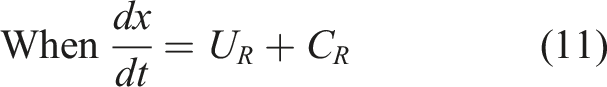
The characteristics equations
ANN algorithm
Artificial Neural Network are analytical tools which behaves in the similar way as human brain. An ANN model is more preferred over other model as the model is adaptive in characteristics and can also determine the complex pattern with limited information available.
36
These models are not only adaptive but also develop some bonding between the object and the data. According to Bar et al
10
An ANN model consists of multi-layered network of neuron and each neuron is connected to the other neurons. Each neuron in the ANN has input layer, one or more hidden layer and output layer. The input is passed among the neurons and each neuron is transferred by adjusting weights. After the weights adjustment they are sent to the hidden layer. The hidden layer consists of an activation function where the activation function uses two sigmoid functions. The tan-sigmoid function is more advantageous than the log-sigmoid function as the tan-sigmoid has the greater slope than the log-sigmoid.
10
Secondly, tan-sigmoid has positive and negative response but log-sigmoid has always positive response only. The learning rate can be adjusted by inter-connected to the neurons. Topology of the model shown in Figure 3, shows the arrangement of neurons in the input layer (I), hidden layer (H), and output layer (O) that are interconnected through weight vectors and transfer functions. Number of neurons in the input layer (I), hidden layer (H), and output layer (O) are M, N and P respectively. The indices i,j,k represent the position of the neuron present in the input layer that is i = 1,2….M), hidden layer (i.e. j = 1,2,….N) and output layer (i.e. k = 1,2…P) respectively. The linear transfer function, tan-Sigmoid transfer function and log-Sigmoid transfer function are considered to be the activation functions at input layer, hidden layer and output layer respectively. In absence of the hidden neurons in the hidden layer, the only choice of a single transfer function between input and output layer will not be adequate to establish the non-linear relationship. Thus, it is essential to analyse the training database samples before designing the neural network to properly estimate the appropriate number of neurons at hidden layers.
37
The provision of a hidden layer in the network facilitates to opt for appropriate mathematical function depending upon the physics of the flow phenomena to transfer the input signals and modulate them to obtain error free output signal. Topology of FF-ANN model.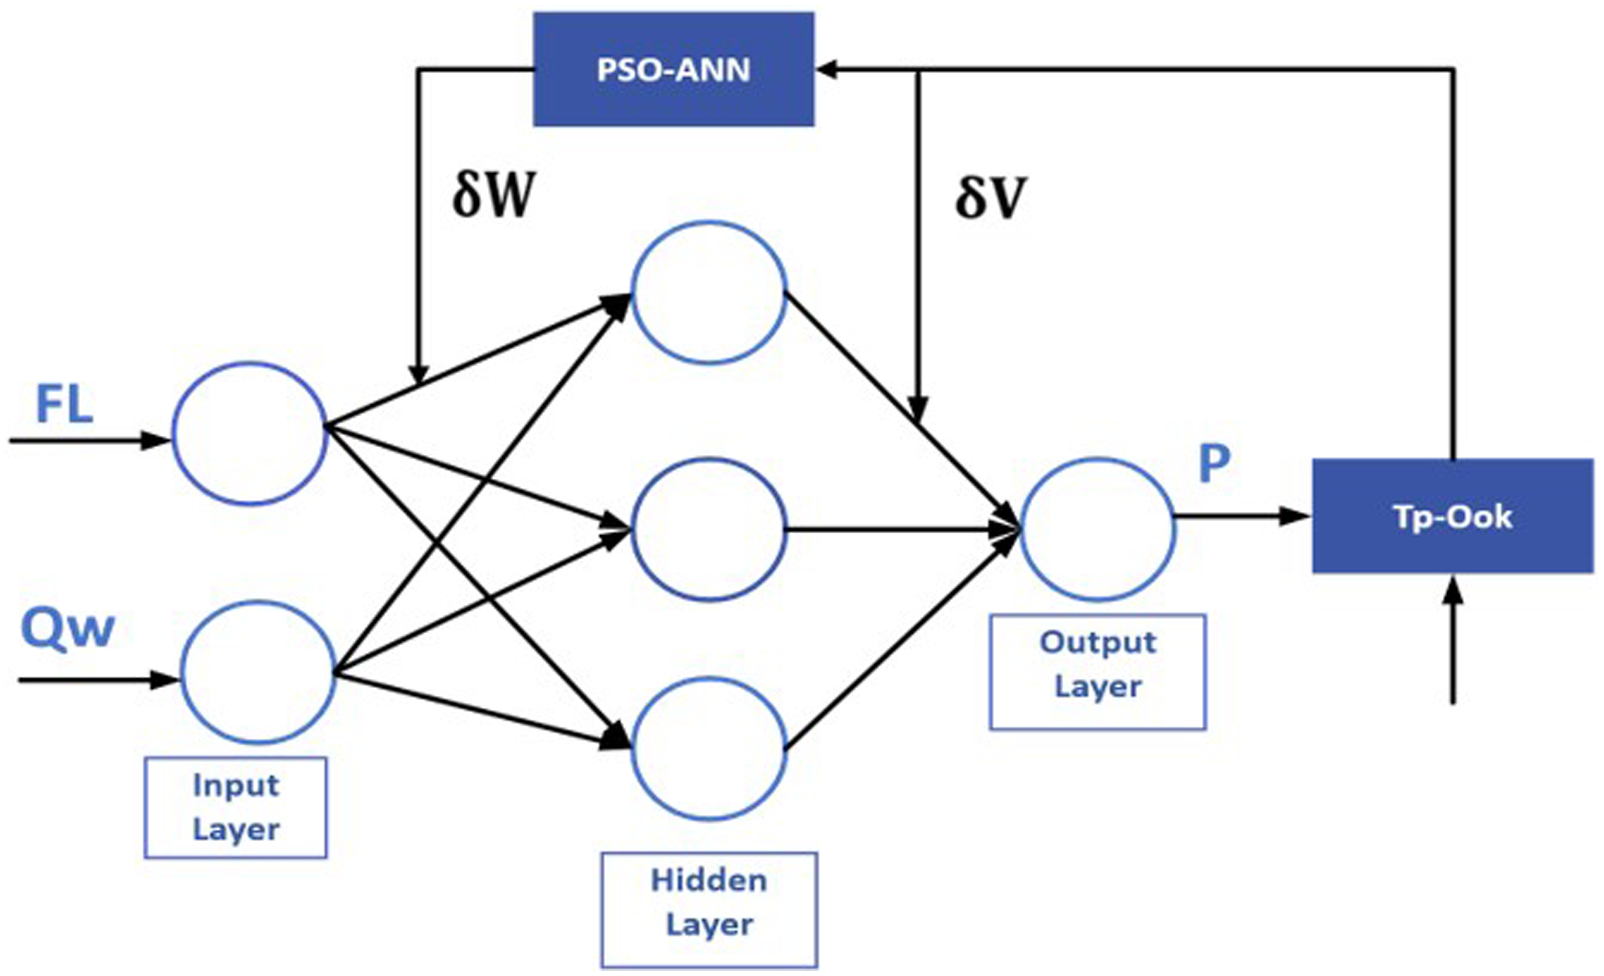
The input and output from a neuron is depicted by ‘I’ and ‘O’ respectively through 1st subscript. The output from ith neuron at the input layer (I) considering linear transfer function is represented as

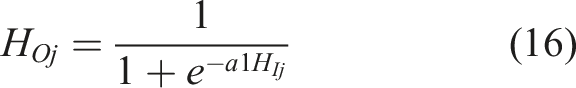
The inputs to the hidden neurons (

The use of the log-sigmoid function with
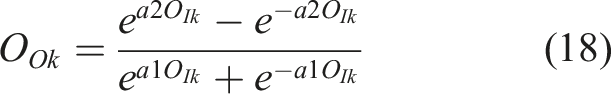
The input to the output neuron (

The output from the output neuron uses the tan-sigmoid function with a2 coefficient and is denoted as
As per Bar et al, 10 use of the tan-sigmoid activation function at the hidden inlayer and the log-sigmoid function at the output layer is preferred.
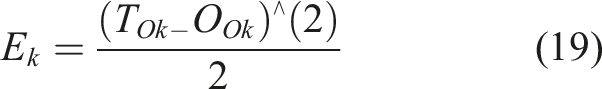
Pratihar
39
mathematically defined error
PSO algorithm
PSO-Algorithm is an incredible approach for optimizing variety of functions. Particle swarm optimization has clear connections with evolutionary computation. It is a population-based approach that imitates the movement patterns of animals like fish and birds that travel in herds. Conceptually, it resembles both evolutionary programming and genetic algorithms. 14 The PSO has several advantages over conventional optimization methods, including faster learning and less memory usage as per Other evolutionary computation models directly manipulate potential solutions that are represented as hyperspace locations. This algorithm’s first stage is to create a “swarm” of the initial population. The population of potential solutions known as “particles” that make up the swarm each assumes a random position is known as a candidate solution. Based on the particles’ objective function, the placements are determined. The movement of the particles is altered by considering both the location of the elite particle and the ideal location for the entire swarm. 41
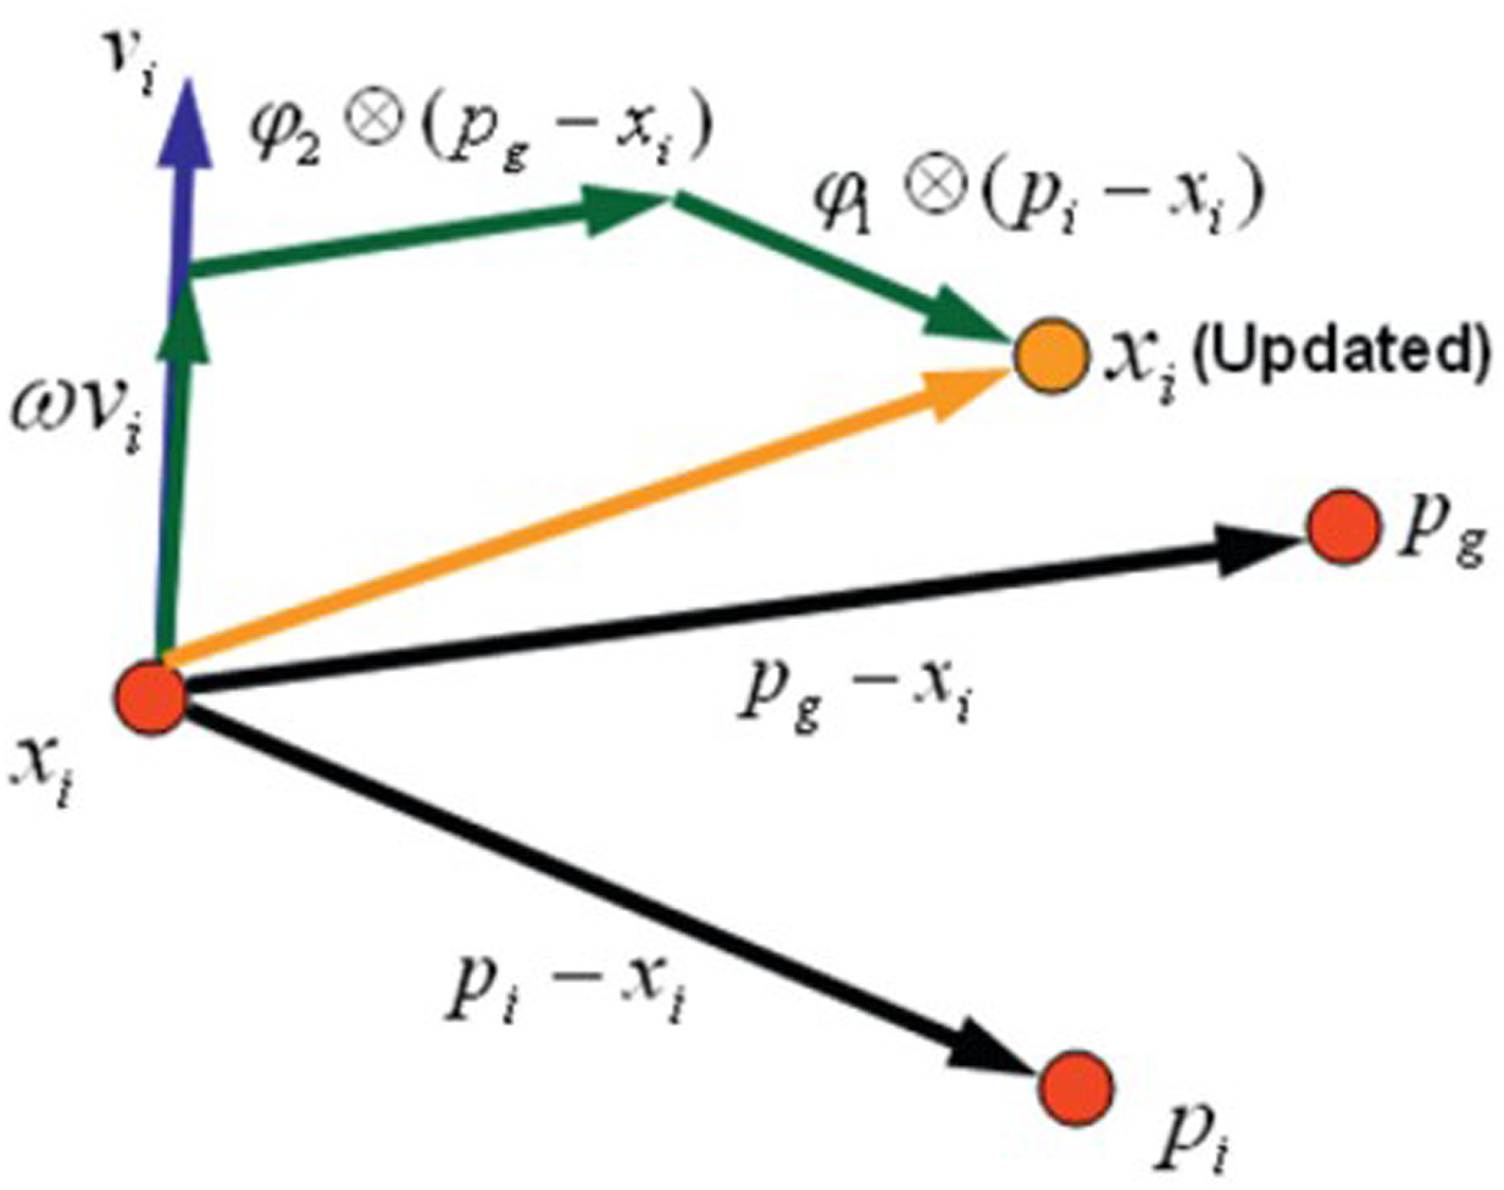
Each particle in the network, while searching in the multi-dimensional space, must modify itself according to the position and position of other particle in the swarm. The population algorithms are assigned with the random velocity and are allowed to move into different problem space. The particle has been assigned with the best position which has greatest fitness which is known as the global best position of the swarm. Each particle is assigned with some random velocity while moving in the problem space. The particle of the i-th position in the problem space is represented as:


The best position of the i-th particle can be denoted as


The velocity and position of the particle are updated and represented as
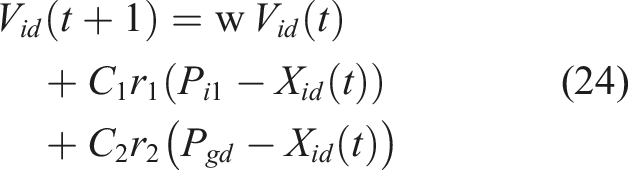

Equations (24) and (25) represent both velocity and position of the particle (t + 1)th iteration as
Here, w Component vectors in the PSO problem space.
38
The momentum part which consists of inertia weight (w) plays a very important role in the problem space as shown through equation (24). The movement of the particle in the space is influenced through inertia weight (w) to consider the effect of the previous velocity. The higher inertia weight w speaks about the exploration term and smaller inertia weight w helps in controlling the exploitation in the search space indicating about tuning the current search space. The algorithm has been represented in the Figure 5. The flow chart describing the FF-PSO-ANN model.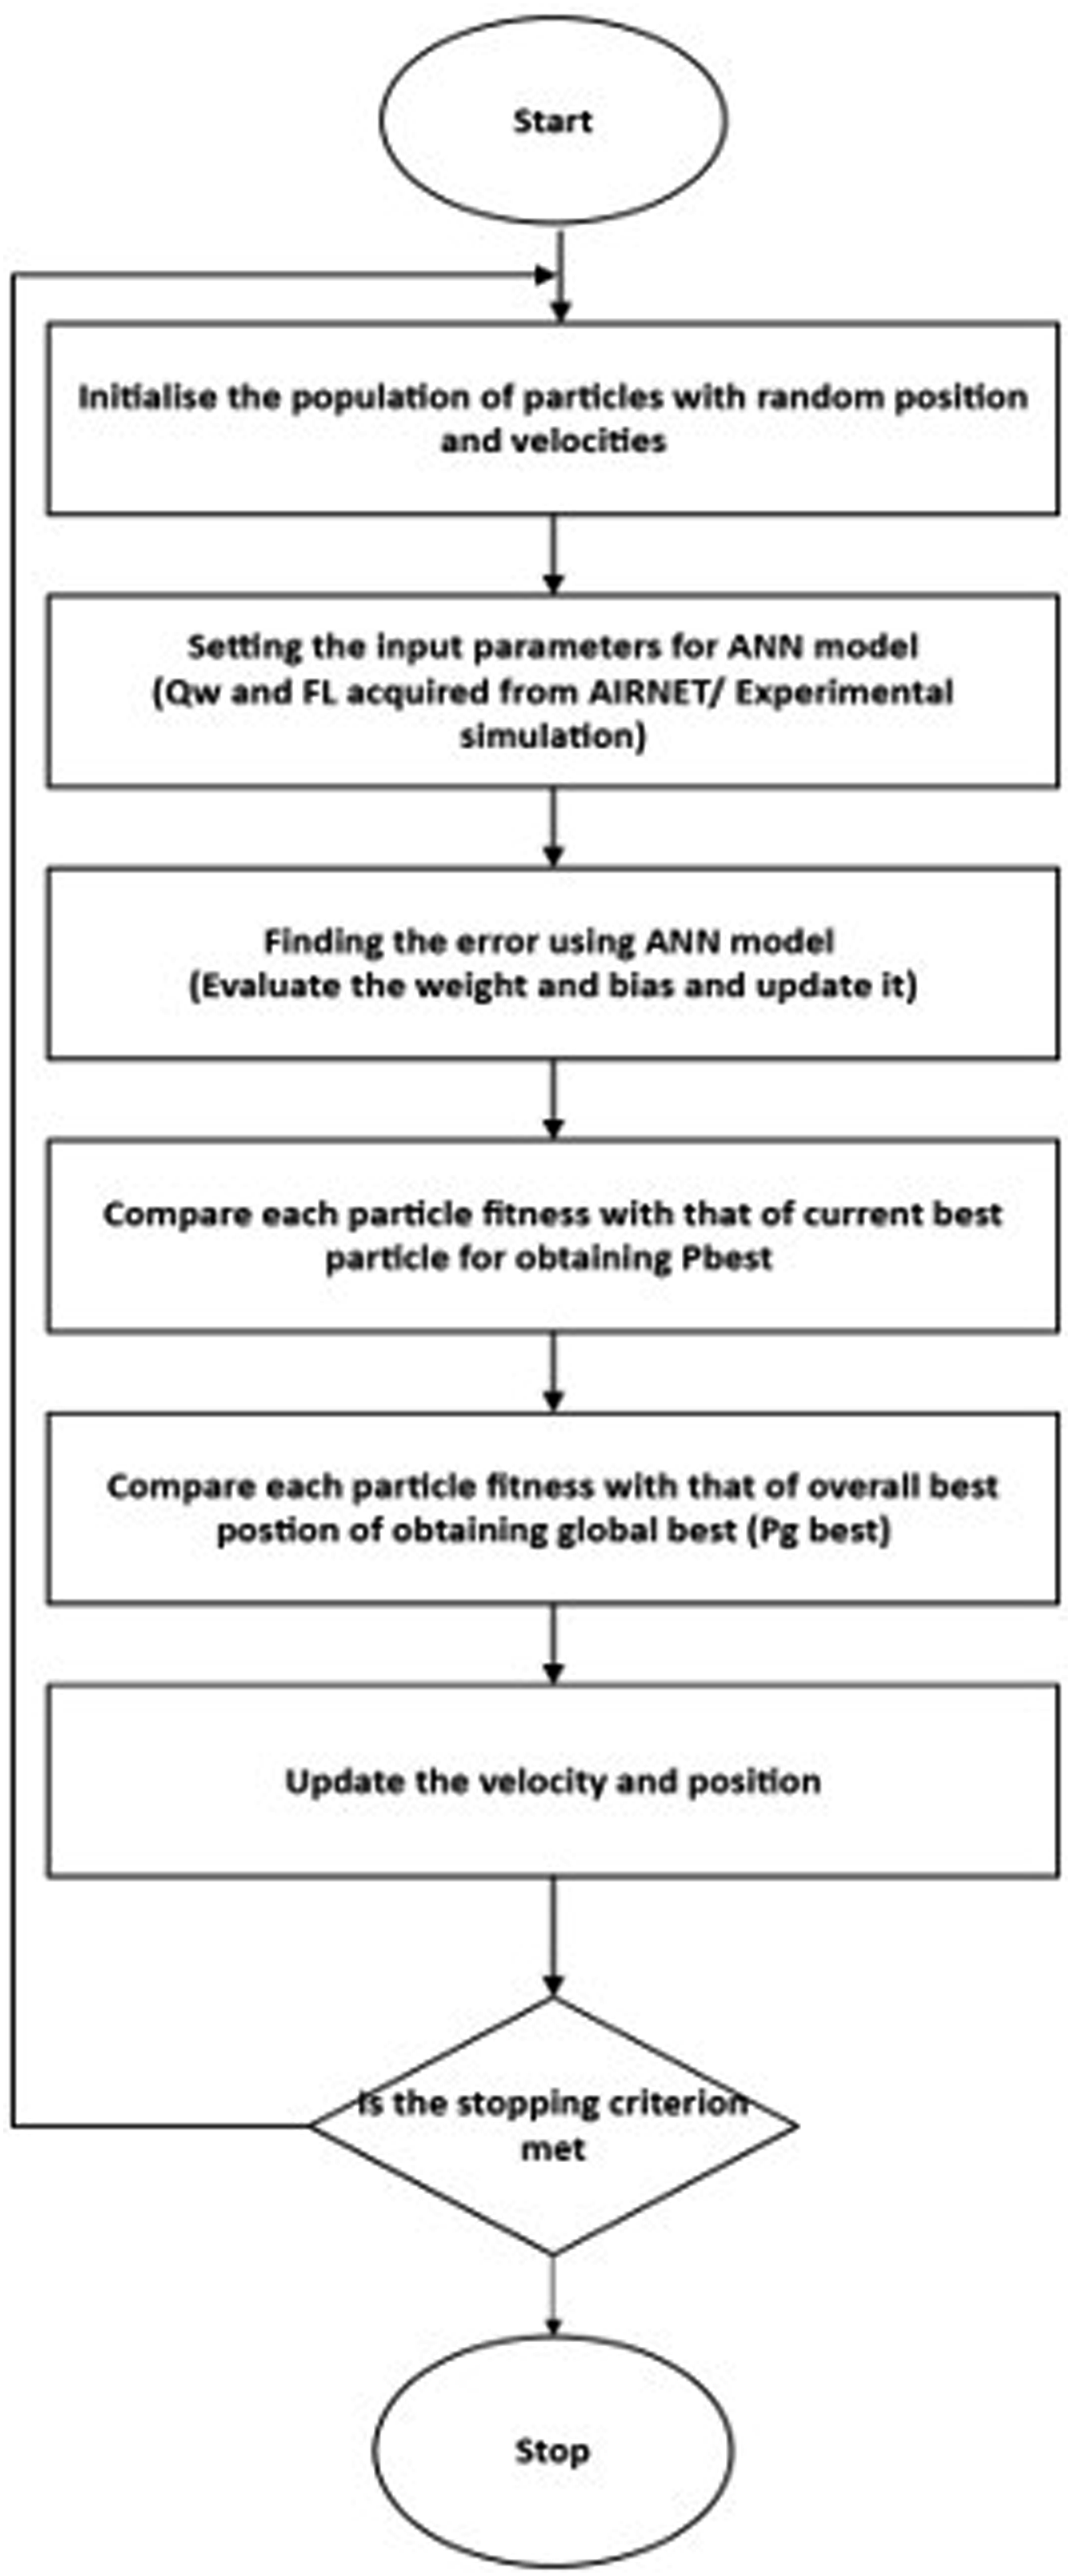
Experimental configuration
The experimental setup for studying the flow phenomena inside BDS at the National Lift Tower in Northampton, UK, is illustrated in Figure 4. This figure shows the single stack system, which connects discharge sources from different floors (F4, F5, …, F15) into the main stack. Instruments for measuring pressure and flow rate are provided, and flow control is enabled to simulate various realistic BDS conditions in MSB. Figure 6 also details the connections of eight pressure sensors (P1, P2, …, P8) at different locations on the vertical stack, all attached to a 100 mm diameter pipe. The setup allows for opening and closing the ventilation pipes during experiments, as depicted in Figure 6. A photograph of the ventilation pipe and valve connection at the NLT tower is also shown. Pressure sensors P1 and P2 are placed on the vertical stack, with P1 positioned 1 m upstream from the collection tank at 0.0 m and 0.9 m, respectively. Sensor P3 is just below the toilet’s T-junction at an 8.2 m height, while P4 is 1 m above the toilet at a 10 m height. P5 is located 0.1 m above P4. P6 is positioned at 27.9 m, also 1 m above a toilet, and P7 is similarly placed above another toilet, just above its T-junction. Sensor P8 is situated on the 15th floor, 1 m above the toilet and T-junction. All pressure sensors operate within a 1 bar range. Additionally, a hot wire anemometer is mounted at the top of the tower, at a height of 76.3 m, to measure airflow rate into the vertical stack. The experimental configuration includes eight squeeze sensors, such as stainless steel pressure transmitters (P1, P2, P8, etc.), and a single hot wire anemometer (A1), used to measure air flow rates ranging from 0 to 8 m/s, as illustrated in Figure 6. Experimental set-up in Northampton, U.K.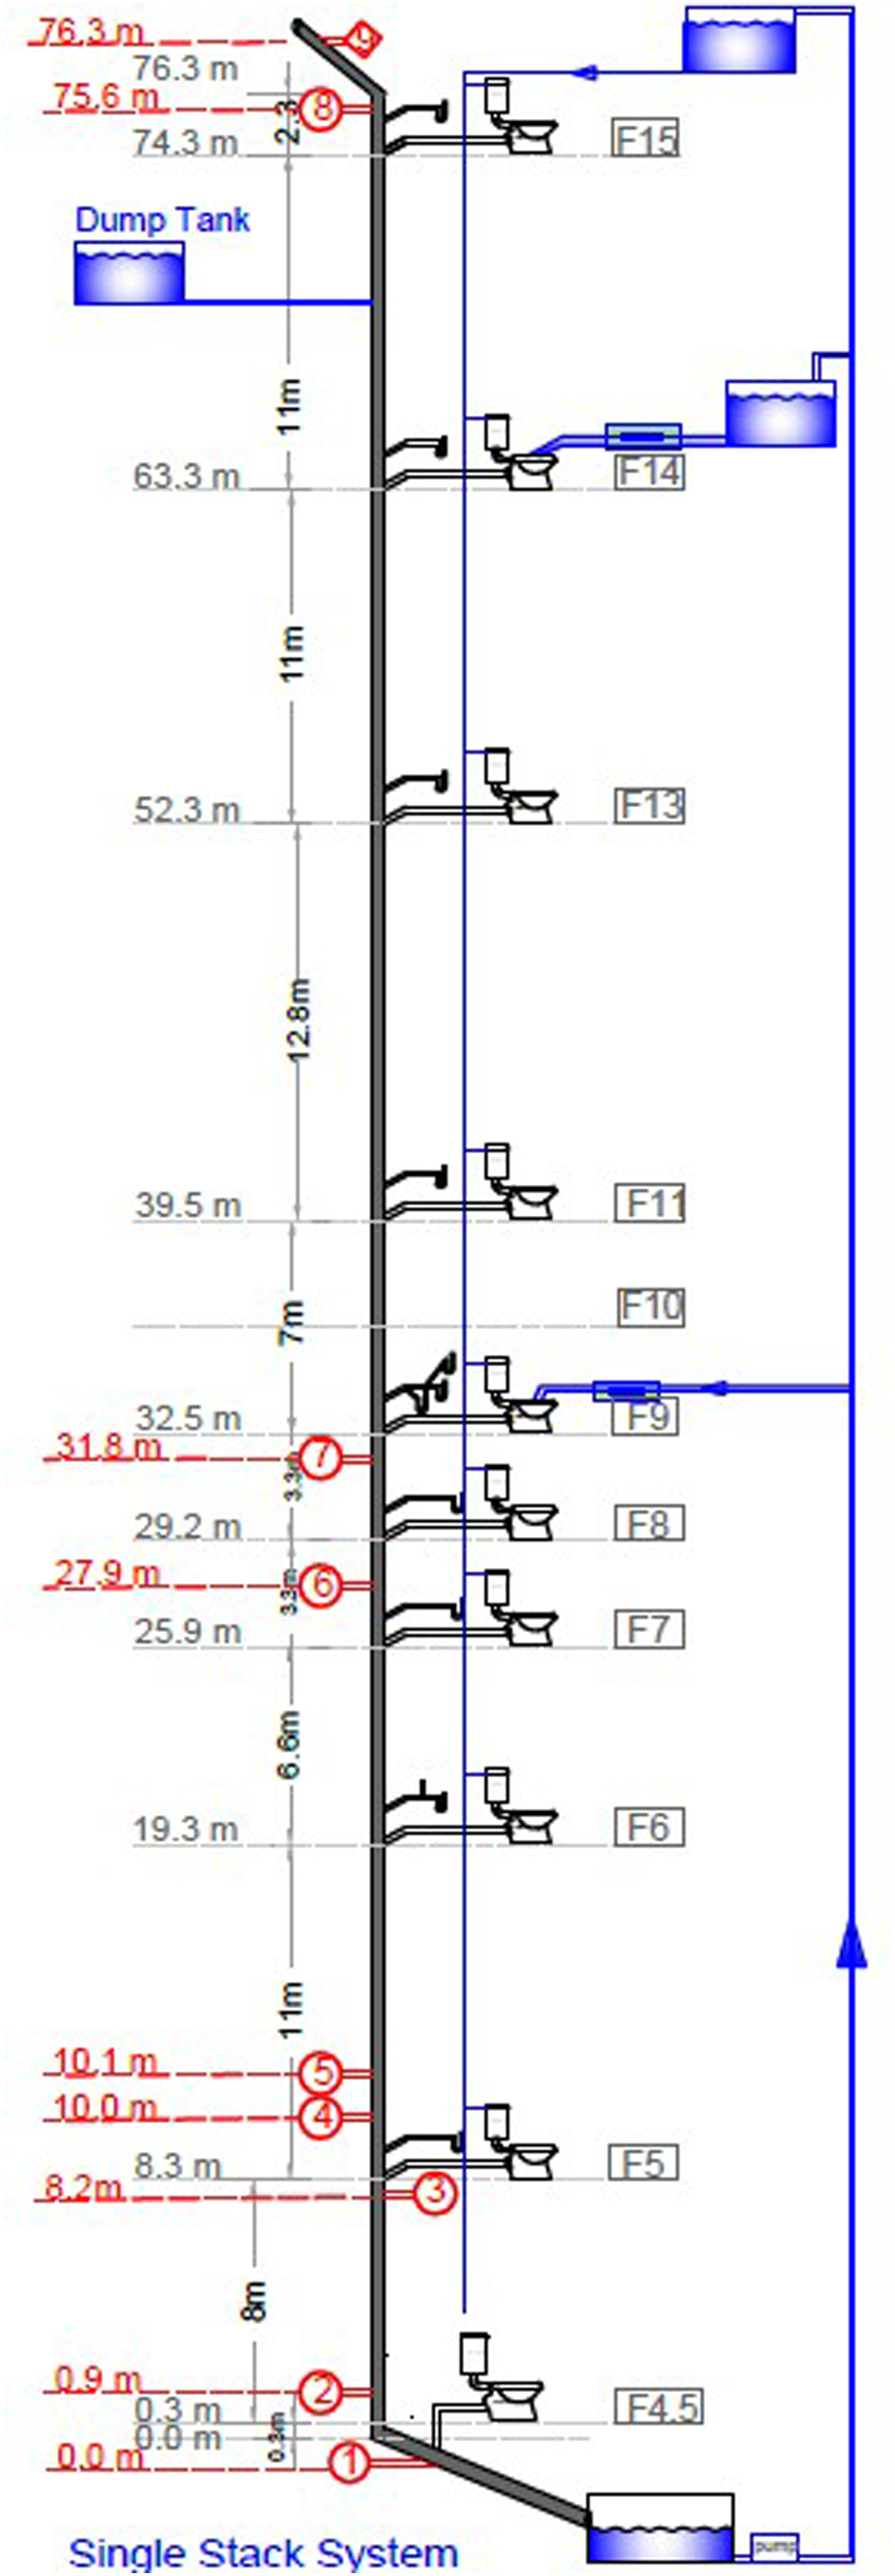
Results and discussions
Validation
Statistical performance for different ANN models for 4 L/s from 8th floor.
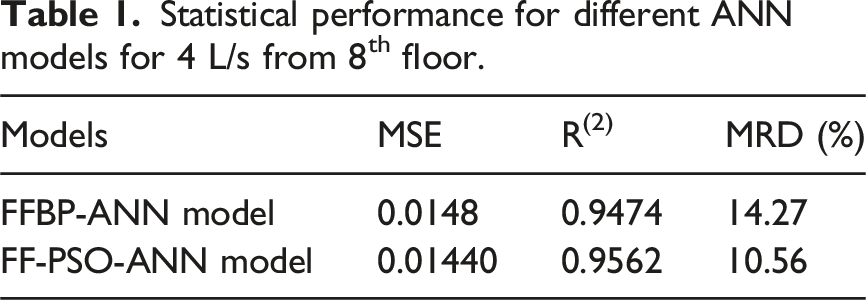
It is observed in the Figure 7, the predictions from the FF-PSO-ANN model have excellent agreement with the experimental data and the AIRNET results. When compared to the FFBP-ANN and PSO-ANN models, as seen from Figure 6. This deviation is more noticed in the dry-stack zone in comparison with wet-stack region. Some of the deviation is observed in the FF-PSO-ANN model from AIRNET simulation and experimental simulation. The work based on FFBP-ANN
40
has been improved by hybridizing the natural algorithm PSO with Feed Forward ANN scheme. Table 1 indicates that correlation coefficient ‘R2’ is highest for FF-PSO-ANN model, which is comparatively better than FFBP-ANN model. Both FFBP and FF-PSO model yield correlation coefficients quite high and implying their reliability. However, R2 value of FFBP-ANN model is comparatively low. This fact is also augmented through higher relative deviation. Prediction of different pressure profiles using different models.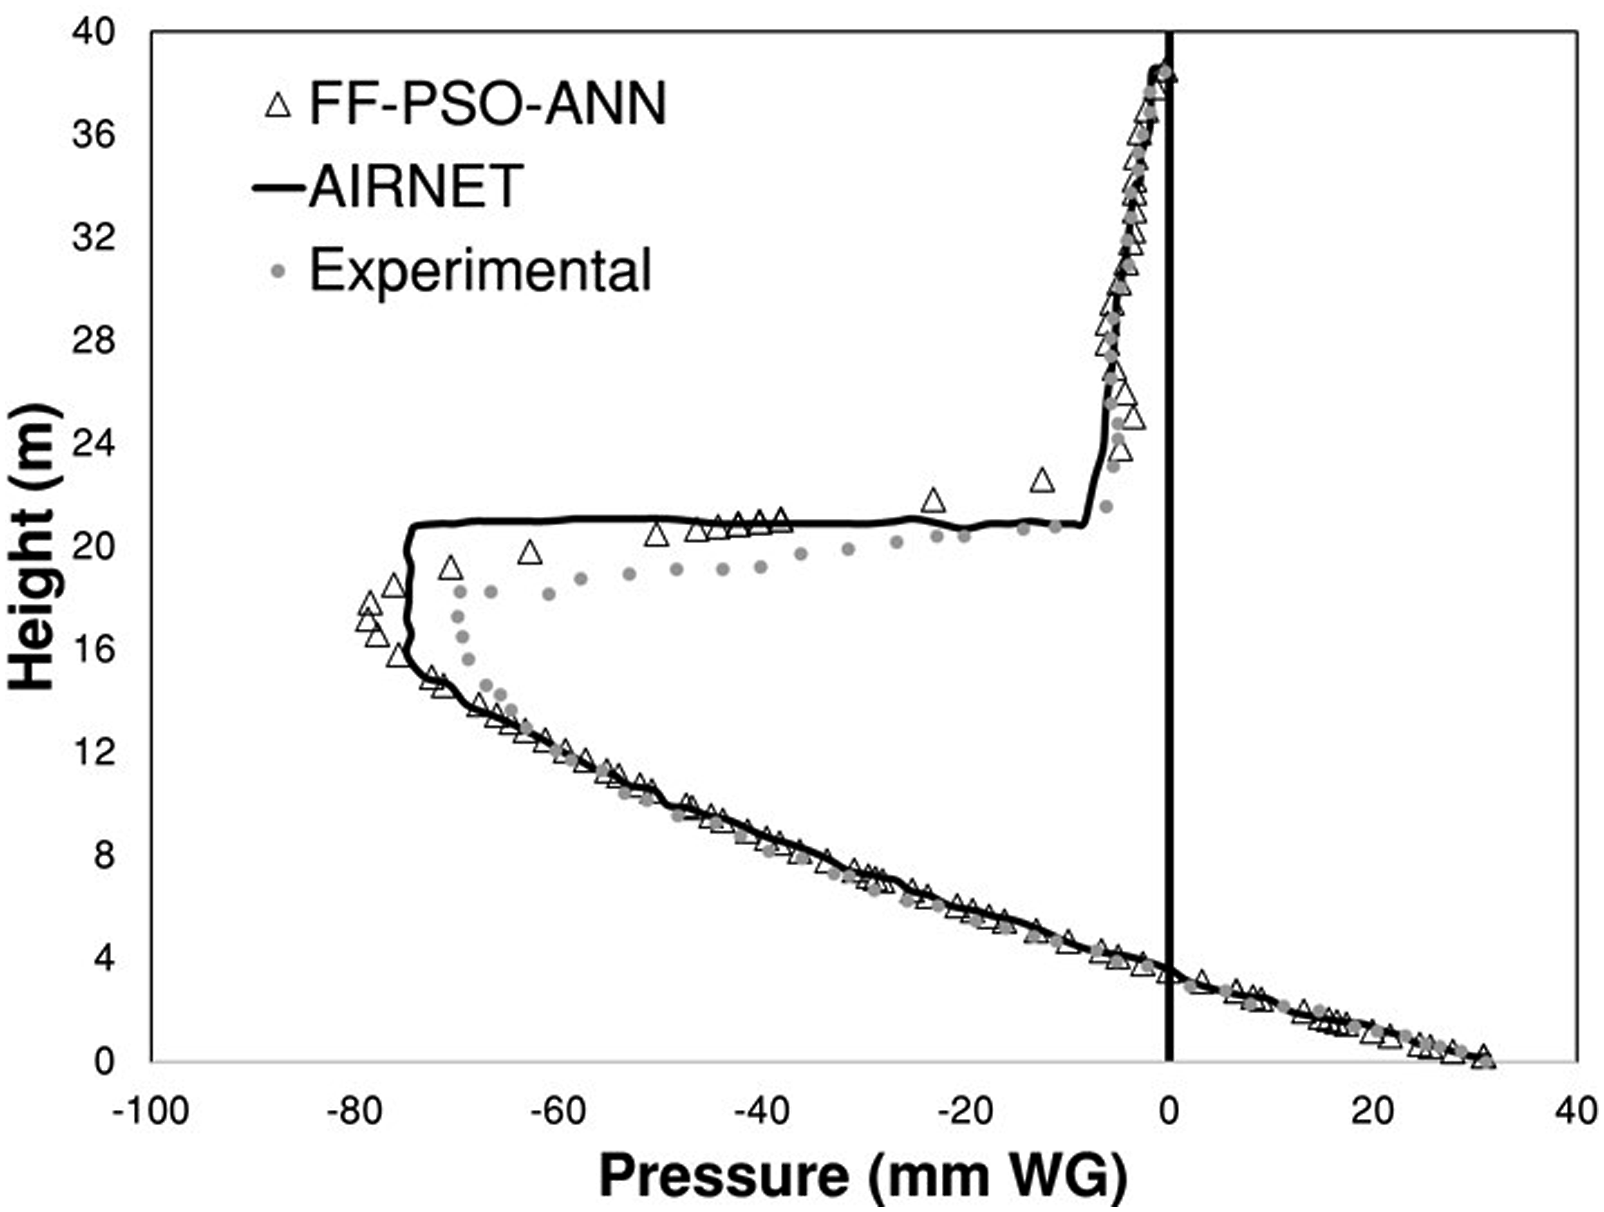
Effect of population size
Petroskri et al 42 reported that that there is no deterministic rule for fixing up, the population size as a network parameter for its optimal performance which has been varied to examine its performance. The population size depends upon the search space and complexity of the problem. If the population size is large, then the solution will be random in characteristics. Although a larger population size can often enhance the method’s effectiveness for more complex problems, this is not always certain and can sometimes be misleading. In addition, convergence criterion and computational time are controlled using population size. For investigation purpose, the population size of 10, 30, 50, 80, and 100 are used, keeping hidden neuron as 24.
Figure 8 describes the pressure distribution along the stack height by varying population sizes when the discharge takes place from the 9th floor at 2 L/s. It shows very good agreement between the predicted data and the experimental data for the dry stack as well as the wet stack. Even at discharge entry point B, it does not show any deviation in all five cases. Only a small deviation is observed at point D where the hydraulic jump takes place. Deviation with changing population size is small for all cases. Pressure variation with height for different population size.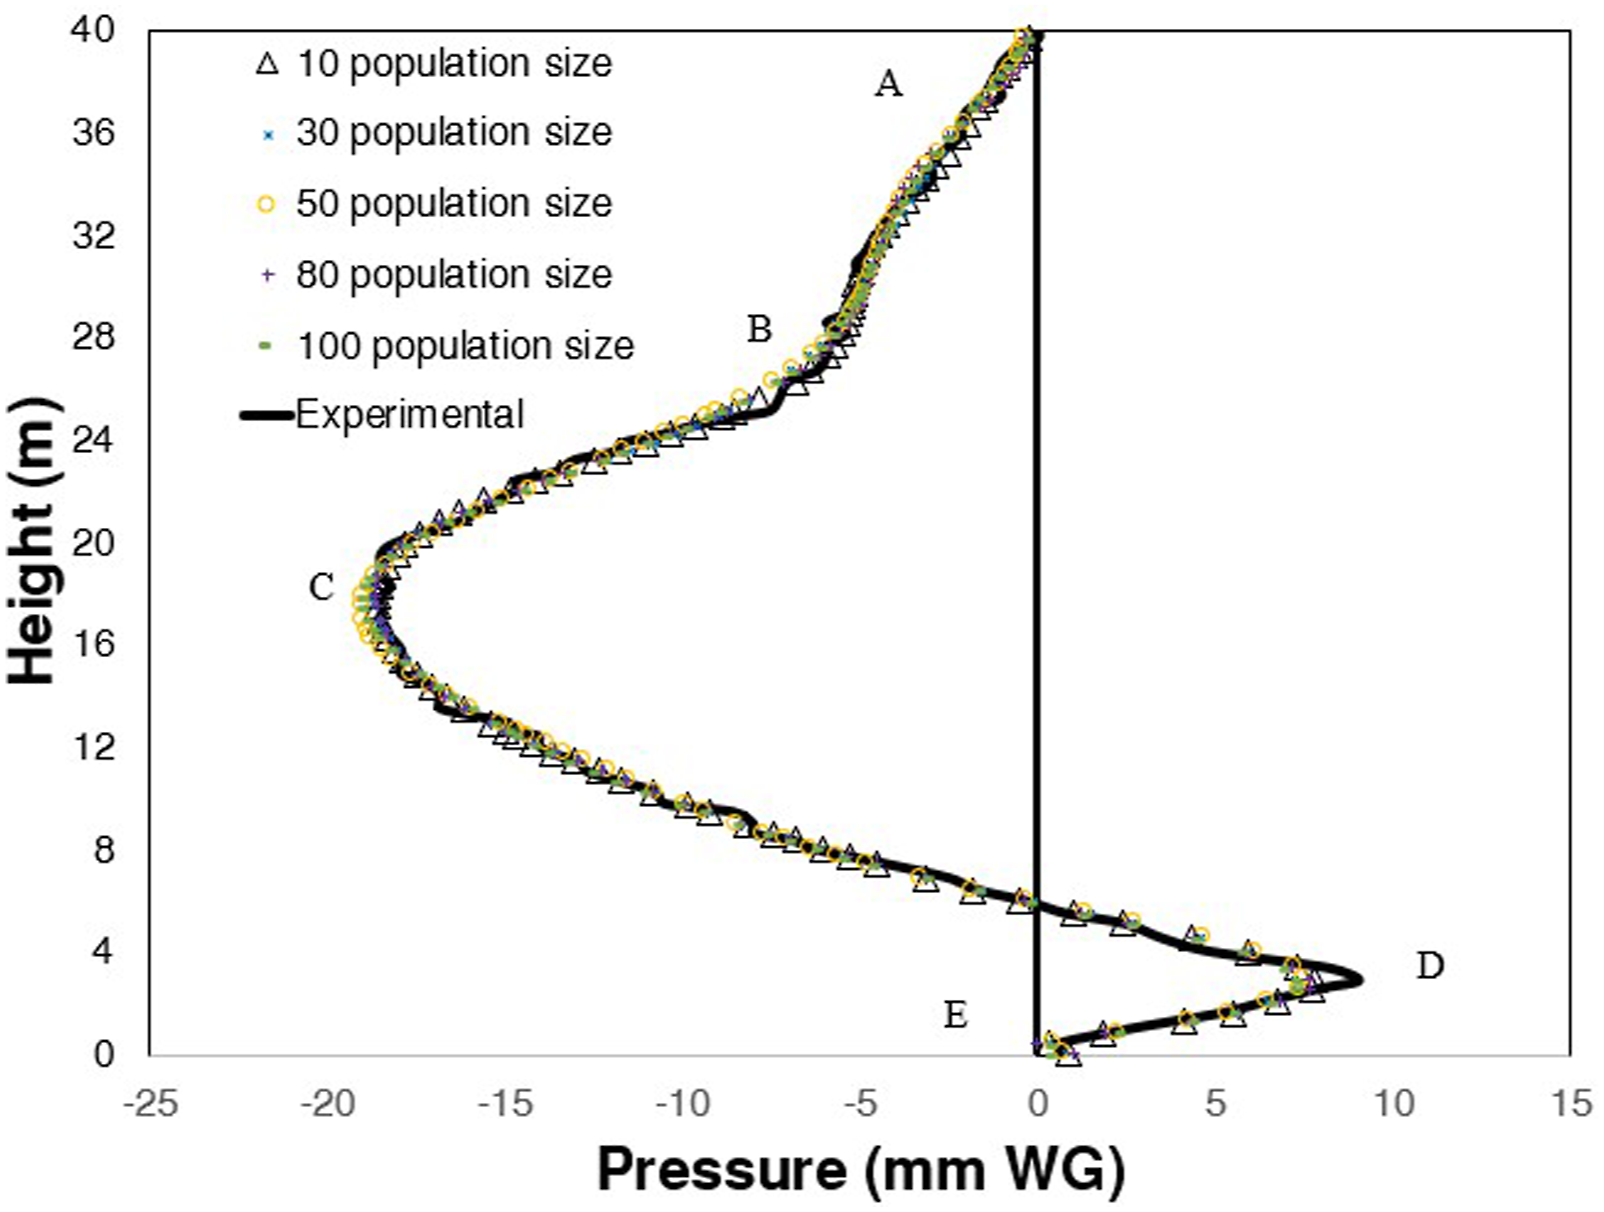
Performance of FF-PSO ANN model with population size (HN = 10).

Performance of FF-PSO ANN model with population size (HN = 24).
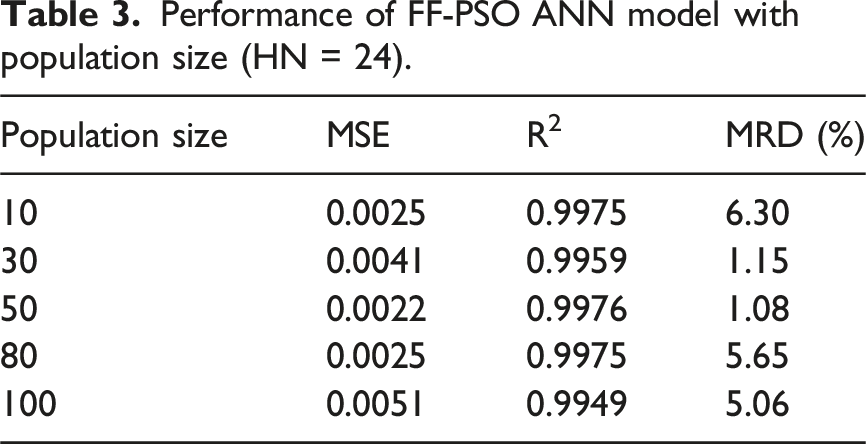
Furthermore, by comparing Table 2 with that of Table 3 and it is seen that performance indicators are better for 24 hidden neurons for each population size. The variation of MSE with population size has been shown in the Figure 9. It can be concluded from all these observations that the optimal ANN performance is found for 24 hidden neuron and population size of 50. The R2 value of 0.9976 implies high correlation coefficient of 0.9987. MSE versus Population Size for discharge taking place from 9th floor at 2 L/s.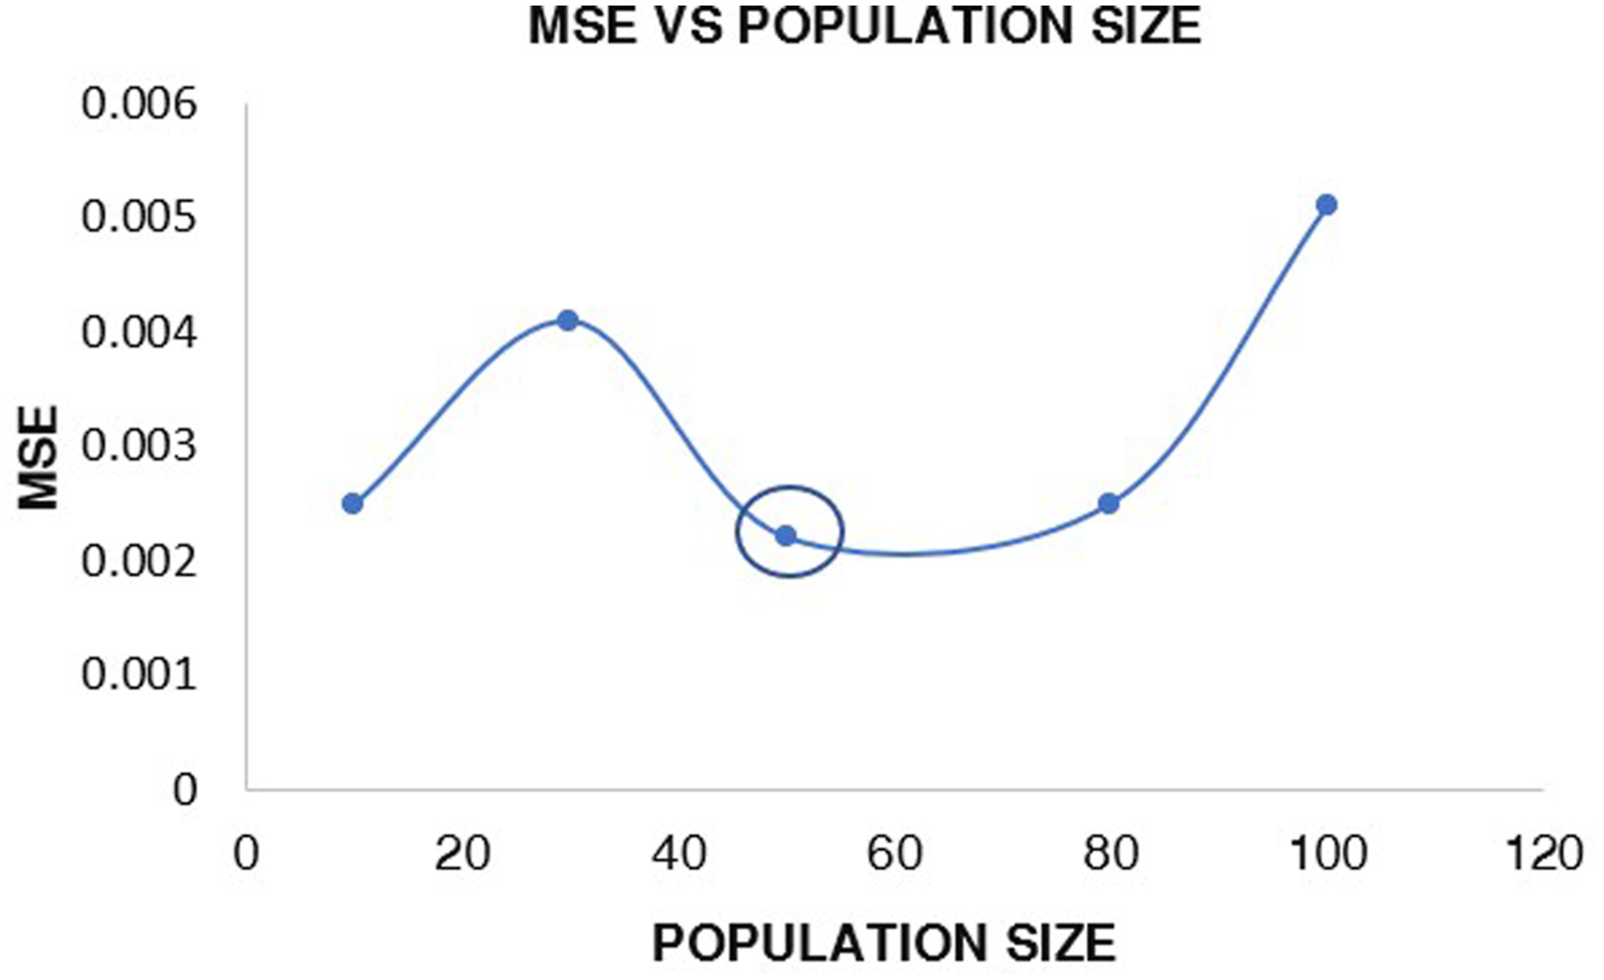
Variation in discharge flow rate
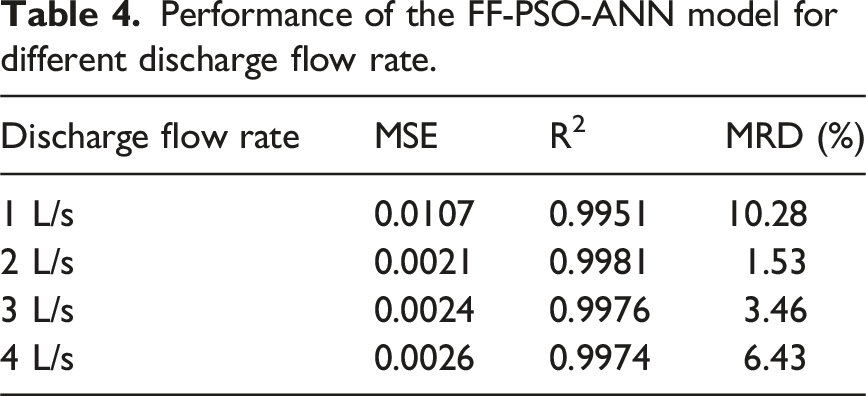
The simulation with the FF-PSO model has been performed by changing the discharge flow rate from a fixed floor height. The convergence controlling parameters such as the inertia weight is taken as 1, the damping factor of the inertia weight is set as 0.99, and the acceleration coefficients are set as 1.5 and 2.0 respectively. Figure 9 represents the obtained results of the distribution of the pressure profile with respect to the height. From the Figure 10 and Table 4, it can be observed that the FF-PSO ANN model performs very well for discharge flow rates of 2 L/s and 3 L/s and even the performance in the case of 4 L/s is associated with 6.43% MRD. From the Figure below, a large deviation is observed in the dry stack at the point of discharge (i.e. at B) for all discharge flow rates. The dry stack zone and wet stack zones along with pressure peak points are already identified in the pressure profile curves given in Figure 9. As observed from Figure 10, the experimental data and predicted results obtained from the PSO-ANN model overlap with each other reasonably well in both dry stack and wet stack region. Near the point D that is positive pressure peak point, some deviations from the experimental data for all flow rates are observed. In the wet-stack zone, the negative pressure peak is denoted as point(C) whereas the positive pressure peak is denoted as point D. As per Cheng et al.
43
point B denotes where the air pressure rebounds after reaching its negative peak, and it extends from the discharge entry to the point downstream. From point C to D due to the slow falling rate of the water, the airflow accompanied by the falling water gains energy in the form of an increase in static pressure. In the downstream direction, a constant positive pressure gradient results in a steady transfer of momentum from the falling water into the airflow. From point D-E, due to the hydraulic leap at the intersection of the horizontal drainpipe and the vertical stack pipe, a positive pressure is experienced in this section. Table 4 depicts the performance indicators, and it is obvious from the table that relative deviation is well within 11% with high R2 value. The prediction of ANN model is somewhat inferior for 1 L/s discharge rate compared to other discharge rates. Possibly, within same diameter of main stack of BDS, less discharge amount is subjected to more erratic motion, whose prediction becomes relatively cumbersome. As a consequence, predicted values for 1 L/s are subjected to more relative deviation, more MSE and less R2 value compared to other discharge rates. However, the investigation thus conducted to predict pressure profile for two-phase flow phenomena within BDS even for different discharge rates, validates the predictions from FF-PSO ANN model. Pressure profiles at different discharge flow rate(a) 1 L/s (b) 2 L/s (c) 3 L/s (d)4 L/s. Performance of the FF-PSO-ANN model for different discharge flow rate.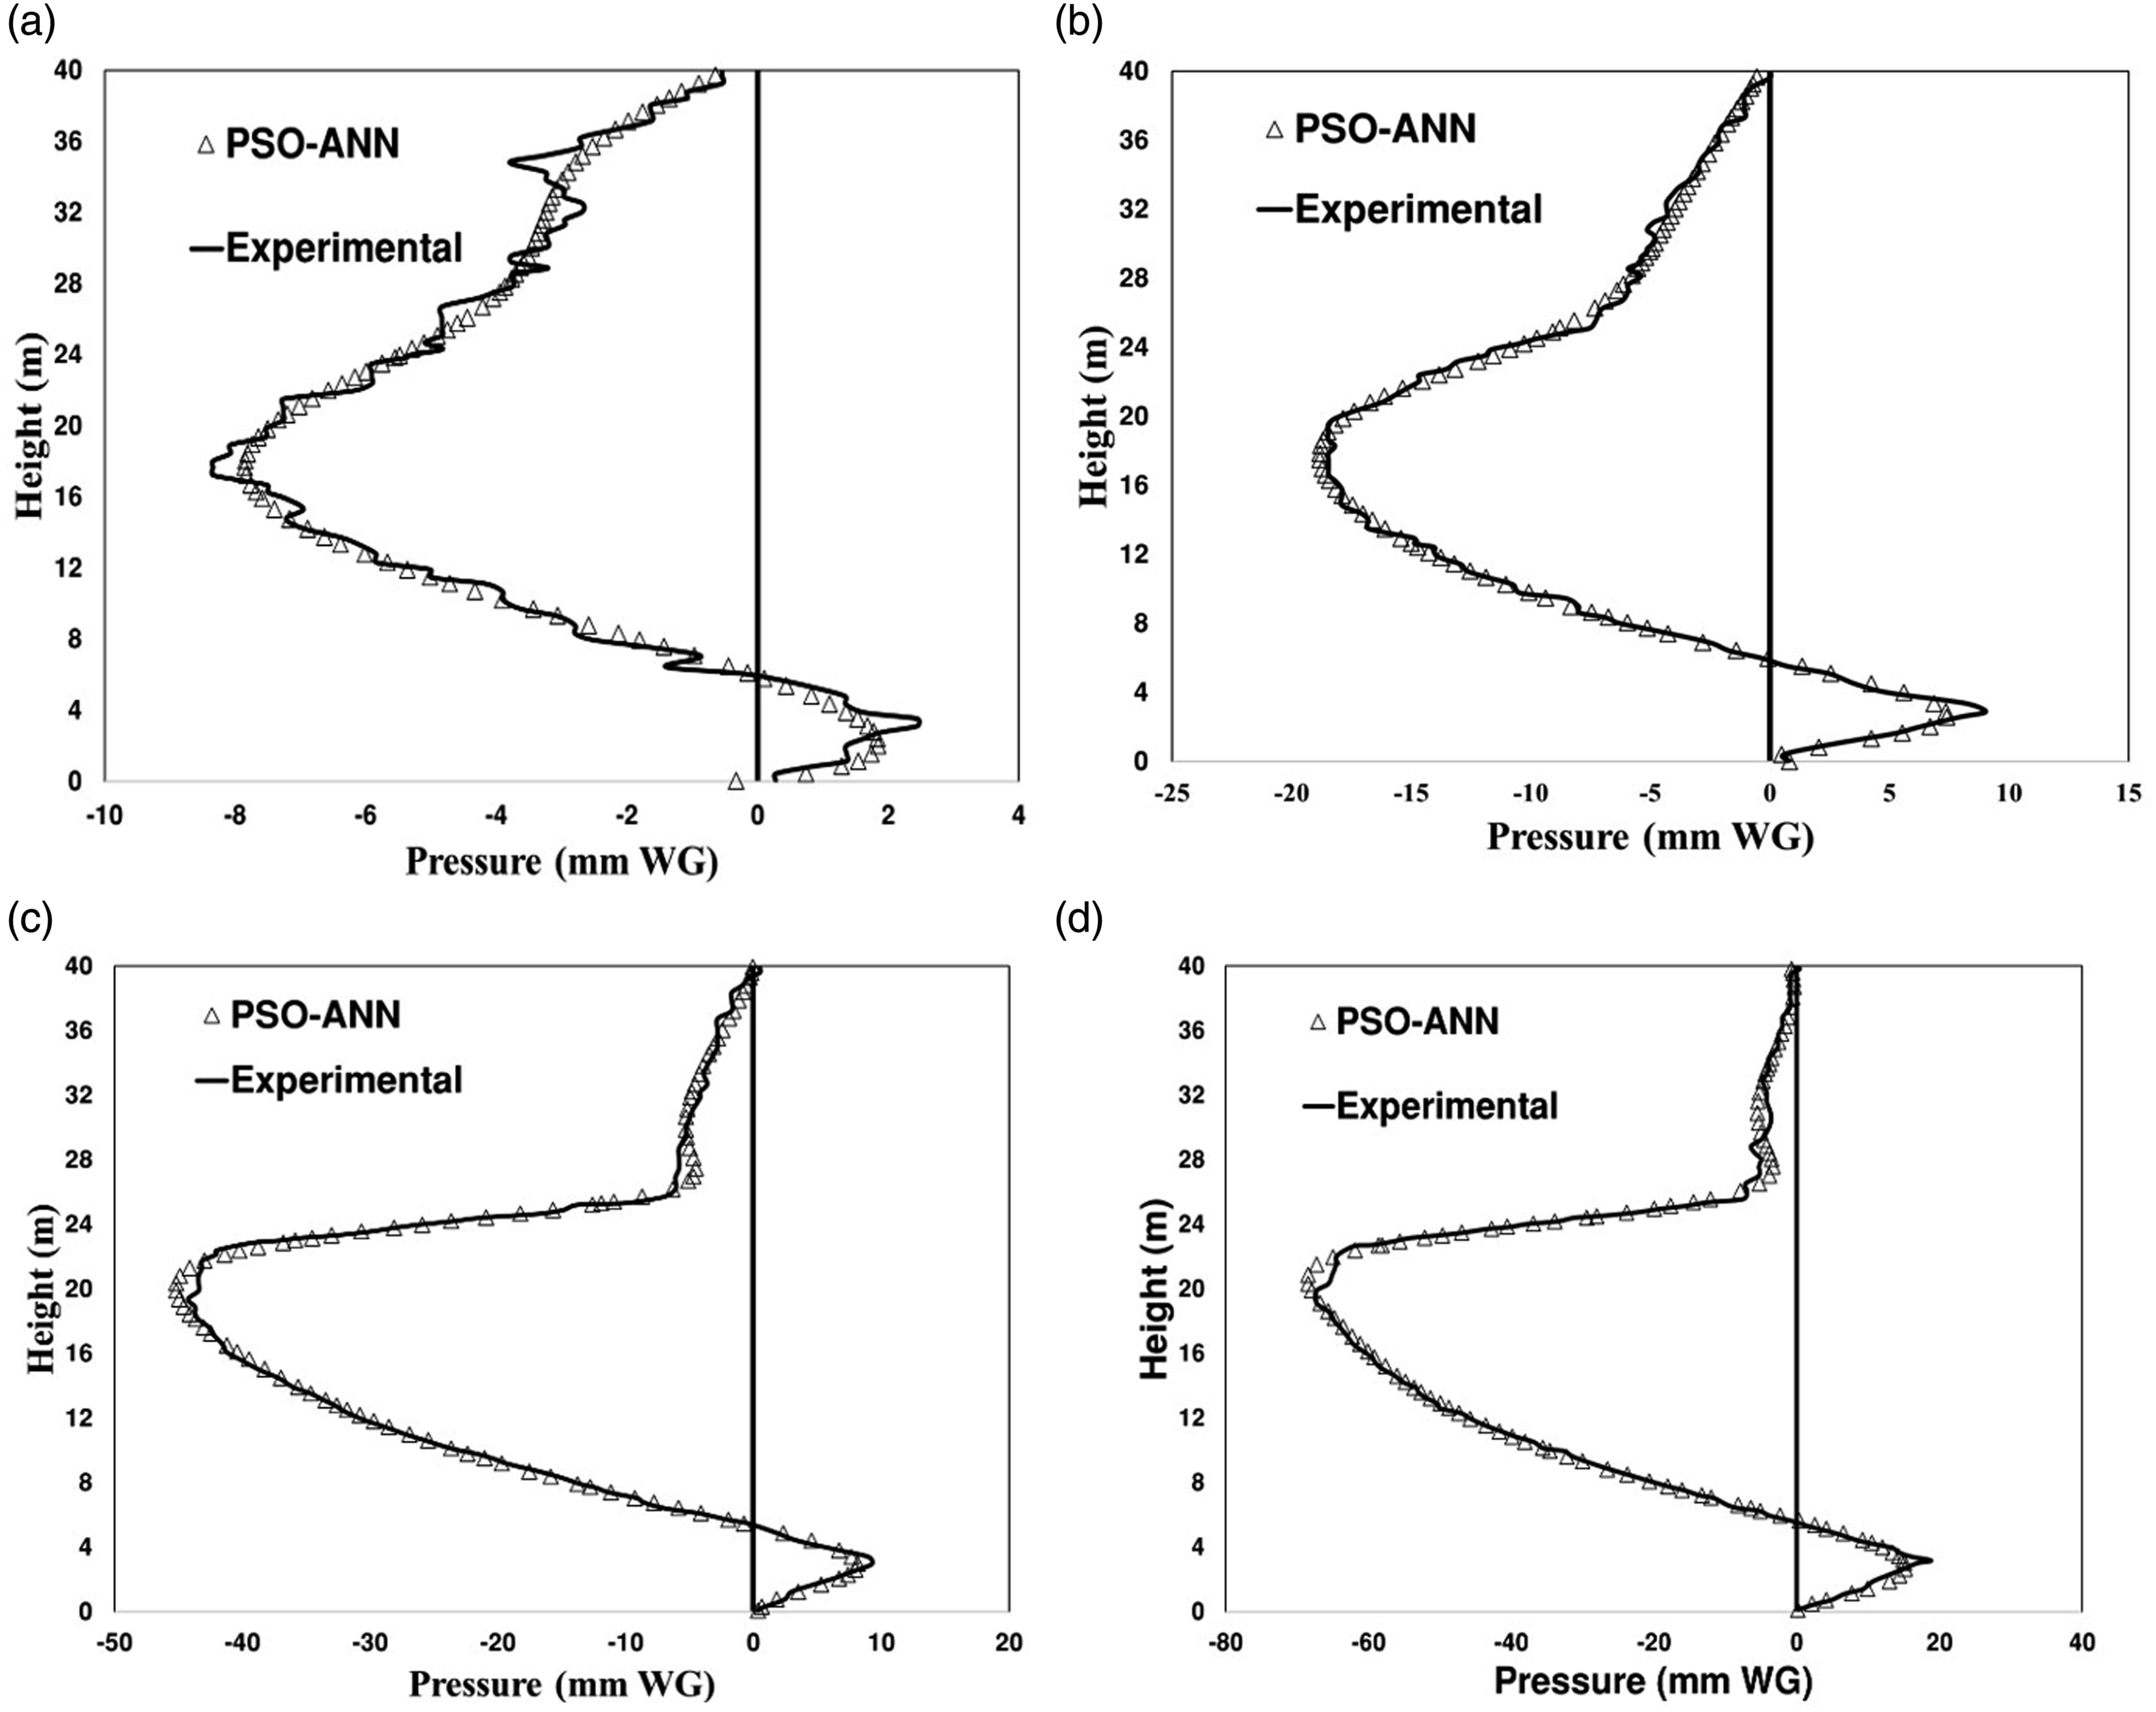
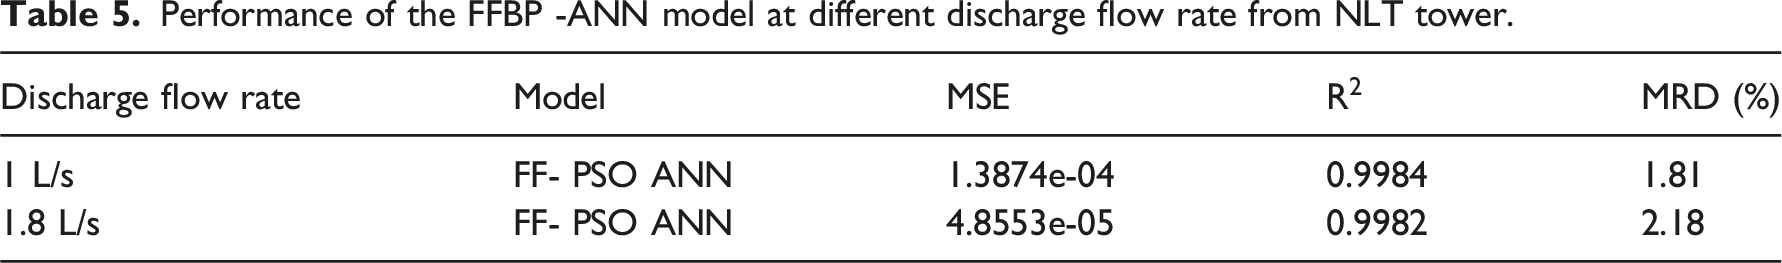
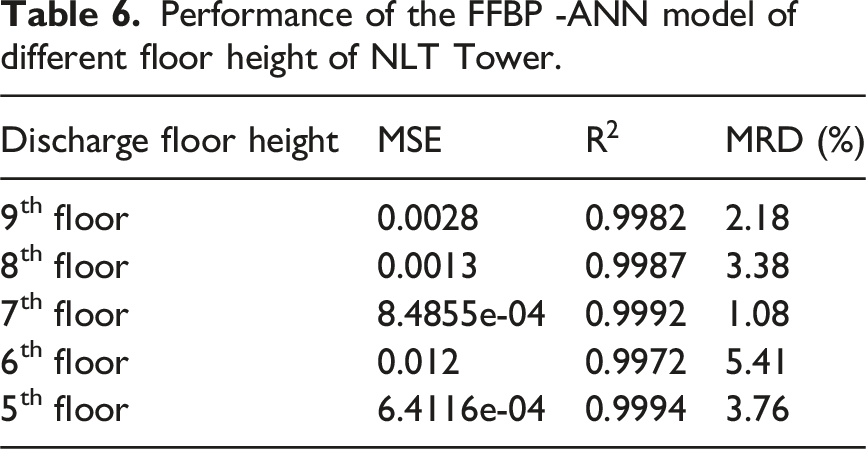
Additionally, experiments were conducted with discharge rates of 1.8 L/s and 1 L/s from the 9th floor of the NLT tower. The resulting pressure profiles for the BDS are shown in Figure 11(a) and (b), which also include the predicted pressures from the FF-PSO-ANN model, using the experimental data as a reference. Figure 11(a) and (b) reveal that the maximum positive pressure for the 1 L/s discharge rate is significantly higher than that for the 1.8 L/s flow rate. The model’s predictions were compared with the experimental data, and its performance parameters are listed in Table 5. Experiments were carried out with a consistent flow rate while varying the discharge floor heights from the 9th to the 6th for the NLT tower. The model’s predictions were highly accurate, showing a Mean Relative Deviation (MRD) of 2.18% and a strong R2 value. Table 6 evaluates the performance of the FF-PSO-ANN model across different floors, providing discharge data and emphasizing performance metrics, with an MRD reaching up to 5.78% and R2 values between 0.9972 and 0.9994. Pressure profiles at different discharge flow rate(a) 1 L/s (b) 1.8 L/s achieved from NLT tower. Performance of the FFBP -ANN model at different discharge flow rate from NLT tower. Performance of the FFBP -ANN model of different floor height of NLT Tower.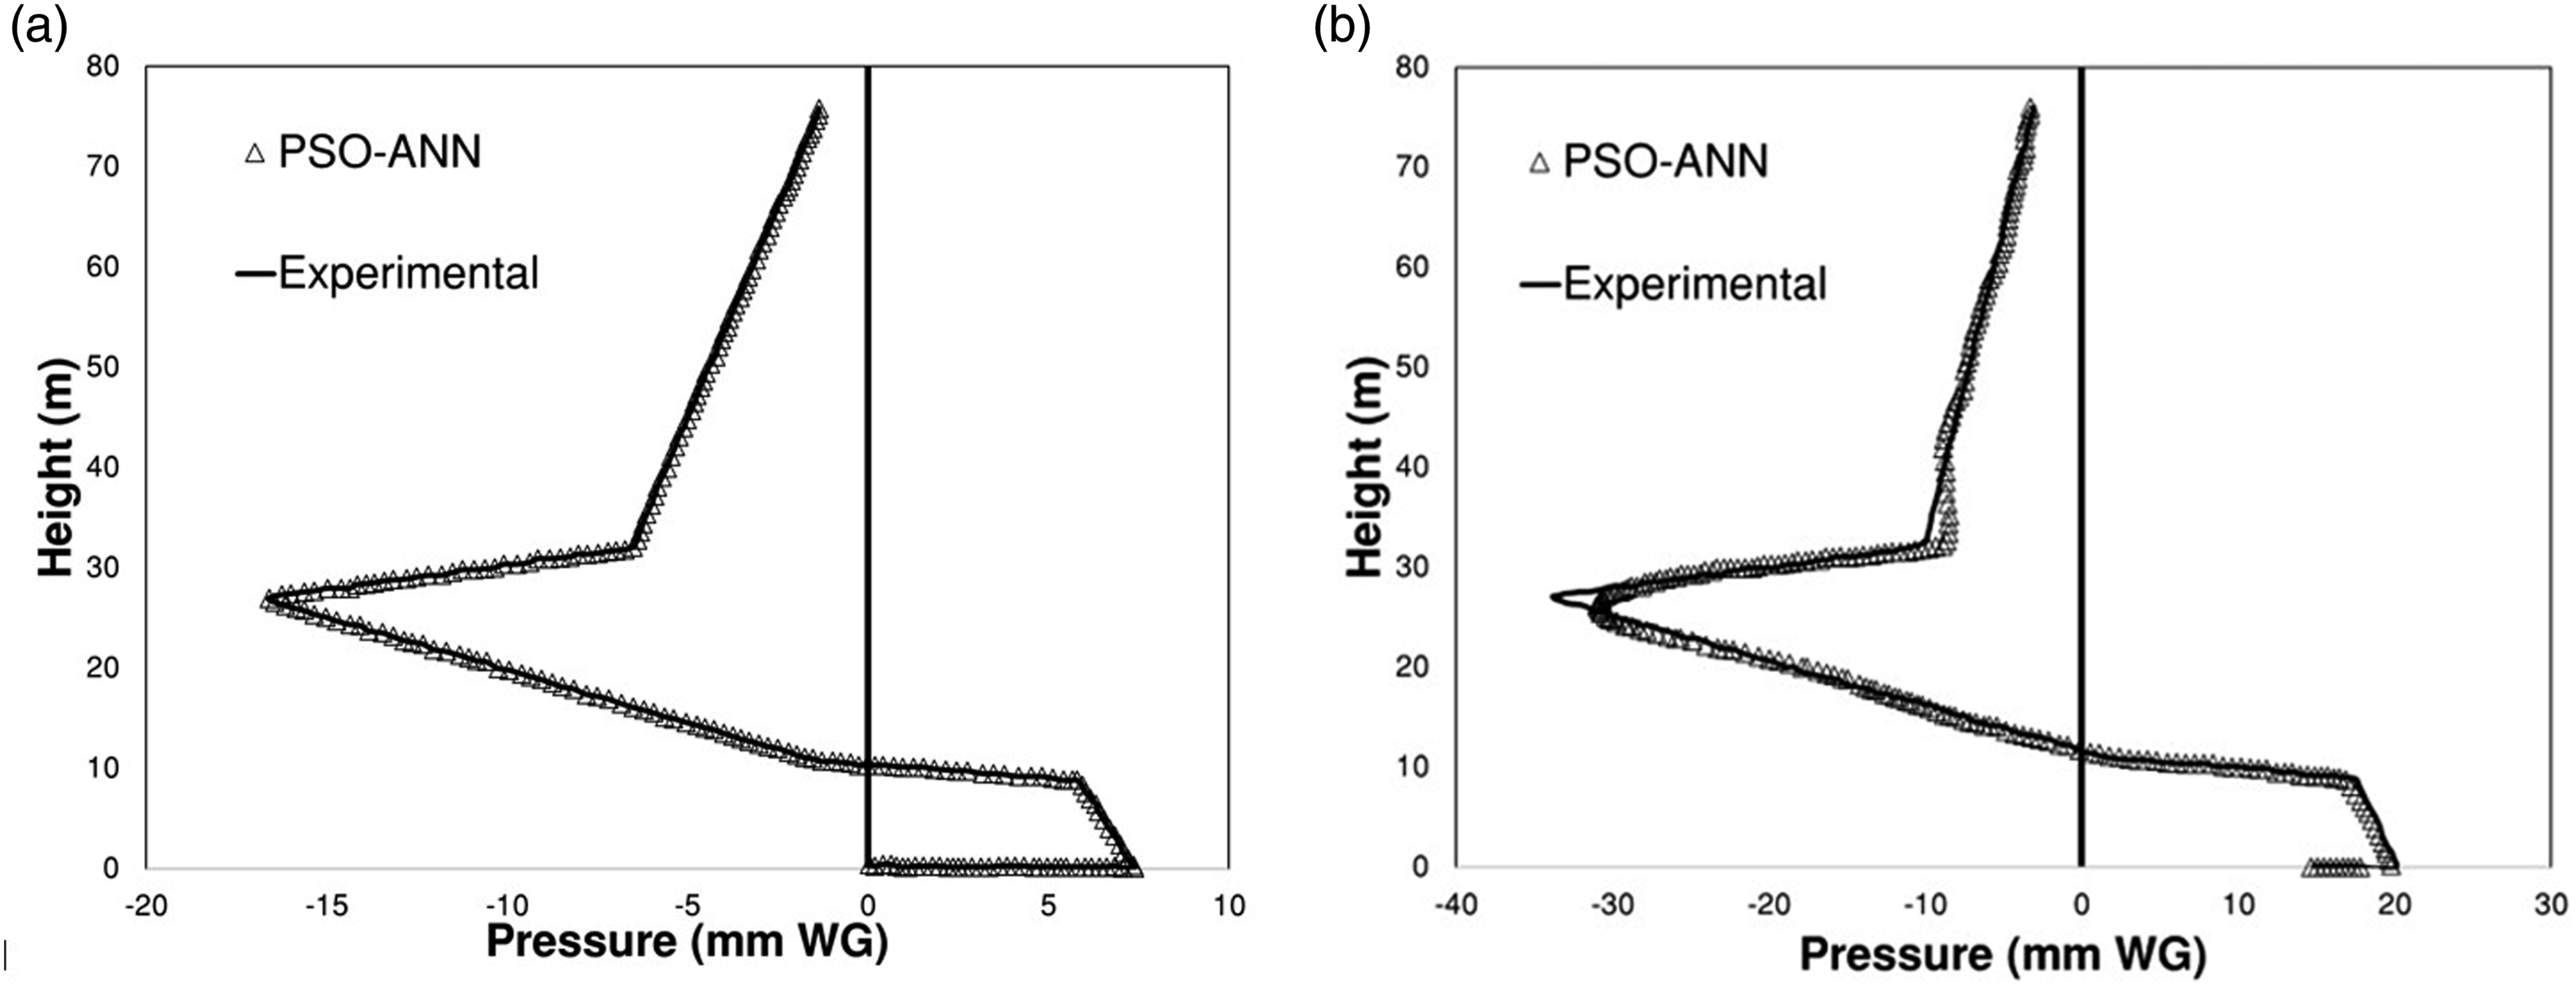
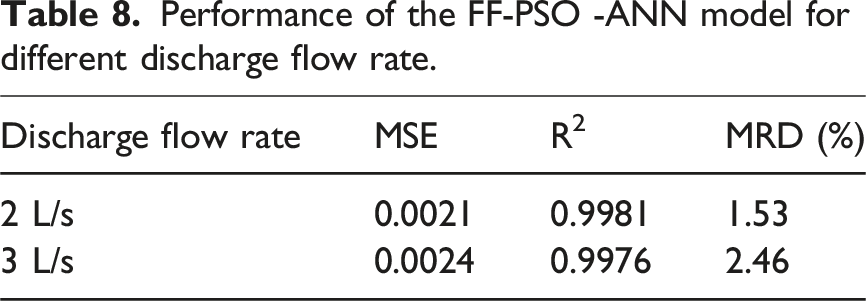
Comparison of FF-PSO-ANN and FFBP-ANN model
Performance of the FFBP -ANN model for different discharge flow rate.
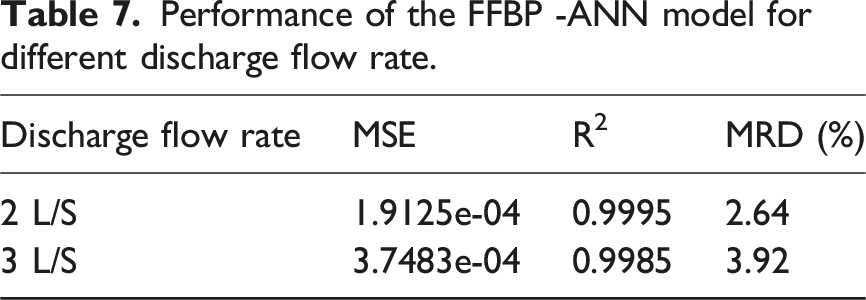
Performance of the FF-PSO -ANN model for different discharge flow rate.
Pressure profile prediction in building drainage system
In this section, the objective is to forecast the pressure profile of a Building Drainage System (BDS) in a multi-storied building by leveraging the pressure profiles of other BDS. It is well understood that two-phase fluid flow phenomena of BDS of different multi-storied buildings are different even if for same amount of discharge. Obviously, this results different pressure profiles for different BDS of different heights. Experimental investigation for finding out pressure profile in a BDS is not only time consuming but also cost prohibitive. Similarly, pressure profile prediction through either CFD modelling or AIRNET modelling, needs requisite experience of experts for its accurate prediction. Therefore, prediction of pressure profile of a BDS from the knowledge of existing data from different BDS is quite challenging and appears not to be straightforward. In spite of all these apprehensions, an attempt has been made to predict pressure profile for a BDS using data of another two BDS of different buildings.
Pressure profile prediction using FF-PSO-ANN Model.
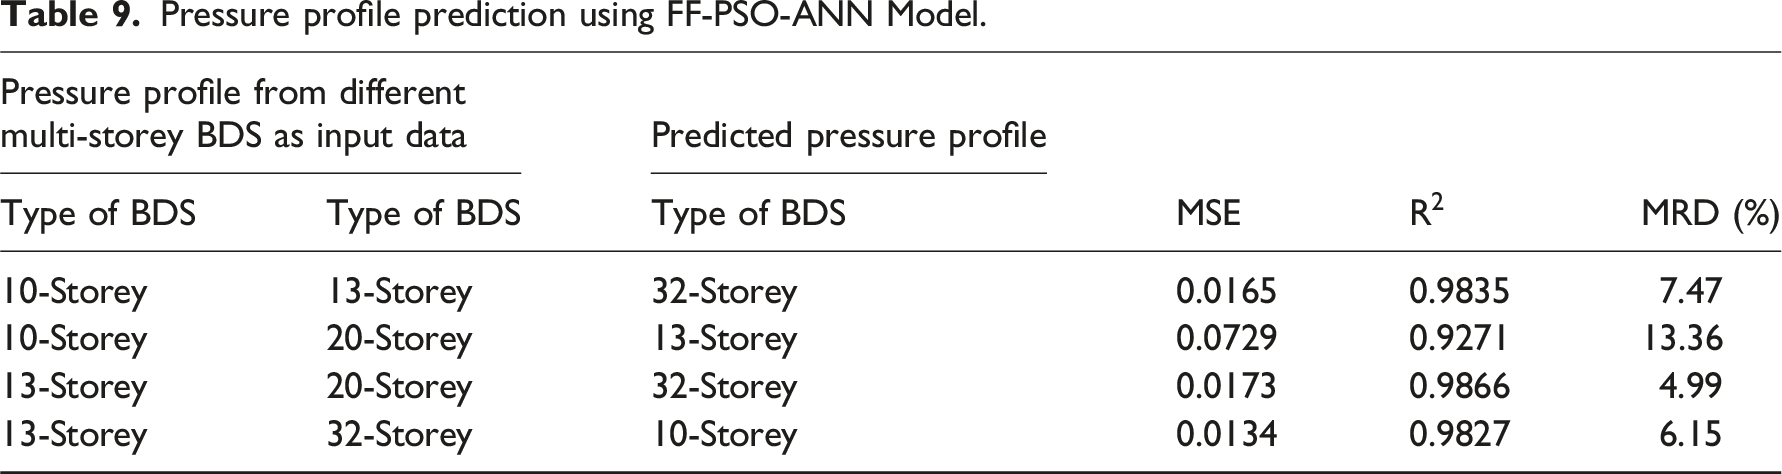
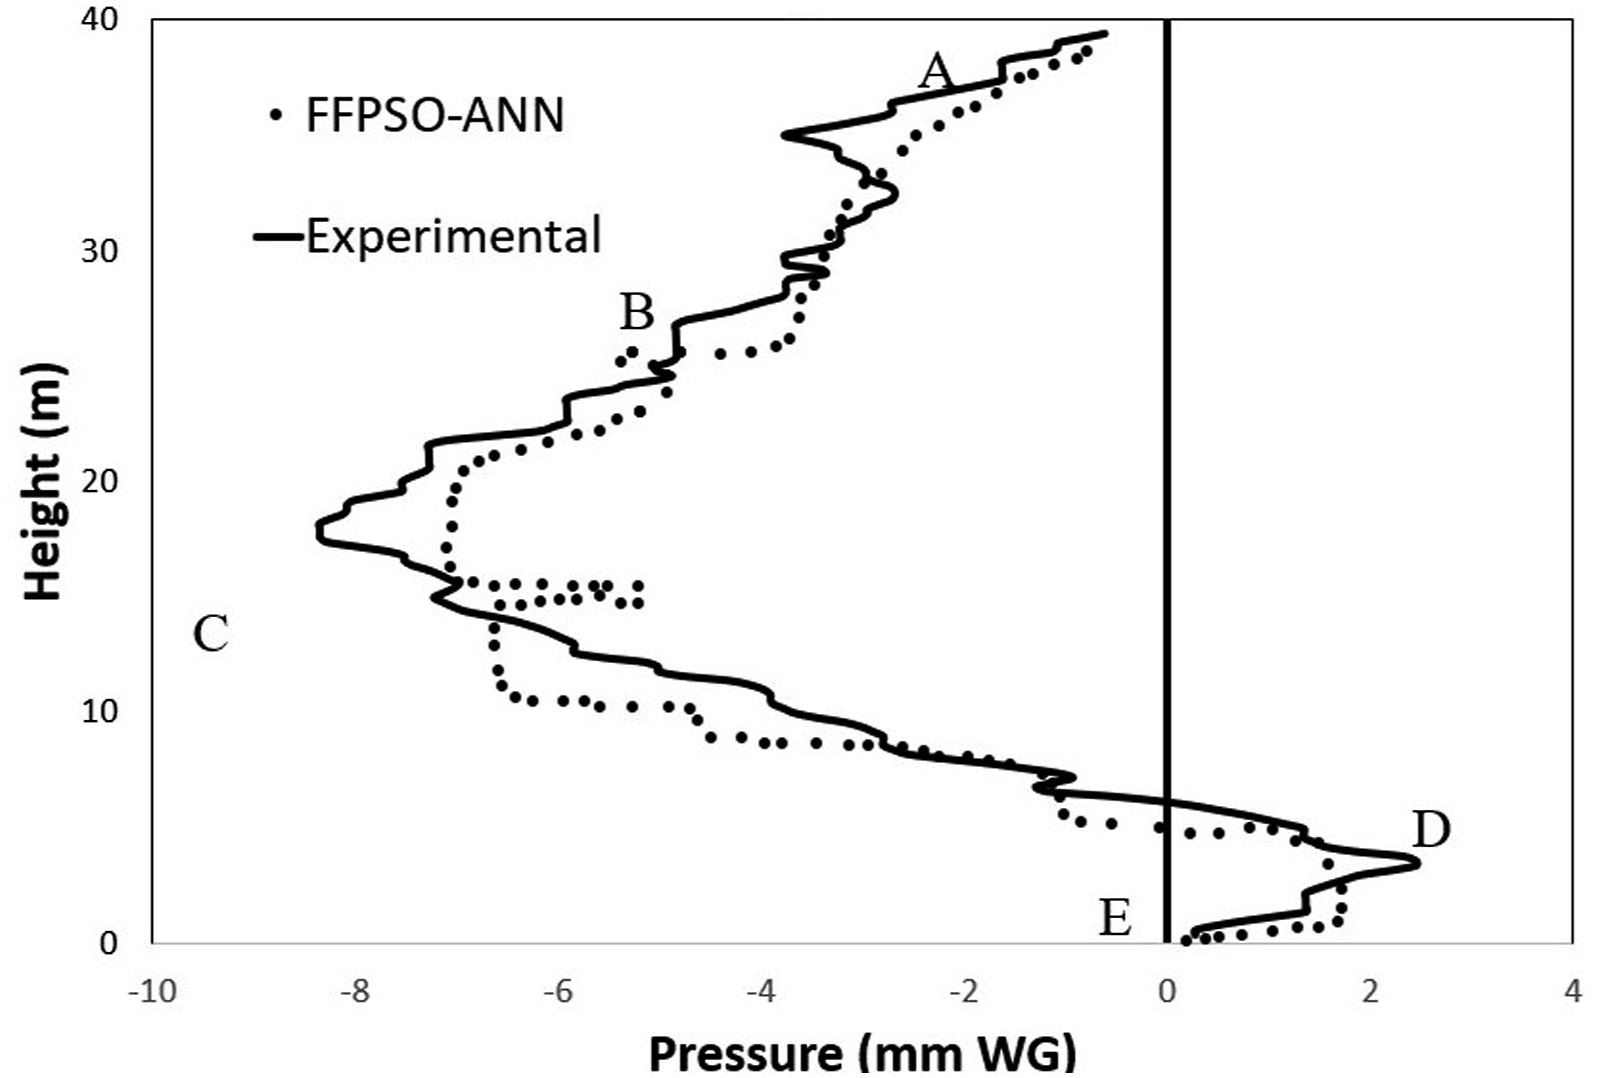
Pressure profile prediction for 13-storey BDS with input of pressure profiles of 10-storey and 20-storey BDS.
Conclusions
From the literature available till date, there is no work on resolving the issues of BDS using FF-PSO-ANN. This prompted the author to employ ANN model for establishing its suitability. As previously explained, ANN approach is considered to be a black-box model from the engineering sense. However, the suitability of the ANN model to different real field problems encourages the author to establish a reliable model for the present complex two-phase flow phenomena inside a BDS. In this front FFBP are initially implemented and FF-PSO was found to be comparatively better than FFBP-ANN predictions when validated against experimental and AIRNET predicted data. In order to overcome the possibility of the local optimization using the steepest descent method (for backpropagation in FFBP-ANN) was replaced by a global optimization (PSO) scheme, which proved to be more effective in predicting the pressure profile in BDS. PSO happens to be a natural algorithm in which optimization happens to be a inherent characteristics. The dry-stack zone comes across a single-phase flow whereas two-phase flow takes place in wet-stack zone leading to a complex flow phenomenon in a BDS. The holistic nature of FF-PSO-ANN has been explored in the present investigation to make it reliable and effective ANN model.44,45
From the investigations, the following conclusions are outlined. • FF-PSO hybrid ANN model performance depends upon the hidden neurons and population size. The performance is found to be optimal when population size is 50 and number of hidden neurons is 24. • The simulations with the FF-PSO-ANN model was found to be satisfactory over the investigated range of discharge flow rates coming from a fixed location. • The FF-PSO-ANN model successfully simulates the pressure response to flow conditions when water is discharged from various floors. • The FF-PSO-ANN model improved the accuracy of the FFBP-ANN model by replacing the steepest descent method with a PSO scheme. This change also reduced the simulation time significantly. • Suitability of the FF-PSO ANN model has been established through its validation and by comparing its performance against both the experimental and AIRNET predicted results. • The pressure profile information for a specific building can also be predicted by using pressure profile data from any number of buildings, this will form the basis of an increasingly accurate and representative model. The model can therefore be trained and enhanced over time which will increase the accuracy of the predicted model.
Footnotes
Acknowledgments
This research was funded by Heriot-Watt University through the James Watt Scholarship Scheme. The authors also acknowledge the assistance of Aliaxis S.A. for the use of National Lift Tower facilities in Northampton, U.K.
Declaration of conflicting interests
The author(s) declared no potential conflicts of interest with respect to the research, authorship, and/or publication of this article.
Funding
The author(s) received no financial support for the research, authorship, and/or publication of this article.