
Abstract
Water trap seal loss can lead to the ingress of foul odours from the sewer network carrying harmful pathogens which can affect the health of building occupants. This loss is due to excessive negative or positive pressures within the system as a consequence of rapidly changing flow due to the unsteady nature of air and water flow discharges from appliances. This pressure regime within the system is often represented by a pressure profile along the height of the main vertical stack in the Building Drainage System (BDS). Experimental data from peer-reviewed literature and data from a unique 34-storey drainage test rig have been used as pressure profile data (Test data) for an Artificial Neural Network (ANN) model. Discharge input height (storey number) and discharge flow rate are considered to be the two independent input parameters and the pressure along the vertical stack is considered to be the output. In this work, both a Feed Forward and Back Propagation (FFBP) ANN model and a Radial Basis Function (RBF) ANN model have been used to train the algorithm. The work has confirmed the applicability of the FFBP-ANN model for steady two-phase fluid flow phenomena in BDS and allows for the prediction of pressures in a system for which no pressure data exists, by the prediction of modelled weights, based only on its physical and flow characteristics.
Practical Application: Of great concern to designers of building drainage systems (BDS) is the control of pressure fluctuations within the system to prevent water trap seal loss. Prediction of a pressure profile based on the characteristics of the building – e.g. height, location of water discharge, discharge flow rate and ventilation type, would therefore increase confidence in designs, particularly in tall buildings. The work presented here addresses, for the first time, the applications of two ANN models for predicting the pressure profile in the BDS vertical stack of multi-storey buildings.
Introduction
The primary objective of the building drainage system is to remove waste from sanitary appliances to the sewage system whilst at the same time, preventing the ingress of foul odours and pathogen-contaminated air which could lead to the spread of disease within buildings as indicated by Gormley et al. 1 These pathogens which are transported through the airstream within the BDS can enter the building through defective water trap seals.2,3 The movement of the fluid flow is unsteady which causes air pressure transients and affects the air pressure regime in the building drainage system (BDS). The unsteady nature of the airflow is due to propagation of the random discharges of flows from different discharge appliances. Discharge flow from sanitary appliances accompanied by the air experiences a shear when there is flow in the vertical stack. 4
Determination of the pressure distribution in the stack follows the classical curve shown in Figure 1. Modelling has proved useful in the field to optimize and improve designs and to reduce costs and carbon footprint of wastewater systems for buildings. Work on water reduction strategies depicts the modelling of free surface flows in drainage pipes5,6 that have led to improvements in understanding drain self-cleansing under water conservation criteria in much the same way that multi-phase flow modelling in high-rise buildings has improved health security amongst occupants.2,3,7 In addition to these models, ANN modelling provides another method to establish important operational information about building drainage.8,9 In close alignment with the study of pressure profiles in BDS, ANN models have been applied to the prediction of pressure drops in horizontal pipes and for numerical calculations of two-phase flow in vertical pipes in other engineering disciplines.
10
ANN modelling has therefore been shown to be a useful predictor of multi-phase flow in a variety of piped network systems and has been chosen to predict pressure profiles in BDS. Classical air pressure distribution profile in vertical stack.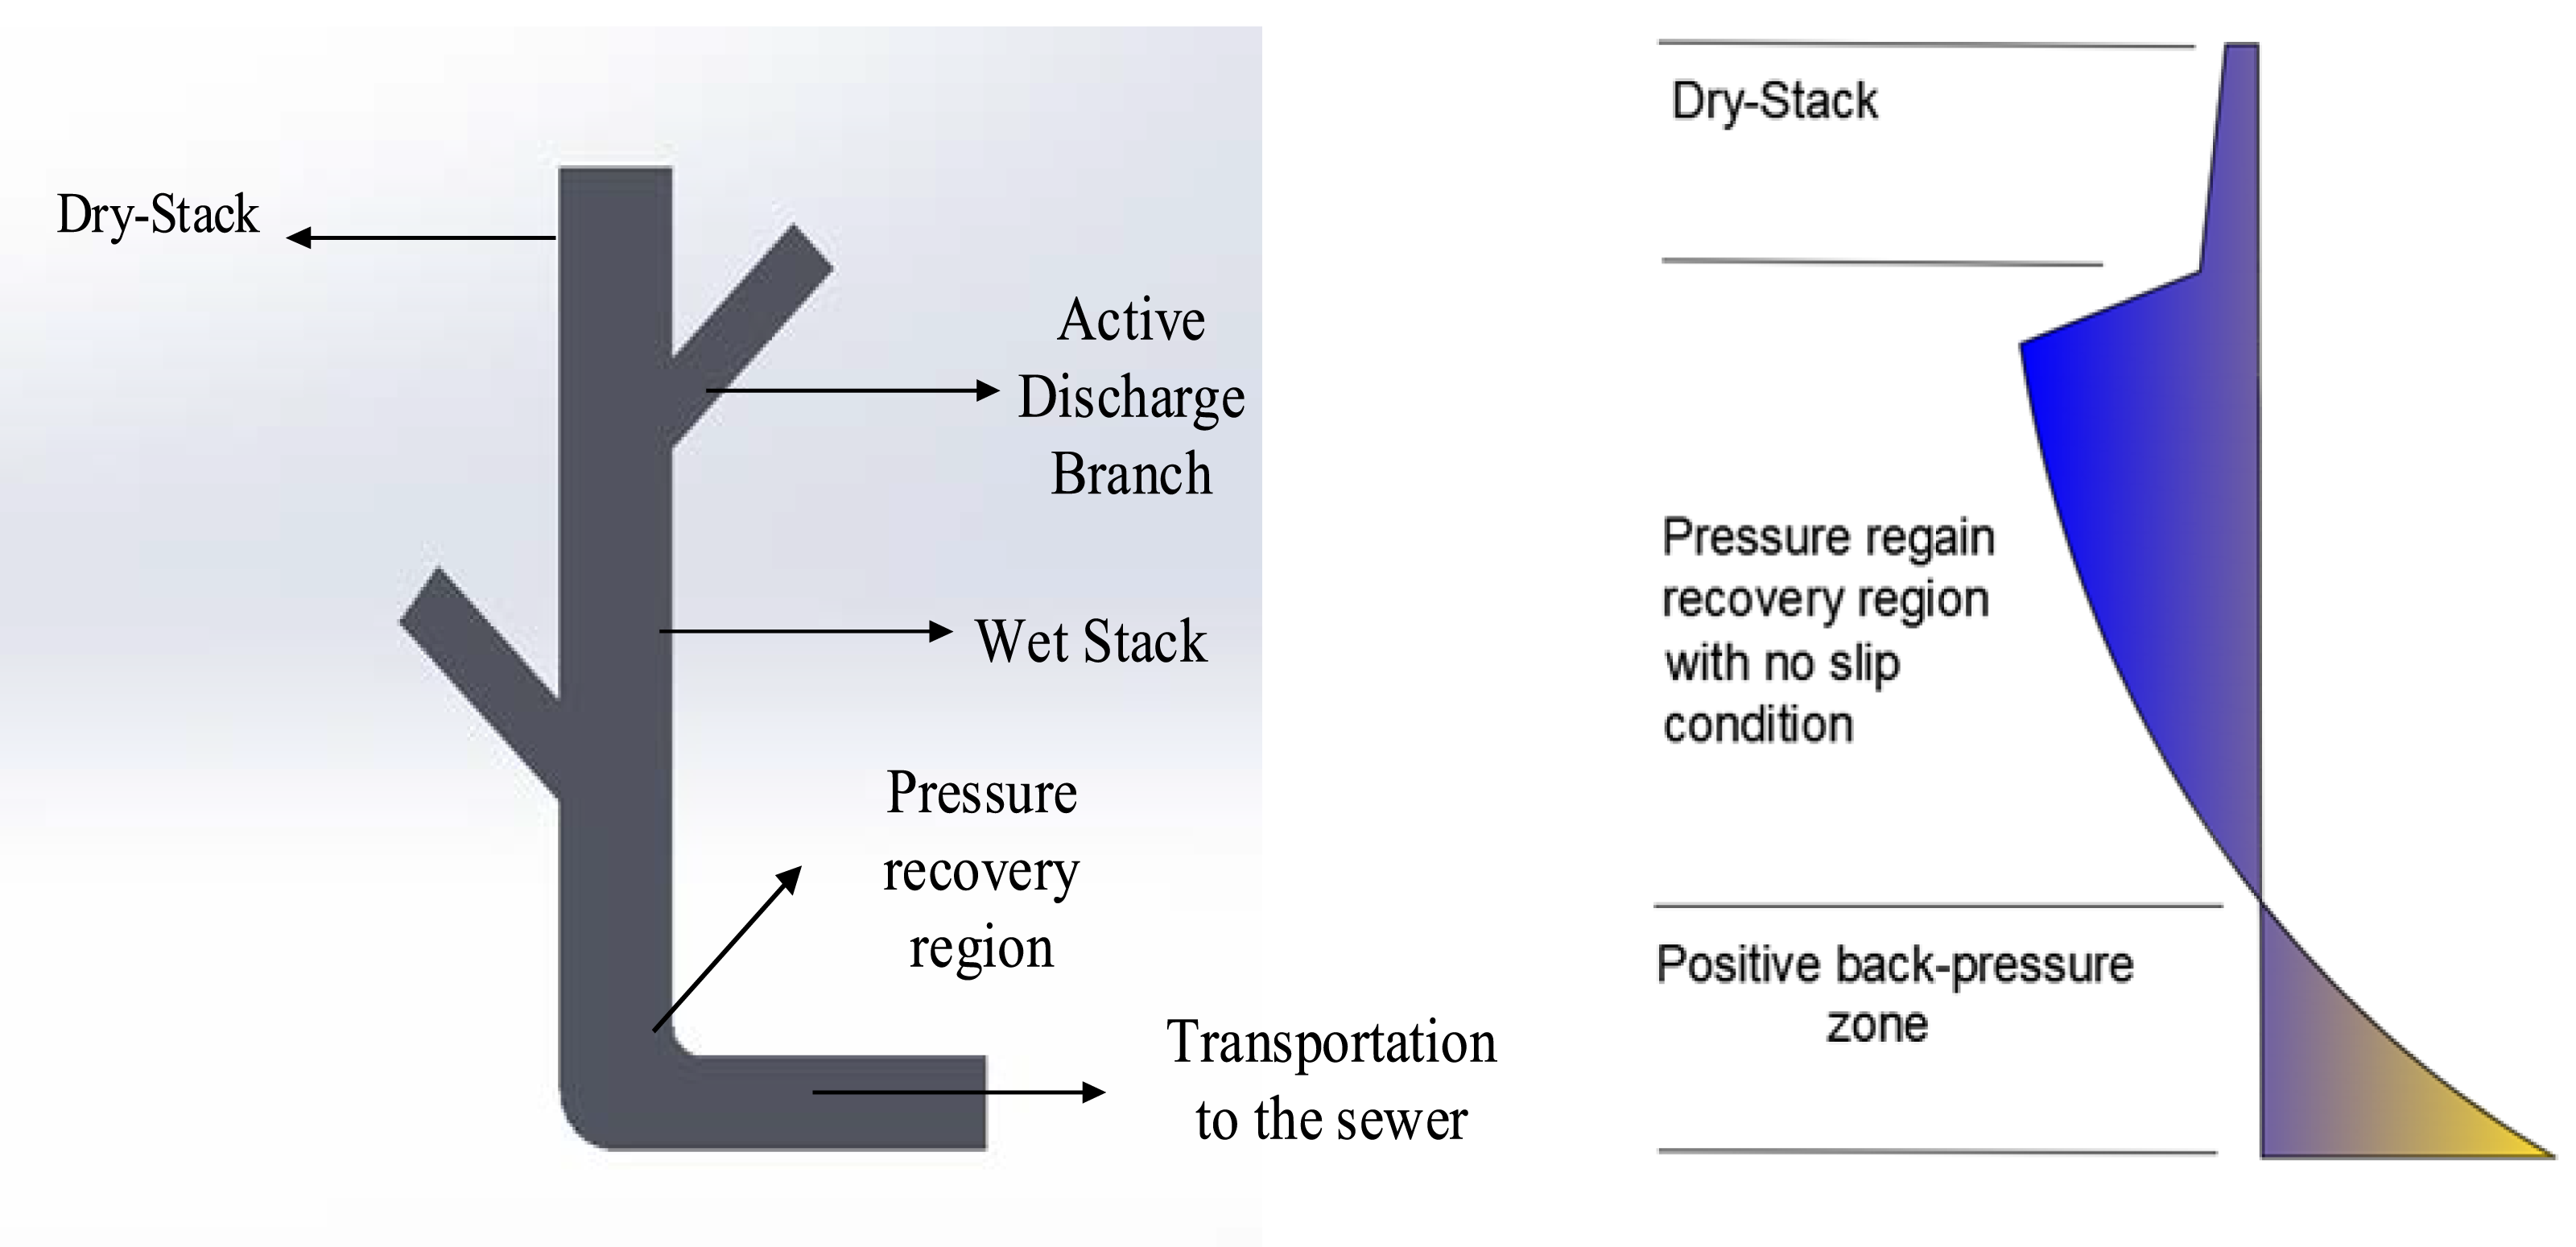
ANN Modelling
An ANN model is a network which can solve the complex patterns of interconnection with the neurons. ANN models work in a parallel manner and also have the capability of transforming network mappings into the object as per Osman and Aggour. 10 ANN models are adaptive in nature and perform specific functions similar to the brain as per Aziz et al. 11 ANN models work well in the flow fields even when combined with another numerical model as per Benning et al. 12 Sablani and Shayya 13 demonstrated that ANN is a model which learns when the iteration is performed and can adapt itself in such a way that does not require the prior information of the parameters used. According to Razak et al. 14 ANN is comprised of elements being connected and works chronologically in a way similar to how the human brain works during the process of training. Milewski and Swirski 15 discussed that ANN is an algorithmic technique which is applicable to simulate experimentally produced data. Even, they also indicated that ANN can adapt to any kind of upcoming situation by using a back-propagation algorithm for the training process. Arriagada et al. 16 explained about ANN is also called a black box model as it can train itself for any situation when the input data is fed into the model and can predict the output of the model.
The topology of the model shown in Figure 2 shows the arrangement of neurons in the input layer (I), hidden layer(H), and output layer(O) that are interconnected through weight vectors and transfer functions. The number of neurons in the input layer(I), hidden layer (H), and output layer(O) are M, N and P respectively. The indices i,j,k represent the position of the neuron present in the input layer i.e. i = 1,2….M), hidden layer (i.e. j = 1,2,….N) and output layer (i.e. k = 1,2…P) respectively. The linear transfer function, tan-Sigmoid transfer function and log-Sigmoid transfer function are considered to be the activation functions at the input layer, hidden layer and output layer respectively. The input and output from a neuron are depicted by ‘I' and ‘O' respectively through the 1st subscript. Topology of FFBP-ANN model.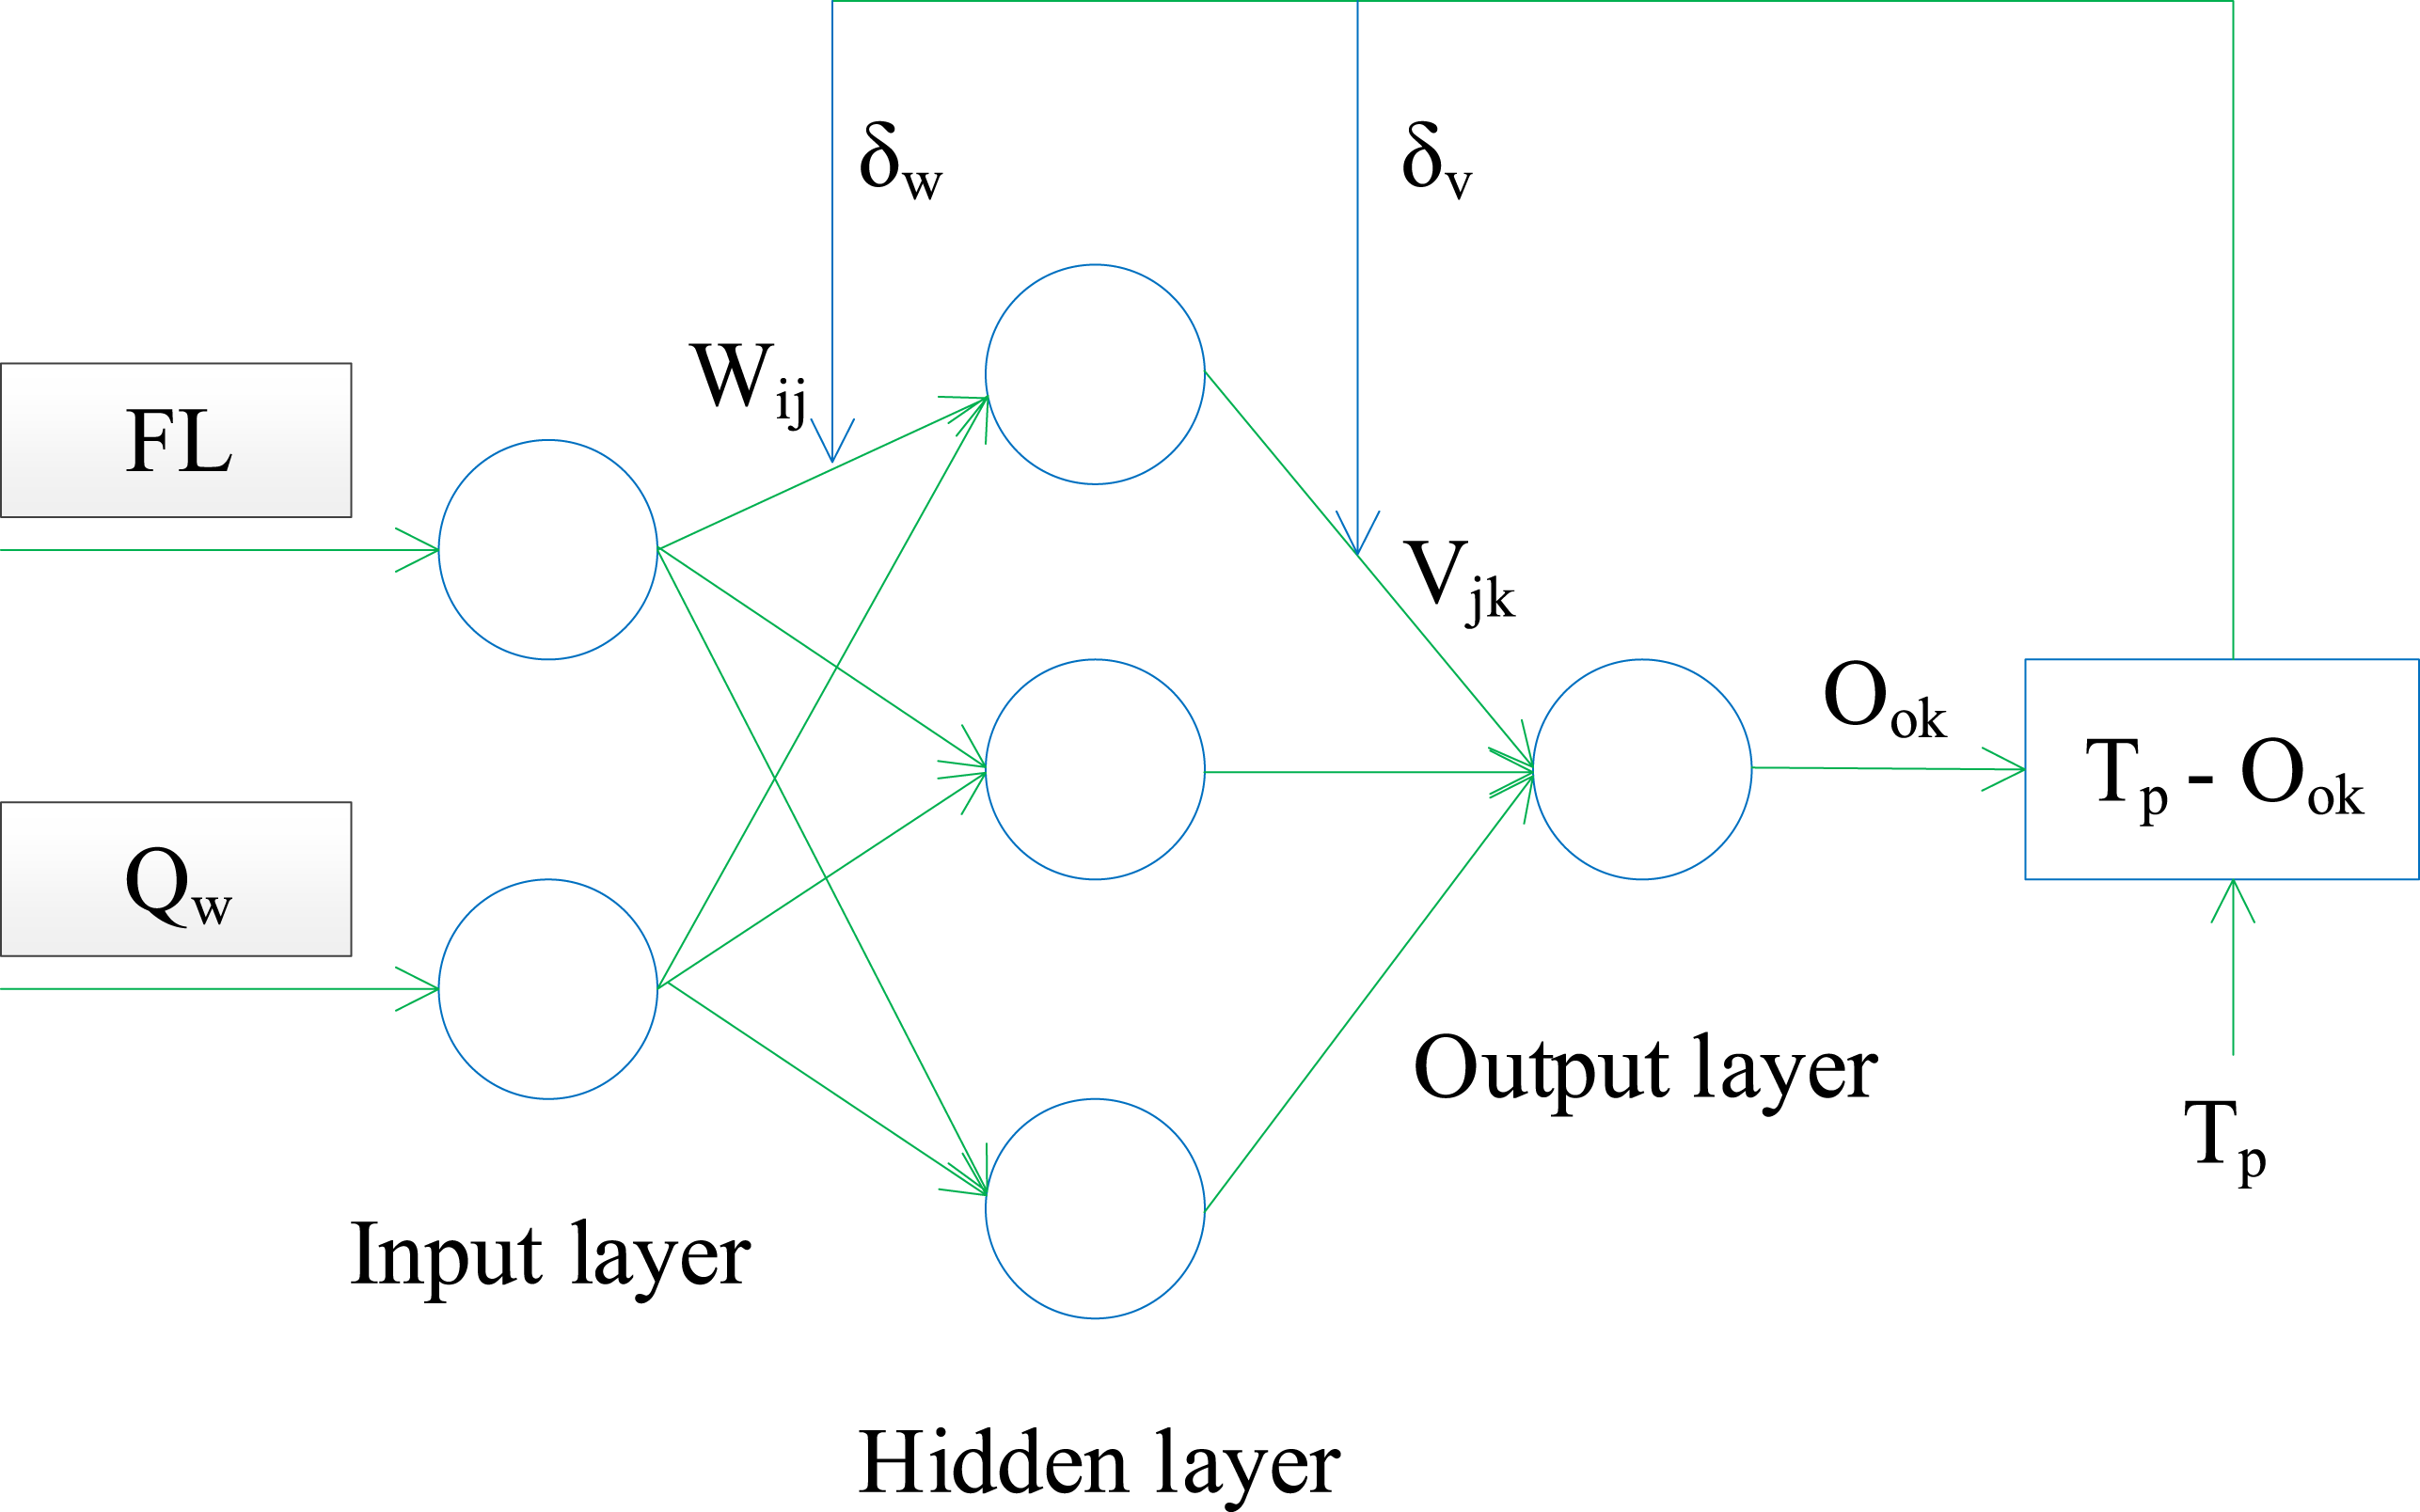
The output from the nth neuron at the input layer (I) considering linear transfer function is represented as

The inputs to the hidden neurons

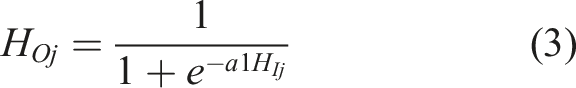
The use of the log-sigmoid function with
The input to the output neuron

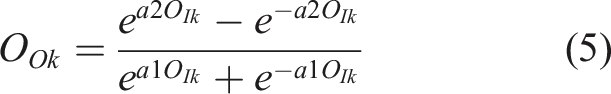
The output from the output neuron uses the tan-sigmoid function with a2 coefficient and is denoted as
As per Bar et al. 17 use of the tan-sigmoid activation function at the hidden layer and the log-sigmoid function at the output layer is preferred.
Pratihar
18
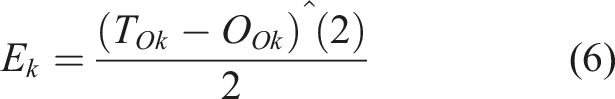
mathematically defined error
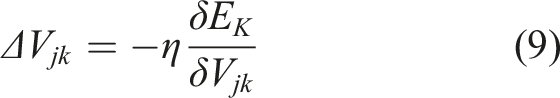
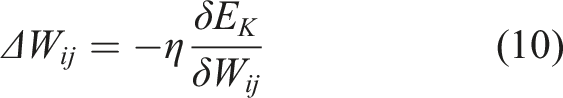
The weight vectors can be updated as


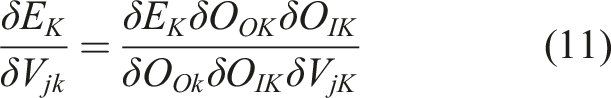
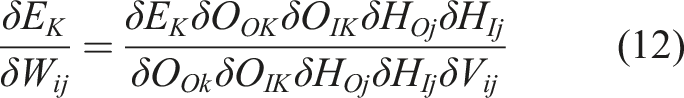
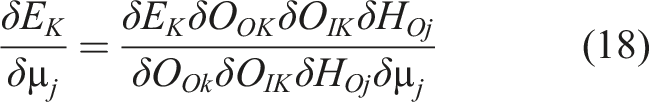
The change in error with respect to the change in weights following the chain rule is
The Radial Basis Function is another kind of ANN model which uses the Gaussian function in the hidden neurons. It is a special type of ANN model which has been used for face recognition, voice modulation and clustering of the data. Liang et al. 19 carried out some of the experiments using the RBF technique inside the two-phase fluid for the investigation of the flow pattern. As the vertical stack of BDS experiences two phase-flow phenomena, RBF has been opted for predicting the flow behaviour.
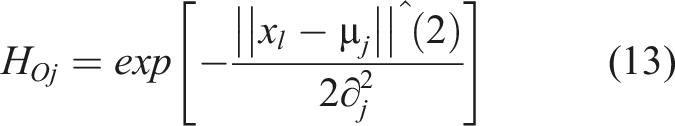
The hidden neurons use the Gaussian transfer function and therefore, the model performance indirectly depends on the mean 'µ' and the standard deviation 'ϭ' of the Gaussian transfer function and the output can be identified as:
The change in t-th iteration during computation for mean and standard deviation can be represented as
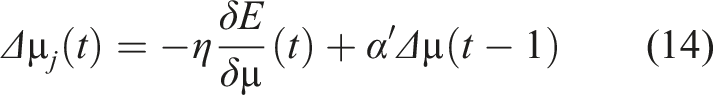
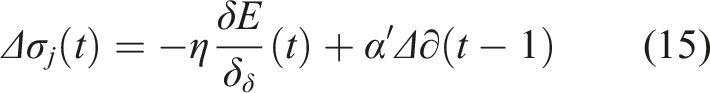
The equations for updating the mean and standard deviation are represented as


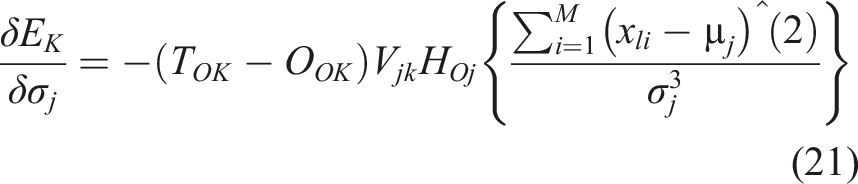
The change in the error with respect to the mean and standard deviation following the chain rule in a similar way in the equations (12) and (13), which are given as
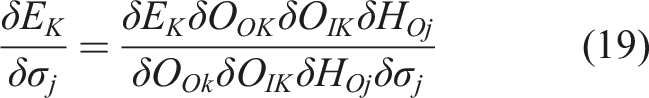
Incorporating these derivatives in Equations (18) and (19), the following equations are deduced.

The above-governing equations have been applied to the building drainage system for calculating the pressure distribution across the building drainage system using two different kinds of ANN models such as the FFBP-ANN model and RBF-ANN model.
Methodology
The objective of this work is to predict the pressure distribution inside a vertical stack of BDS for different discharge flow rates at different locations (i.e. floor height) using ANN models.
The two-phase flow inside a vertical stack is a complex phenomenon, which depends on the flow rate, location of discharge, geometry of the stack and ventilation arrangement. The boundary layer formation depends on the flow surface, flow velocity of water, drag force, buoyancy force, gravity force and surface resistance. Further, the flow becomes transient in a BDS of MSB (Multi-storeyed building) and rarely becomes steady. Therefore, although experimental investigation is costly and time-consuming, it reveals the flow features at the salient locations properly. These data from experimental studies have been used for developing the ANN models. In this paper, an attempt has been made to develop both the FFBP-ANN and RBF-ANN models for addressing two-phase flow inside a vertical stack of BDS of MSB.
The air pressure distribution inside a vertical drainage stack under steady-state conditions with a single discharge point has been determined experimentally by many investigators, 4 however, the data used initially in this research is due to Cheng et al. 20 The performance of FFBP-ANN and RBF-ANN models are tested against the available data of Cheng et al. 20 and their reliability has been established. Subsequently, data being generated from the experimental setup at National Lift Tower (NLT in Northampton) have been employed for validating the consistency of both models.
Considering some of the shortcomings in accuracy and mathematical complexity of the numerical model, 21 the ANN model is opted to solve the complex phenomenon of the two-phase steady flow in the building drainage system. Published experimental data was taken into consideration and trained using two-ANN models (i.e., RBF-ANN model and FFBP-ANN model). FFBP-ANN and RBF-ANN model was trained with a backpropagation algorithm for different data acquired for NLT tower with different configurations. The testing of the model for each algorithm was performed and compared. All data were normalised in the range 0-1. The optimised network is identified by calculating the performance parameters for the network in each case while simulating the existing data with different configurations. After the network is optimised, the optimised FFBP-ANN network is used for NLT data. The weights are updated for FFBP-ANN and RBF-ANN models by minimising the error using the steepest gradient method for different configurations such as varying floor height and constant discharge flow rate and vice-versa. Further, the development of the weight function for predicting the pressure distribution for a different flow rate from a different floor has been attempted using the weight functions obtained using the FFBP-ANN model for different flow rates from other floors. The generalized form of the model that has been developed, is useful for understanding the pressure distribution in BDS of a building, where data are not available.
Experimental set-up
The experimental setup for understanding the flow phenomena inside BDS at the National Lift Tower, Northampton, UK is depicted in Figure 3 describes the single stack system with connections of different sources for discharge at different floors (F4, F5, …., F15) into the main stack. The instrumentation for measuring pressure and flow rate has been provided. The provision of flow control is kept simulating different realistic conditions of BDS in MSB. The schematic diagram is given in Figure 3. Figure 3(a) shows the connections of eight pressure sensors (P1, P2…P8) at different locations to the vertical stack. These eight pressure sensors are attached to the 100 mm diameter pipe. There is provision for both closing and opening of ventilation pipes while conducting experiments which is represented in Figure 3(b). A photograph of the ventilation pipe and valve connection of the NLT tower has also been represented in Figure 3(c). The pressure sensors P1 and P2 are located in the vertical stack in such a way that the pressure sensor P1 is connected at 1 m upstream of the collection tank which is located at 0.0 m and 0.9 m respectively. The pressure sensor P3 is placed just below the T junction of the toilet which is located at 8.2-m height. The pressure sensor P4 is placed 1 m above the toilet is placed i.e., at a height of 10 m. The pressure sensor P5 is located at a height of 0.1 m above the P4. The pressure sensor P6 is at 27.9 m which is also located at just one m above the toilet. Similarly, the pressure sensor P7 is connected above the toilet and just above the T-junction of the toilet. The pressure sensor P8 is situated on the 15th floor, i.e., located just one m above the toilet and just above the T-junction of the toilet. The pressure sensors are maintained in the range of 1 bar. The hot wire anemometer placed at the top of the tower (i.e., at a height of 76.3 m) is used to measure the airflow rate into the vertical stack. Eight pressure sensors (i.e. stainless steel pressure transmitter (P1, P2…P8)) and one hot wire anemometer (i.e. single point multi-range air velocity transmitter-(A1)) used for measuring air flow rate whose range varies from 0 to 8 m/s are provided in the experimental set-up as shown in Figure 3(a). These sensors are connected to the data acquisition system which continuously provides real-time data. This arrangement has been made to record the readings of pressure sensors along the vertical stack for both transient and steady-state conditions. Provision has been made to vary the location and flow rate of discharge. In the present experimental work, two cases of steady flow rates i.e., 1.8 L/s and 1 L/s, have been investigated considering all opened ventilation pipes. The collected data helped in analysing the flow phenomena and further has been used as the target data for ANN modelling. (a)Experimental set-up of NLT (National Lift Tower) (b) Schematic diagram of NLT Tower with ventilation pipe and valve connection(c)Photograph of NLT tower with valve connection and ventilation pipes.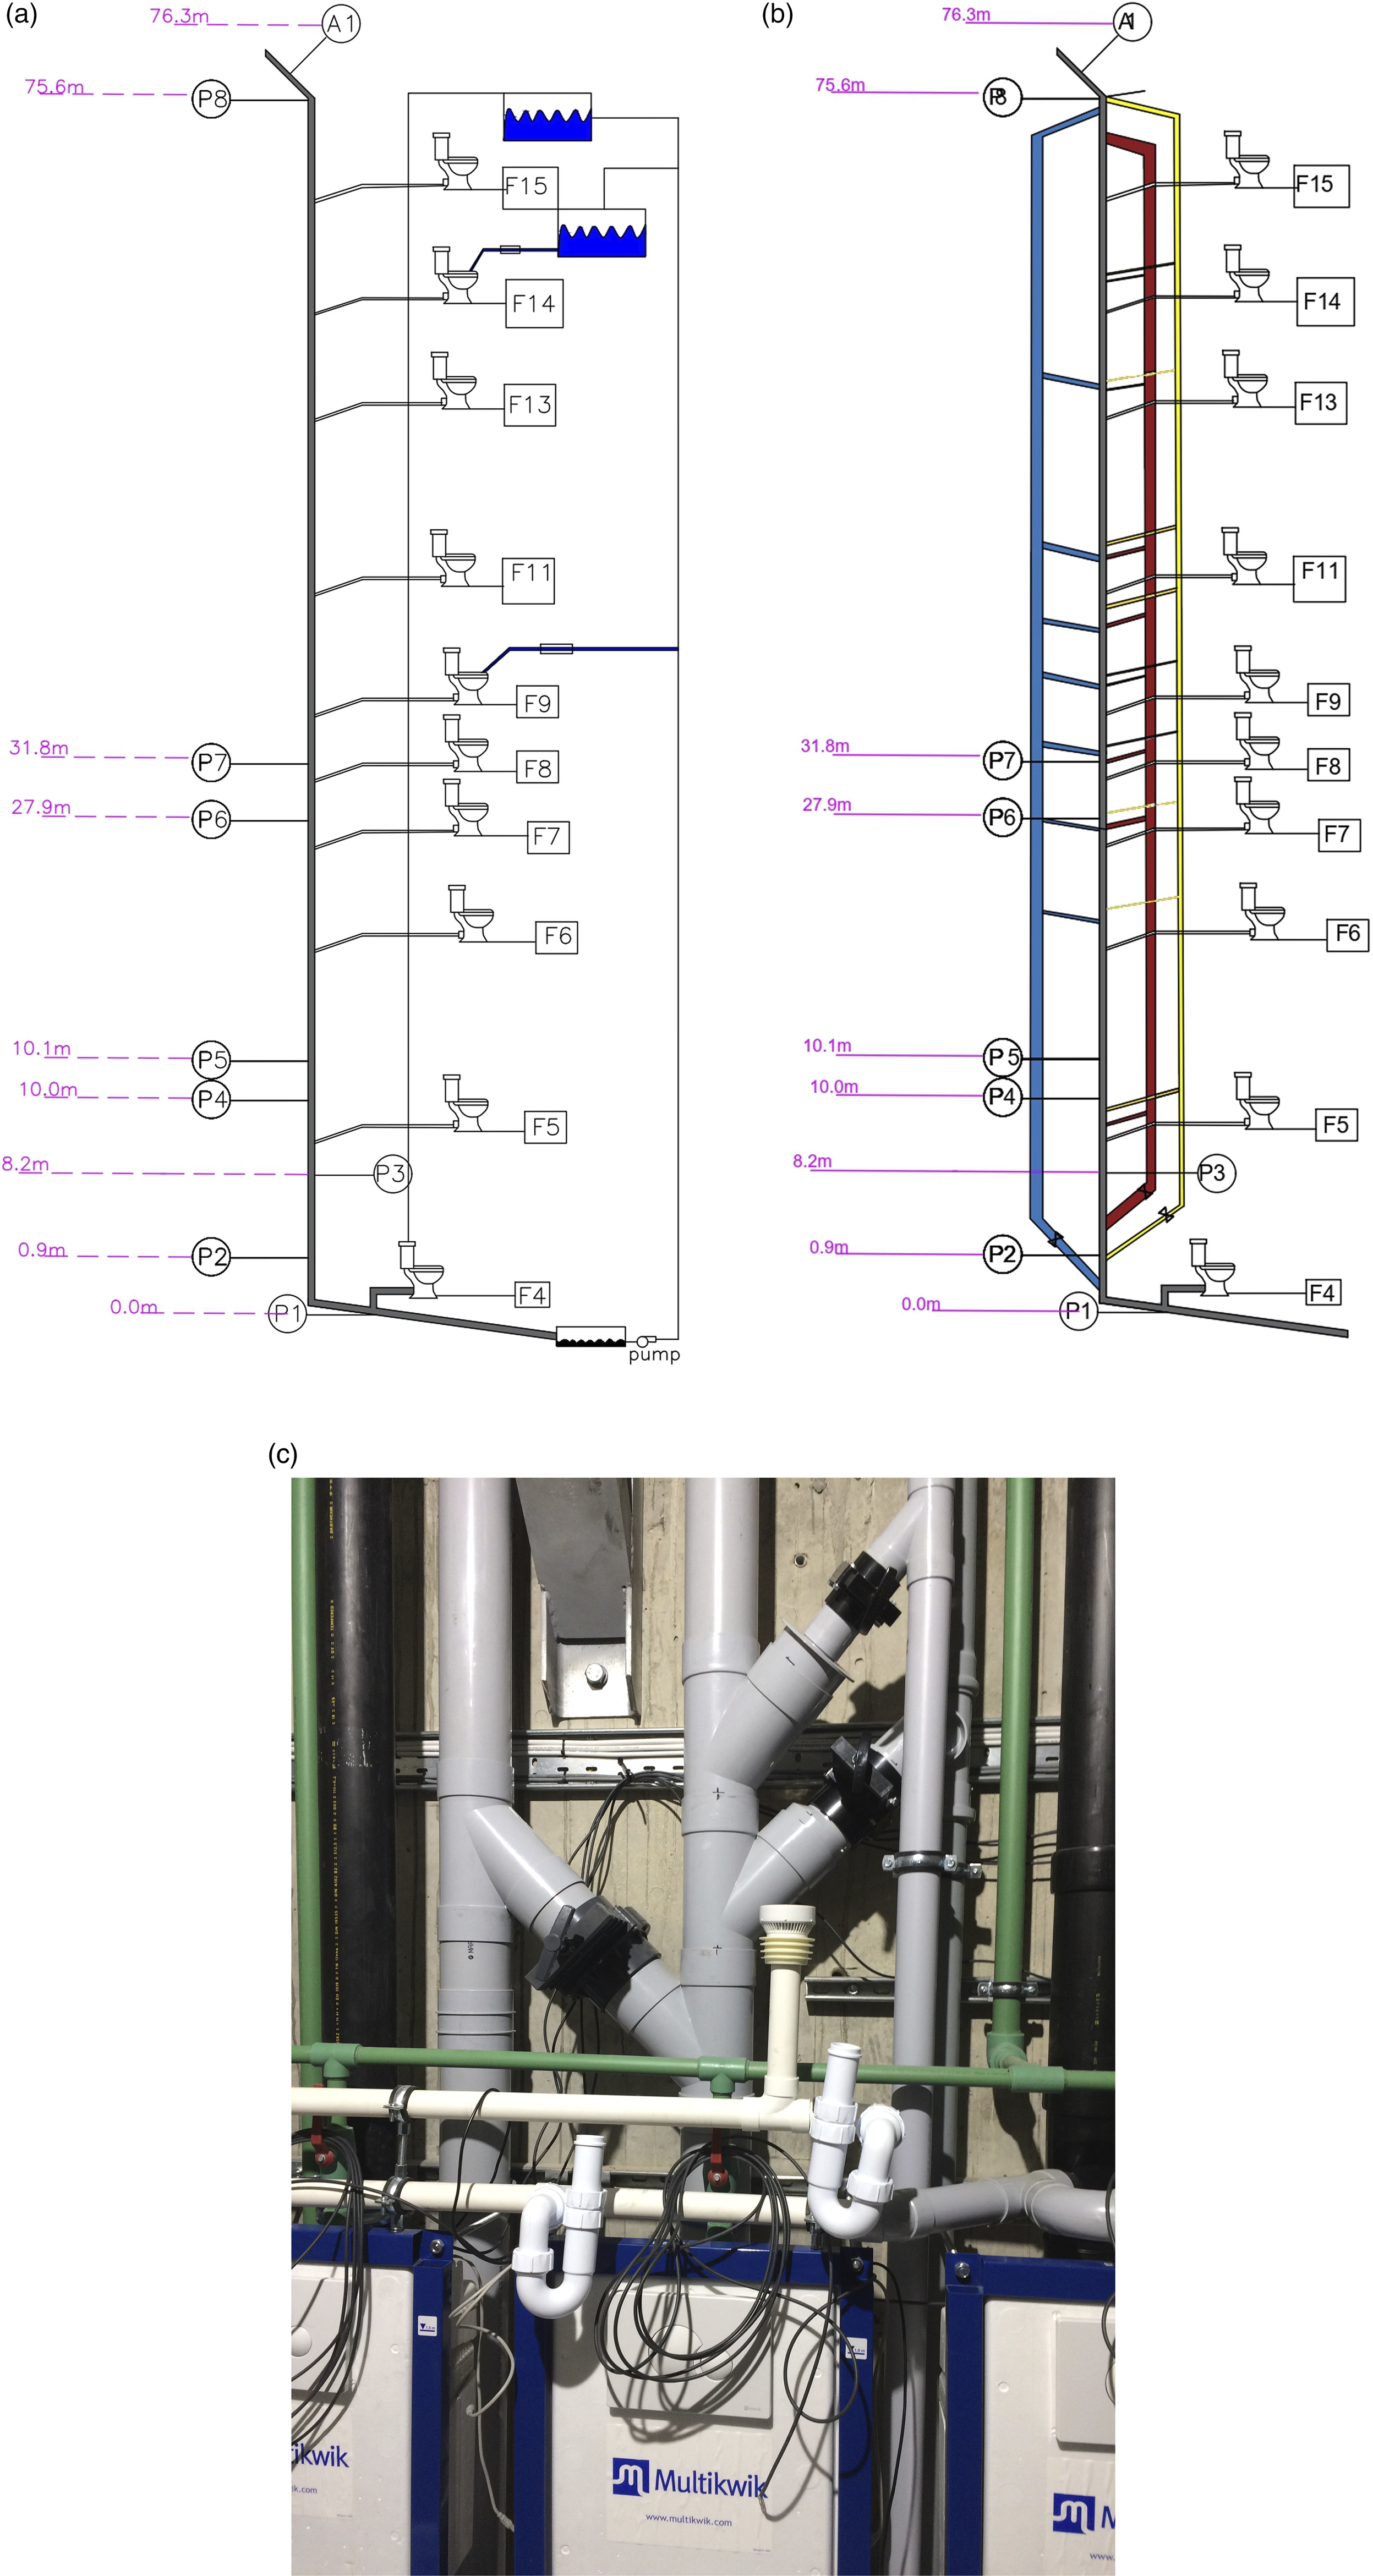
Results and discussion
As indicated in above methodology section, the two models FFBP-ANN model and RBF-ANN model are used to predict pressure distribution along the height of the vertical stack by taking the discharging floor height and discharge flow rate as input parameters. The sample size of 88 satisfies the criteria mentioned by Pratihar
18
and has been used for both the models. The criteria relate the value of training scenarios(L) with network parameters (i.e., weights and bias). As per the criteria, if the value of L is less than the number of the network parameters (i.e., L <
The optimised results are predicted using the FFBP-ANN model and RBF-ANN model for pressure based on varying discharge from a floor height and a discharge flow rate. The optimised results of the network are applied to the Northampton data with similar conditions of discharge flow rate and discharge floor height with the same sample size of 88.
FFBP-ANN model
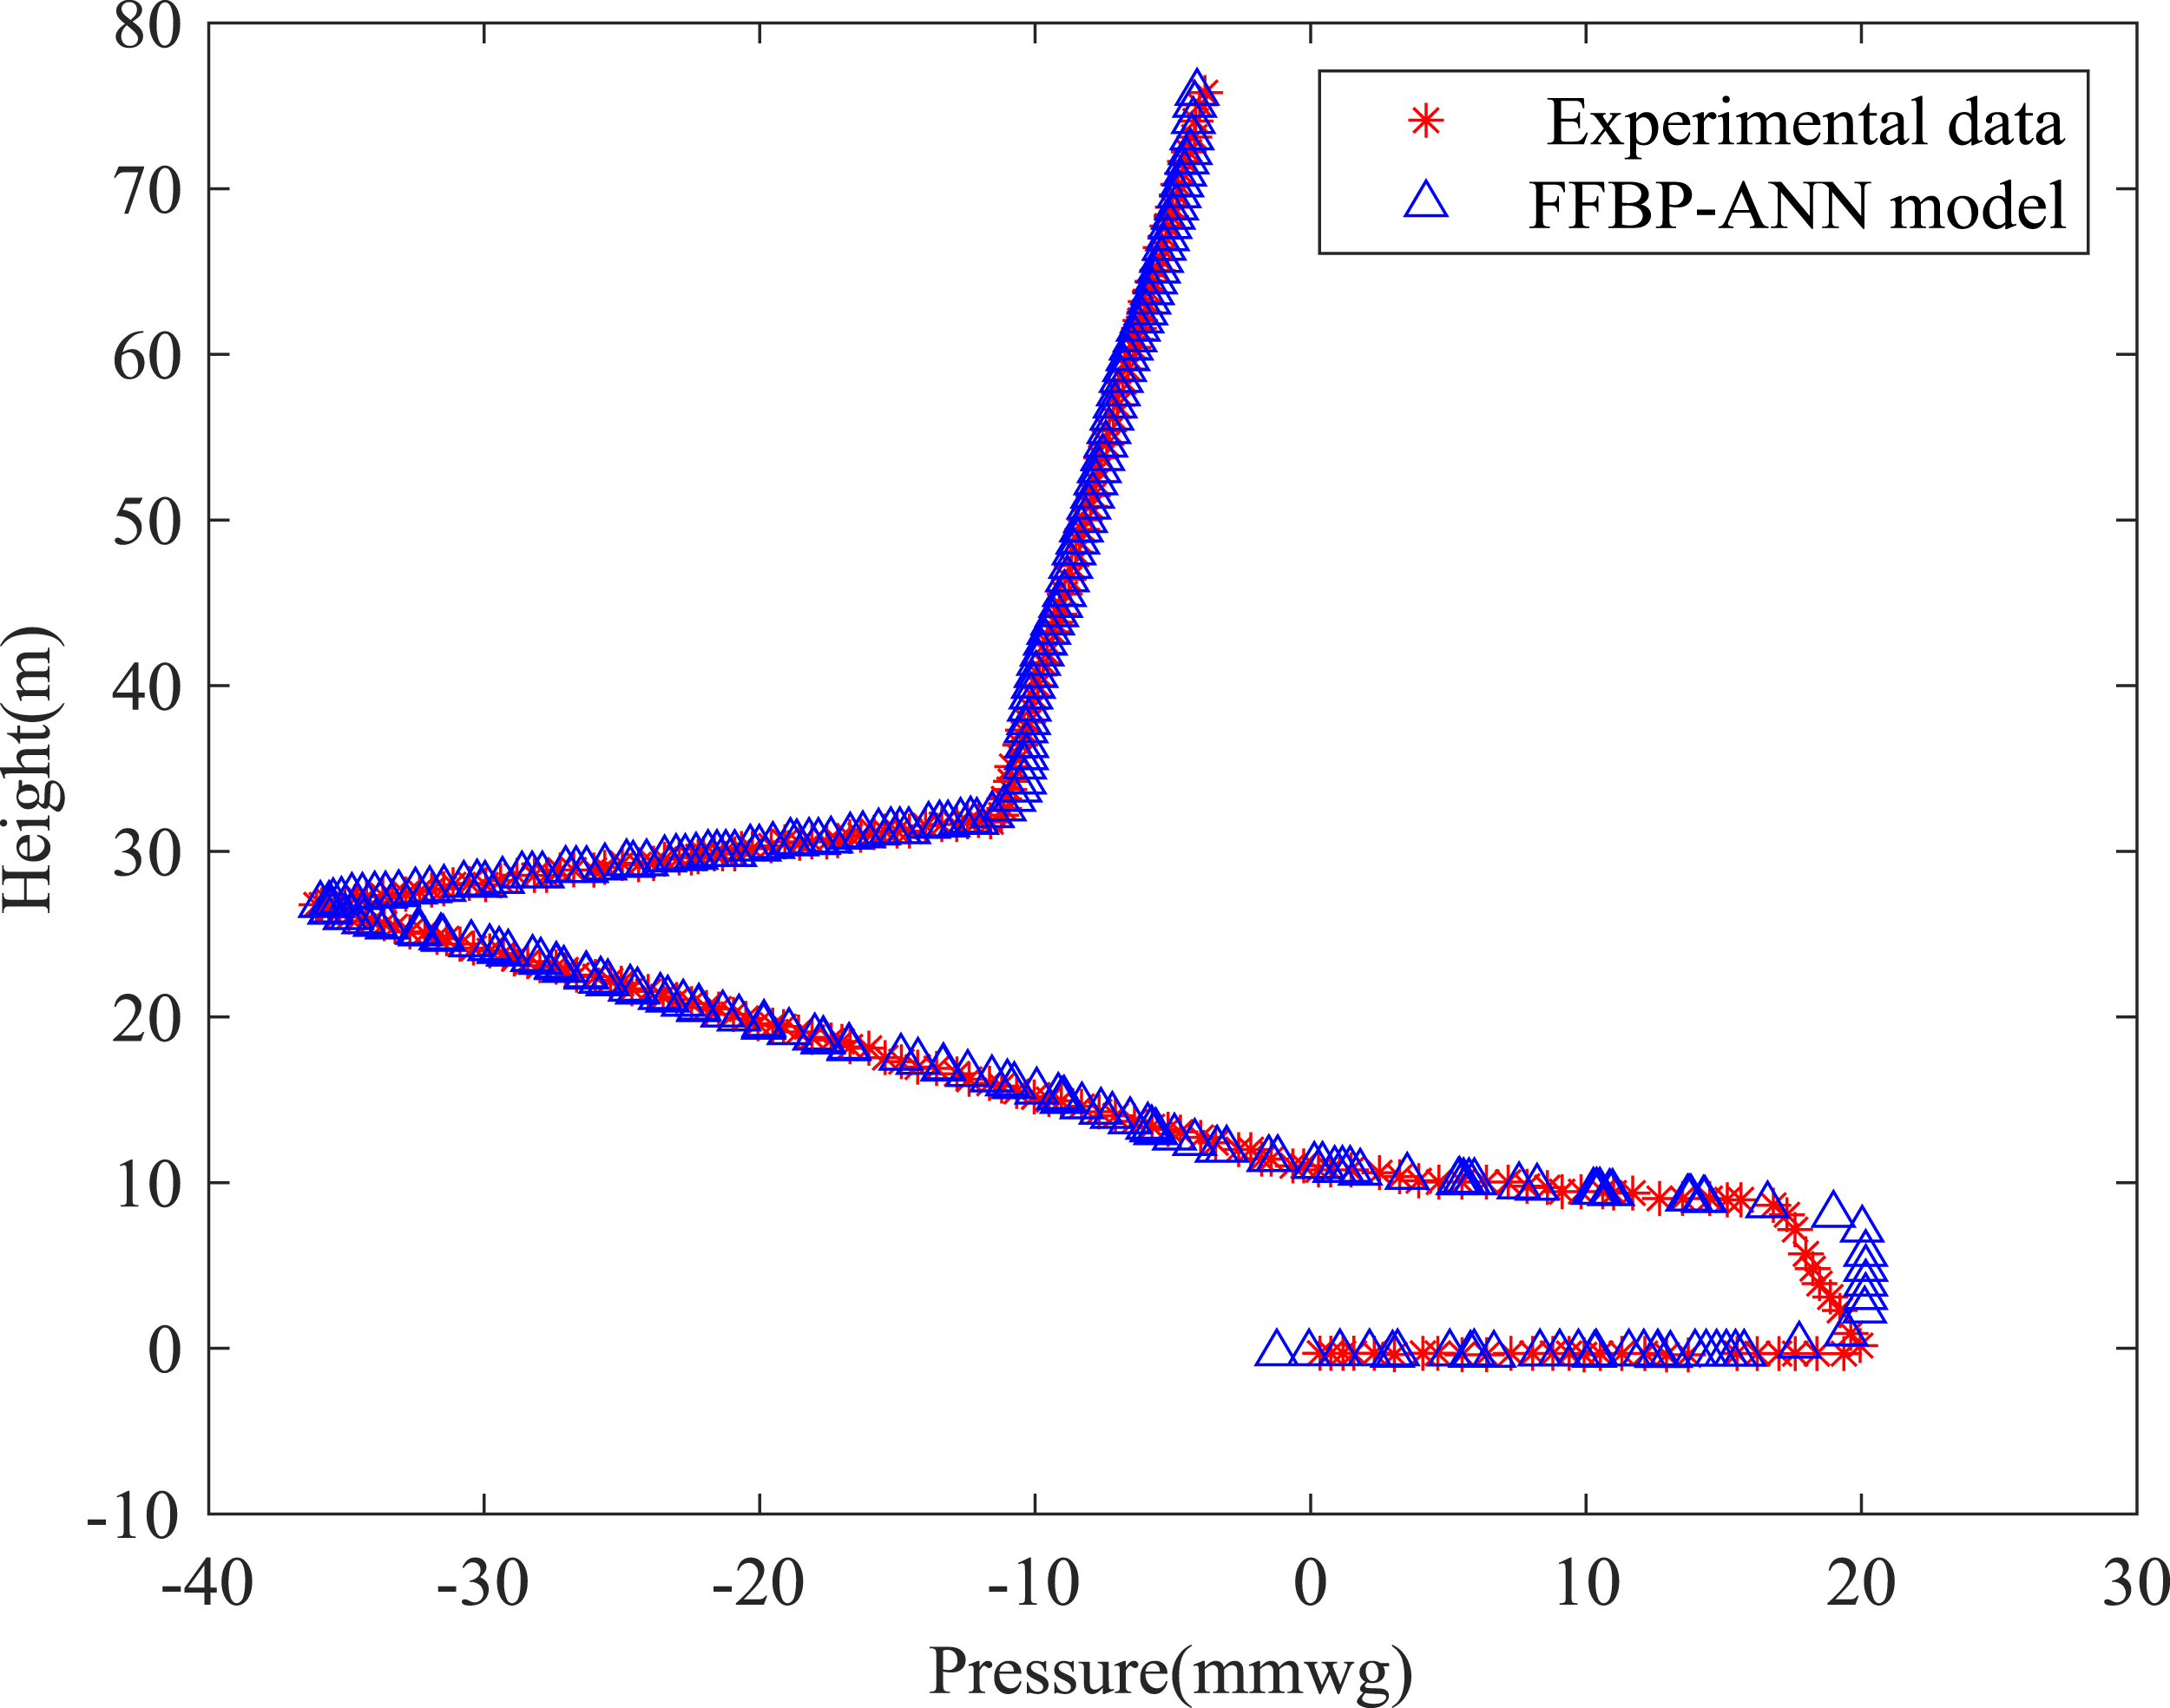
The three-layer FFBP-ANN model considered in the present work includes three transfer functions such as the linear transfer function in the input layer, the tan-sigmoid function in the hidden layer and the log-sigmoid function in the output layer. As per the architecture of the FFBP-ANN model, the performance depends on the transfer functions and the number of hidden neurons. Therefore, simulations are performed by changing the number of hidden neurons from 5 to 24 (i.e., with 6 different neurons; 5,8,10,15,20,24) for constant discharge flow rate and the predicted pressure variation with the height of the stack, as shown in Figure 4(a). (a) Prediction of Pressure varying with height using FFBP-ANN Model (b) Scatter plot for Predicted data versus Experimental data.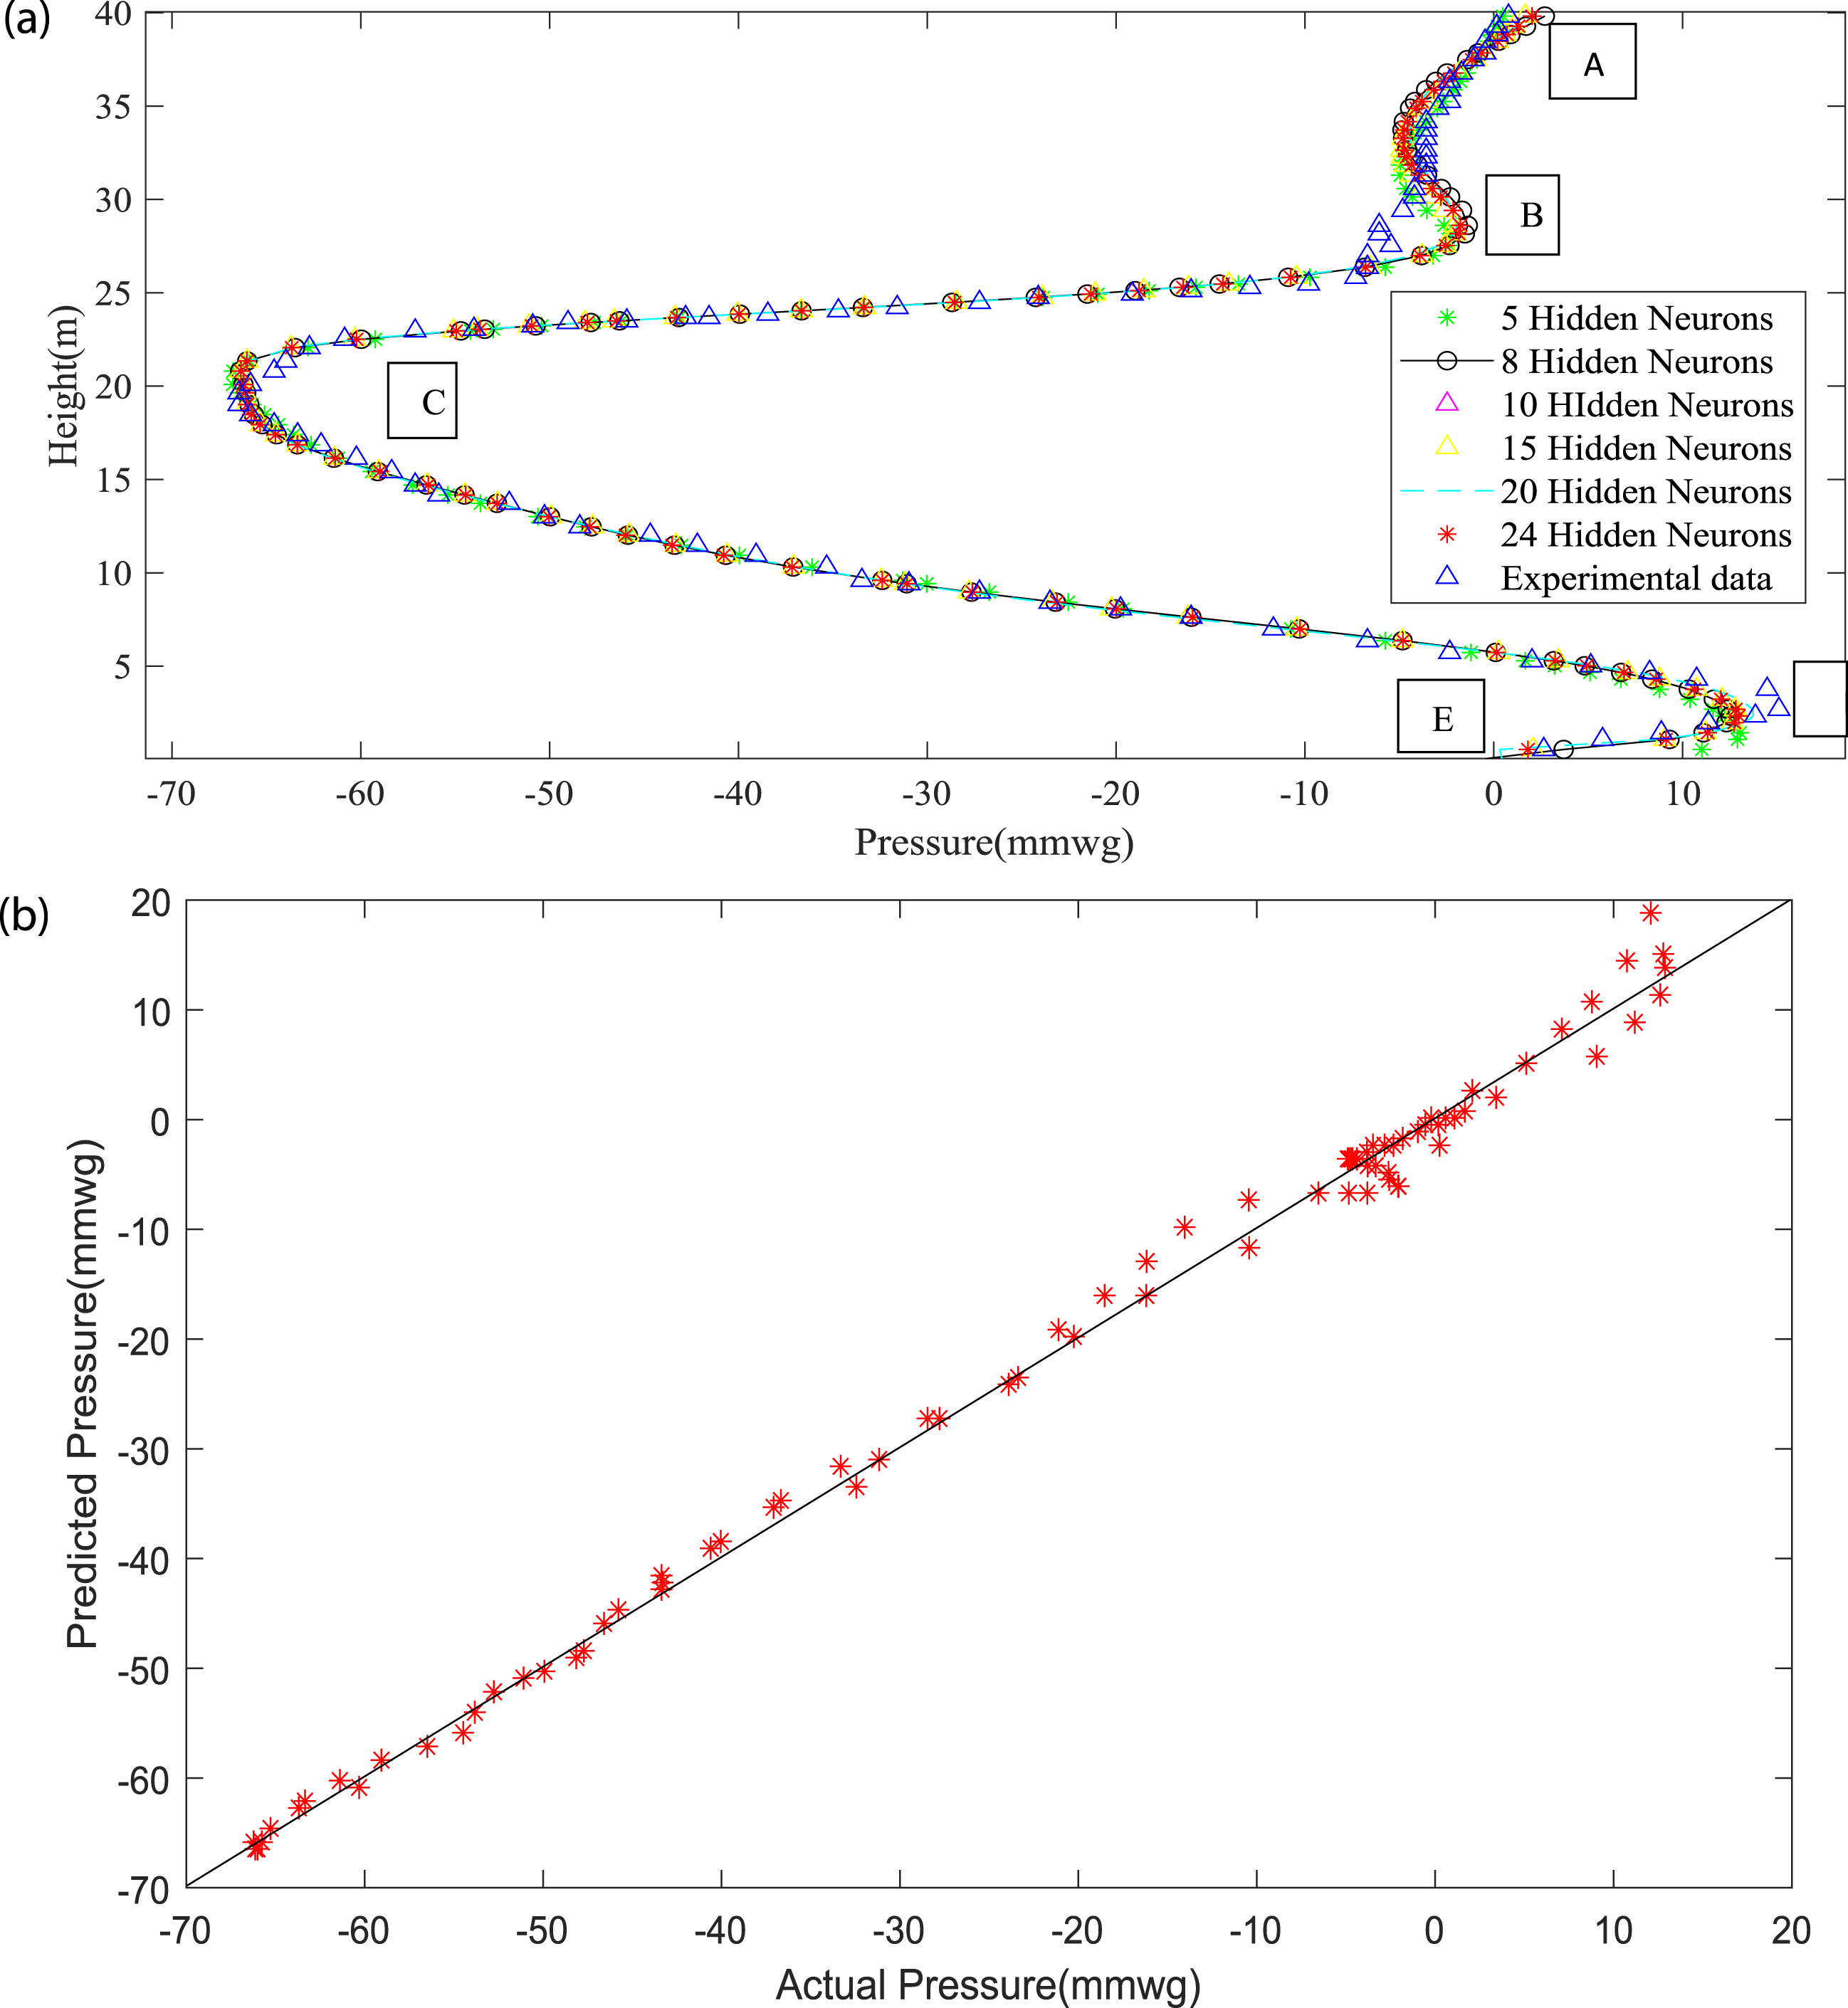
Figure 4(a) shows some variation in predicted pressure compared to experimental data near the discharge location.
As per Cheng et al., 20 the negative peak pressure attained is influenced by the discharge flow rate of the water and the accompanying airflow rate. The prediction from the FFBP model perfectly matches from the entry location of the water discharge up to the attainment of a negative pressure peak. A small deviation with respect to experimental data is observed near the negative peak for all simulations performed (i.e., this is the case for all 6 configurations of hidden neuron numbers. Further, almost negligible deviation in prediction is observed when the airflow reaches a positive pressure gradient with down-flowing water.
Performance Table of FFBP-ANN Model with varying hidden Neurons.
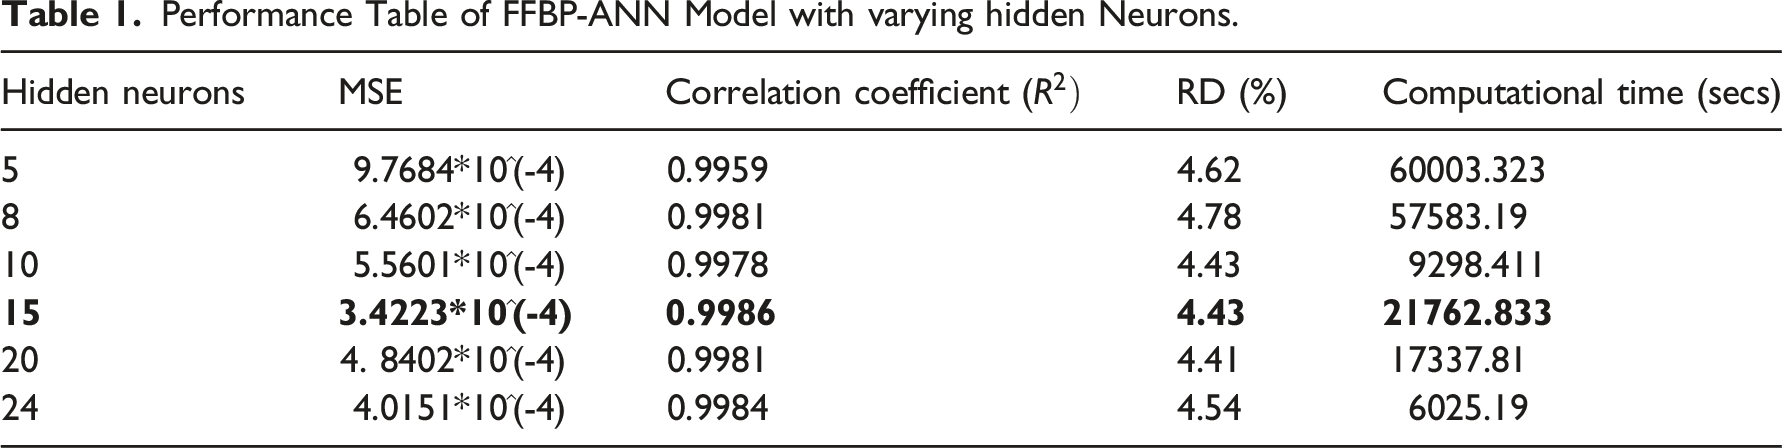
From Table 1, it is observed that the MSE value decreases with an increasing number of hidden neurons and reaches a minimum value at n = 15. Further rise in the number of hidden neurons increases the MSE. On the other hand, the correlation coefficient attains its maximum value at n = 15. The computational time does not follow any trend with the variation of the hidden neurons. In the case of 15 hidden neurons, as the MSE value becomes minimum and the correlation coefficient becomes maximum, the performance of FFBP-ANN with 15 hidden neurons is considered to be the optimal network.
Furthermore, the predicted data from the FFBP-ANN model with 15 hidden neurons is plotted against the targeted experimental data through the scatter plot (Figure 4(b)). The scatter plot reveals that the predicted data and experimental data follow a linear relation as expected. Deviation from the straight-line relationship is observed and found to be minor. This relationship authenticates the reliable performance of the FFBP-ANN model.
RBF-ANN model
The architecture of the RBF-ANN model consists of three layers, which include the input layer, hidden layer and output layer along with transfer functions. The algorithm of the model has already been elaborated in the previous section. The performance of the RBF-ANN model has been indicated in the following section to establish its reliability.
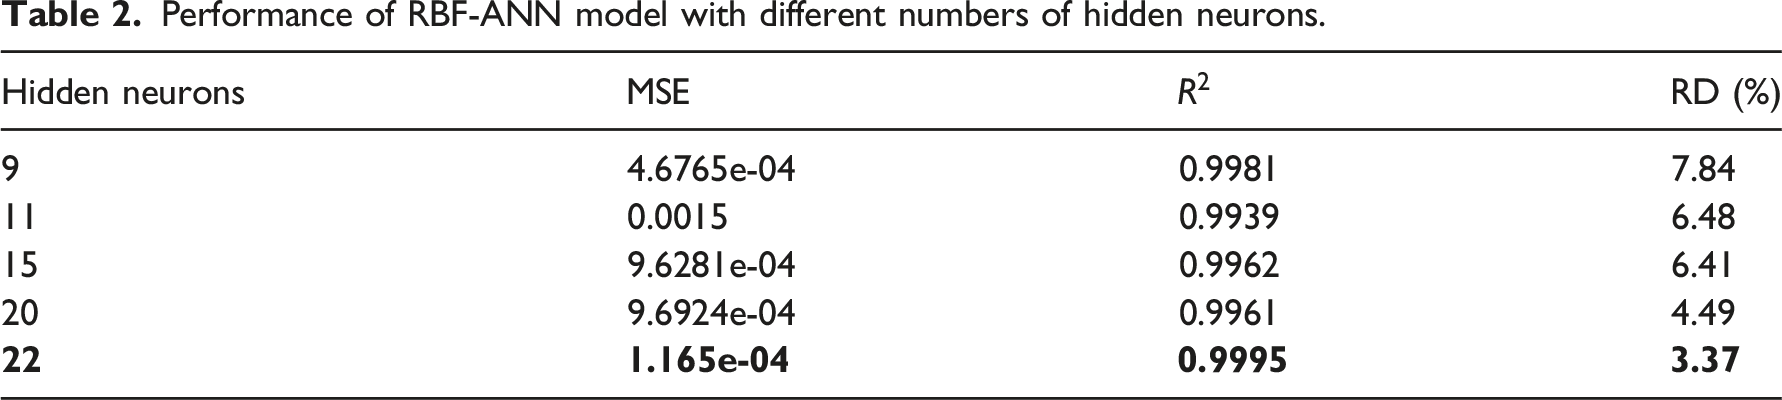
Figure 5(a). Demonstrates the prediction of pressure variation with the height using the RBF-ANN model with the varying hidden neurons. The simulations are conducted with varying hidden neurons for the discharge from the 9th floor with a flow rate of 4 L/s. Five cases with varying the number of hidden neurons such as 9, 11, 15, 20, and 22 are considered. The above figure shows that the predicted data with 9 hidden neurons and 15 hidden neurons, perfectly match with experimental data, in both the dry stack and wet stack zone. Whereas, the simulations with hidden neurons of 11, 20 and 22 reveal that deviations in the predicted pressure in the dry stack zone cannot be neglected. In this zone, the RBF-ANN model predicts perfectly for all cases of hidden neurons except the case of n = 20. A two-phase flow phenomenon is observed in the wet stack, with attendant friction and traction components between water and air, whereas the dry stack is subject to pressure losses due to pipe friction only. This sets up two distinguishable zones of flow within the whole system, the solution to which produces different predictive results as evidenced by Figure 5(a). The location at which flow discharge enters into the main stack experiences a sudden jump with regard to fluid properties and flow features. Therefore, the prediction from the ANN model is subjected to deviation in the dry-stack zone as it handles different patterns of data whereas it simulates perfectly for the wet-stack zone. Table 2 depicts the performance indicators such as RSME, (a) Prediction of Pressure varying with height using RBF-ANN Model (b) Scatter plot for Predicted data versus Experimental data. Performance of RBF-ANN model with different numbers of hidden neurons.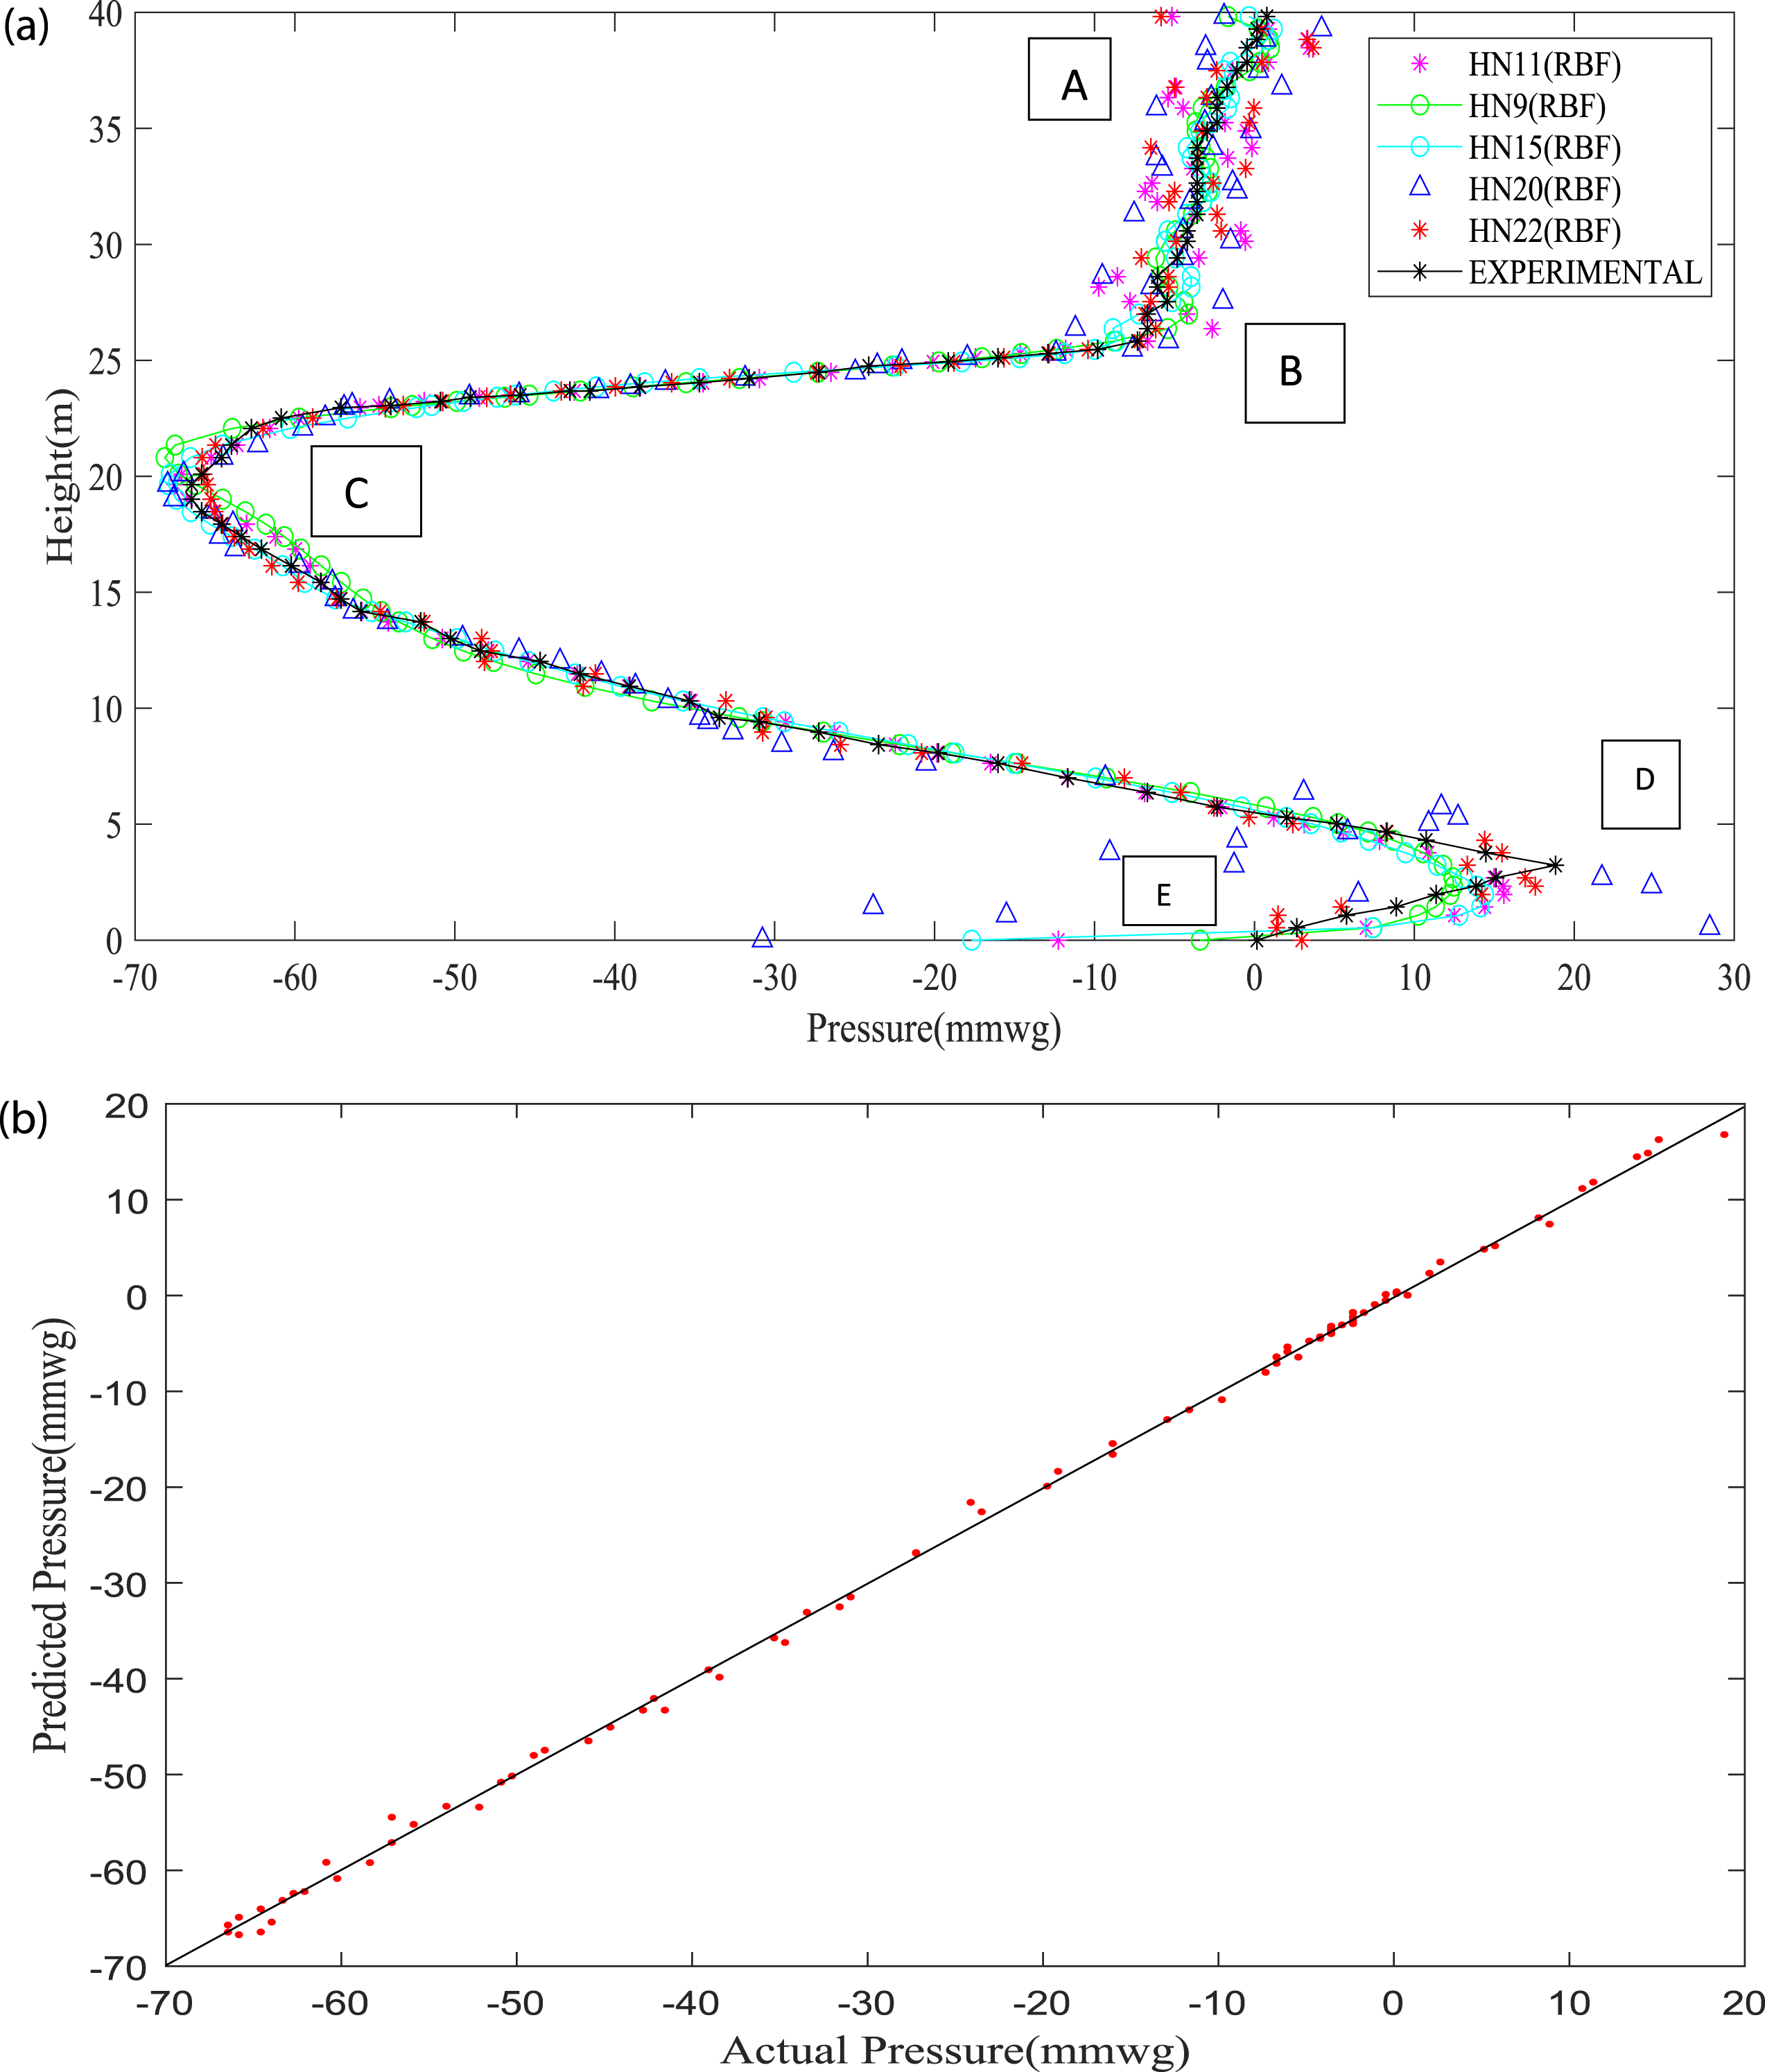
After identifying the optimal performances of both the models with an appropriate number of neurons in the hidden layer, the predictions of these models are compared in both the dry stack and wet stack zones and their reliability has been established through validation. The data of the experimental work (i.e., pressure variation with height) for a BDS in MSB with a discharge flow rate of 4 L/s from the 9th floor, has been used to train and test both FFBP-ANN and RBF-ANN models. The predicted pressure profiles from both these models are compared with the available experimental data of Cheng et al.
20
for validating these ANN models. For comparison purpose, different zones of the dry-stack and wet-stack region, being identified by them has been referred to for convenience. From Figure 6, some deviation is observed in the dry stack portion of the vertical stack. In this zone, the predicated pressure distribution from the RBF-ANN model shows more closeness to the experimental data when compared with data predicted from the FFBP-ANN model. Both the FFBP and RBF models show almost no deviation for the two-phase region starting from the entry of the discharge till reaching the negative peak (i.e., in zone B-C). A small deviation is noticed with the predicted data from the FFBP-ANN model in the zone D-E compared to the RBF-ANN model. Thus, the pressure predictions from both FFBP-ANN and RBF-ANN models are acceptable and the models can suitably be used. Prediction of the pressure variation with height using FFBP and RBF ANN model and its validation against experimental data.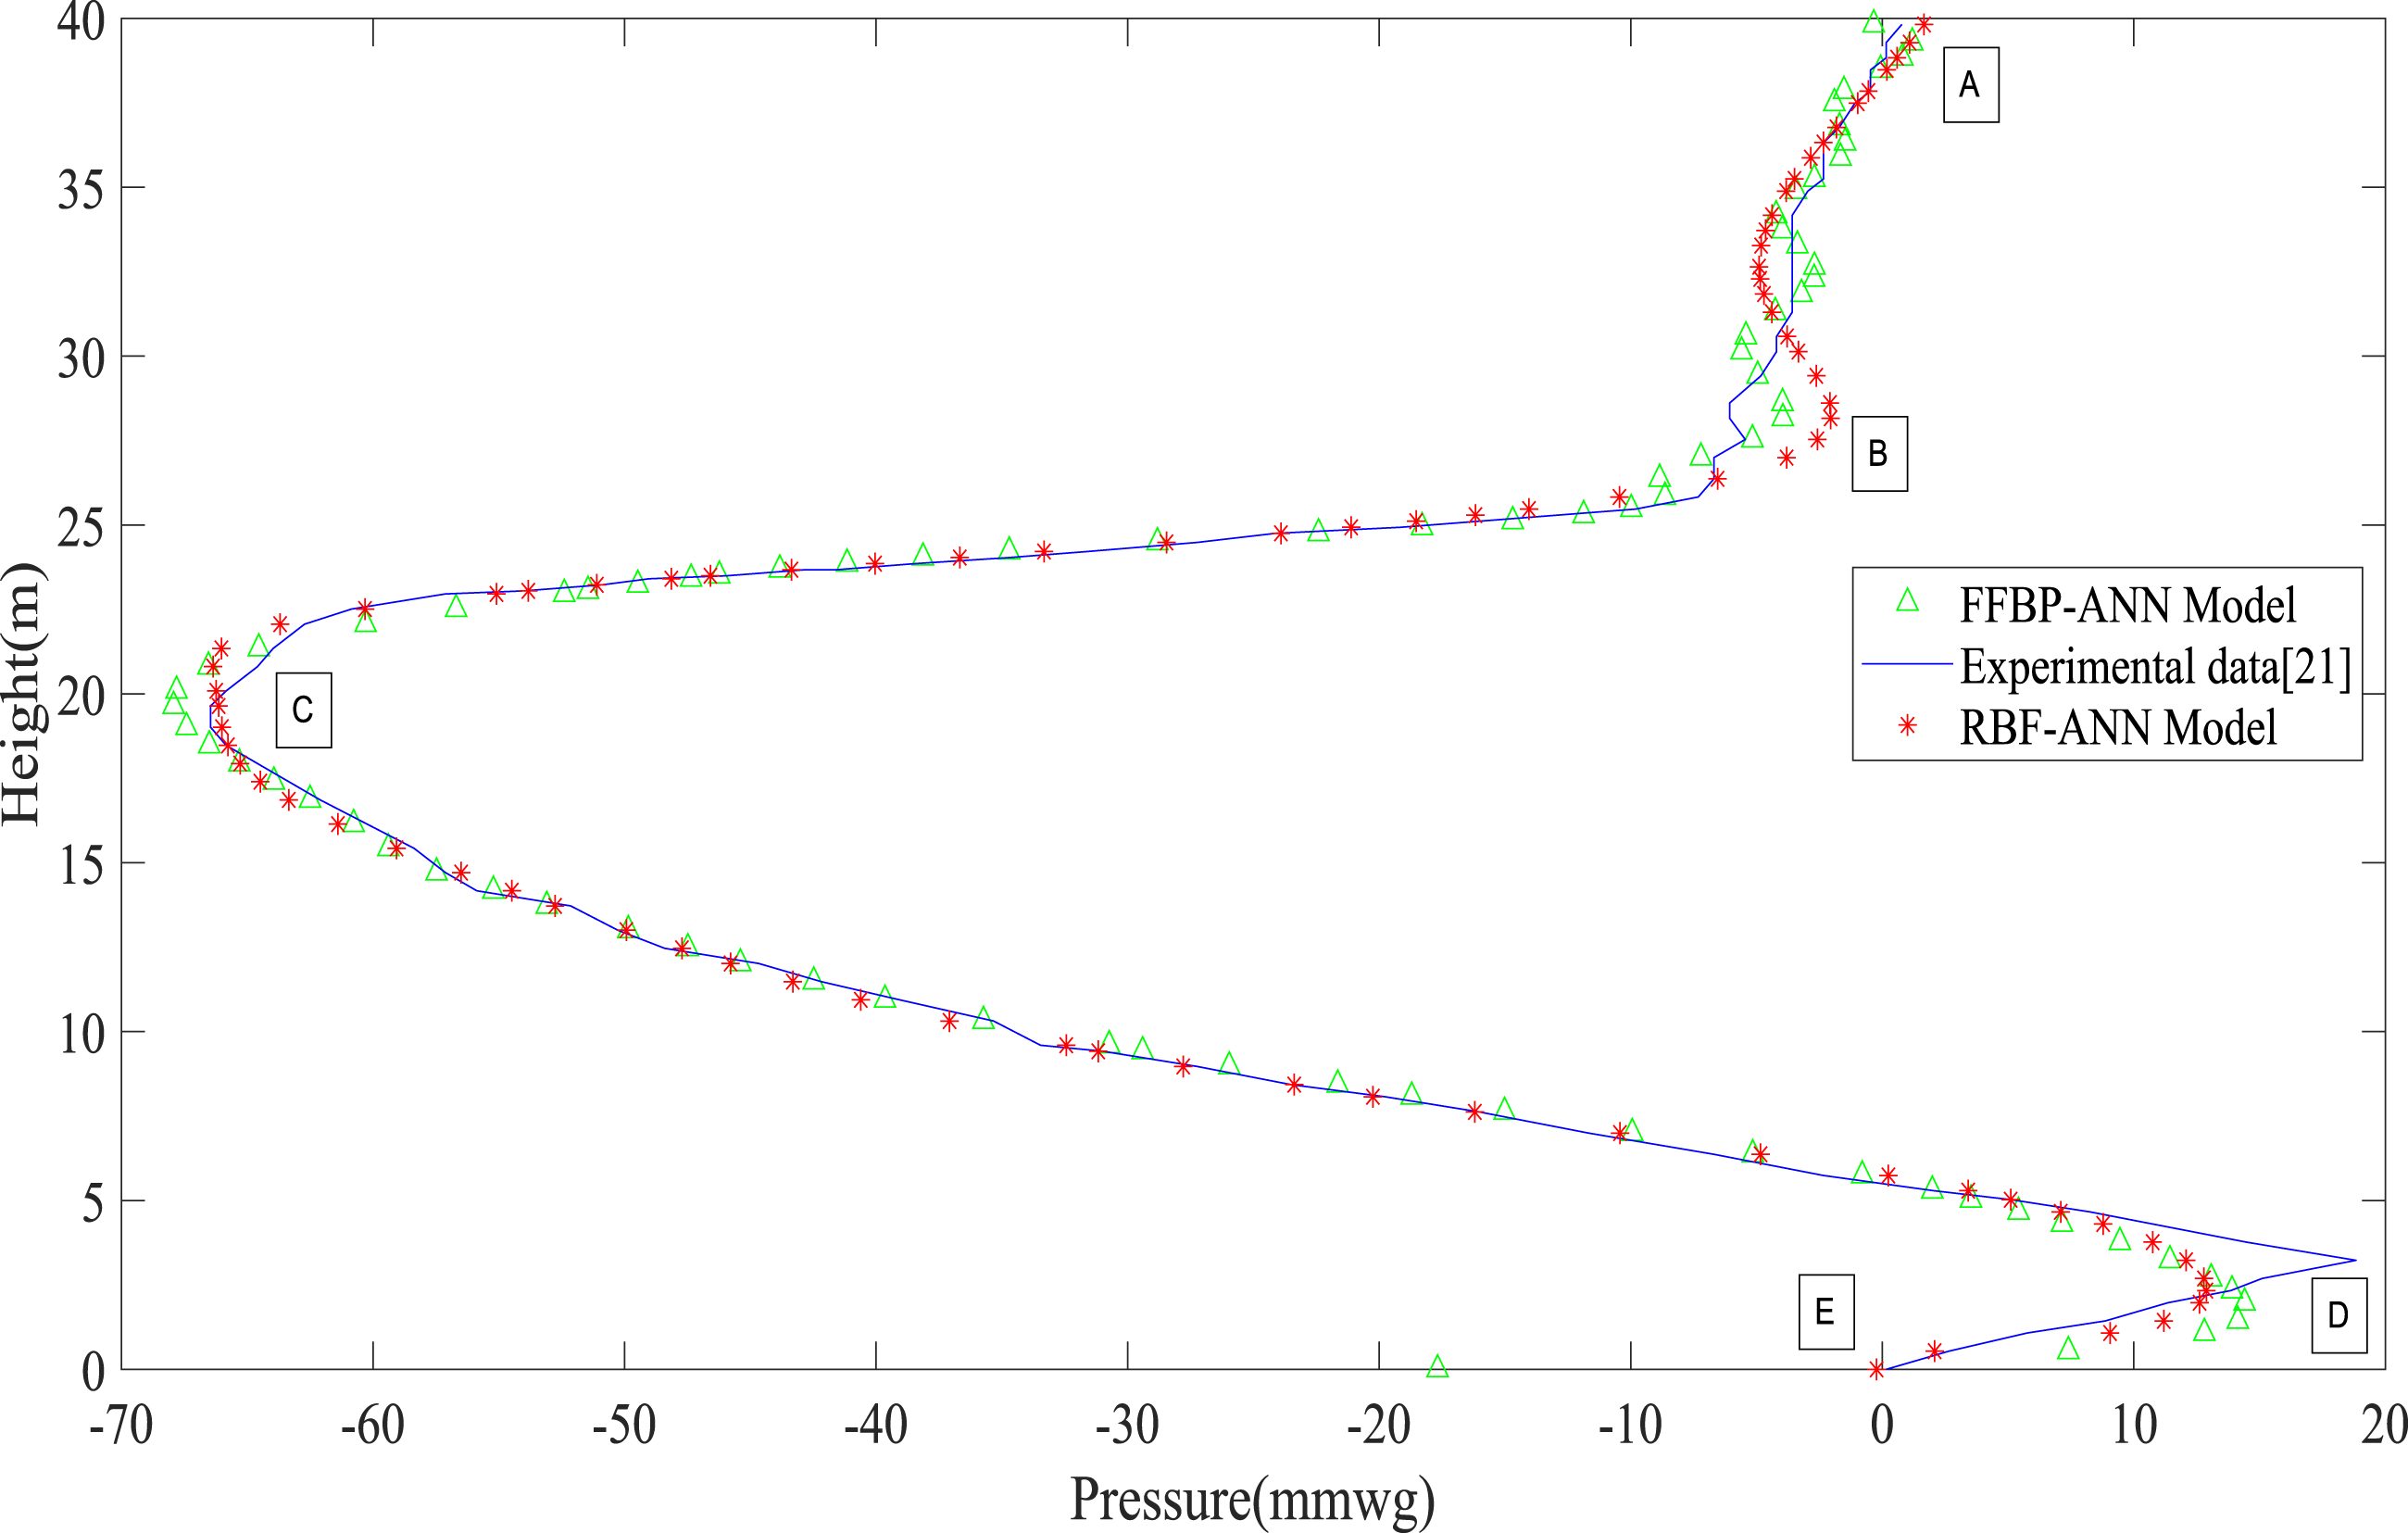
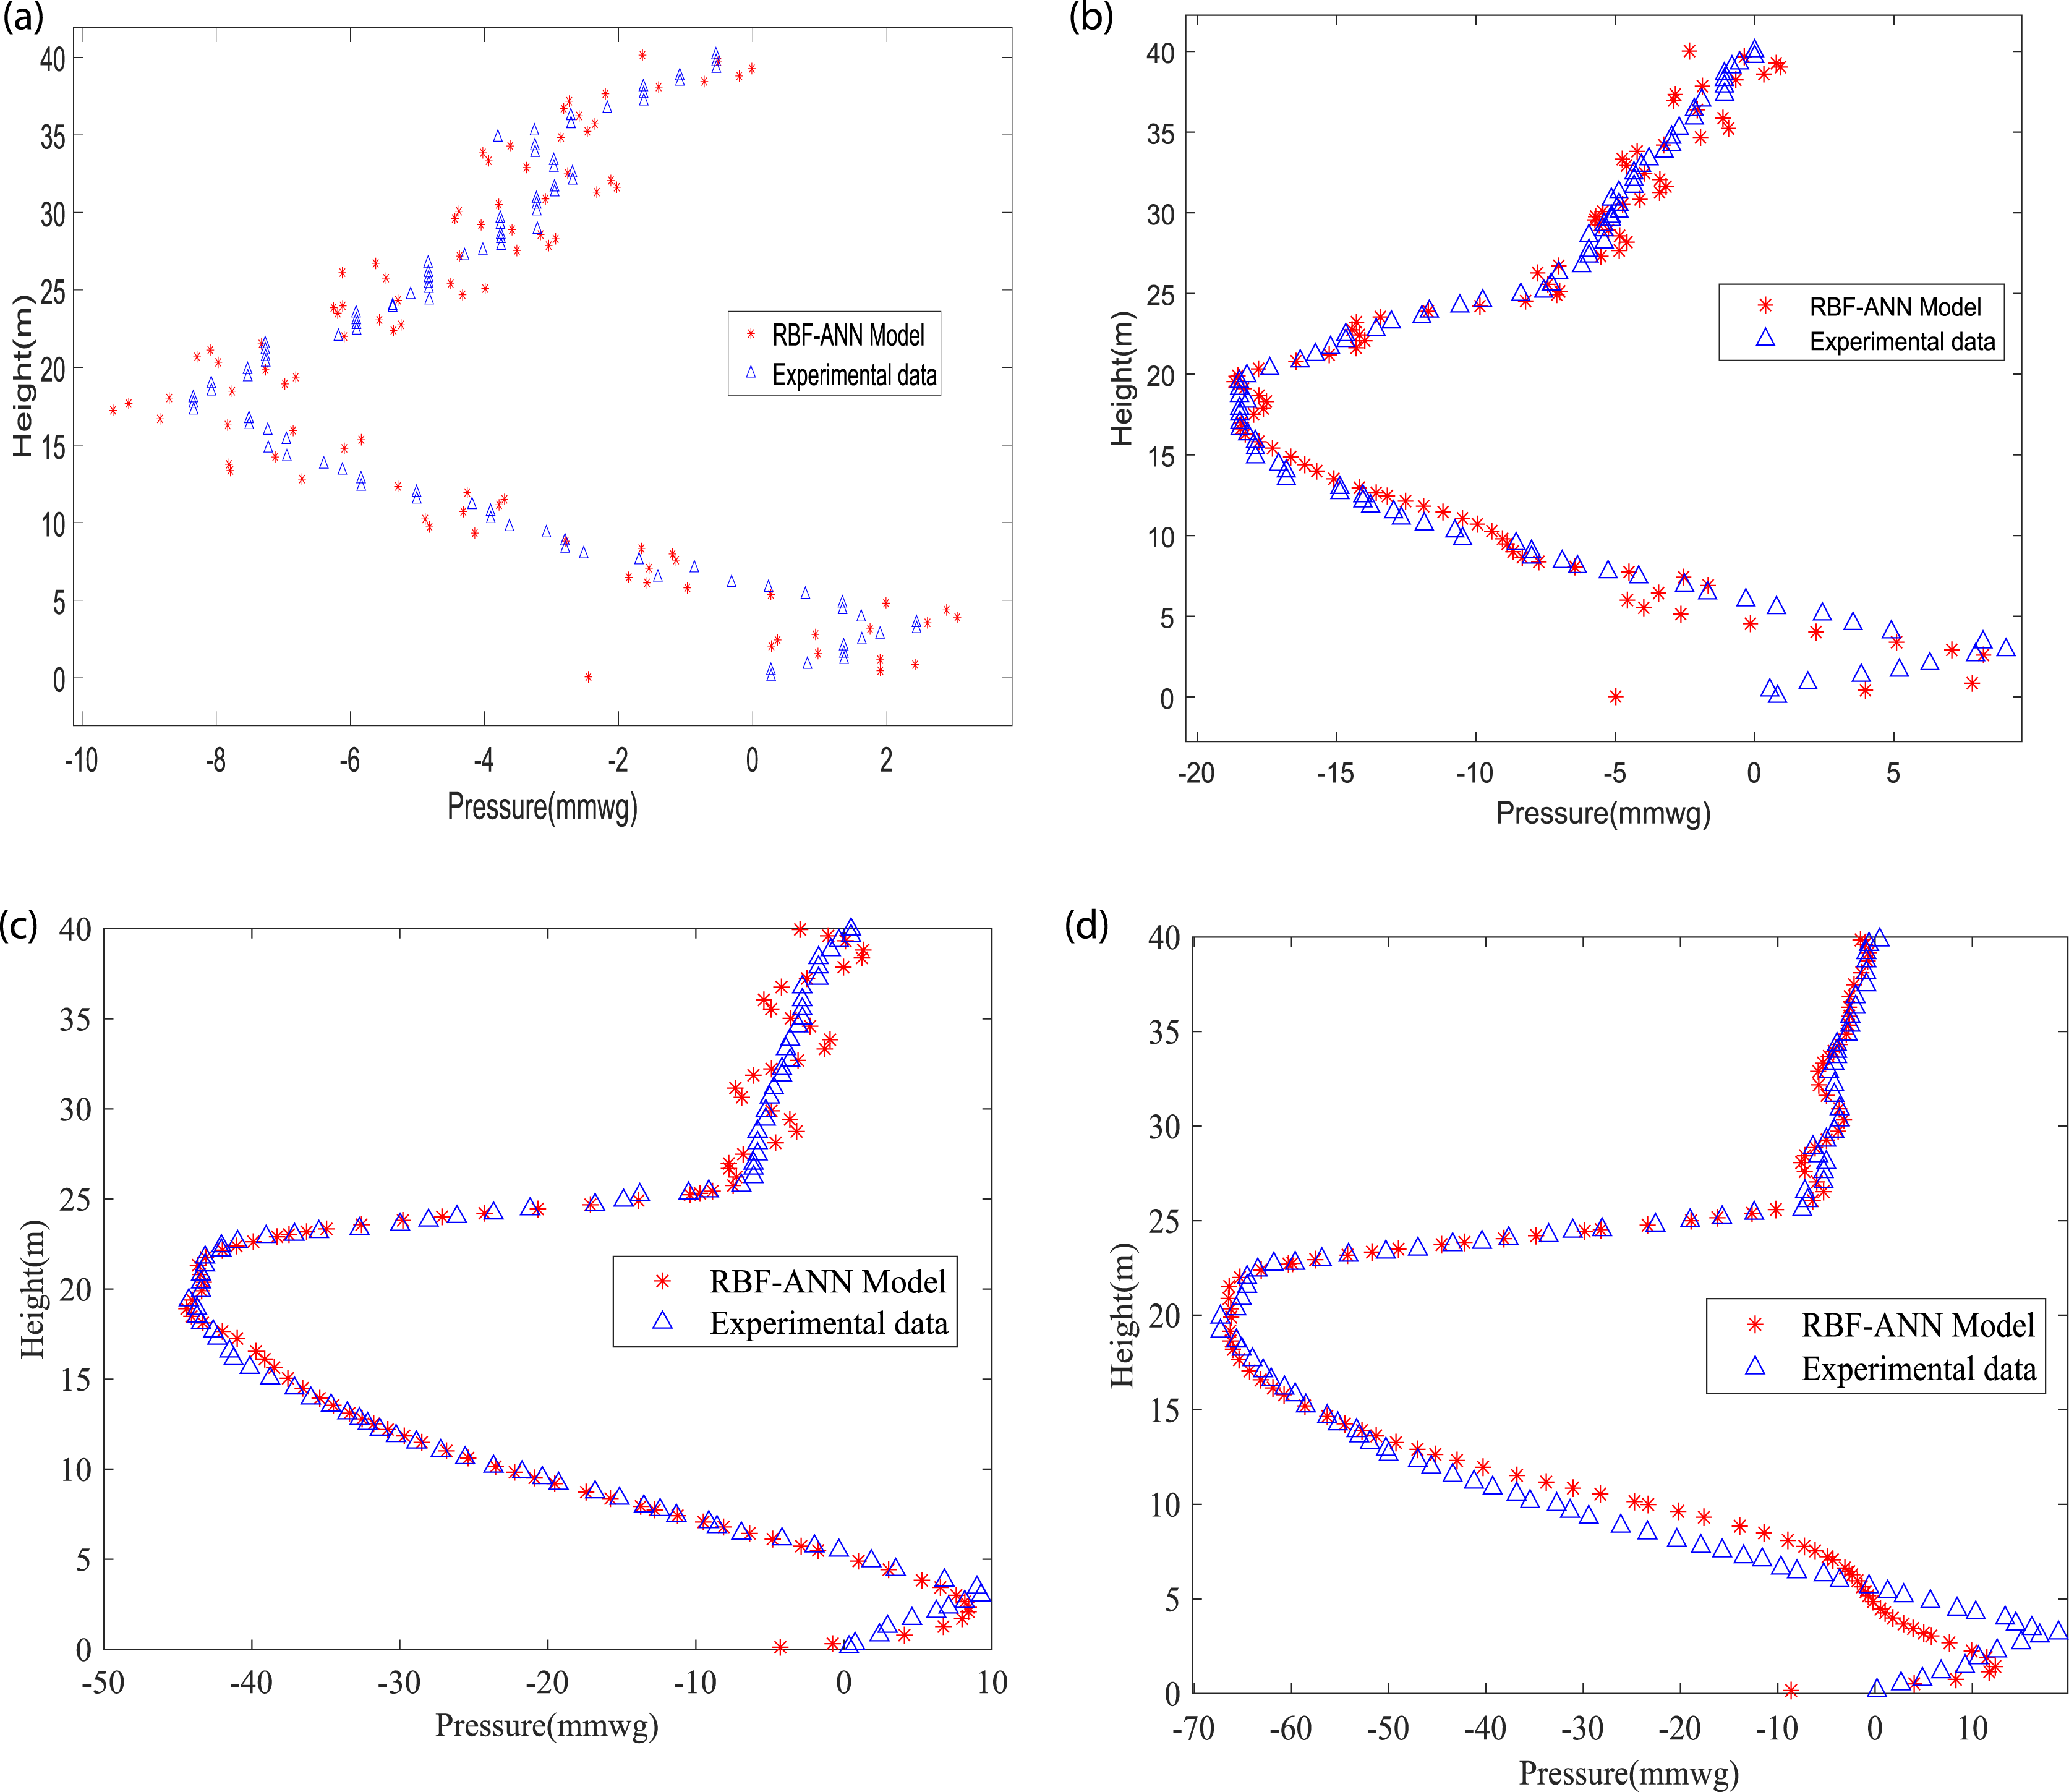
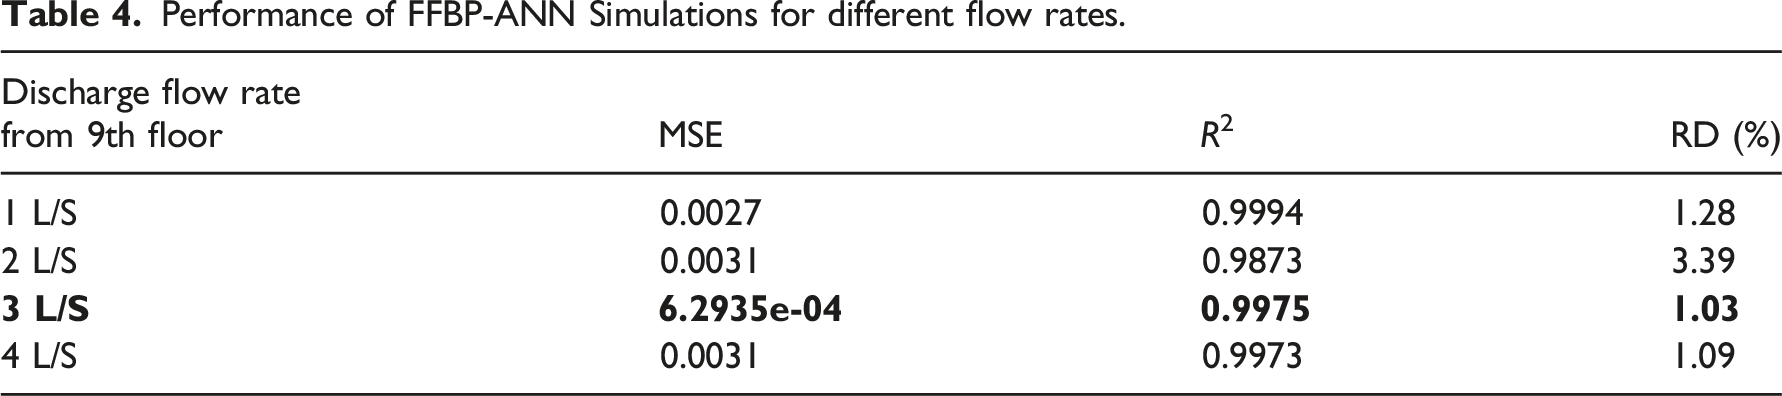
Performance of ANN models for different flow rates
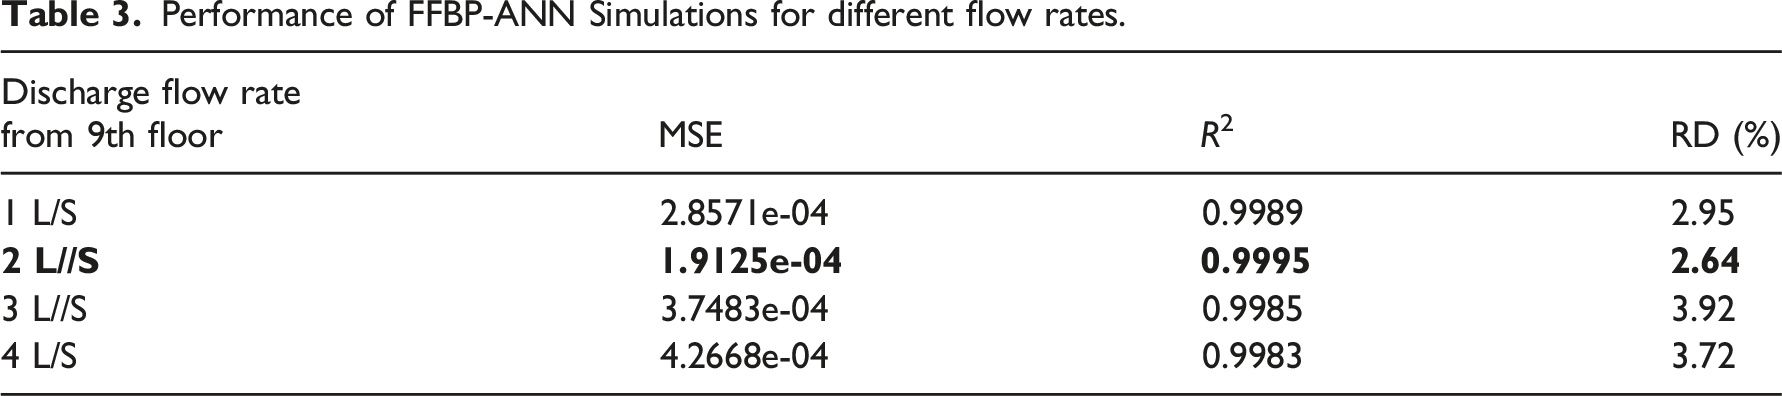
Figures 7 and 8 and Tables 3 and 4 represent the performance indicators from the simulations that are conducted by FFBP-ANN and RBF-ANN models varying the discharge flow rate coming from the 9th floor. The optimal FFBP-ANN and RBF-ANN models with 15 and 22 hidden neurons respectively are used for the simulations. Figures 7 and 8 show that the prediction of the pressure variation with a height of vertical stack against the experimental value is in good agreement for different flow rates. The MSE variation shown in Table 3, indicates that for a flow rate of 2 L/s, MSE is minimum with the FFBP model. The Prediction of Pressure versus height for different discharge flow rates with fixed discharge location at 9th floor using FFBP-ANN model where (a) discharge flowrate at 1 L/s (b) discharge flowrate at 2 L/s (c) discharge flowrate at 3 L/s (d) discharge flowrate at 4 L/s. Prediction of Pressure versus height for different discharge flow rates with fixed discharge location at 9th floor using RBF-ANN model where (a) discharge flowrate at 1 L/s (b) discharge flowrate at 2 L/s (c) discharge flowrate at 3 L/s (d) discharge flowrate at 4 L/s. Performance of FFBP-ANN Simulations for different flow rates. Performance of FFBP-ANN Simulations for different flow rates.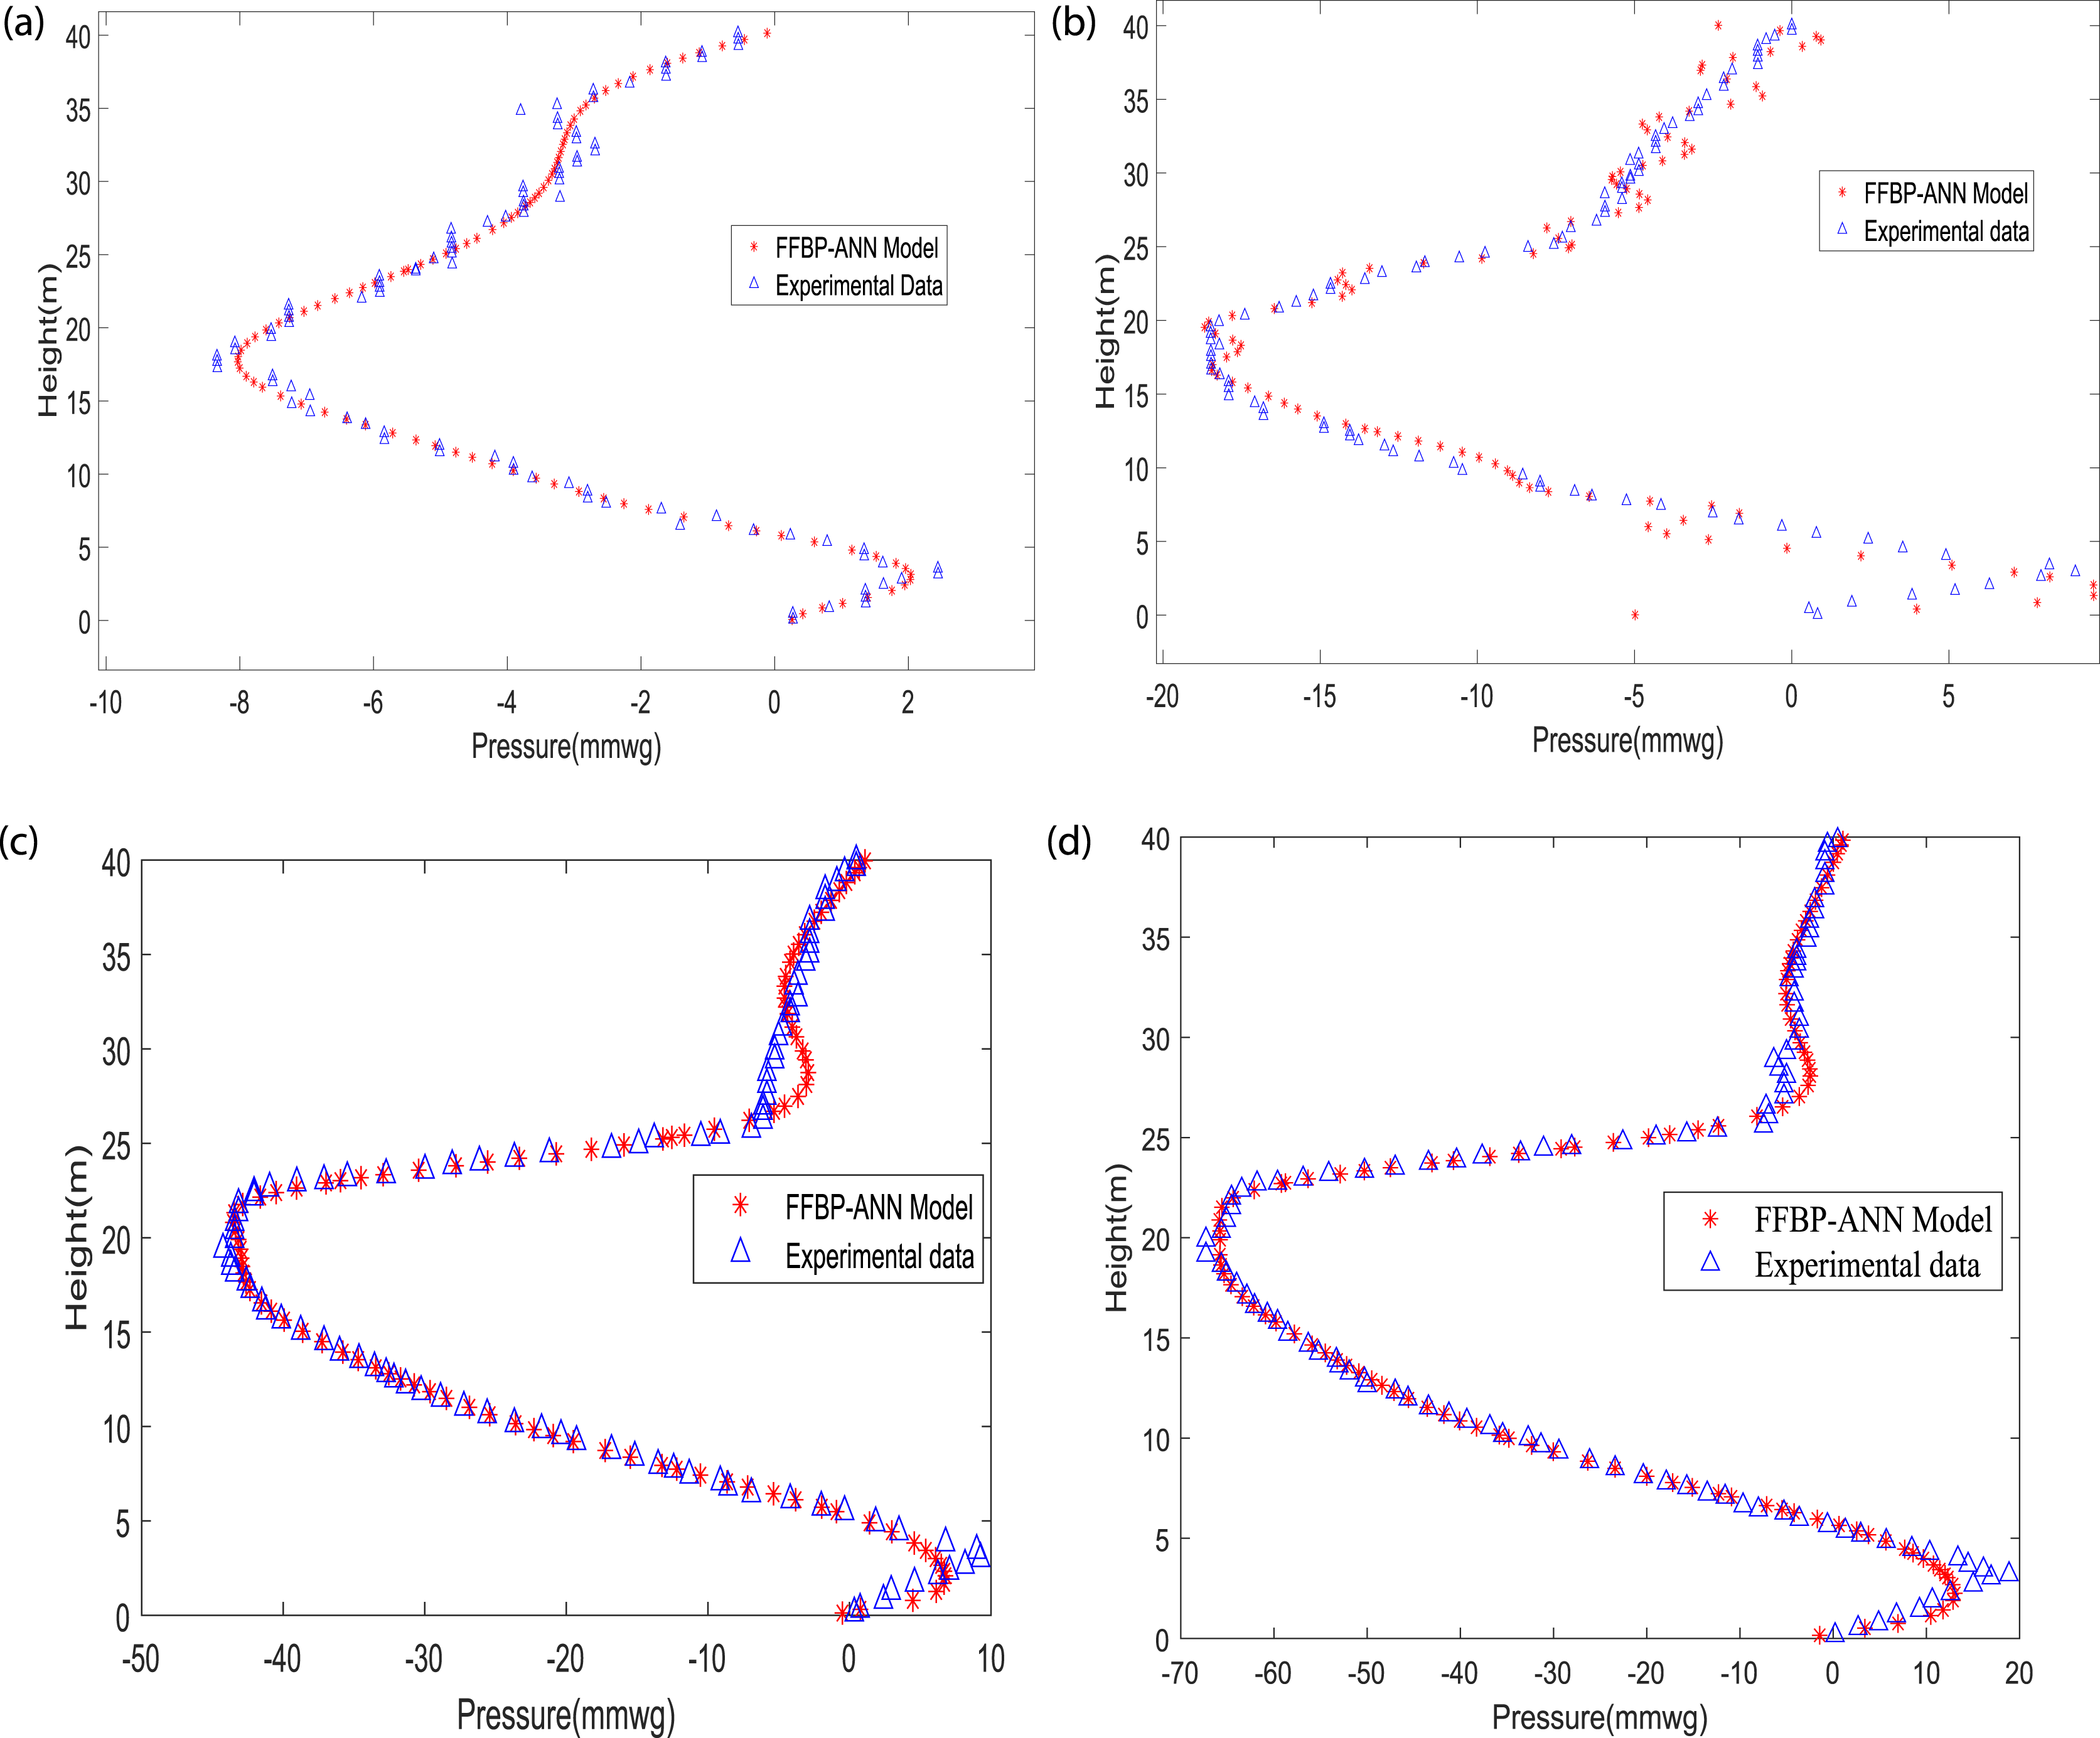
FFBP-ANN model performance with the location of discharge
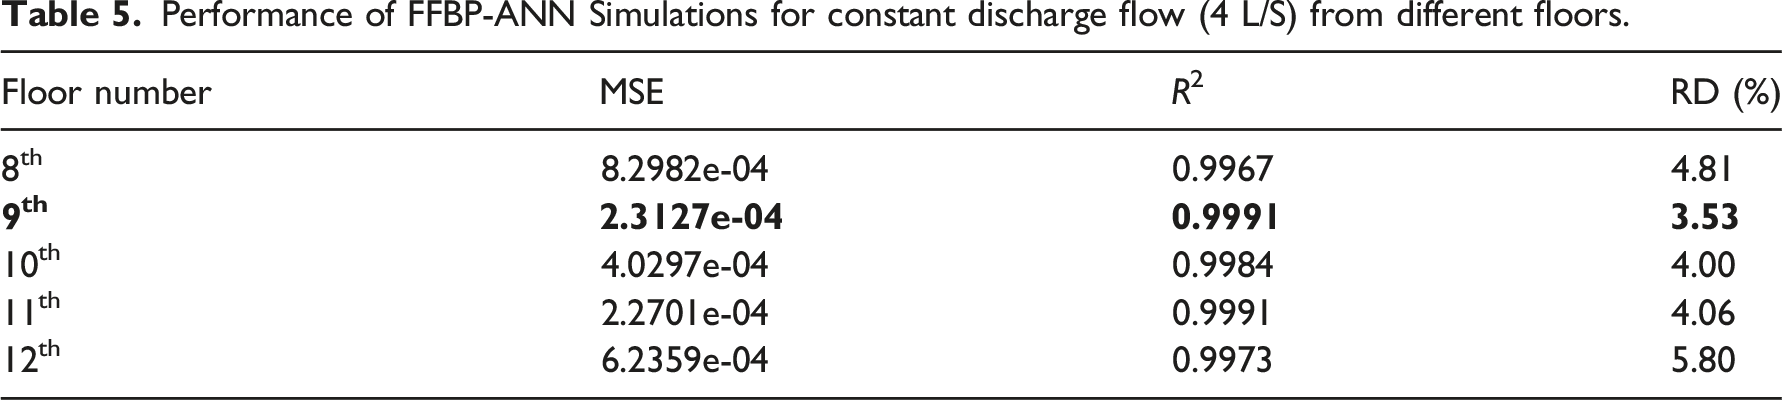
The prediction of pressure variation with height has been made using the FFBP-ANN model for different discharge locations while keeping its flow rate fixed.
It is observed that the FFBP model relatively exhibits a better co-relation coefficient compared to the RBF-ANN model. In this section, an attempt has been made to observe the suitability of the FFBP-ANN model to predict the pressure in the vertical stack of BDS having a two-phase flow, with different locations of discharge. For the purpose, the vertical stack of BDS receives a discharge from a single floor with a fixed flow rate of 4 L/s and the discharge floor location is varied. Numerical simulations are conducted for the 8th, 9th, 10th, 11th and 12th floors. Figure 9. Indicates the pressure variation with height of the vertical stack for the 8th, 9th, 10th, 11th and 12th floors and is found to be in good agreement with experimental data. Further, Table 5 gives the statistical measures of the FFBP-ANN model. This establishes the suitability of the FFBP-ANN model based on both values i.e. MSE-value and Prediction of Pressure versus height for different locations of steady discharge (=4 L/sec) using FFBP-ANN model. Performance of FFBP-ANN Simulations for constant discharge flow (4 L/S) from different floors.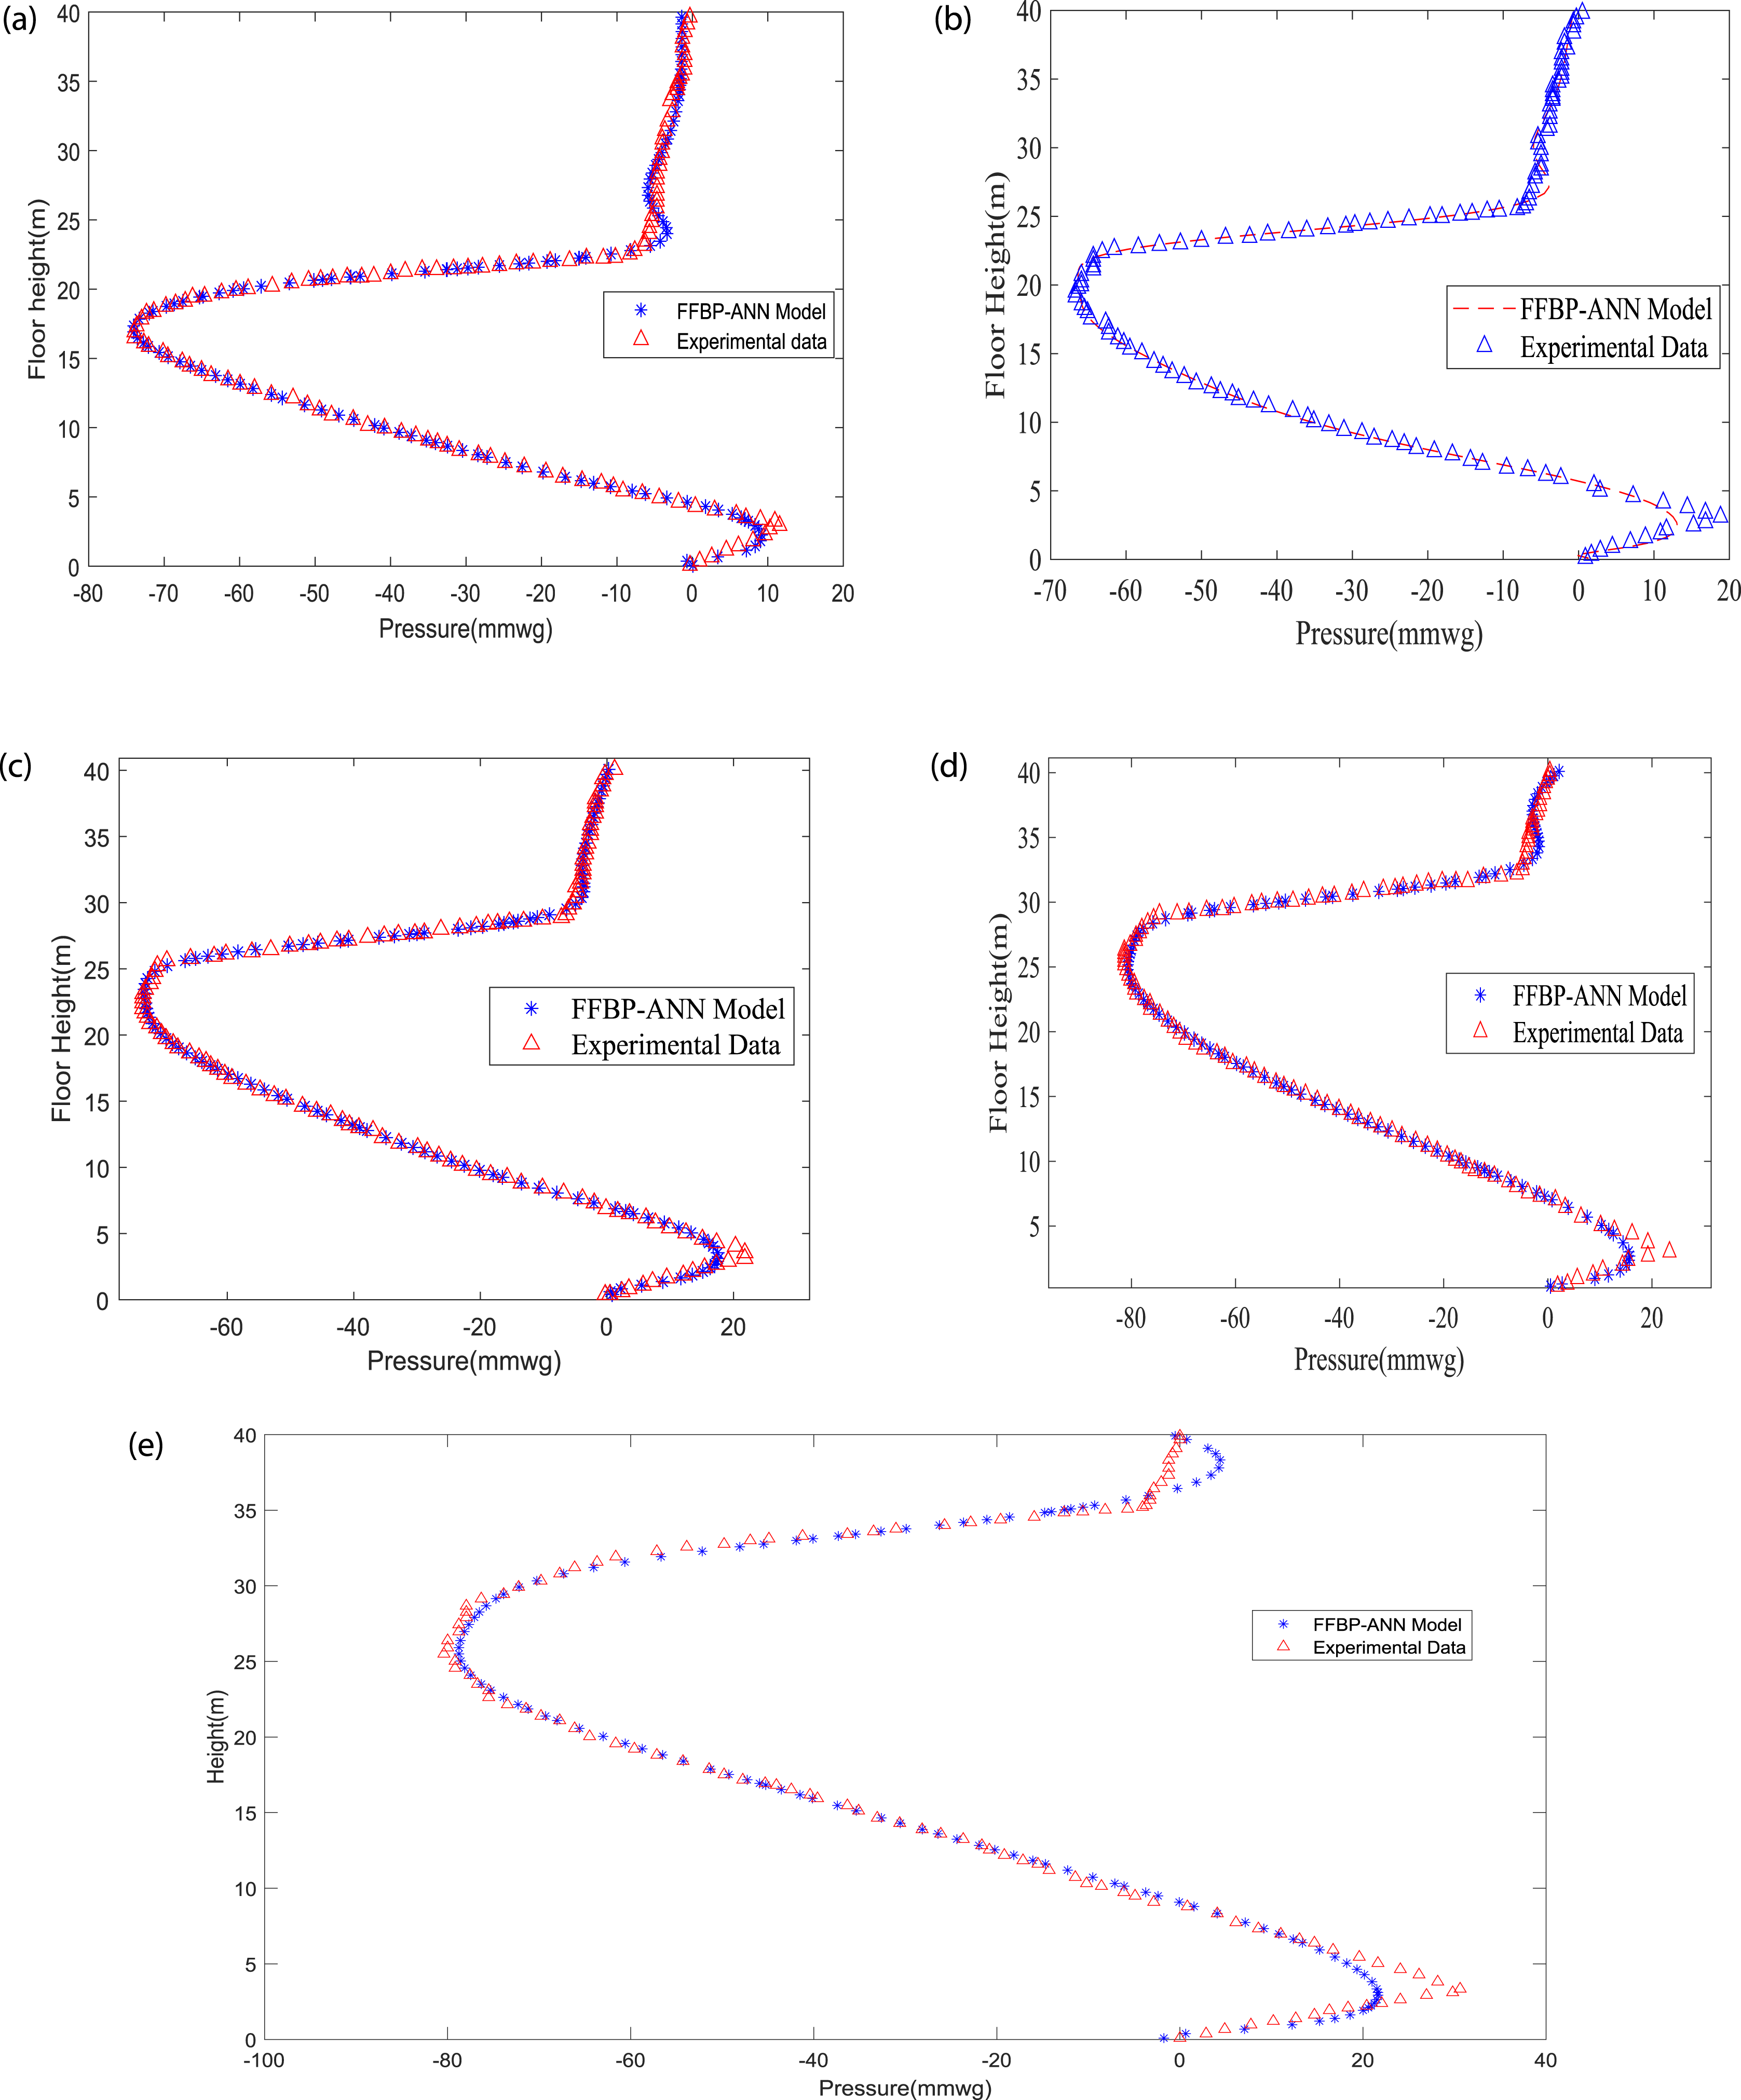
Furthermore, an attempt is made to establish a relation among the predicted pressure variation with height having discharge from different floors (i.e. 8th, 9th, 10th, 11th and 12th). In this regard, the FFBP-ANN model with 15 hidden neurons is employed, as the statistical measures indicate the suitability of the ANN model. Number of neurons of the present FFBP-ANN model is taken as 2,15 and 1 in the input layer, hidden layer and output layer respectively. Therefore, the synaptic weights associated with neurons of the input layer is 2X15 (W), whereas it is 1X15 (V) for the neuron connected with the output layer. These weights (W & V) associated with the input layer and output layer are obtained after satisfactory testing and validation of the predicted data from the FFBP-ANN model for discharge coming from any floor. Thus, these weights are determined for discharge coming from the 8th, 9th, 10th, 11th and 12th floors. Subsequently, a relation among these weights has been established, such that the weight (for the discharge coming from any floor say 12th floor) can be expressed as a linear combination of other weights (i.e., for discharges coming from other floors such as 8th, 9th, 10th and 11th). A rigorous exercise has been conducted to express five different relations for five different floors. Both weight vectors ‘Wi and Vi’ for a particular ‘ith’ floor are expressed as a linear combination of other weights (Wj and Vj) of ‘jth’ floors as shown below:
W8 = A9*W9+A10*W10+A11*W11+A12*W12
Similarly, V8 = C9*V9+C10*V10+C11*V11+C12*V12
The coefficients (A8, A9, A10, A11, A12) for the weights to establish a linear relation are also determined using initial guesses and subjected to improvements with iterations. These predicted weights are used in the FFBP-ANN model for predicting the pressure variation with the height of the vertical stack. The developed equation is tested with the Northampton data and also validated.
FFBP- ANN model for an open ventilation system
Performance of FFBP-ANN simulations for open-ventilated BDS.
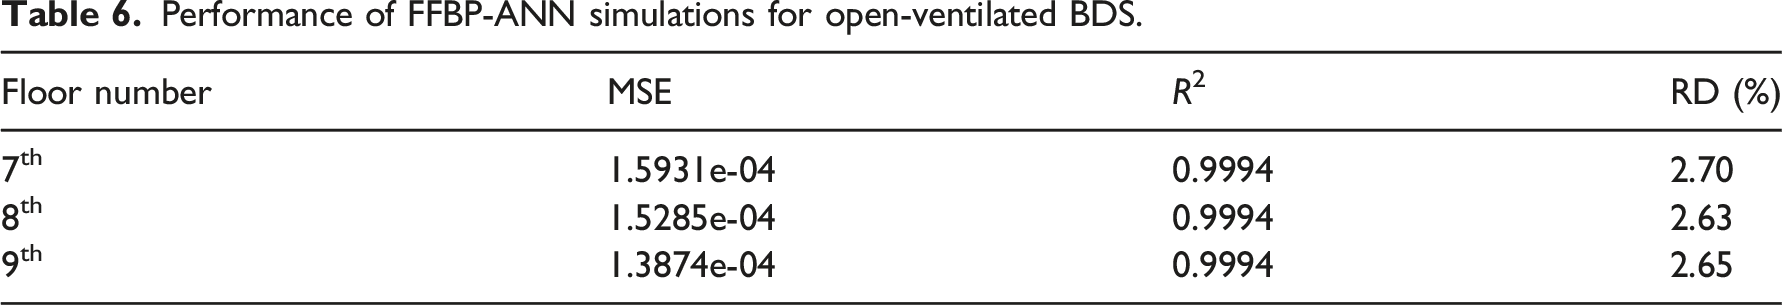
Pressure versus height with open ventilation using FFBP-ANN model for discharge from the 7th floor.
Conclusions
Both the FFBP-ANN and RBF-ANN models are examined for establishing reliability with respect to their applicability in the field of complex two-phase fluid flow phenomena inside a BDS of MSB. The data obtained from the experimental set-up at National Lift Tower (NLT in Northampton) and experimental data reported by Cheng et al.
20
have been used for training, testing, and validating the ANN model. The pressure variation with height in the vertical stack for discharge from different floors has been used to predict the relation for discharge coming from another floor. From the investigations with respect to the above, the following conclusions are outlined. • FFBP-ANN model gives its optimal performance with 15 hidden neurons whereas the RBF-ANN model becomes optimal with 22 hidden neurons. • The FFBP-ANN model yields a slightly higher correlation coefficient and lesser MSE compared to the RBF-ANN model. • Both FFBP-ANN and RBF-ANN models are found to be suitable for two-phase fluid flow applications. The small deviation is realised in the dry-stack zone only. • The FFBP-ANN model gives better accuracy for open-ventilated BDS. • The important relationship between pressure variation with height of vertical stack for discharge from any floor has been established from the same available data for other floors, by linear combination.
Overall, the technique has been shown to accurately predict instantaneous pressure profiles over a range of building heights and configurations, future work will establish the applicability of the techniques developed in this research to real design scenarios.
Footnotes
Acknowledgements
The authors also acknowledge the assistance of Aliaxis S.A. for the use of National Lift Tower facilities in Northampton, U.K.
Declaration of conflicting interests
The author(s) declared no potential conflicts of interest with respect to the research, authorship, and/or publication of this article.
Funding
The author(s) disclosed receipt of the following financial support for the research, authorship, and/or publication of this article: This work was supported by the Heriot-Watt University (James Watt Scholarship).