
Abstract
The Smart Readiness Indicator (SRI) was introduced in the revised EPBD (2018) to indicate how suitable a building is for smart operation. This study evaluates how varying functionality levels of dynamic envelope smart services, including movable shading control and window opening/closing control, impact the buildings’ SRI score and building performance. An office building located in London underwent both SRI assessment and performance simulation. Results revealed that changing the functionality levels of dynamic envelope services from the lowest to the highest resulted in only a 4.1% increase in the SRI score. Overall, the findings suggest a lack of significant correlation between the SRI score and the building’s projected performance. The variation in energy performance can be notably more pronounced than the alteration in the SRI score, or the adjustment in the SRI score may not necessarily induce a change in the building’s performance. Therefore, when undertaking the building design process, it is advisable to concurrently consider the SRI alongside the evaluation of building performance as well as the interaction between smart services and building design. This holistic approach is crucial for achieving an optimal design outcome.
Practical application
Significant efforts have been made to develop smart building assessment schemes, which can be highly beneficial in promoting the integration of smart services into buildings, and comparing the smartness levels of different buildings. Typically, these assessment schemes use a qualitative approach, evaluating buildings based on the presence of various smart services and their corresponding control strategies. However, to achieve optimal performance, it is essential to coordinate both building design and smart services by considering the building’s quantitative performance in addition to the qualitative assessment methods. This holistic approach enables a better understanding of the mutual impact between building design and smart services, facilitating well-informed decision-making.
Introduction
According to the Energy Performance of Buildings Directive (EPBD), 1 the building stock accounts for approximately 40% of the total energy consumption and 36% of the overall greenhouse gas emissions within the European Union (EU). The EU has set a paramount objective for the year 2050, which involves reducing carbon emissions to levels below those recorded in 1990 by 80%. 2 The UK has set a more ambitious target to achieve net-zero greenhouse gas emissions by 2050. 3 Given the significant role that the building sector plays in energy consumption and carbon emissions across Europe, it is crucial to actively explore new methodologies and advanced technologies to reduce energy consumption in this sector. On the other hand, the mentioned targets need more development and reliance on renewable resources. Considering variable energy production through renewable resources, it is important for buildings to be able to manage their energy consumption based on the availability of renewable resources. Smart buildings could make a considerable impact on achieving this particular aim.
The Technical Committee 247 of the European Standardization Organization acknowledged the importance of focusing on smart buildings. Consequently, they initiated a project aimed at developing a series of standards to define the smartness of buildings. The EN 15,232 standard, introduced in 2008, established a systematic approach for categorizing the intelligence of building automation and control systems. 4 This standard underwent revision and was subsequently replaced by the EN ISO 52,120 standard in 2022. 5
In 2018, the European Commission adopted the Smart Readiness Indicator (SRI), which draws from the principles outlined in the 15,232 standard. The SRI is designed to evaluate a building’s capacity to enhance energy efficiency and overall operational performance while accommodating occupants’ needs and responding to signals from the energy grid. 1 In the most recent version of the SRI assessment tool, nine distinct domains have been defined encompassing heating, domestic hot water, cooling, controlled ventilation, lighting, dynamic building envelope, electricity, electric vehicle charging, and monitoring and control. In total, these domains include 54 smart-ready services, and each of these services is evaluated based on seven impact criteria including energy savings on-site, maintenance and fault prediction, comfort, convenience, well-being and health, information to occupants, and flexibility for the grid and storage. Each individual service is capable of obtaining a specific score in seven impact criteria based on its functionality level. Services that have a higher functionality level are considered to be smarter in their implementation and consequently tend to offer more benefits to building users or to the grid.
The assessment framework of the SRI calculates a building’s score by considering various weighting factors for domains and impact criteria. These weightings differ depending on the building’s type and location. Additionally, users have the option to define custom weighting factors. The overall building SRI score is a percentage that denotes how close (or far) the examined building is from the maximum achievable score. The determination of the maximum smart readiness does not necessarily involve assessing all 54 smart-ready services. The SRI methodology employs a triage process, allowing the exclusion of a service from evaluation if it is not applicable to the specific building. As a result, this service is disregarded in calculating the maximum achievable score.
The assessment framework presents detailed and simplified methods to offer flexibility in the evaluation process. Although both methods share a similar structure, the Simplified Method (A) employs a reduced set of services, requiring less effort and expertise to conduct the assessment. It was designed primarily for small buildings of low complexity, such as single-family homes. On the other hand, the Detailed Method (B) is intended for buildings with higher complexity, typically large non-residential buildings, and large multi-family homes.
While utilizing SRI can be advantageous for evaluating a building’s smartness, it is important to note that this assessment scheme evaluates buildings based on the presence of various smart services and their corresponding control strategies. Nevertheless, the impact of these smart services on building performance, as well as the impact of architectural design on these services’ effectiveness, is not directly addressed in the scheme. Consequently, this study aims to investigate the correlation between smart services, architectural design, and building performance. It focuses specifically on smart services related to the building envelope, as these services have a direct relationship with the building’s architectural design. To achieve this aim, two primary questions were addressed: First, how does the modification of the control systems of the movable building envelope impact a building’s smartness, as measured by SRI, and its overall performance? Second, what is the correlation between building design and the effectiveness of these smart services?
To address the study’s questions, an office building was selected as a case study and underwent an SRI assessment. During this process, the SRI assessment methodology was evaluated. Furthermore, Different control strategies were developed for movable shading devices and window operations, which were subsequently applied in the building performance simulation. These alterations in control strategies facilitated an examination of their subsequent impact on both the SRI score and the overall building performance.
Literature review
As a recently introduced rating scheme, several studies have tried to examine the methodological framework established for SRI. These studies explore how alterations in input data, the selection of technical domains, and adjustments in weighting factors can impact the SRI scores. Vigna et al. 6 applied the SRI methodological framework to assess an office building in Bolzano, Italy, aiming to investigate the level of uncertainty within the SRI assessment system. This evaluation involved two distinct expert groups. The first group collaborated with the energy manager of the case study building, while the second group worked with the provider of the building management and automation system. These two groups had a difference in the selection of the functionality levels for each smart-ready service and even the indication of the building systems available in the building. The resulting SRI scores from these groups exhibited a 13% variation, emphasizing that the assessor’s interpretation and data sources significantly influence the accuracy of SRI evaluation outcomes.
Athanasaki and Tsikaloudaki 7 evaluated the impact of technical domain selection and their respective weightings on the SRI score of a single-family residential building in Greece. The researchers computed the building’s SRI score based on two distinct scenarios. In the first scenario, all nine technical domains available in the SRI were considered, while in the second scenario, only three specific technical domains were deemed relevant to the building. Additionally, each scenario was further divided into two sub-scenarios for the calculation of weighting factors. The first sub-scenario employed the default SRI weighting factors designated for residential buildings in southern Europe. In the second sub-scenario, weighting factors were calculated based on the building’s primary energy consumption. The findings of the study demonstrate that the inclusion of different technical domains and the utilization of varying weighting factors yield disparate SRI scores. Notably, a higher number of technical domains considered in the calculation corresponded to a lower SRI score. Janhunen et al. 8 highlighted that the ability to select technical domains and smart services within the SRI methodology can introduce subjective decision-making during the triage process, raising concerns about the overall reliability of the SRI scores. Additionally, the authors noted that variations in the number of services considered in different building assessment processes lead to non-comparability among the SRI scores of different buildings.
Varsami and Burman 9 utilized both the detailed and simplified methods of the SRI to assess the SRI scores of two non-residential buildings in the UK. Their findings indicate that the simplified method yielded higher SRI score results compared to the detailed method. The findings from these studies illustrate the sensitivity of the final SRI score to the degree of freedom considered within the SRI assessment framework for selecting technical domains and changing the weighting factors. Hence, it is crucial to examine more how these parameters can affect the final score. Canale et al. 10 applied the SRI methodology to typical residential buildings in Italy and assessed how different retrofitting scenarios can impact the SRI score. In their study, they identified eight typical buildings of the national building stock and evaluated them in terms of SRI score. The results indicate that the SRI score of typical residential buildings in Italy is approximately 5.0%. Two retrofitting scenarios were considered, and the potential SRI of the Italian building stock can increase to 15.7% for a simple energy requalification and 27.5% for a smart energy requalification. The authors concluded that the SRI is relatively low in the scenario that represents the current trend of existing building retrofits because the installation of highly energy-efficient systems or renewable energy production systems does not affect the SRI significantly. Instead, the level of automation and control of these systems has a more significant impact on the buildings’ SRI scores.
Moreover, certain studies have explored the relationship between a building’s SRI score and its performance by examining various Key Performance Indicators (KPIs). Fokaides et al. 11 evaluated the SRI score of a mixed-use building in Cyprus. In addition, they employed the Energy Assessment tool to determine the building’s Energy Performance Certificate (EPC) rating. The findings indicate that despite the building’s relatively good SRI score (52%), it received an energy class of D on its EPC, implying that the building’s projected energy performance is not aligned with its smartness. Ramezani et al. 12 evaluated the SRI calculation methodology in two case study buildings containing office rooms and laboratory spaces located in a Mediterranean climate. They investigated the correlation between each building’s SRI score, its indoor environmental quality (IEQ), and energy consumption. The IEQ and energy performance of both buildings were assessed through measurements, surveys, and the utilization of DesignBuilder energy simulation software. The results indicate that the building with a higher SRI exhibited better indoor air quality and lower heating and cooling loads.
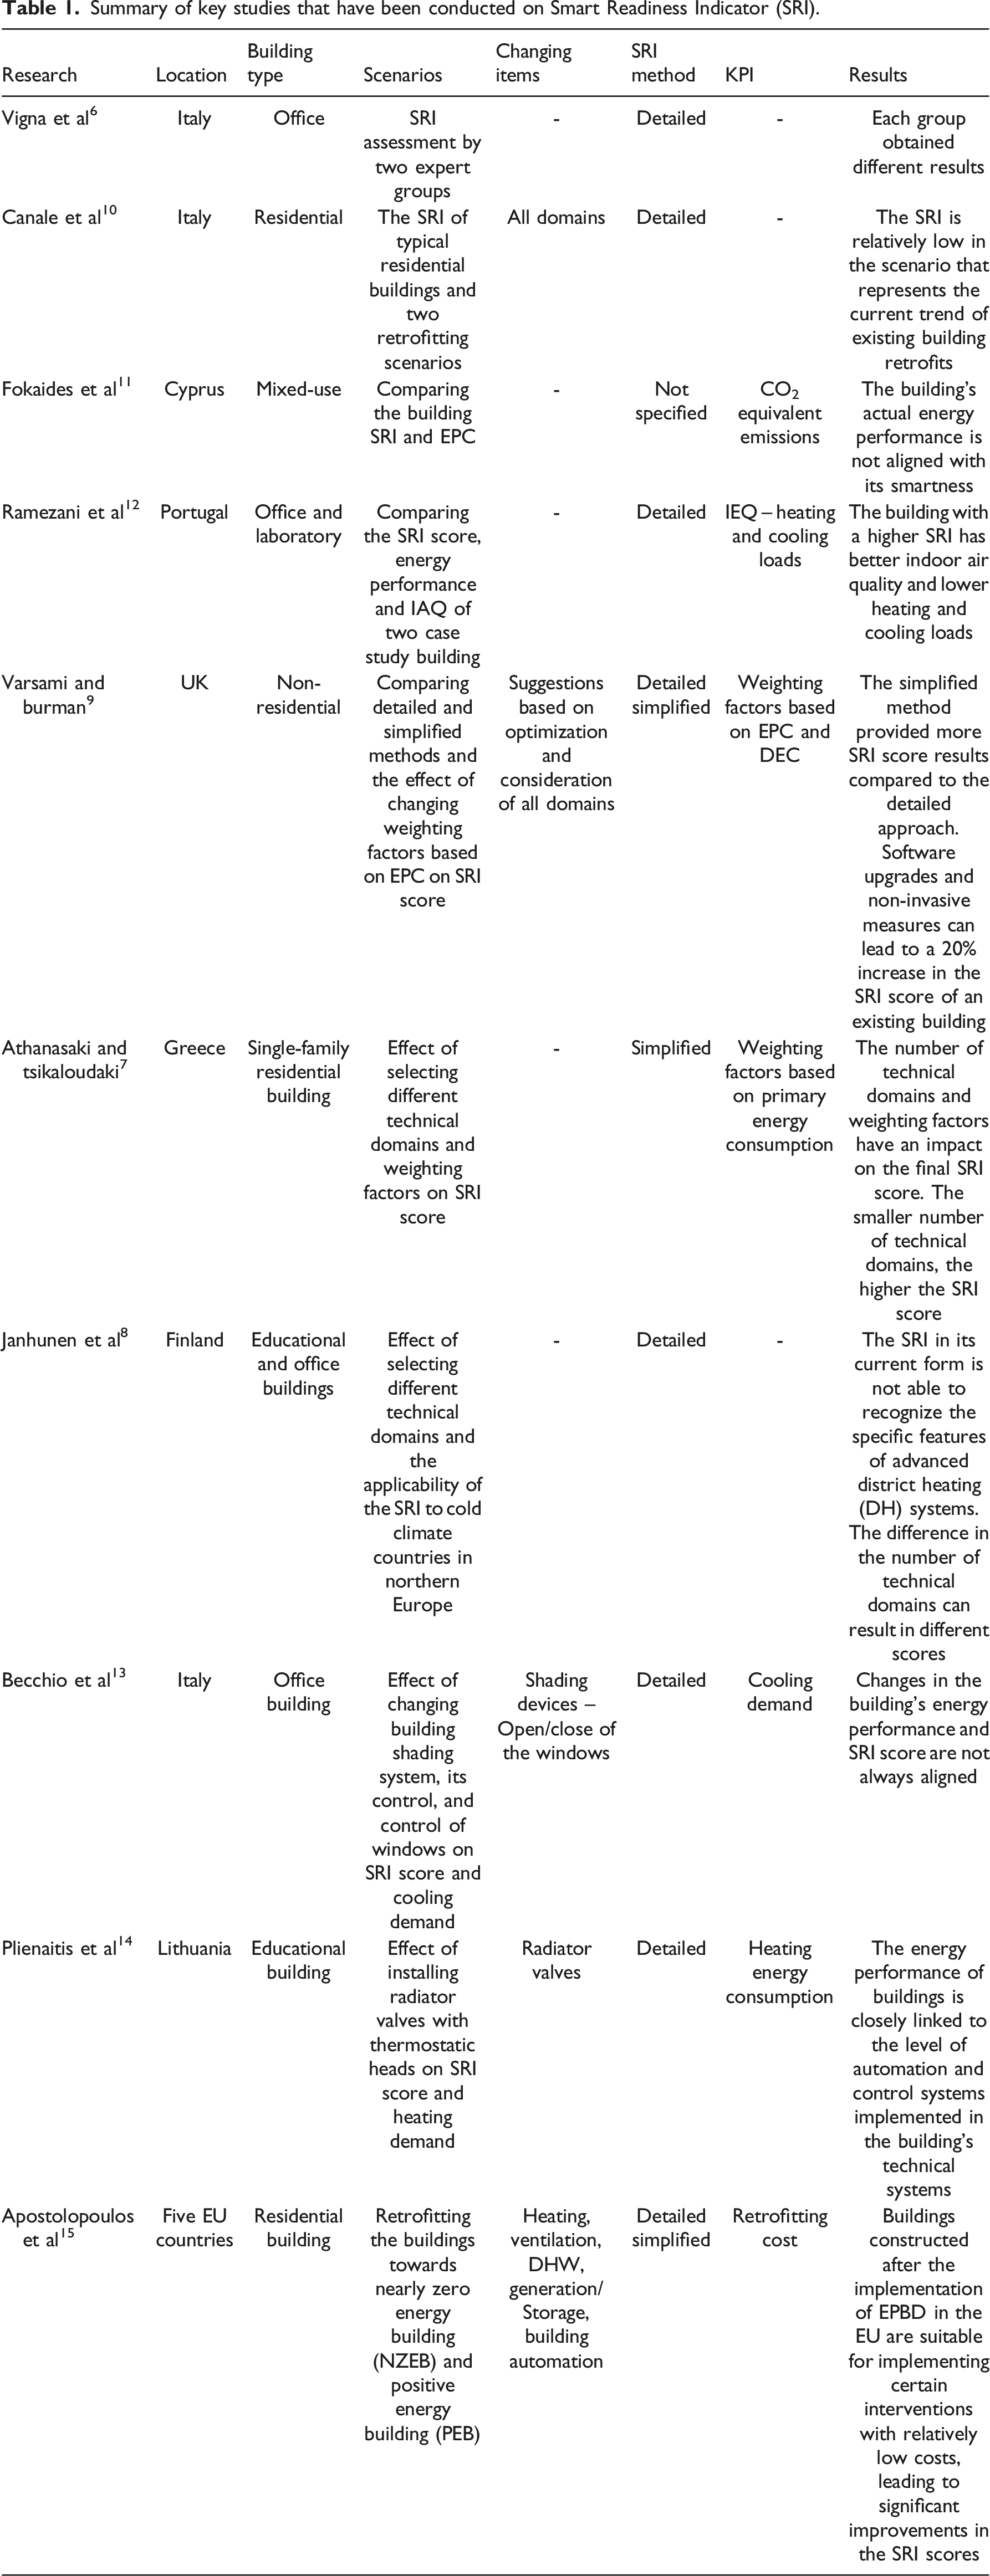
Summary of key studies that have been conducted on Smart Readiness Indicator (SRI).
The results of these studies demonstrate that the SRI methodology is inherently subjective. This suggests that the assessor’s understanding of the SRI assessment and the accessibility of data pertaining to building services play a substantial role in shaping the ultimate SRI score. The potential exclusion of specific domains and services during the assessment procedure alters the highest achievable score. Consequently, not only does this impact the SRI score of the considered building, but it also renders the SRI scores of diverse buildings non-comparable. Furthermore, the findings highlight that employing simplified and detailed approaches for SRI calculation yields divergent end scores.
A recurring observation in many studies underscores the necessity of integrating quantitative metrics alongside the SRI for a more thorough building assessment. According to findings from several studies, there isn’t always a direct correlation between a building’s energy performance and its SRI score. This underscores the significance of incorporating quantitative metrics in conjunction with the SRI score when making decisions regarding smart services. Hence, there is a need for more comprehensive investigations concerning the correlation between the SRI score and building performance.
Methodology
As previously mentioned, the aim of this study is to evaluate how changes in the functionality level of smart services related to the dynamic envelope affect a building’s SRI score and overall performance. To achieve this, a commercial office building in central London, completed in 2017, was selected as the case study (Figure 1). The building comprises 15 office floors, in addition to a ground floor and a basement level, with a total net internal area of approximately 22,000 sqm. Its architectural design features an open office layout, with two service and circulation cores. Case study building. © Tim Soar.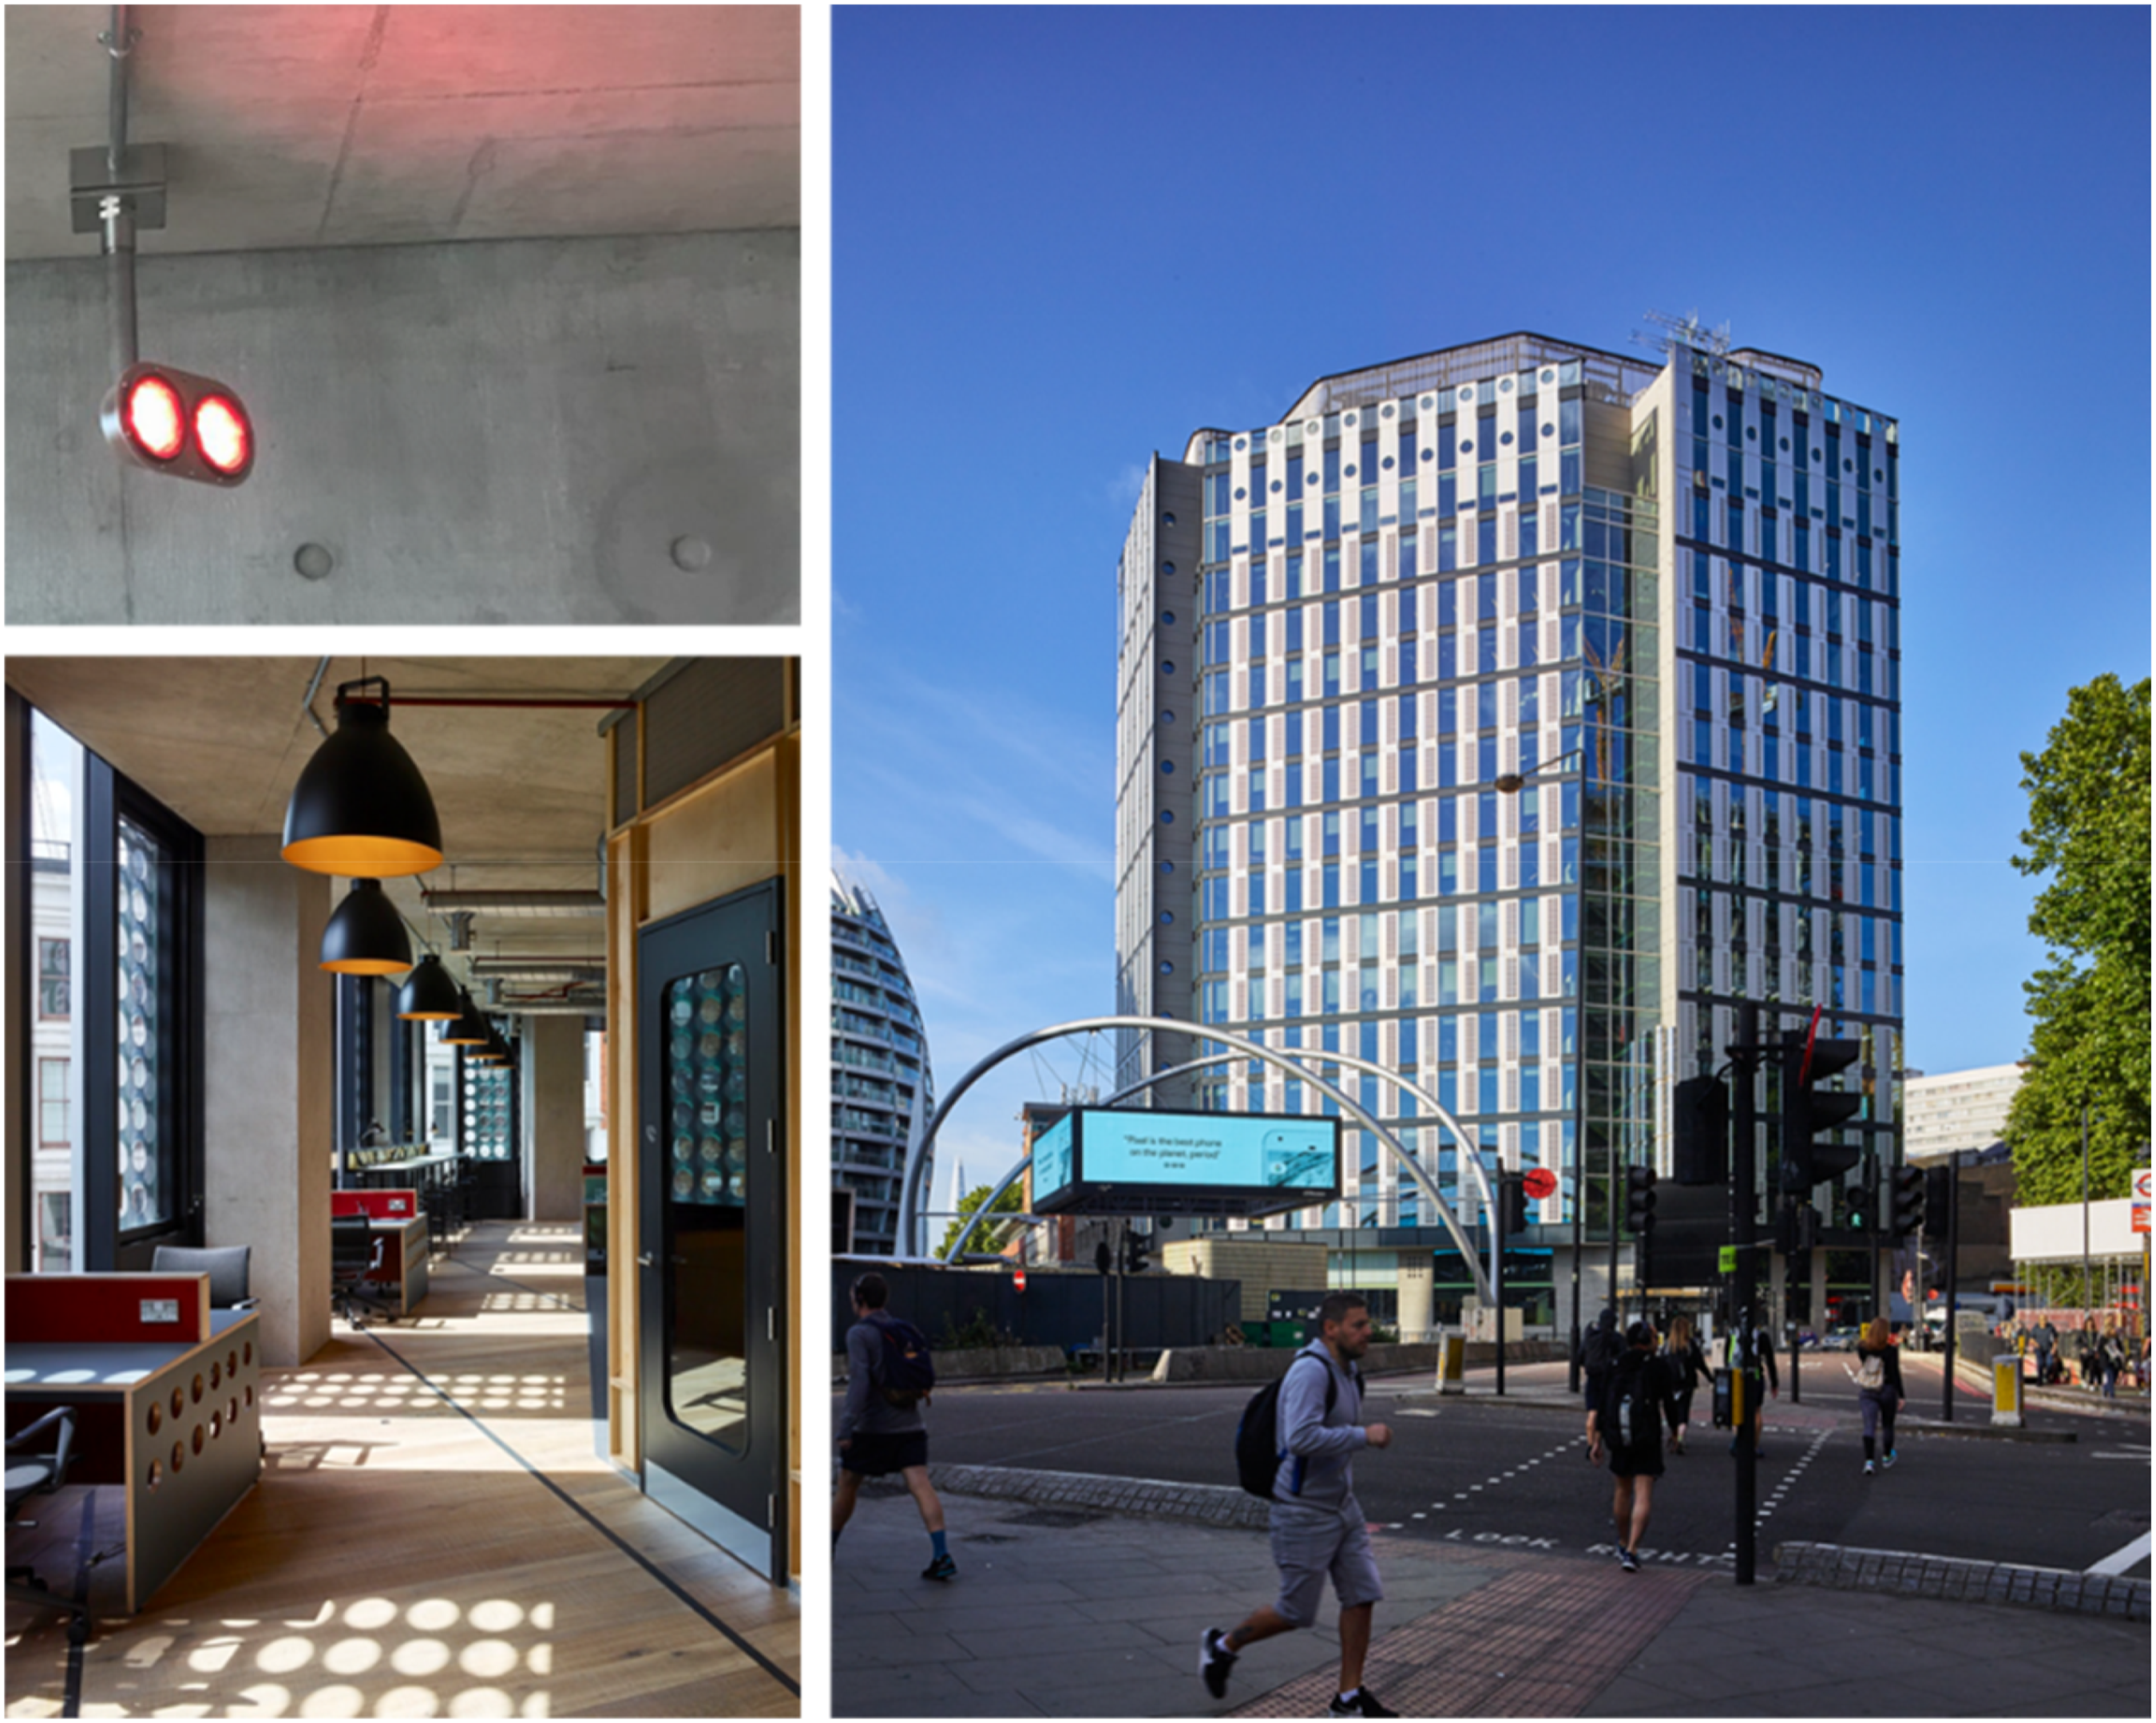
To ensure thermal comfort, the building utilizes an innovative cooling system that involves circulating chilled water through concrete slabs, thereby transforming the structural elements to function as a radiant cooling source. Additionally, heating is done through trenches positioned along the perimeter of the layout. These systems are supported by the mechanical air system, which brings fresh air to the internal spaces.
In the building envelope design, the glazing area has been intentionally reduced in facades that are exposed to direct sunlight, in contrast to the northern facades. Additionally, occupants have control over window openings and they are guided by a traffic light system to manage the windows. Due to the substantial depth of the building layout, providing fresh air to all areas through natural ventilation is not feasible. Consequently, the mechanical ventilation system has been divided into two components: central and perimeter. The perimeter section relates to the zones with a 6-m offset from the external walls. According to a predefined condition, windows can be opened when the outdoor temperature falls within the range of 15 to 24°C. During this period, the mechanical ventilation system serving perimeter areas is deactivated, enabling natural ventilation through the windows.
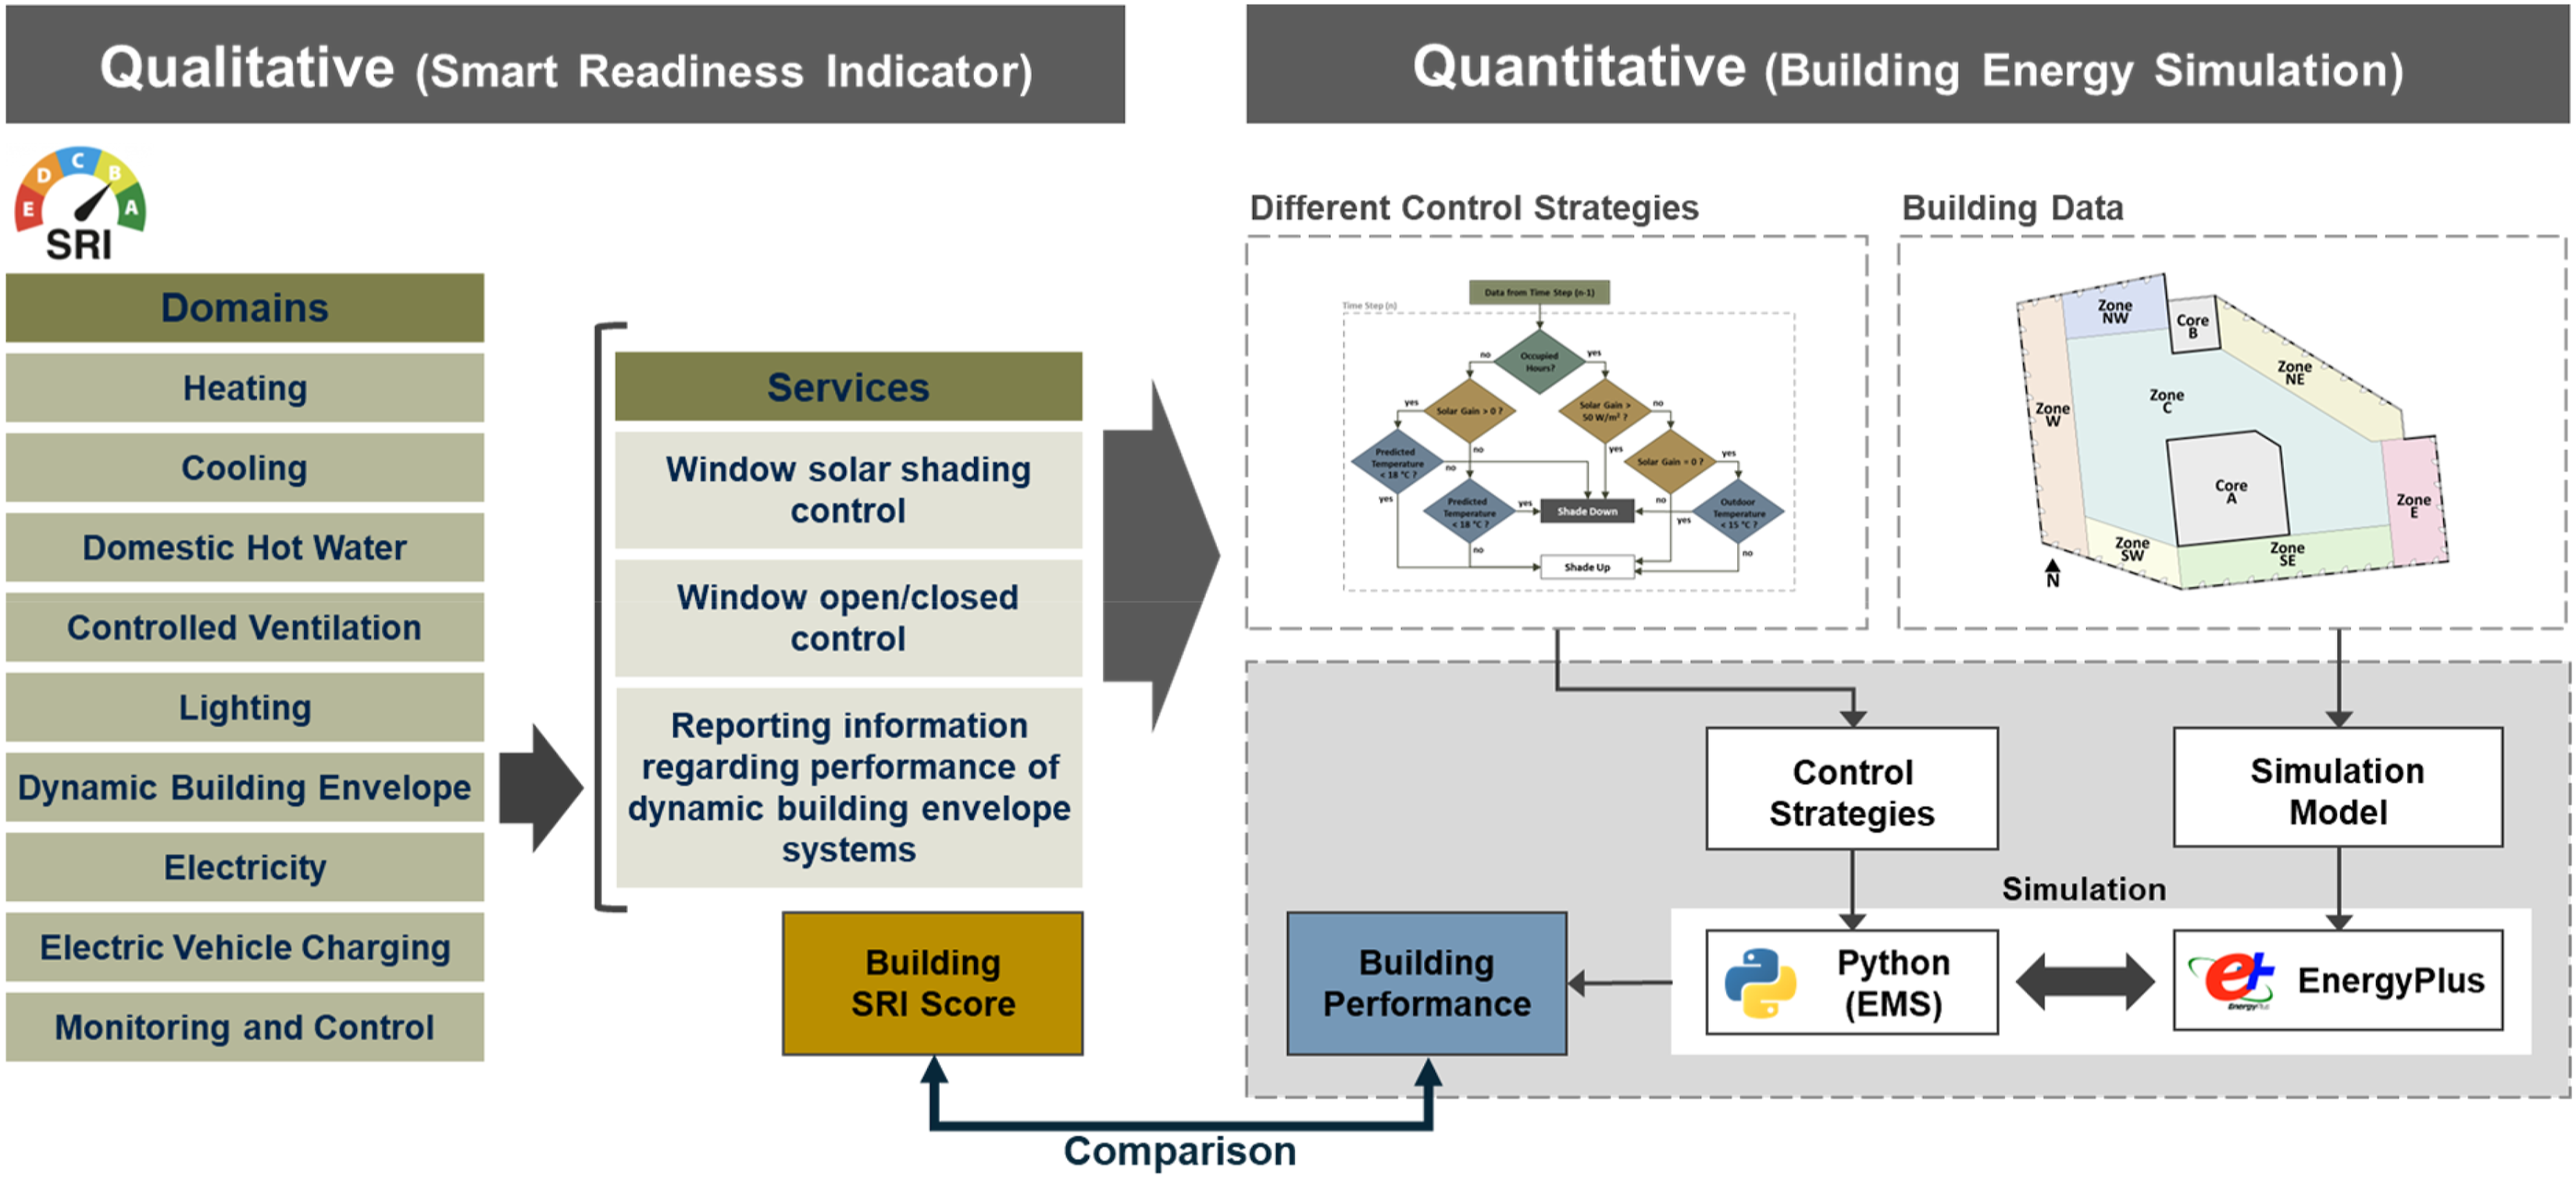
The case study building was subjected to both an SRI assessment and a performance simulation, considering various smart services. This process is illustrated in Figure 2. To accomplish the building’s SRI assessment, the SRI version 4.5 calculation sheet was employed.
16
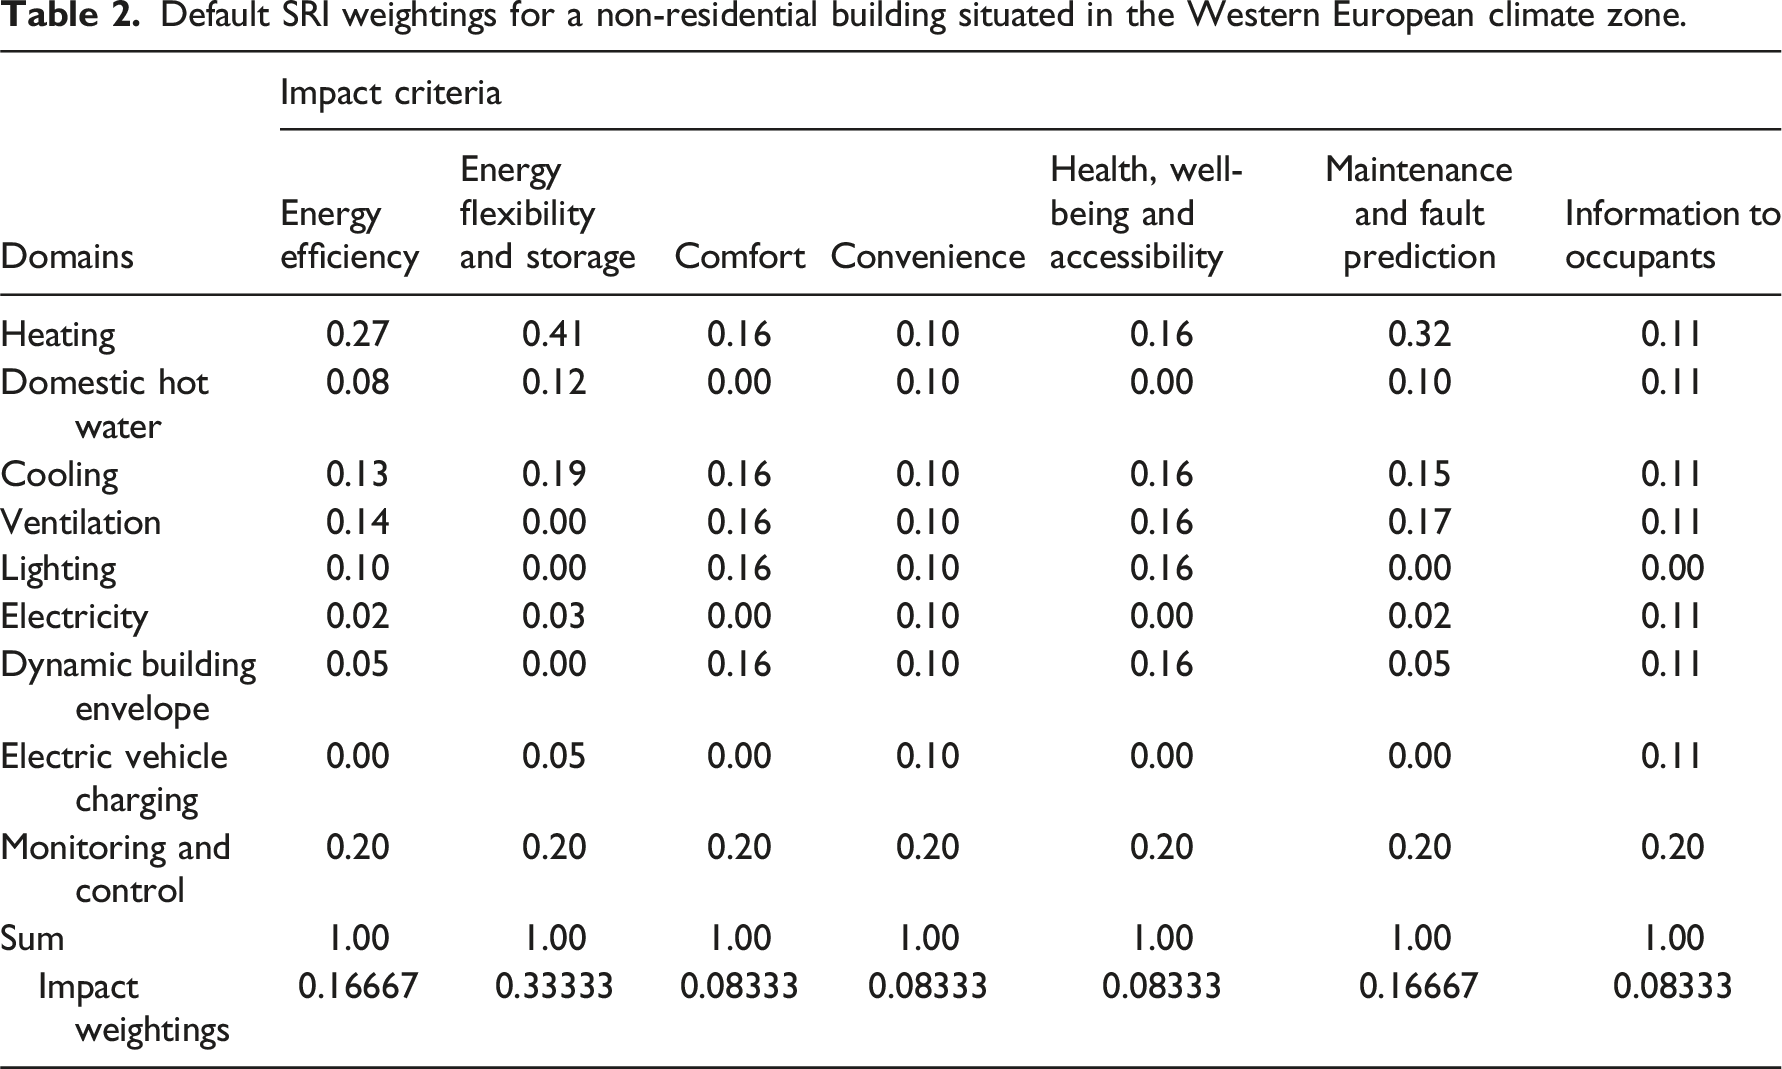
Based on the type and size of the building, the Detailed method was adopted, including 54 distinct services. Throughout this investigation, the predefined weights specified within the SRI framework for non-residential buildings located in the Western European climate zone were employed. These weightings are presented in Table 2. The process of assessing the SRI score for the building encompasses the following steps: • Preliminary assessment of design documents to identify applicable SRI services to the case study building. • Determination of functionality levels for each service, predicated upon design and implementation documentation. • Site visit to confirm details and to ensure alignment between implementation and design specifications. • Computation of the final building SRI score utilizing the calculation sheet. An overview of the research framework. Default SRI weightings for a non-residential building situated in the Western European climate zone.
In the SRI assessment tool, services pertaining to building envelope components are categorized within the domain termed “Dynamic Building Envelope”. These services include “Window Solar Shading Control,” “Window Open/Closed Control,” and “Reporting Performance Information of Dynamic Building Envelope Systems”. To discern the impact of alterations in the control strategy of building envelope components on the SRI score, modifications to the functionality levels of the aforementioned services were executed. The resultant variations in the overall SRI score of the building were analyzed. It is noteworthy that while investigating the repercussions of changes in the functionality levels for each service, the functionality levels of other services were held constant and maintained at the actual conditions of the building.
For building simulation, the EnergyPlus software (version 23.1) was employed in conjunction with its Energy Management System (EMS) feature. EnergyPlus EMS is a flexible and powerful scripting language that allows users to define custom control strategies for building energy models. EMS enables users to implement advanced control logic beyond the standard built-in control options provided by EnergyPlus. 17 This research study incorporates the combination of EnergyPlus and Python to simulate buildings equipped with various smart services and smart controlling strategies. The control of shading systems and window operations requires data inputs from various sensors. In the developed model, a diverse range of sensors has been integrated to capture key parameters such as the Daylight Glare Index (DGI), Indoor CO2 level, the status of heating and cooling systems, incident direct and total solar radiation on windows, outdoor temperature, and wind velocity. These data streams are seamlessly transmitted from EnergyPlus to Python at regular time intervals (5-min steps). This synchronized data flow is then employed to effectively determine and regulate the states of shading devices and windows opening and closing. Section 4.1 provides a comprehensive elucidation of the methods employed to use these sensor data for the control of shading devices and windows.
In the SRI assessment methodology, the scores assigned to shading control and window opening and closing control services fall under impact criteria including energy efficiency, comfort, convenience, and health and well-being. To evaluate the building’s performance, a range of performance metrics has been considered as simulation outputs, representing these impact criteria. These metrics include heating and cooling energy demand, artificial lighting energy, and the frequency of instances where the Daylight Glare Index (DGI) exceeds defined thresholds. Additionally, indoor CO2 levels are factored into the control strategies to ensure a consistently healthy environment for occupants. It is important to note that heating and cooling loads are considered ideal loads, meaning that the efficiency of the heating and cooling systems is not accounted for in the results.
The case study building consists of 15 office floors, most of which share a uniform layout. Therefore, for simulation purposes, the eleventh floor was selected as a representative model of all other floors. As previously mentioned, the approach to controlling the ventilation system differs between the perimeter and central areas of the building. In the perimeter sections, ventilation is achieved by opening windows when the outdoor temperature is suitable. To simulate this ventilation mechanism, the building layout was divided into perimeter and central zones. The natural ventilation through the windows was simulated using the Airflow Network method of EnergyPlus. 18 This method calculates the airflow volume from the exterior and between zones by considering the pressure differentials across various zones, as well as the wind-induced pressure on the building’s facade. To enhance simulation accuracy and incorporate the effects of cross-ventilation, apertures between distinct zones were taken into account.
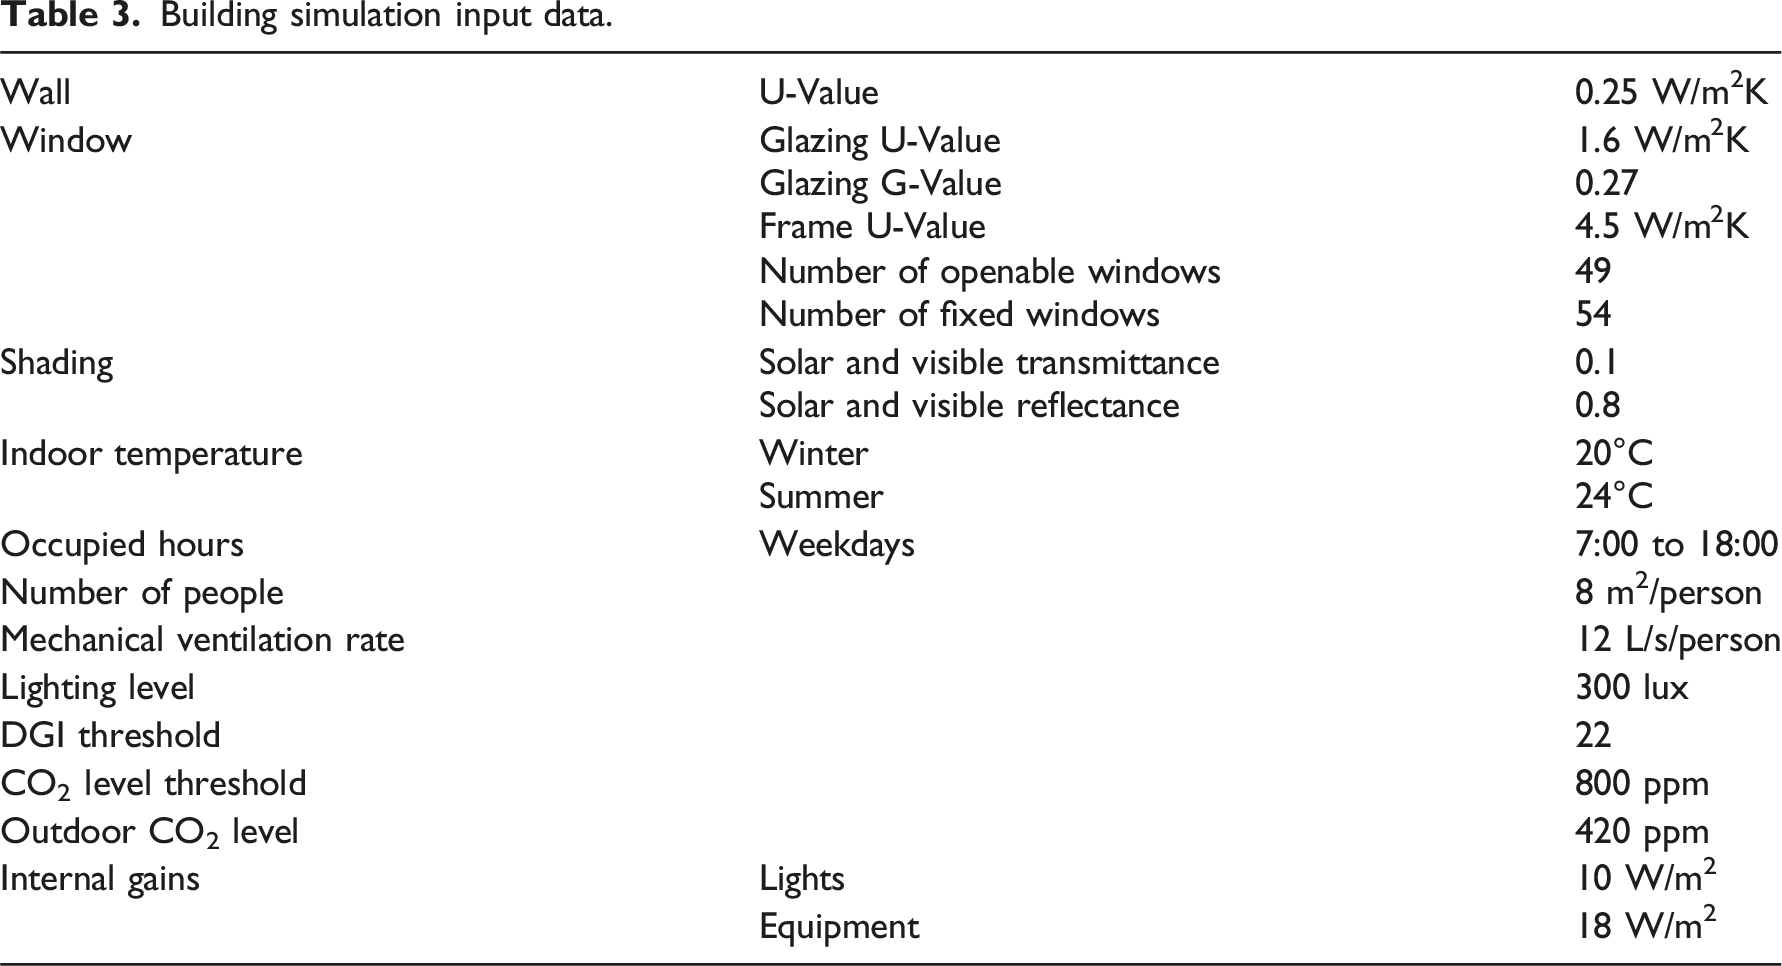
An illustration of the zones, apertures, and the designated points defined for both Daylight Glare Index and lighting calculations is provided in Figure 3. The angles used for calculating the Daylight Glare Index are determined by the furniture layout. Furthermore, Table 3 encompasses the input data that has been taken into account during the modelling process. Illustration of EnergyPlus model zoning for a typical floor. Building simulation input data.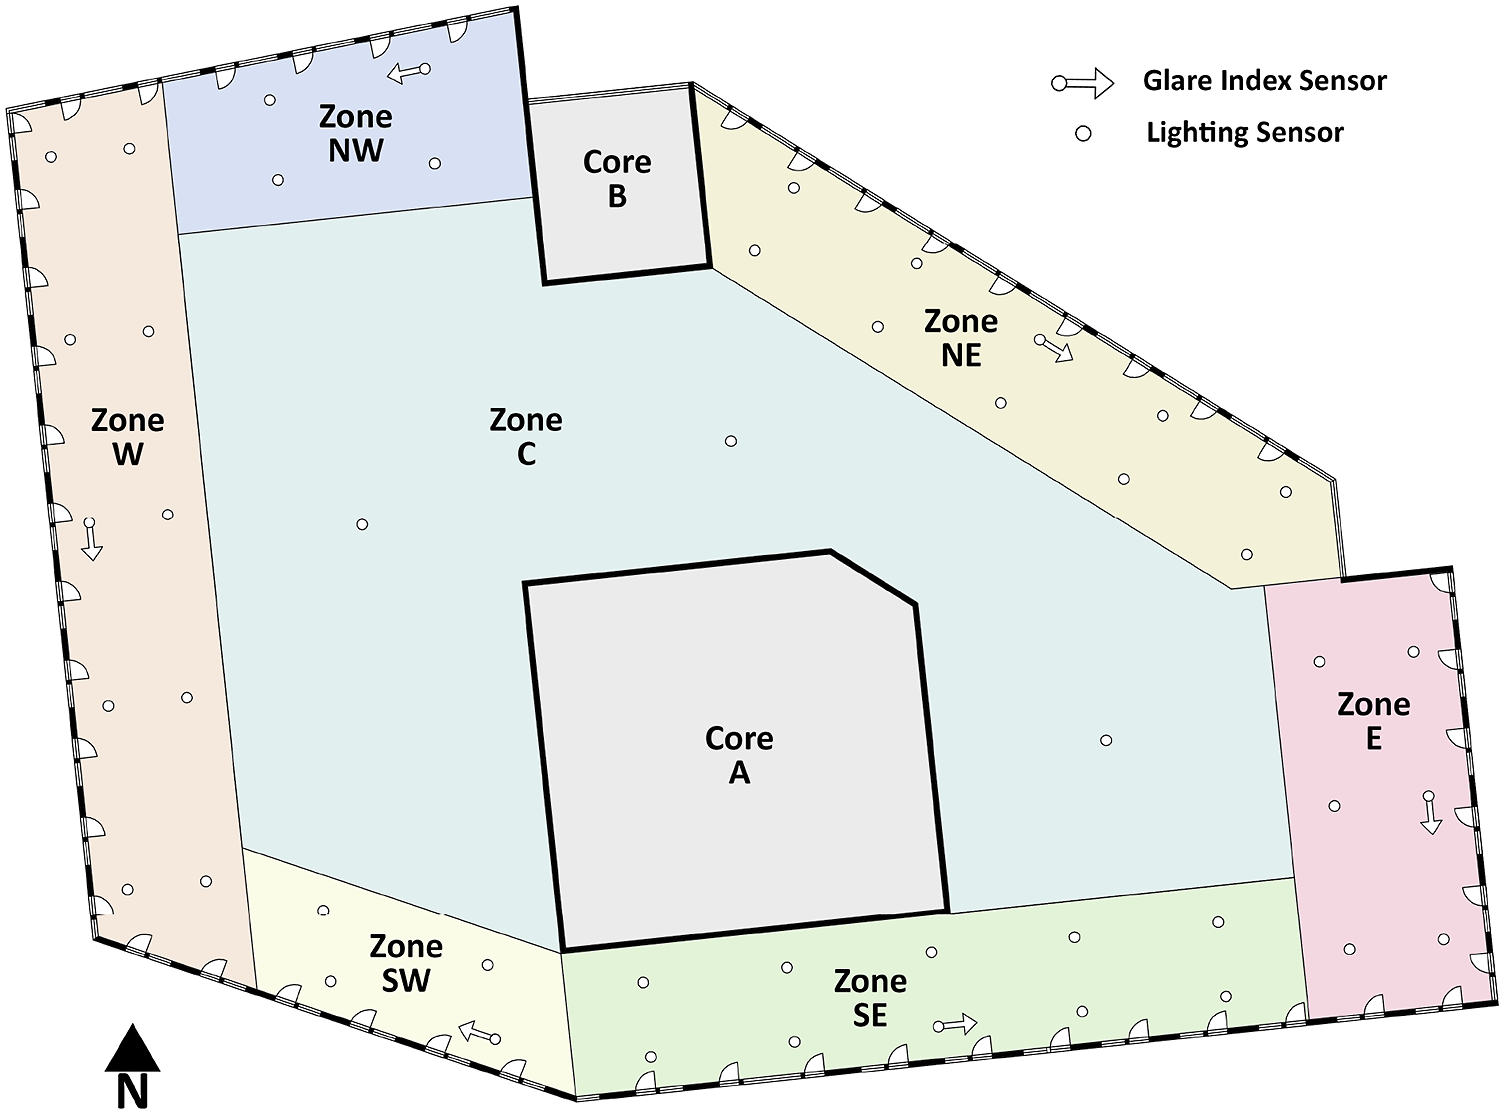
Controlling scenarios
In the development of control strategies for solar shading and window operations, the primary aim is to ensure that these strategies align with the established functionality levels within the SRI. This alignment enables a comparative evaluation of the effects of different functionality levels on the building performance.
Controlling scenarios for solar shading
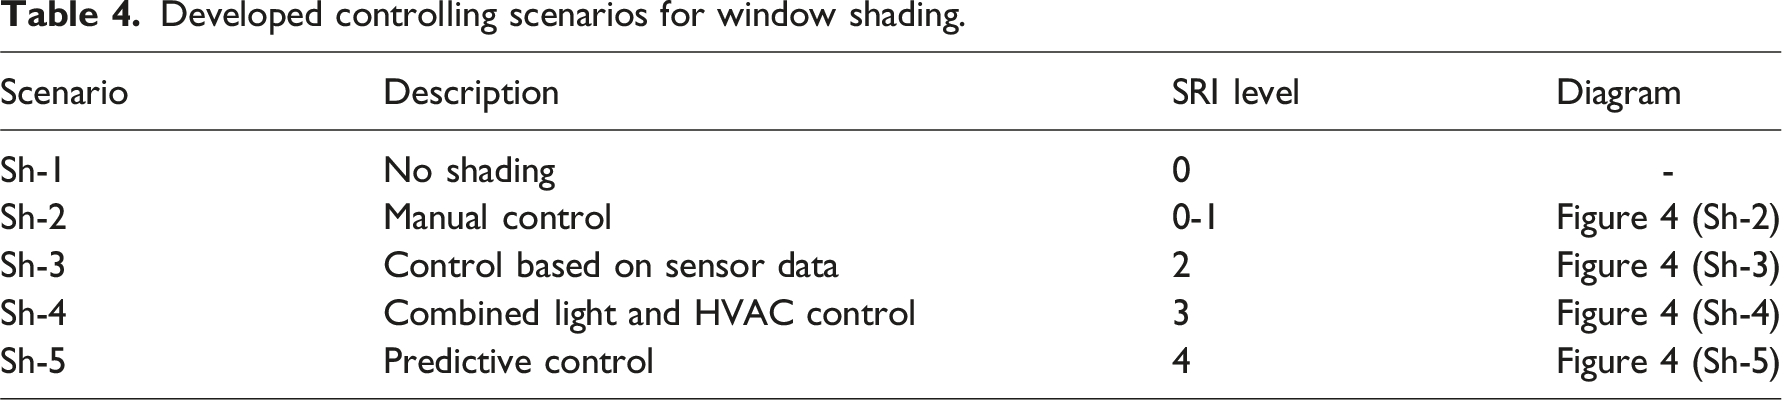
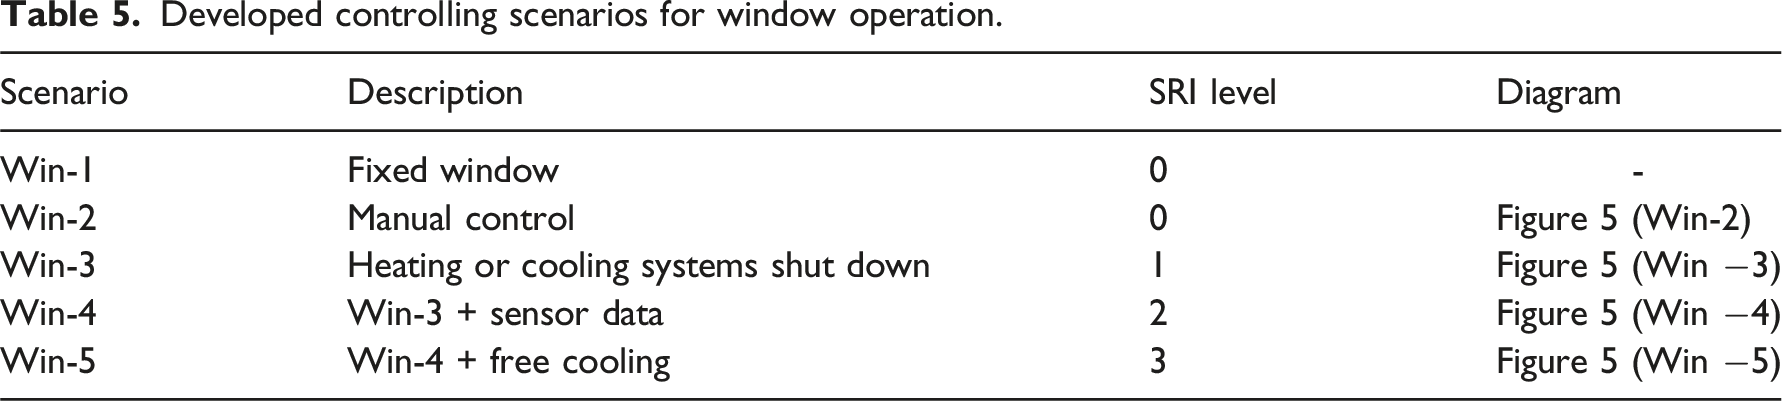
Developed controlling scenarios for window shading.
Functionality Level 0: Two scenarios have been considered for this level. In the first scenario (Sh-1), windows have been taken into consideration without the presence of any shading devices. In the second scenario (Sh-2), shading devices are manually controlled by occupants. In this scenario, it has been assumed that occupants close shading devices when the DGI within their workspace exceeds the desired threshold. Also, it is assumed that they open the shadings when there is no direct sunlight on the windows. The shadings are open during unoccupied hours. (Figure 4). Window shading control algorithms.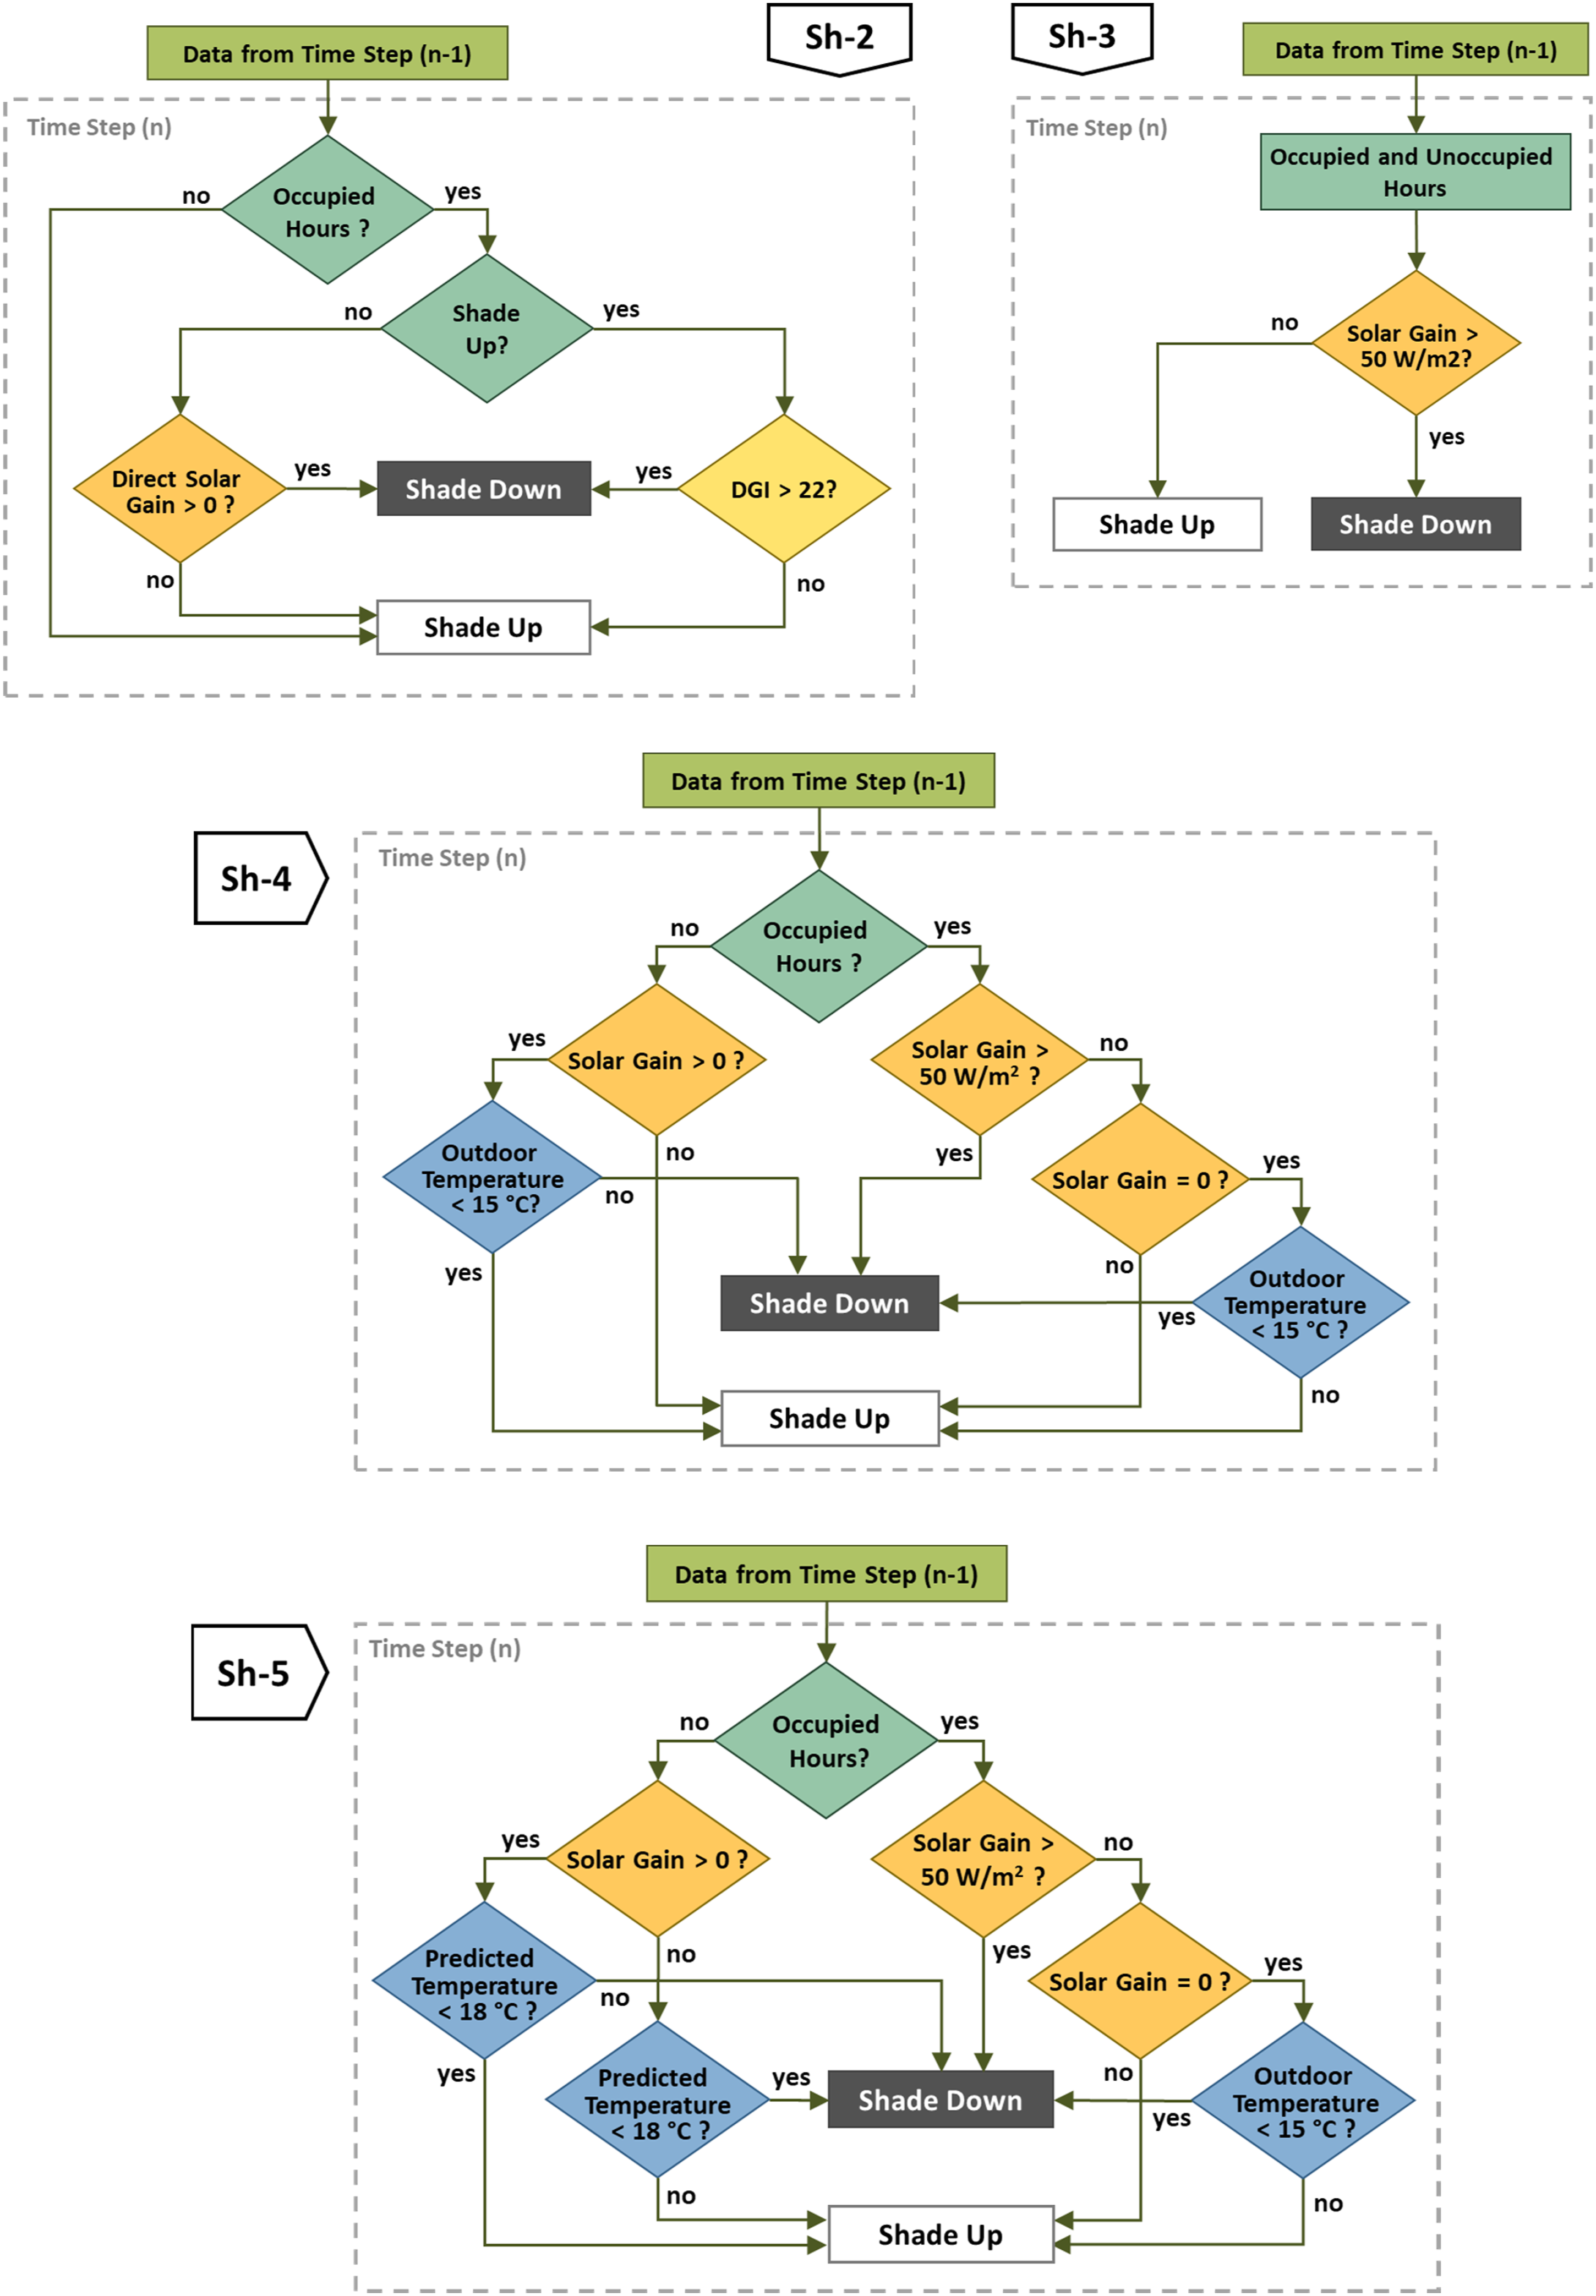
Functionality Level 1: Shading control involves the motorized operation with manual control. At this level, even though it is easier for occupants to change the position of the shading systems, control remains reliant on occupants’ behaviour. Consequently, the control scenario for this functionality level has been considered the same as the previous scenario.
Functionality level 2: This level pertains to the motorized operation of shading devices with automatic control based on sensor data. In the developed controlling scenario (Sh-3), the sensor considered is a solar radiation sensor that measures the amount of solar gain on the windows. In this scenario, the shading devices are automatically closed when the solar gain on the windows exceeds 50 W/m2 (Figure 4). This control strategy has been applied during both occupied and unoccupied times. The determination of this threshold was accomplished through a sensitivity analysis, guaranteeing the maintenance of comfortable lighting conditions for the majority of hours while minimizing energy consumption.
Functionality level 3: This level is a combination of light, blind, and HVAC control. The control algorithm developed for this functionality level incorporates distinct strategies for occupied and unoccupied periods. During occupied periods, similar to the previous scenario, the shades are closed upon the surpassing of solar radiation on the window beyond 50 W/m2. Furthermore, during instances when solar radiation is absent, and the outdoor temperature falls below a designated threshold (15°C), the shades are closed to prevent heat loss arising from radiation. The determination of the outdoor temperature threshold is based on a sensitivity analysis. During unoccupied times and weekends, the shades are opened if solar radiation is detected and the outdoor temperature is below 15°C (Figure 4).
Functionality level 4: The highest level of shading control functionality defined is known as predictive control. The control scenario developed for this level closely mirrors the preceding scenario, with the main difference lying in its approach during unoccupied periods. During these intervals, shading conditions are determined based on forecasts of the average outdoor temperature for the upcoming workday’s occupied hours. The developed control algorithm utilizes the temperature of the following day from the weather data file as the predicted temperature. In this approach, if solar radiation is detected and the predicted outdoor temperature is projected to be lower than a predetermined threshold (18°C), the shades will be open to harness solar heat gain. Conversely, if the predicted temperature surpasses this threshold, the shades will be closed to decrease the cooling load during the following occupied hours. In cases where solar radiation is not identified and the anticipated air temperature is lower than the specified value, the shades will be shut to prevent heat loss (Figure 4).
Controlling scenarios of window operation
Developed controlling scenarios for window operation.
Functionality Level 0: This level includes manual window operation or only fixed windows. Two specific scenarios have been developed to correspond with this level. In the first scenario, the windows have been considered fixed, and all ventilation occurs through mechanical systems (Win-1). In the second scenario (Win-2), the windows can be opened by the occupants. In accordance with the building’s operational strategy, when the external temperature ranges from 15 to 24°C, the mechanical ventilation system within the perimeter zones is deactivated. Subsequently, occupants are informed via traffic lights to proceed with window openings. Guided by these conditions, the second scenario of control involves the deactivation of the mechanical ventilation system within perimeter zones, and the opening of windows within the outdoor temperature range of 15 to 24°C. To prevent discomfort for occupants in indoor spaces, windows will be closed when wind speeds exceed 9 m/s. (Figure 5). Window opening and closing control algorithms.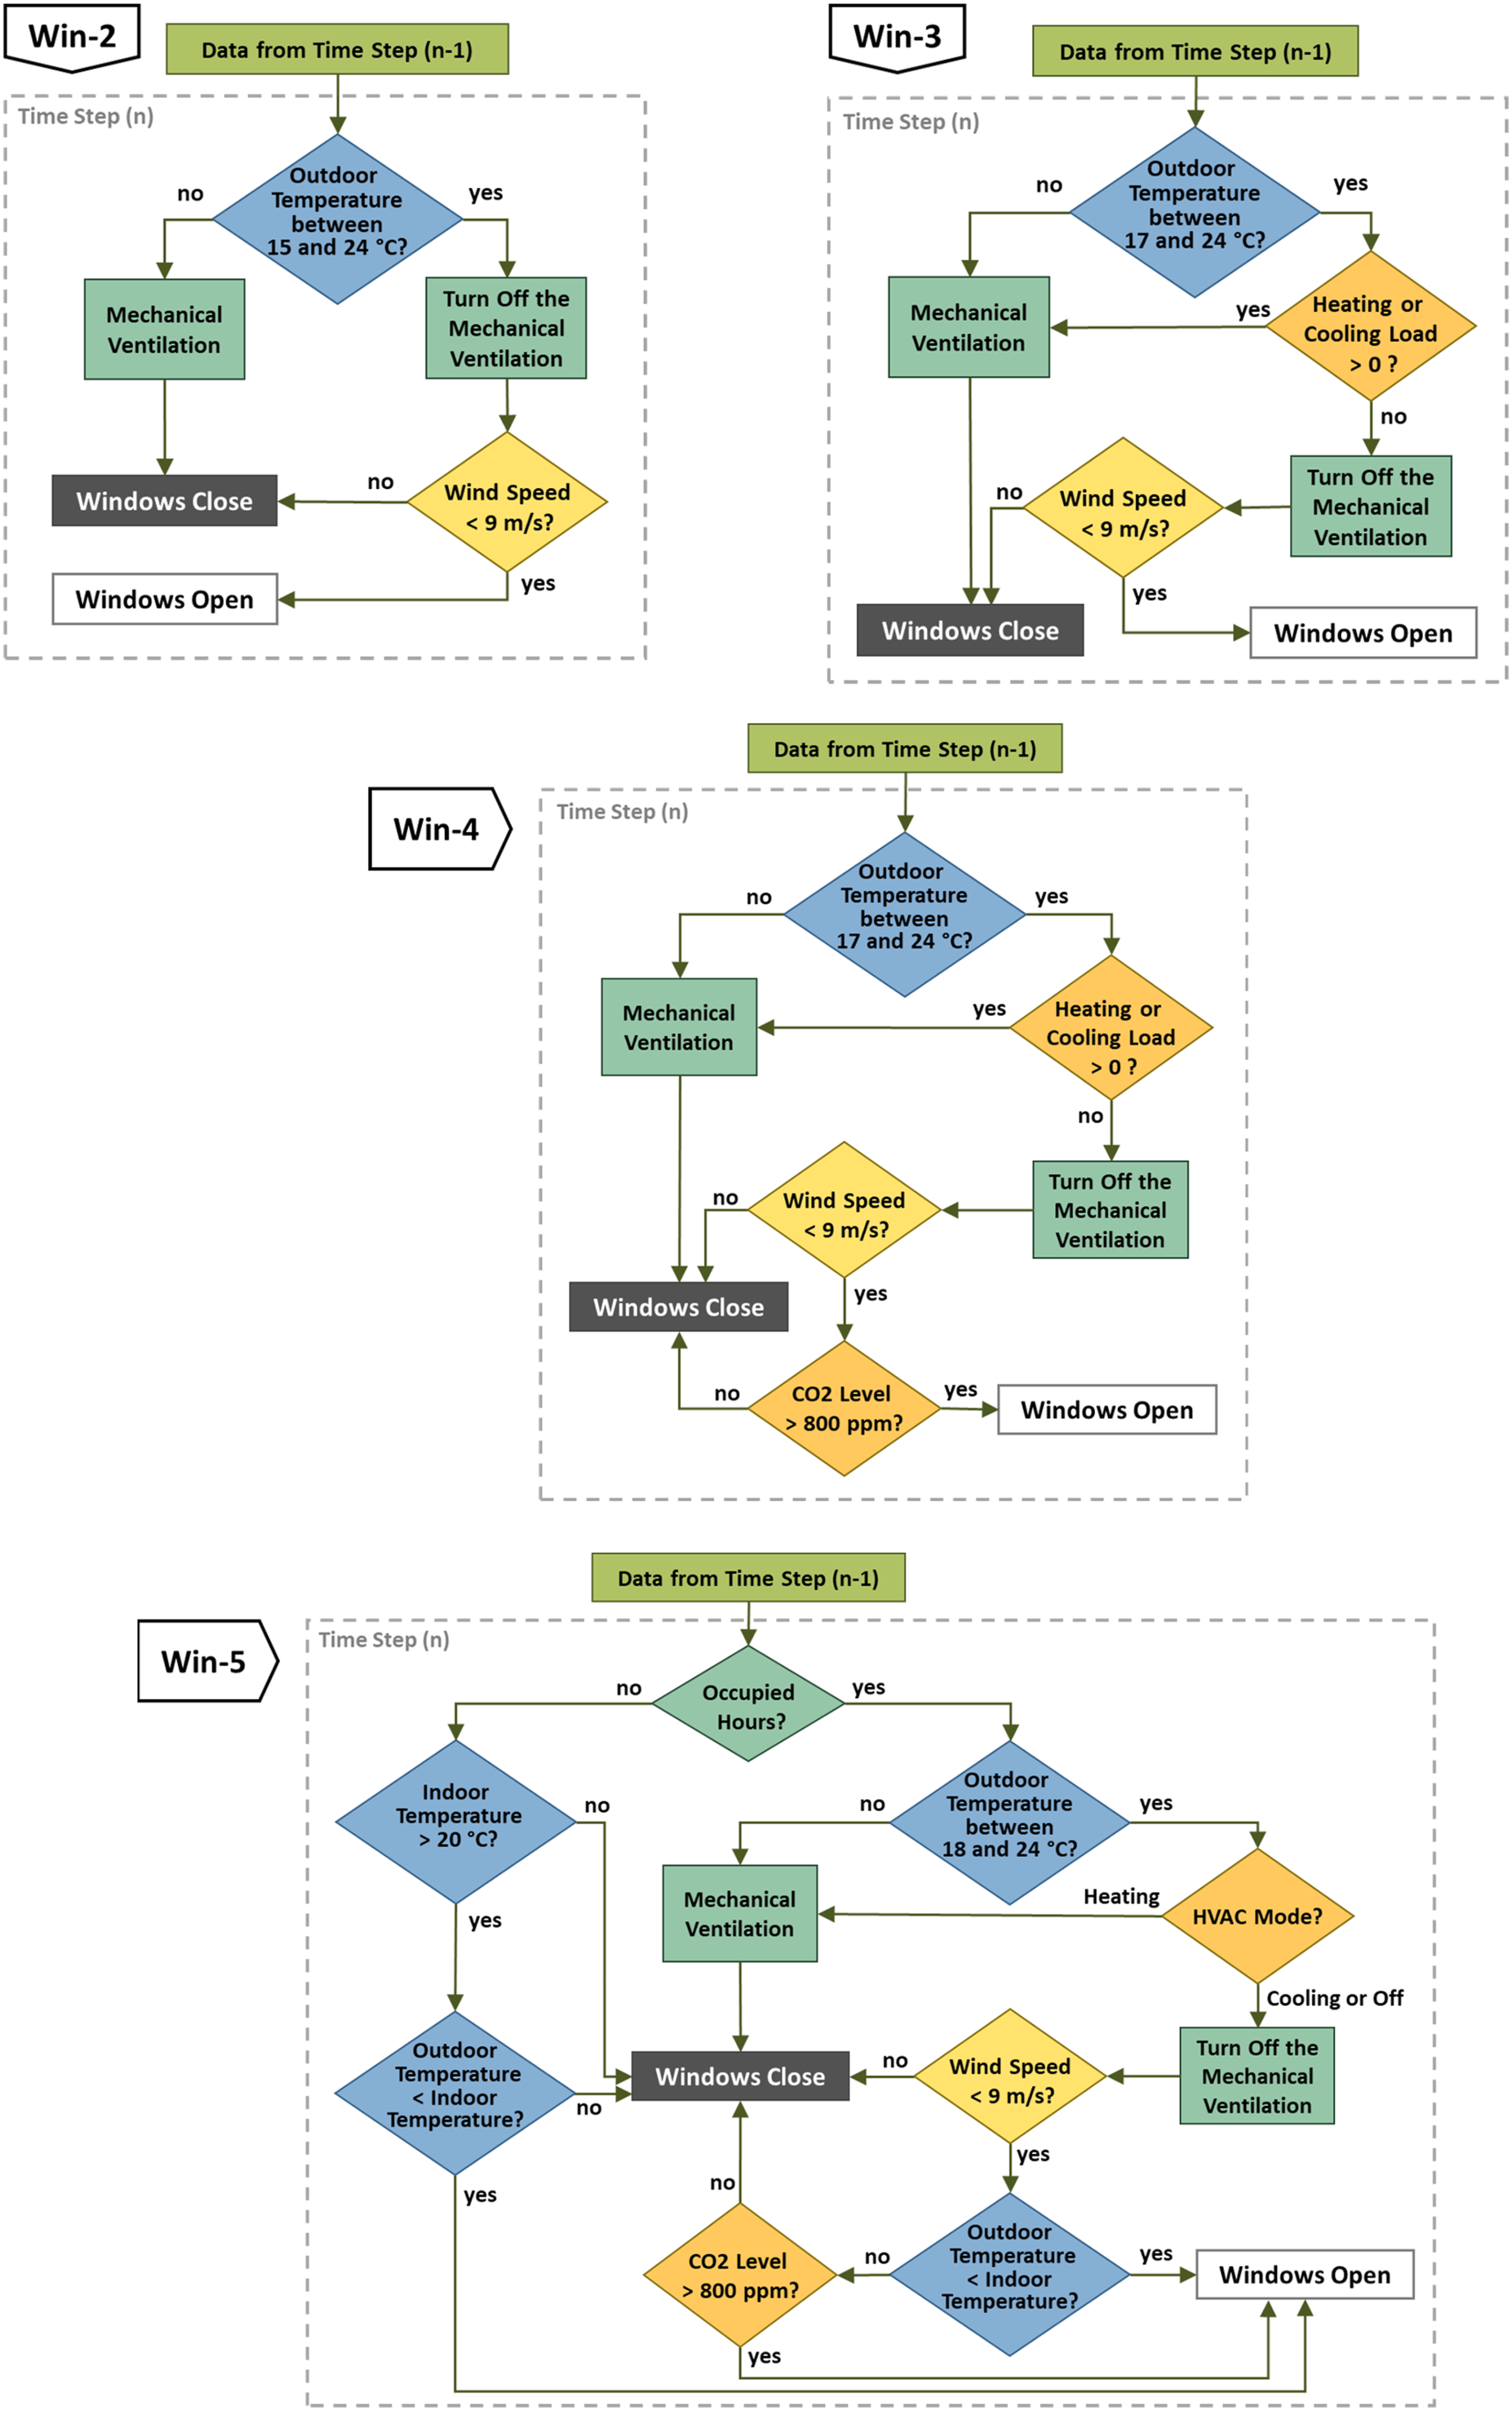
Functionality level 1: This level deals with windows open/closed detection to shut down heating or cooling systems. In the simulation, the ideal load calculation technique was applied to ensure maintenance of the internal temperature within the designated comfort range. Consequently, the option to deactivate the heating and cooling system while a window remains open is rendered unfeasible. In addition, turning off the heating and cooling system has the potential to cause deviations in the internal temperature from the predefined comfort range. This disparity impedes a meaningful comparison between this specific scenario and others wherein the indoor temperature consistently remains within the comfort range. To address this, the designed control strategy for Functionality Level 1 (Win-3) encompasses opening windows only when the heating and cooling systems are off. Based on this scenario, during periods when the outdoor temperature ranges between 17 and 24°C, the mechanical ventilation within perimeter zones will be deactivated. Furthermore, window openings will be permitted exclusively when the heating and cooling system is inactive (Figure 5).
Functionality Level 2: This level encompasses all the features of the preceding level while introducing the automated operation of windows in response to sensor data. In developing the scenario corresponding to this functionality level (Win-4), alongside the conditions considered for windows operation in the earlier scenario, the opening of windows is restricted to periods when the indoor CO2 levels exceed 800 ppm (Figure 5).
Functionality Level 3: This level includes all the features of the previous level, along with the centralized coordination of operable windows, such as controlling windows operation to use of free natural cooling. The proposed scenario for this level (Win-5) endeavours to merge the concept of free natural cooling with the conditions established in the earlier stage. Within this scenario, two distinct strategies are considered for occupied and unoccupied periods. During occupied hours, in the case that the heating system is active, the control approach mirrors that of the preceding scenario. However, when the cooling system is active or both heating and cooling systems are inactive, the indoor temperature is compared with the outdoor temperature to harness the benefits of free cooling. If the outdoor temperature is lower than the indoor temperature, the windows are opened to enhance ventilation. However, if the outdoor temperature exceeds the indoor temperature, window opening is restricted to instances where the indoor CO2 level exceeds 800 ppm. During unoccupied periods, when the indoor temperature exceeds 20°C and the outdoor temperature is lower than the indoor temperature, the windows are opened to exploit the advantages of free cooling (Figure 5). It should be noted in all scenarios related to window operation, all windows associated with each zone operate simultaneously.
Results
The case study building underwent an assessment based on the SRI. As illustrated in Figure 6, the building achieved a total SRI score of 43.1%. In general, the installation of a Building Management System (BMS) resulted in high impact scores across all impact criteria, except for the energy flexibility and storage criterion. The low score in this particular criterion can be attributed to the lack of communication between the grid and the building’s control systems. Furthermore, it is important to note that the energy flexibility and storage criterion carries a weight of 33% in the overall building score. Consequently, despite obtaining high scores in other impact criteria, the building’s total score remains relatively low. Case study building’s SRI assessment result.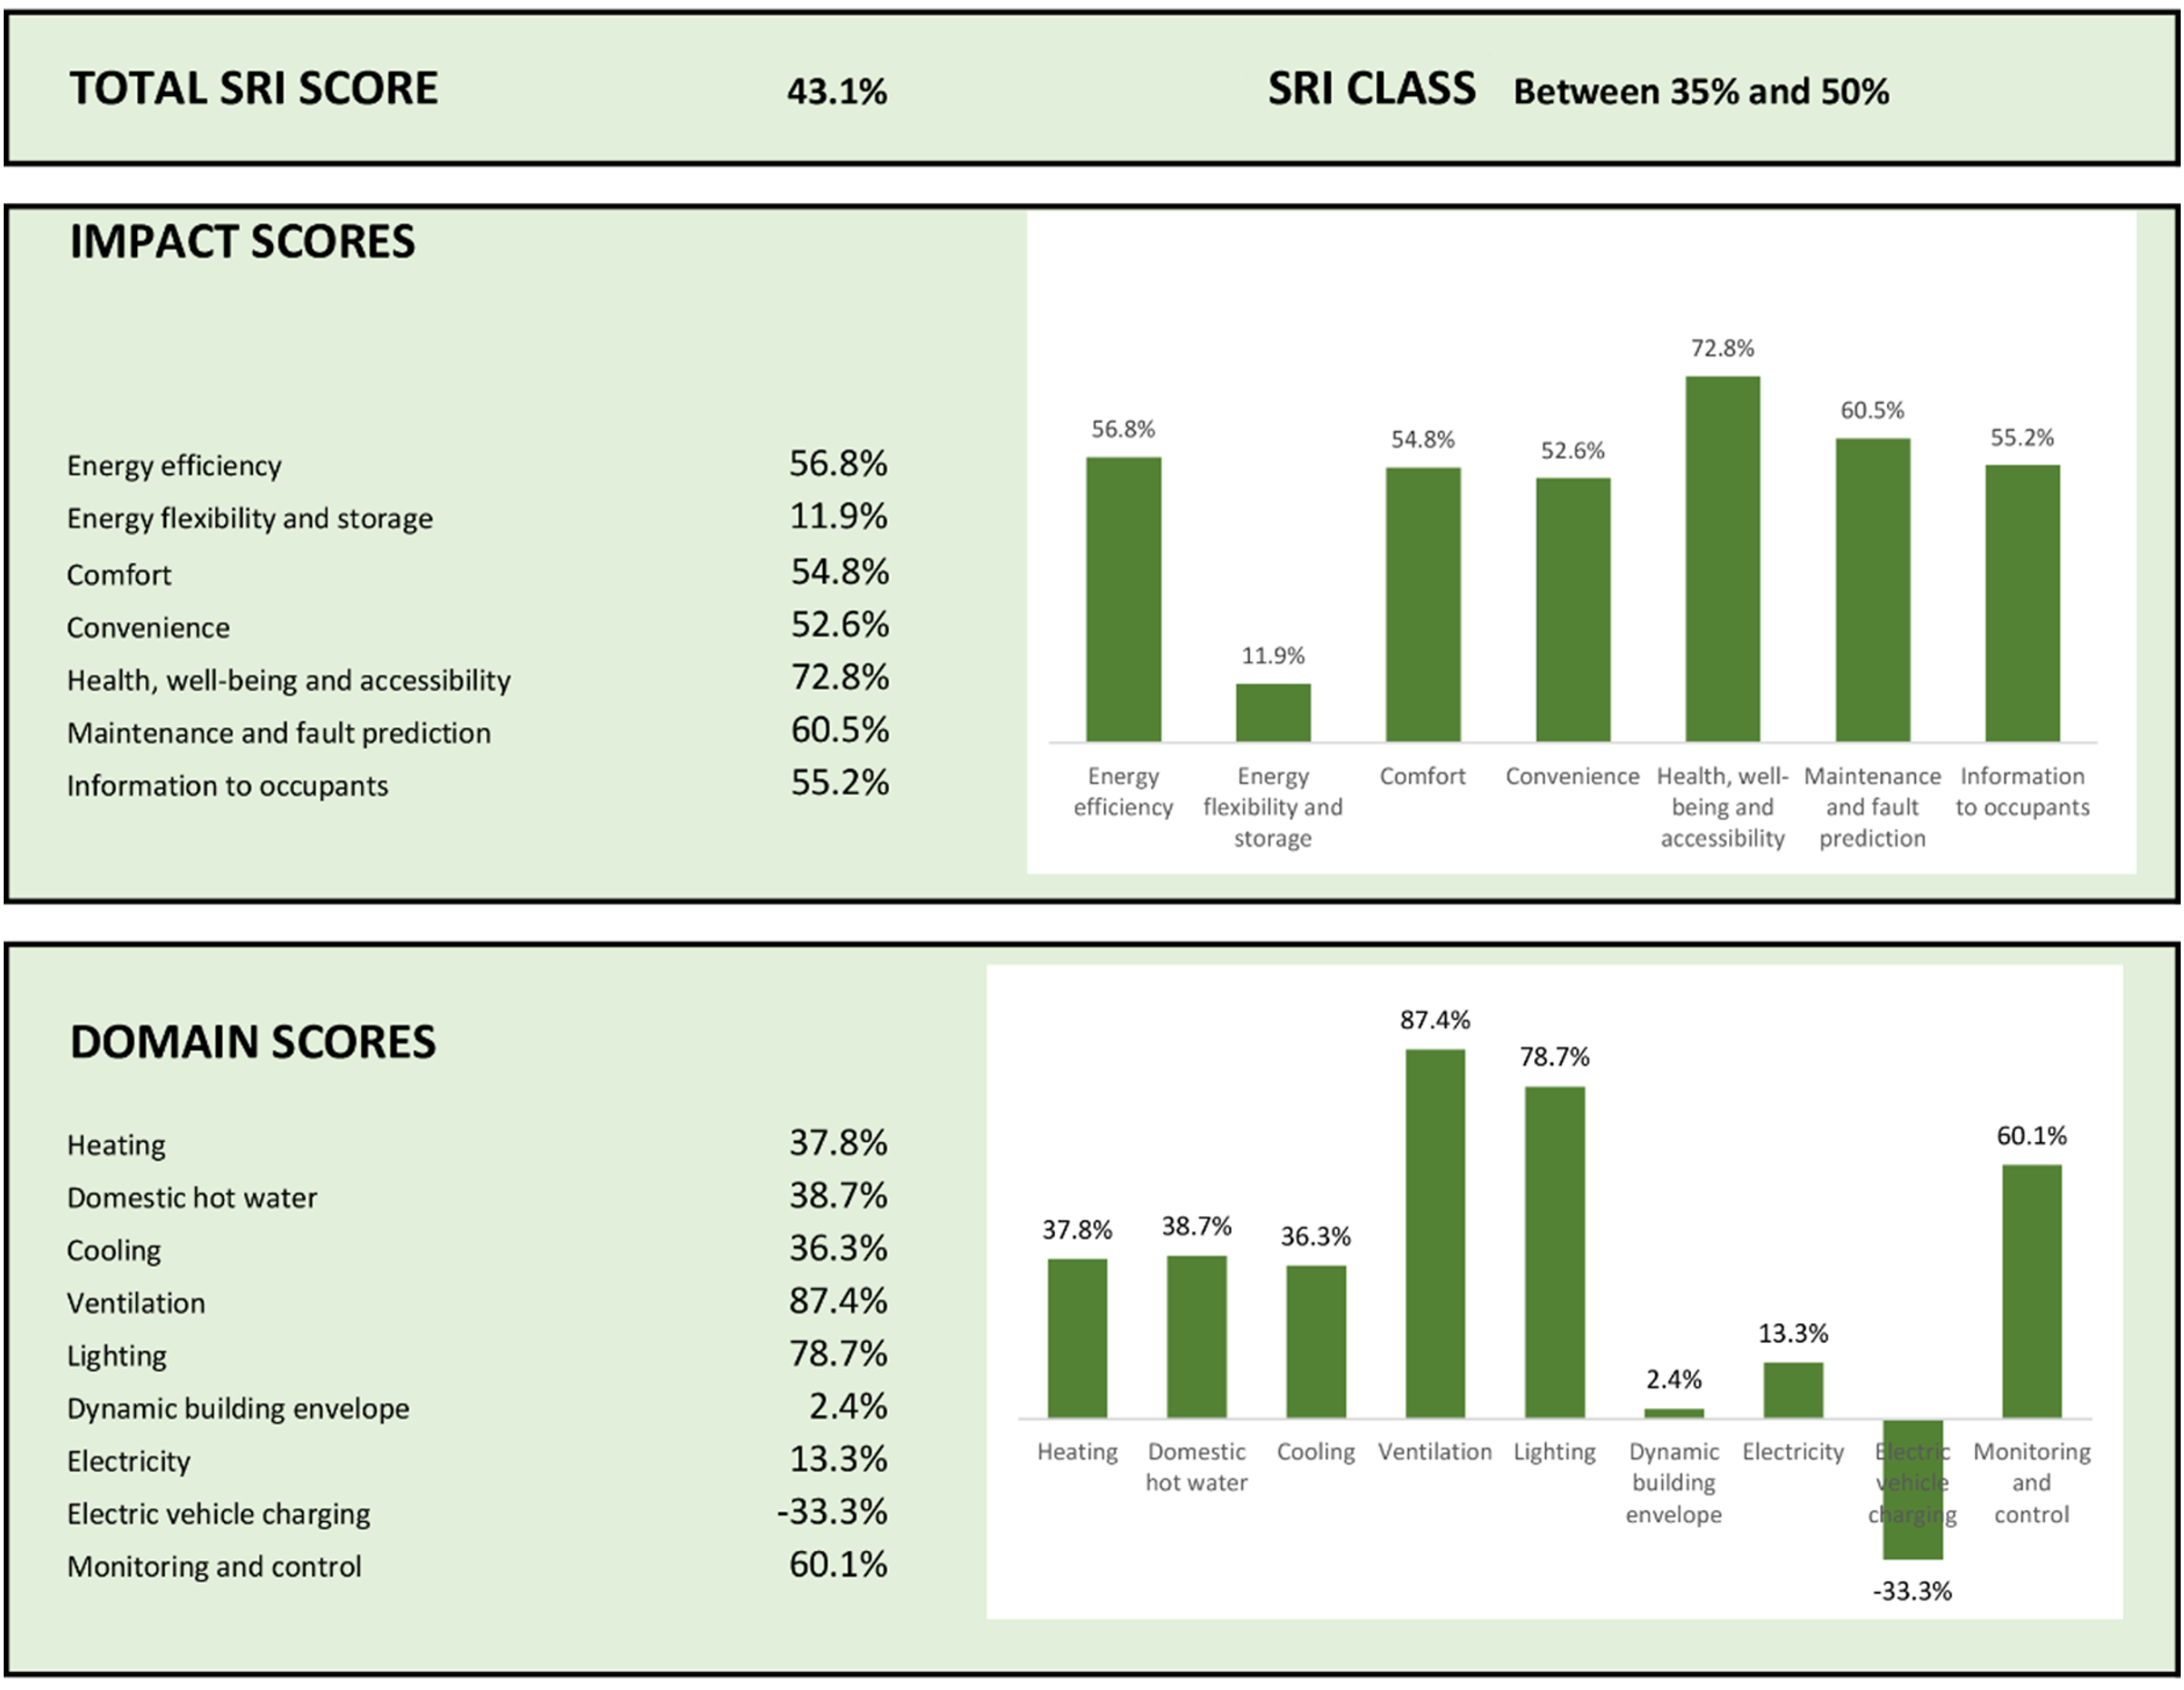
Given that the primary aim of this study is to investigate how changes in services related to the dynamic envelope impact both the building’s SRI score and its overall performance, an in-depth analysis of the implications of adjustments to the functionality levels of services within this domain was conducted. It is important to note that in the SRI scheme, certain services may be deemed not applicable to a particular building. In such instances, these services are not considered in the calculation of the maximum obtainable score. The impact of these specific conditions on the building’s SRI score, as well as the effects of modifications in the functionality levels of services related to the dynamic envelope domain, was examined in more detail.
Case study building’s SRI score with different functionality levels in services related to the dynamic envelope.
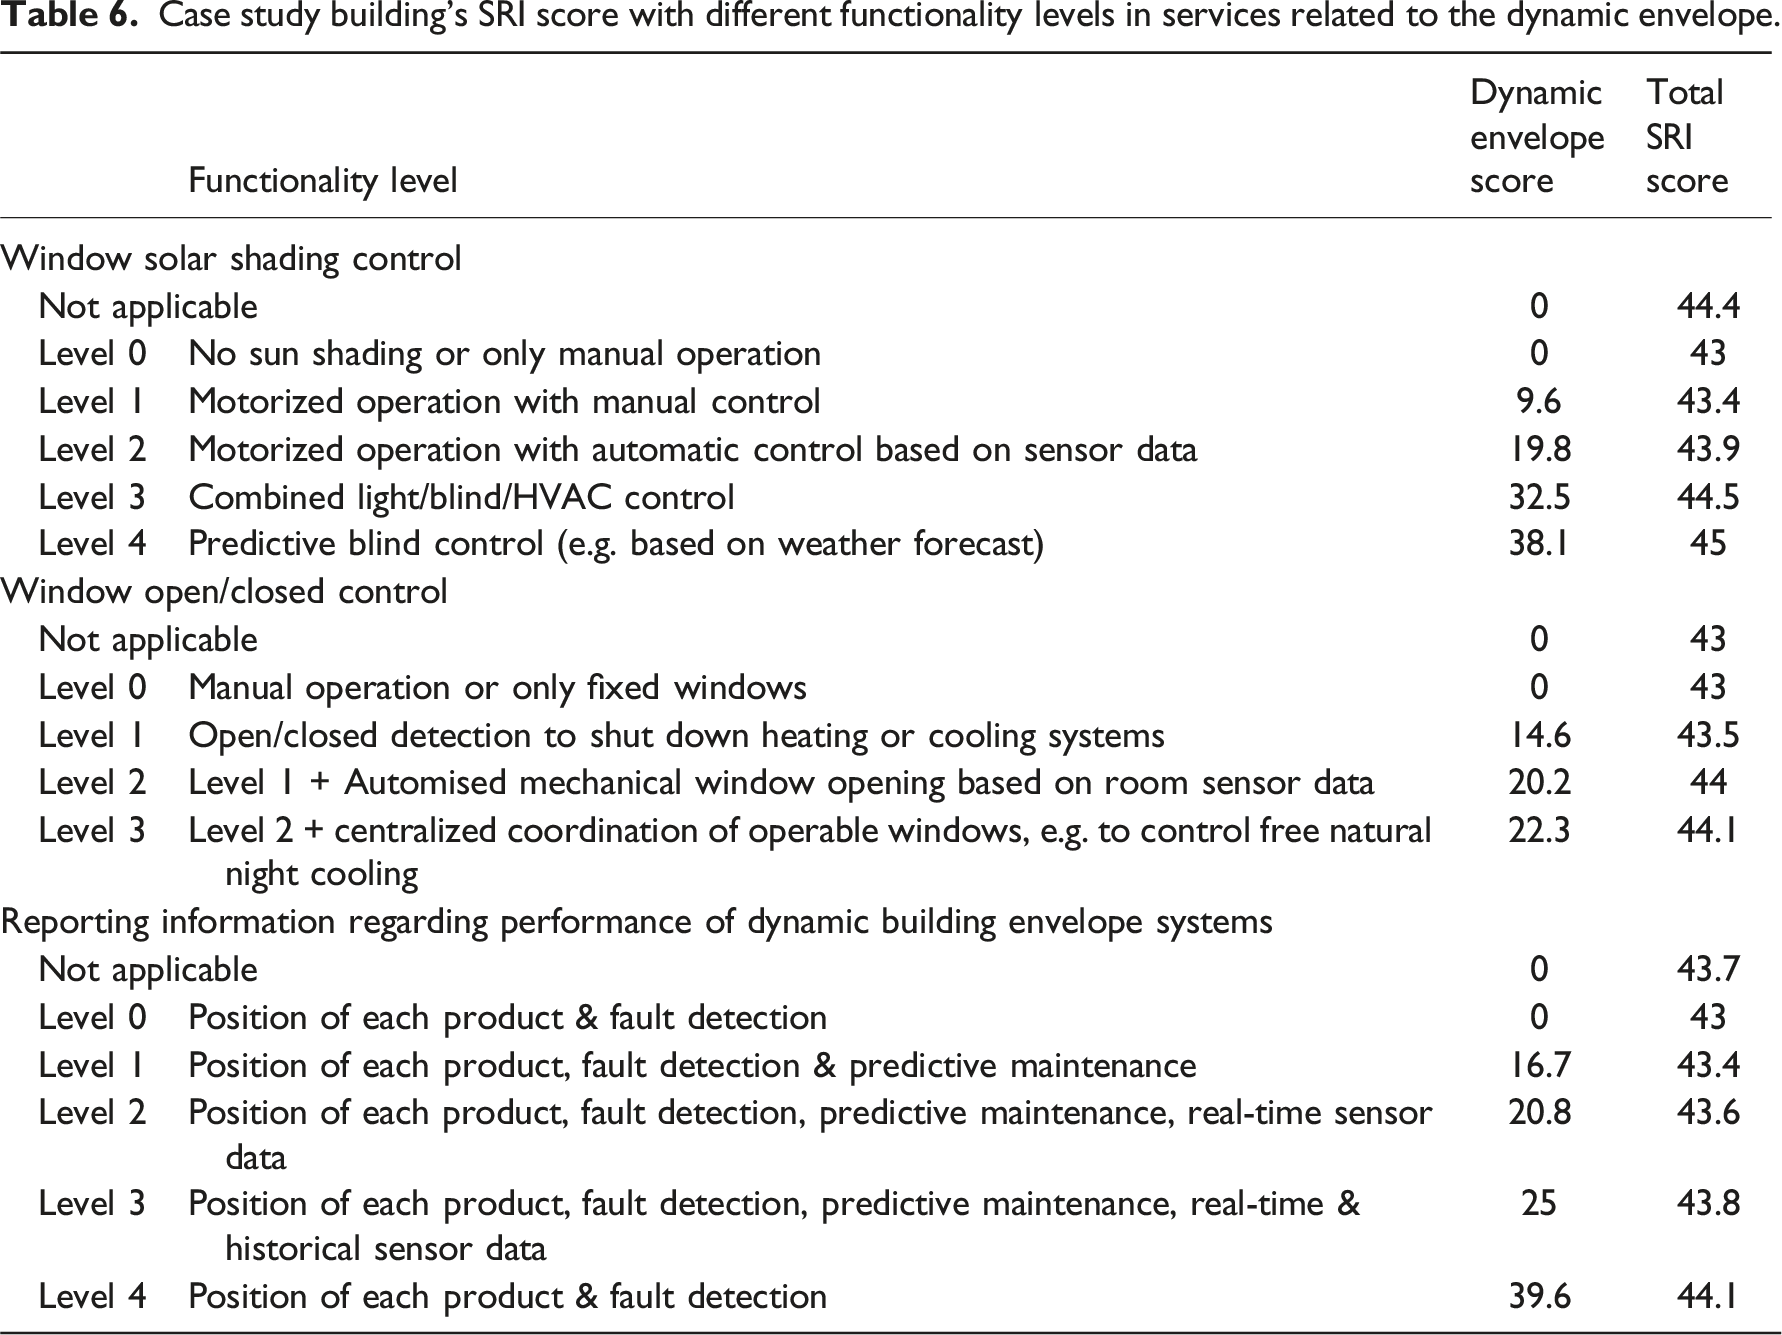
Regarding the service related to window opening and closing control, it is crucial to emphasize that, unlike the previous service, it has an influence on the total attainable score even when considered as not applicable to the building. Consequently, selecting the “not applicable” option results in the building’s total score remaining at 43%, which is identical to the situation when the functionality level of the service is set at level 0. However, when the functionality level for window operation control is elevated from level 0 to level 3, the total score of the building increases from 43% to 44.1%.
When evaluating the service related to reporting information regarding the performance of dynamic building envelope systems, like the shading control service, it can be categorized as “not applicable.” In such a case, the overall SRI score of the building will be approximately the same as the situation where the building is equipped with a reporting system set at functionality level 3. The highest achievable score for the building, assuming it has a level 4 functionality for this service, would be 44.1%.
In total, the collective impact of the services related to the building dynamic envelope domain on the overall SRI score of the case study building amounts to 4.1%. In other words, if the building has a functionality level of 0 for all three services pertaining to this domain, its score will be 43%. However, if it achieves the highest functionality level in these services, the total score of the building will increase to 47.1%. It’s important to note that this level of impact is specific to the building under consideration because each building can have a distinct maximum obtainable score based on the applicability of the services. Accordingly, the impact of this domain on its overall score will vary.
To assess the impact of changes in the functionality levels of services related to the dynamic envelope domain on building performance, a building simulation was conducted using the developed control scenarios. The performance metrics taken into consideration encompass heating and cooling energy demands, lighting energy, and the duration of hours when the DGI exceeds the comfort threshold. In the results, the average value of hours for six glare sensors positioned within six perimeter zones is taken into account.
In Figure 7, the results for all the developed shading control scenarios for both internal and external shades are presented. It is evident from the results that the variations in the building’s energy consumption among scenarios from the second to the fifth, which maintain relatively similar lighting comfort conditions, are not substantial. In the automated controlling scenarios, for internal shading, the energy consumption reduction in the fourth and fifth scenarios compared to the third scenario is only approximately 0.2% and 0.9%, respectively. In the case of external shading, these reductions are 1% and 2.4%, respectively. Furthermore, the SRI score of the building has increased by 0.6% and 1.1% in the fourth and fifth scenarios, respectively, when compared to the third scenario. The simulation results and SRI score of the building in different shading control scenarios with internal (Int) and external (Ext) shadings.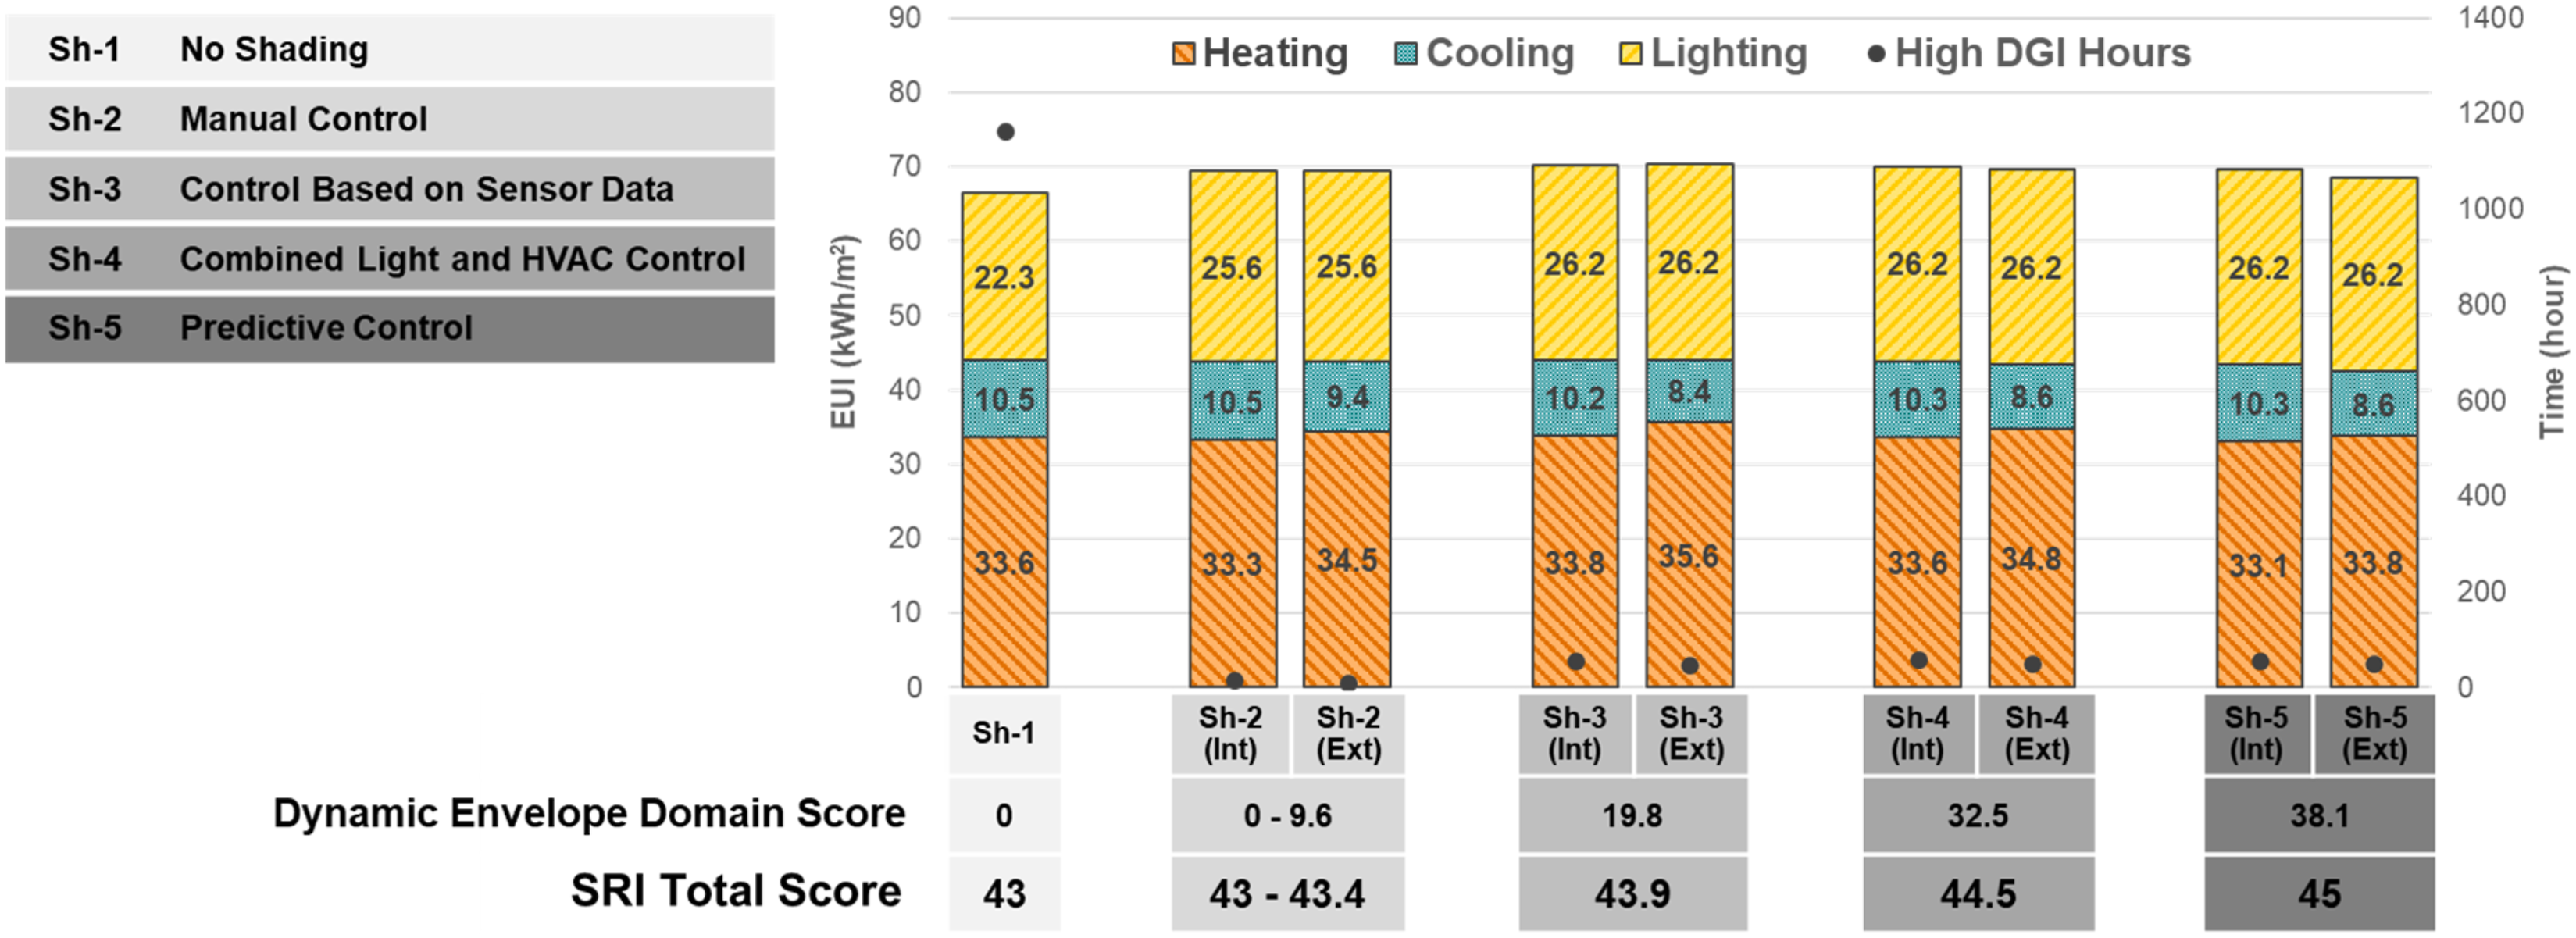
In the second scenario, which involves manual control, it is noteworthy that energy consumption is lower than in the automatic control scenarios. This can be attributed to the assumption made about occupant behaviour in controlling the shading devices. The assumption is that occupants close the shading devices when the DGI within their workspace exceeds the desired threshold and open them when there is no direct sunlight on the windows. However, in reality, occupants’ behaviour includes variations and errors that can potentially increase the building’s energy consumption.
The limited impact of changes in shading control conditions on heating and cooling loads can be attributed to the passive design strategies incorporated into the case study building. The building’s design includes features such as reduced glazing area on sun-facing facades and a relatively low window G-value of 0.27, which minimises the entry of solar radiation into the indoor environment.
To evaluate the impact of window characteristics on the efficacy of solar shading strategies, simulations were conducted specifically for windows with higher G-values. Two window types with elevated G-values were included in the simulations. Figure 8 displays the outcomes from these simulations alongside those for the current building (Glaz1). It is evident that in scenarios employing manual shading control strategies, the energy consumption across buildings with different window types is quite similar. However, when employing shading controls with higher functionality levels, the reduction in building energy consumption is more pronounced for windows with higher G-values. For instance, in Glaz1, the building’s energy consumption in the Sh-5 scenario of internal shading is nearly identical to that in the manual control scenario (Sh-2). In contrast, the comparison between these scenarios in Glaz2 shows a 1.3% decrease in energy consumption, and for Glaz3, this reduction increases to 2.9%. Moreover, employing external shading amplifies this energy consumption reduction at higher functionality levels. For Glaz2 and Glaz3 with external shading, the energy consumption in the Sh-5 scenario is 3.1% and 4.2% lower than in the Sh-2 scenario, respectively. The simulation results and SRI score of the building with different window glazing in different shading control scenarios with internal and external shadings.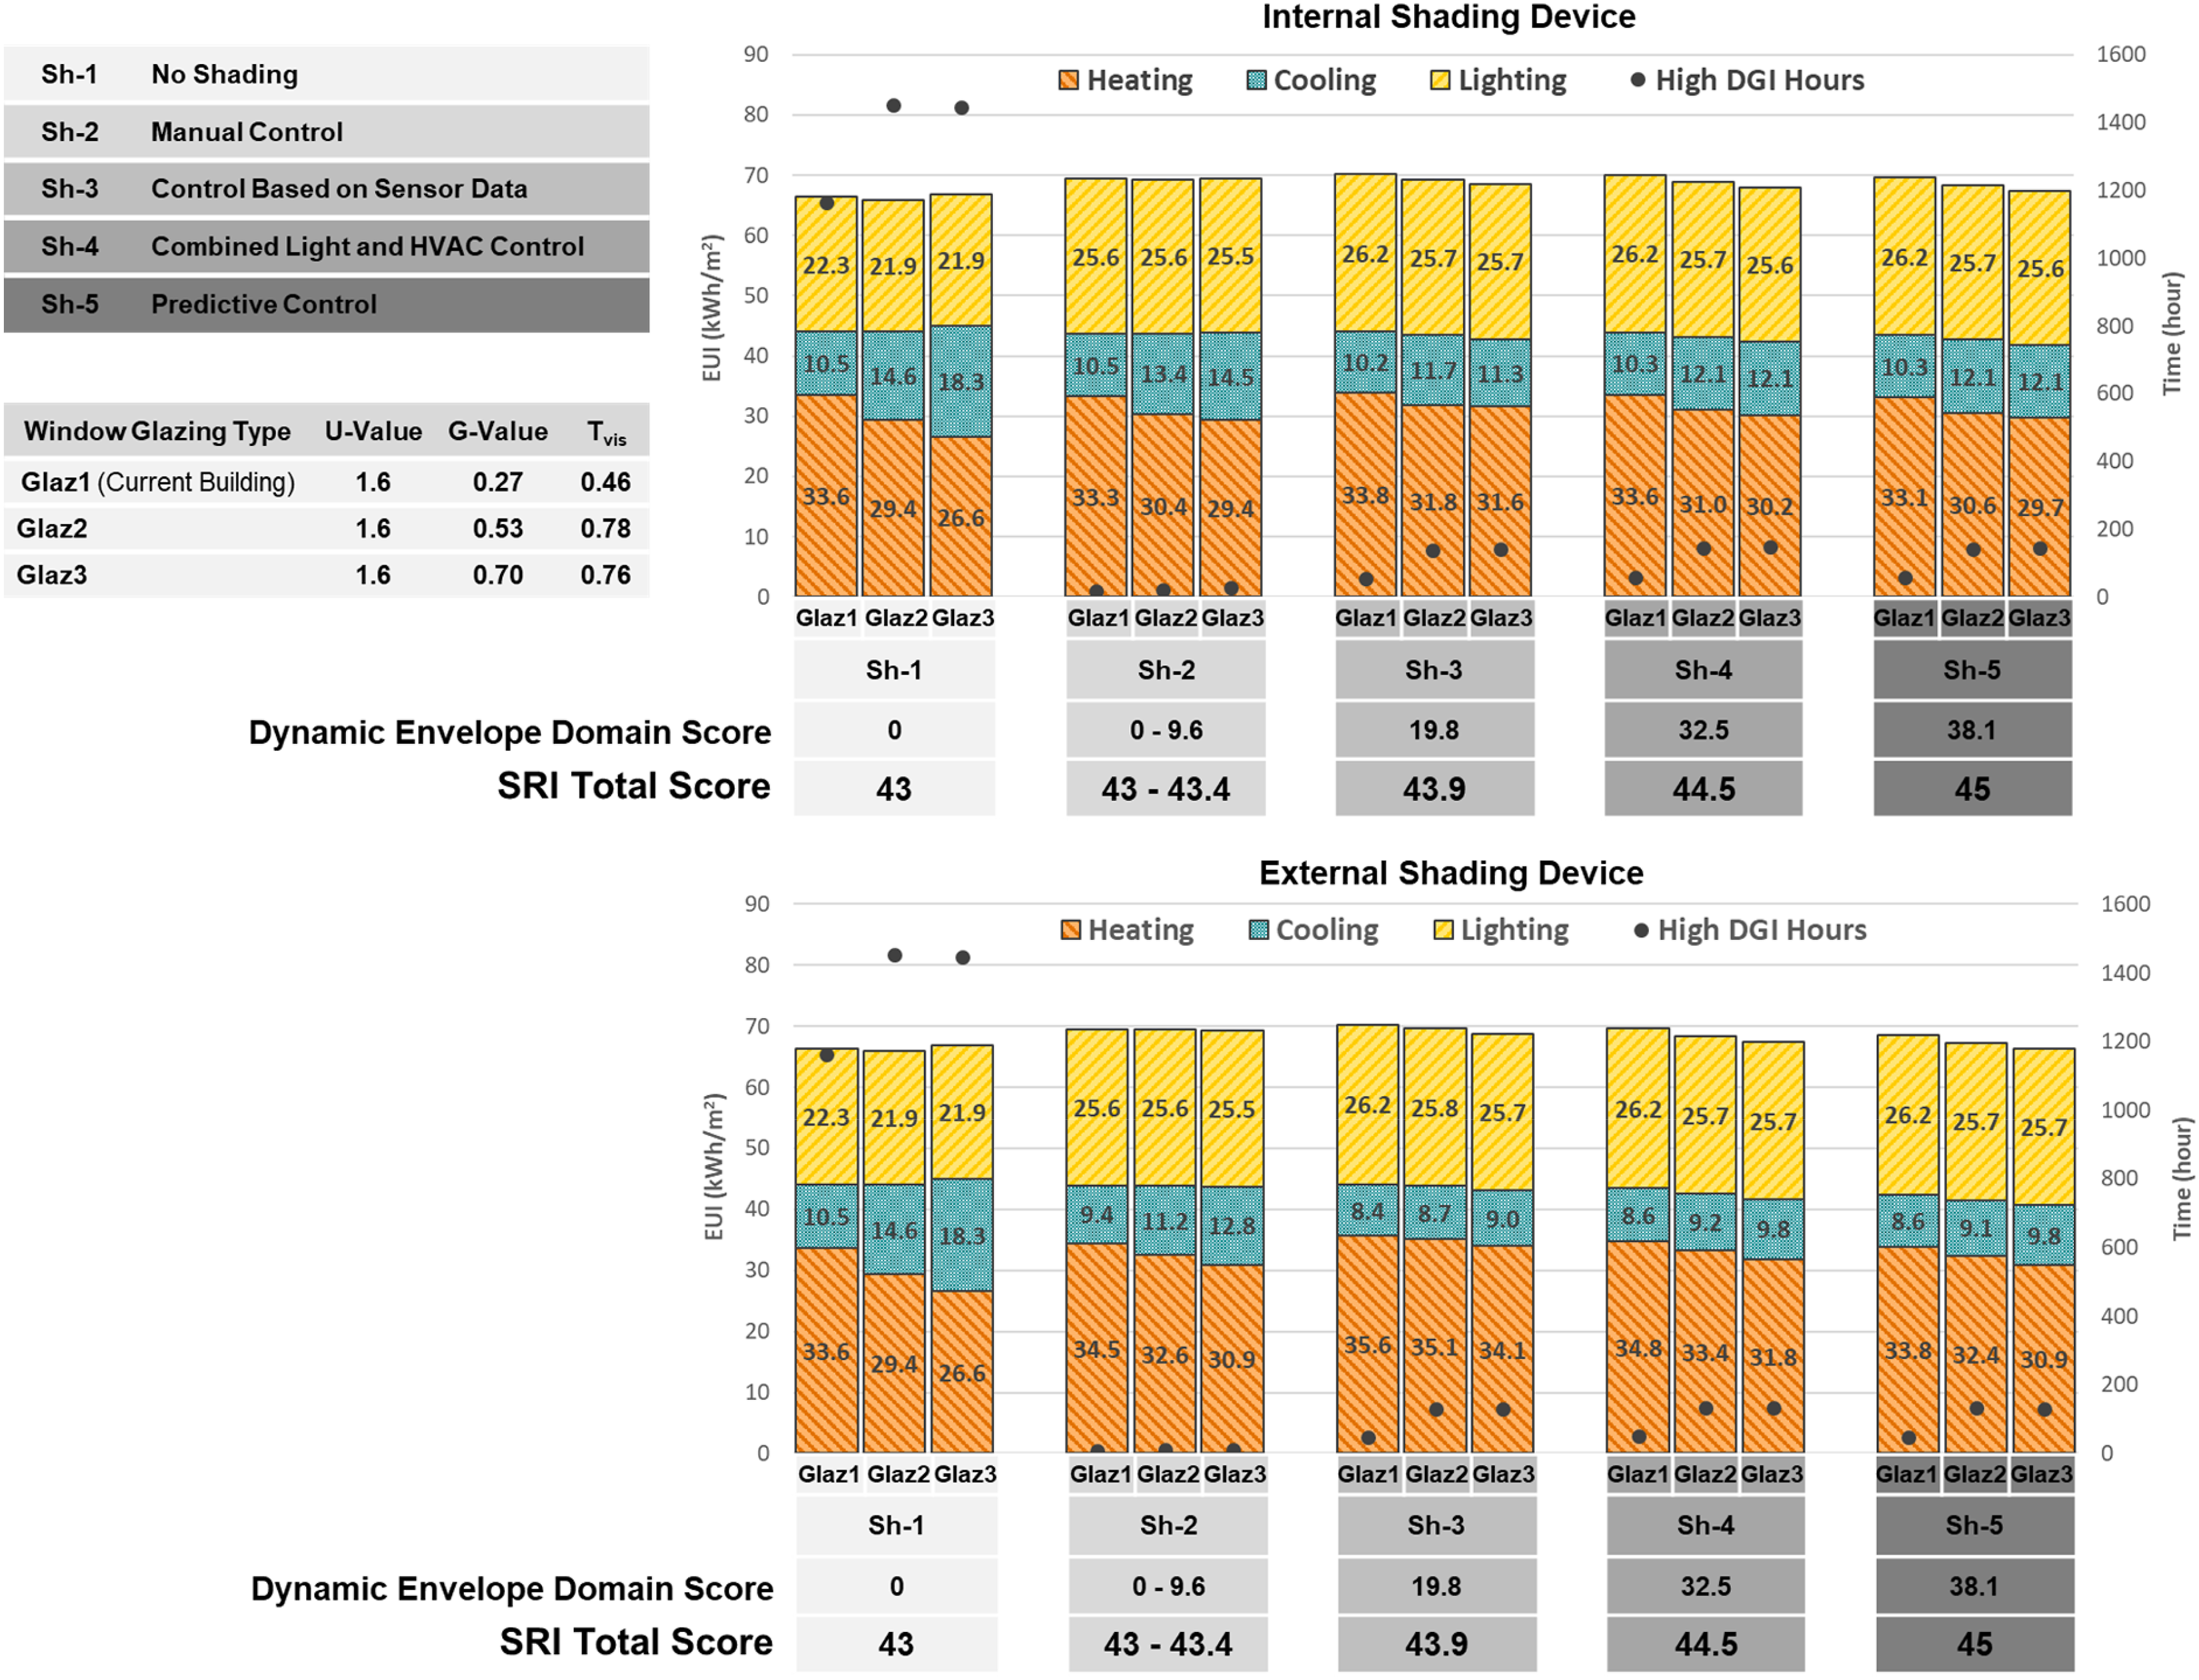
Figure 9 displays the results of the energy performance of the building for various scenarios of window opening and closing control. In the first scenario, which involves fixed windows, the consistent and limited mechanical air change rate results in a low heating load but a notably high cooling load. In the second scenario, where windows are controlled manually, there has been a significant reduction in cooling load compared to the fixed window scenario. This reduction is related to an increase in the air change rate and the utilisation of free cooling. However, this increased air exchange rate has caused a notable rise in heating load. Consequently, the total energy demand in the second scenario surpasses that of the first scenario. It’s worth noting that the results do not account for the electricity consumption of the fans in the mechanical ventilation system. This factor could have an impact on the overall building energy consumption. The simulation results and SRI score of the building in different window opening-closing control scenarios.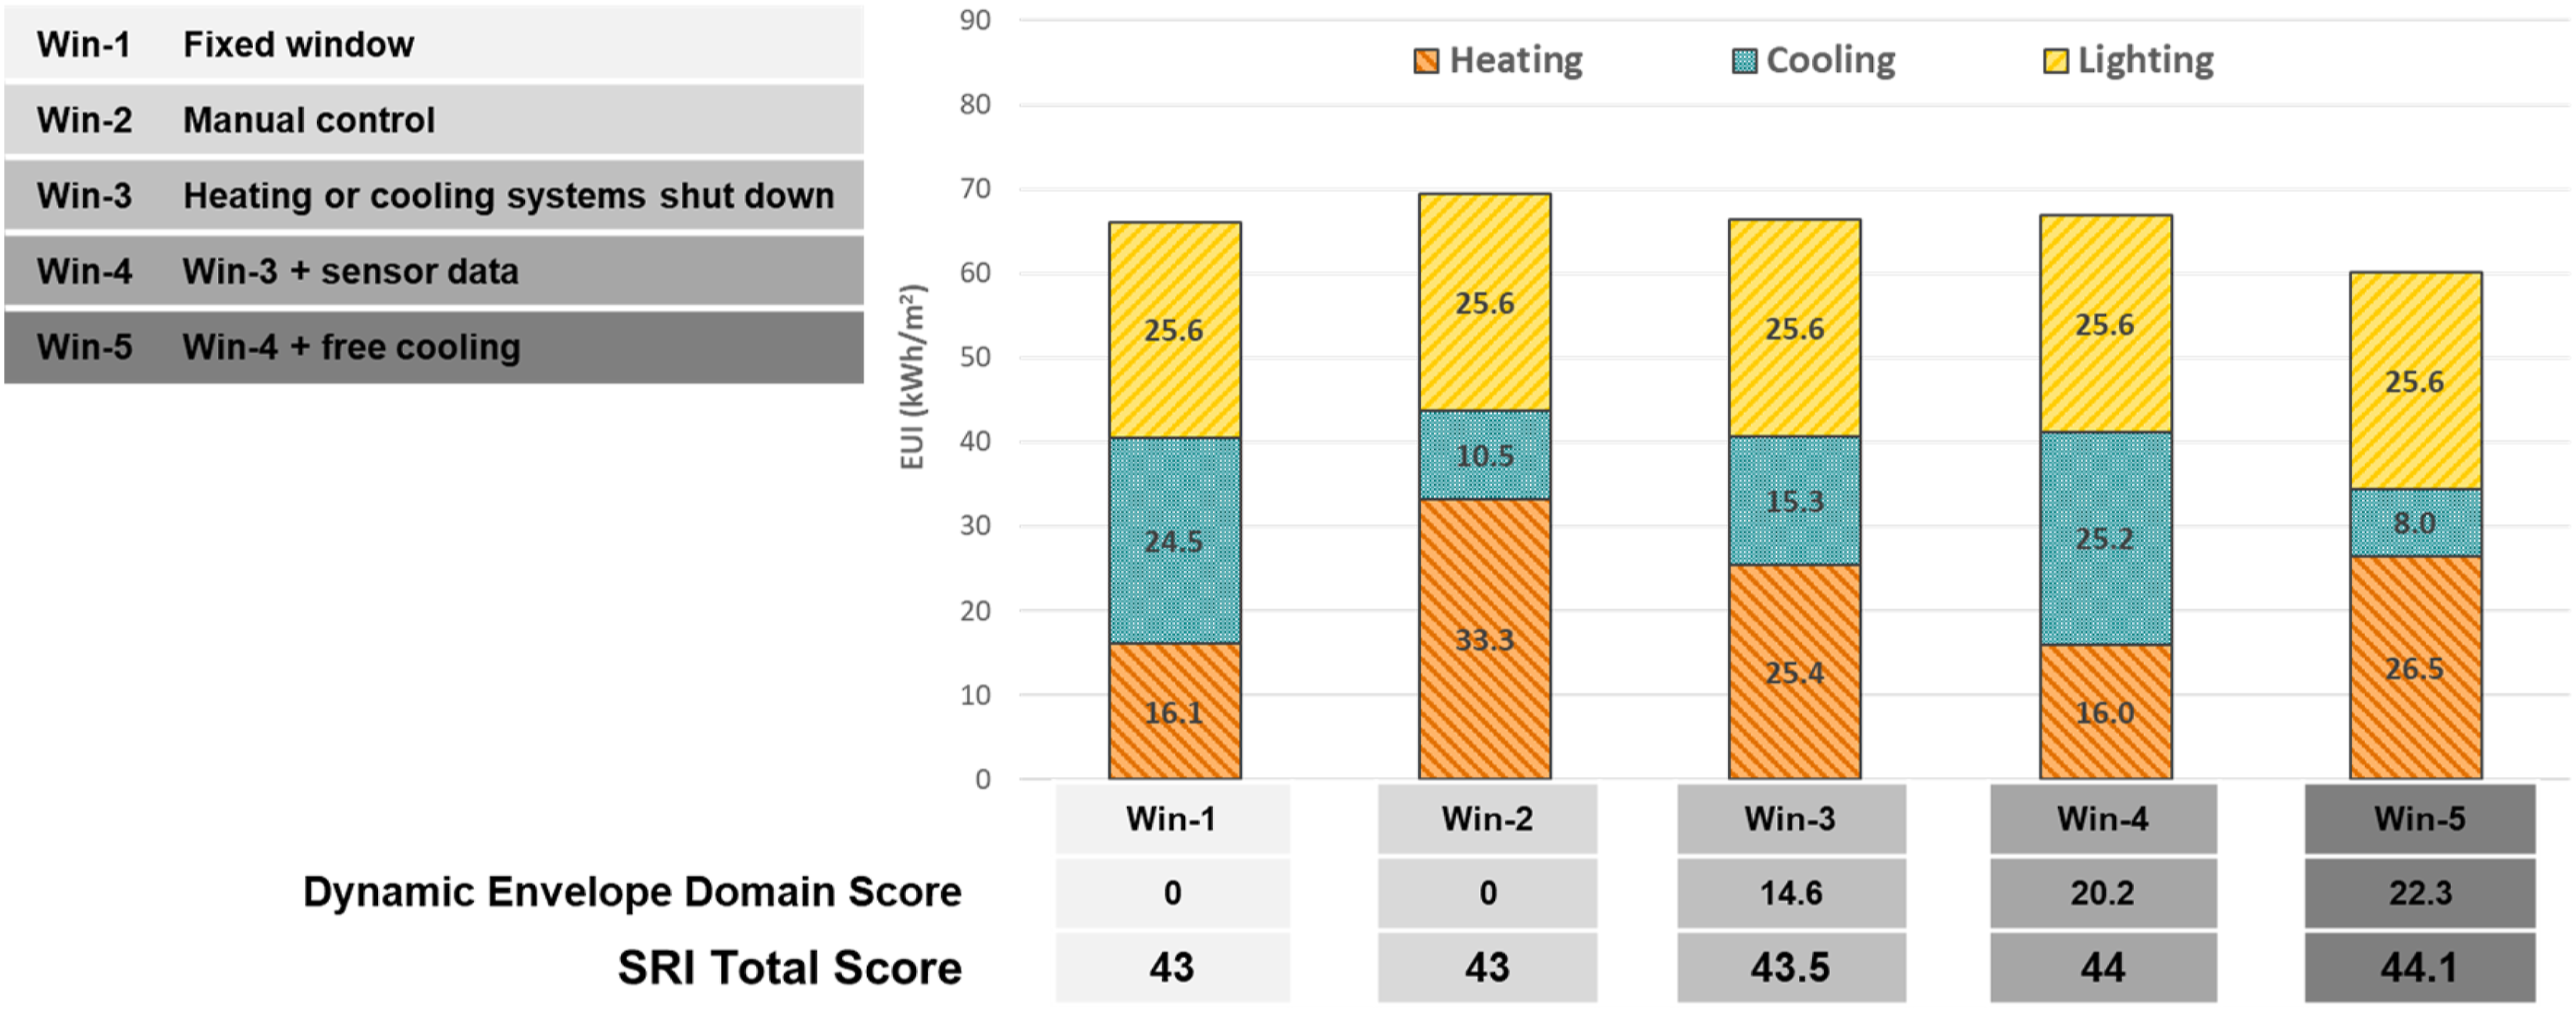
In the third scenario, where window operation is automatically controlled and limited to times when the heating and cooling systems are not active, energy demand decreases by approximately 8% compared to manual control. This reduction is accompanied by an increase in cooling load and a decrease in heating load.
In the fourth scenario, where window opening is restricted to conditions where indoor CO2 levels exceed acceptable levels, the total energy demand is more than in the third scenario, despite a 1.5% higher SRI score. In this scenario, the reduction in window opening time leads to a decreased heating load, but it also results in an increased cooling load due to reduced utilization of free cooling.
The approach in the fifth scenario is to maximise the utilisation of free cooling. As evident from the results, the cooling load in this scenario is lower compared to other scenarios. The total energy demand in this scenario is 24.2% less than in the manual control scenario and approximately 17.6% less than in the third scenario. Despite the substantial impact of the window opening and closing control strategy on the building’s energy performance, the shift in the building’s total SRI score from the lowest functionality level of this service to the highest functionality level is only 1.1%.
Discussion
The primary aim of developing building assessment systems, such as existing building energy assessment systems or green building rating systems, is generally to facilitate the comparison of the performance of different buildings. However, based on findings from previous studies,7,9 the triage method used in the SRI system complicates this comparison. The difficulty arises because each building’s score is calculated based on its unique maximum obtainable score. For instance, a building with fewer applicable services and high functionality levels in those services might achieve a higher score than a building that offers the same services at the same functionality levels but also includes additional services with lower functionality levels, even though it is equipped with more smart services. As a result, variations in the maximum attainable scores of different buildings make it impractical to compare their overall SRI scores.
Another consequence of employing the triage method in the SRI is that for some services, choosing “not applicable” in the SRI assessment process can yield a higher score than adding a service with a low functionality level (as shown in Table 6). This approach may encourage designers to omit certain services in cases where achieving the highest functionality level is not possible. Moreover, in some cases, the defined functionality levels are unclear, and the assessor’s interpretation can affect the results. For example, the first functionality level of “Window solar shading control” is defined as “No sun shading or only manual operation”. If a building lacks shading devices, the assessor has two options: classify the service as “not applicable” or use the first functionality level, since the definition includes no shading. These two options lead to different SRI scores.
The results suggest a lack of significant correlation between SRI dynamic envelope scores and the building’s actual performance. This inconsistency may be attributed to the fact that other metrics related to comfort, convenience, and health and well-being could be defined but have not been considered in this study. However, even when focusing solely on the energy efficiency impact criterion and comparing it to the building’s projected energy performance, the variation in energy performance can differ from the changes in the energy efficiency impact criterion. For instance, in the window opening and closing control service, the energy efficiency scores for functionality levels one to three are the same, with a value of 2. The differences in the total scores of these functionality levels are instead related to other impact criteria, such as comfort and convenience. This implies that, according to the SRI methodology, these functionality levels are considered equivalent in terms of energy efficiency. However, as shown in the results (Figure 9), changes in the functionality levels of this service can lead to a considerable difference in the building’s energy performance.
Moreover, changes in the energy efficiency impact criterion and SRI score do not necessarily translate to improvements in the building’s energy performance. In the case study building, modifications to the shading control functionality level had no significant impact on energy performance, even though the energy efficiency criterion score for this service varied from 0 to 3. The ineffectiveness of high-level shading control strategies in the case study building can be attributed to its envelope design. As demonstrated in the results (Figure 8), factors such as window specifications and the placement of shading (whether internal or external) can influence the performance of solar shading devices. This suggests that the building’s design can entirely negate the effectiveness of advanced smart services.
In general, while the case study results revealed a discrepancy between the building’s SRI score and its actual performance, studies on other buildings may yield different outcomes. The findings indicate a correlation between building design and the performance of dynamic envelope smart services, suggesting that any design changes can impact the performance of buildings equipped with these services. However, this does not influence the SRI score, which is determined solely by the presence of specific smart services and control strategies. Therefore, although qualitative schemes like the SRI can be useful for defining smart services and encouraging their adoption to maximize benefits, they cannot replace building performance simulations in the decision-making process.
It is also important to note that various standards and performance-based assessment frameworks, such as the Energy Performance Certificate (EPC), were developed to enhance building performance by evaluating both design and operational efficiency. However, even when considering both performance-based schemes and the SRI, achieving maximum performance remains challenging, as each framework has distinct goals and may, to some extent, reduce the benefits of the other. For example, as the results showed, using glazing with low G-value, which may be advantageous in performance-based schemes, can undermine the effectiveness of the smart shading system. Thus, while performance-based assessment schemes and the SRI each provide valuable insights, achieving maximum efficiency in smart buildings requires evaluating building performance alongside smart services and considering the interaction between smart services and building design.
Conclusion
In this study, the relationship between the Smart Readiness Indicator (SRI) score of a building and its performance was assessed, focusing on the smart services associated with the dynamic building envelope. An office building situated in London was chosen as the case study and underwent an extensive assessment using the SRI. Furthermore, its performance was assessed using dynamic simulations, considering various control strategies for movable shading devices and window operations. The performance metrics considered encompass heating and cooling energy demands, lighting energy, and the duration of hours when the DGI exceeds the comfort threshold. It is important to note that auxiliary energy consumption is not considered in this study. From the findings obtained, the following conclusions can be drawn: • In the SRI methodology, employing a triage process that holds the potential to exclude particular domains and services during the assessment procedure can modify the highest achievable score. Consequently, this alteration impacts the building’s final SRI score. Hence, the assessment approach in the SRI calculation process can influence the building’s ultimate score. • As the results from changes in dynamic envelope control strategies revealed, a high SRI score does not necessarily guarantee high building performance, nor does a low SRI score always indicate poor performance. Therefore, for more informed decision-making during the building design process, it is advisable to consider both the building’s SRI score and its projected performance simultaneously. It should also be noted that building energy performance and certain comfort metrics were used as proxies for overall building performance in this study. To more comprehensively evaluate a building’s performance, it is important to include additional metrics related to other environmental parameters. • Simply adding smart services with high functionality levels to a building does not guarantee improved performance. To achieve optimal outcomes, the building’s design must be carefully integrated with these systems and their control strategies. e.g., for shading devices to perform optimally, building design parameters such as window size and properties (e.g., U-value and G-value) must be considered in conjunction with the shading control strategy. • Additional research is required in exploring the interplay between architectural design and control systems, such as investigating the impact of factors like window opening size and window-to-wall ratio on the effectiveness of control strategies associated with dynamic envelope.
Footnotes
Declaration of conflicting interests
The author(s) declared no potential conflicts of interest with respect to the research, authorship, and/or publication of this article.
Funding
This research was made possible by support from the EPSRC Centre for Doctoral Training in Energy Resilience and the Built Environment, grant number EP/S021671/1, and with financial support from [EPSRC + UCL ISAD + AHMM].
Correction (February 2025):
In this article, special collection heading has been corrected from “CIBSE Technical Symposium 2024” to ‘Delivering buildings and defining performance for a net zero built environment’.