
Abstract
Smart thermostats allow continuous learning, remote scheduling and control of indoor temperature. This paper empirically evaluates indoor environmental conditions, occupant experiences and prevalence of summertime overheating in three low-energy dwellings with smart thermostats and compares the results with three similar dwellings with standard programmable thermostats. The study uses building performance evaluation methods combining time-series data on temperature, relative humidity and window opening with survey data on occupant perception of thermal comfort and heating control over the period 2019–2020. While there was little difference observed in the measured and perceived indoor temperatures between dwellings with and without smart thermostats, the six dwellings were different in the way they heated their homes and controlled their indoor environment. A wide indoor temperature range of 16oC–22oC was observed in dwellings with smart thermostats during the heating season. The majority of dwellings also experienced summertime overheating with temperatures in bedrooms going up to 34oC. Individual heating preferences dominated the use of smart or standard thermostats ranging from Cool Conserver, On-off Switcher to On-demand Sizzler. It is vital that energy models consider a range of heating preferences to avoid a gap between expectation and reality. Practical application: Actual in-use performance of dwellings with smart thermostats is necessary for their large-scale deployment. A wide range of thermostat behaviours are documented; therefore, it is vital that energy models consider a range of heating preferences to minimise the gap between energy models and reality. As smart home appliances and controls become more commonplace, the findings demonstrate their need for resident training and trouble-shooting support to ensure smart thermostats deliver their expected benefits. Since most of the case study dwellings experienced summertime overheating, it is also vital that building design tackles overheating through passive measures.
Introduction
The UK government is committed to achieving a legally binding target of net zero greenhouse gas emissions throughout the UK economy by 2050 1 ; furthermore, they have set into law the world’s most ambitious emissions target of a 78% reduction by 2035 compared to 1990 levels. 2 Efforts made to achieve this to date have included improving consumer advice, improving gas boiler standards, phasing out the installation of fossil fuel heating in areas not on the gas grid, developing the details for the 2025 release of the Future Homes Standard and encouraging more control over energy use through smart technologies. 1 In addition, exploratory research projects and voluntary standards3,4 have successfully driven the development of more advanced levels of fabric and system efficiency in housing beyond UK building regulations.
As one measure to decarbonise the housing sector through fabric and systems in new dwellings, the UK government recently completed a Future Homes Standard consultation which assessed future proofing of new dwellings through high levels of energy efficiency and integration of low carbon heating. 5 The Future Homes Standard is set for 2025, but consultation recommended incrementally moving towards the Standard by ramping up UK Building Regulations through conservation of heat and power, ventilation and renewables. The principle is to improve the fabric performance of new dwellings as much as possible to avoid the need for short-term retrofitting of the fabric which can be more costly and disruptive. 6
Furthermore, the UK government is focussing on ways to reduce the carbon emissions from heating demand throughout the 2020s as only about 5% of the UK’s total heat demand in buildings is currently met by low carbon sources.7,8 Currently, 2% of residential heating is provided by district heating networks; whereas, the target is 24% by 2050. 8 The Committee on Climate Change (CCC) recommends that from 2025 at the latest, no new homes should be connected to the gas grid. 7 Notably, the Committee on Climate Change’s 2020 Progress Report to Parliament on Reducing UK Emissions 9 recommends that electrification and district heating schemes should offer the primary route to zero-carbon heating systems. Furthermore, it is recommended that innovation support is provided for smart heating controls among other low carbon heating measures. 9
On the controls front, the UK government initiated the Boiler Plus scheme in 2018 and the Green Homes Grant scheme in 2020 (already expired). In the Boiler Plus scheme, a customer who bought a new gas combi boiler was provided with calculated insight into further measures which will enhance the efficiency of the boiler, including smart heating controls. 1 Domestic smart heating control technologies allow continuous learning for reportedly more efficient comfort, remote scheduling and control of space heating.
One energy company in the UK is using ECO funding to trial the installation of free smart thermostats for 2000 members who live in the West Midlands. The intent is to expand out to 30,000 homes. The company expects the smart thermostats to assist in reaching net zero, though no details are provided beyond the expectation that the smart thermostat would naturally reduce energy consumption. 10 A similar smart thermostat trial will be rolled out in Autumn 2021 to a second energy company’s customers who have smart meters. The intent of this trial is to allow customers to see the correlation between how the smart thermostat is operated and the resultant at-time-of-operation impact on energy consumption via their smart meter. 11
Because smart heating controls, including smart thermostats, 1 are connected directly to the internet or operate via a gateway device connected to a smart meter, they can enable shifting of energy demand timing in response to price or other signals, thereby providing demand side response (DSR). As an example, California is urgently trying to integrate batteries, smart thermostats and other sources of load flexibility to participate in California’s power markets under the control of aggregators to reduce demand in anticipation of summer heatwave induced rolling blackouts like the ones that occurred in 2020. 12
Decarbonisation of heating coupled with intelligently constructed efficient fabric has the added benefit of improving thermal comfort, 8 indoor air quality (IAQ), indoor environment quality (IEQ) and reduced fuel poverty. As generally increased time indoors have also shown to cause health problems related to IAQ, 13 getting IAQ right is more important than ever. Additionally, as improved insulation and air tightness, district heating and smart thermostats become more widespread in UK households driven by policy measures and user demand, it becomes necessary to understand the actual indoor environmental conditions achieved and how residents interact with them. It is within this context that the current paper presents an evaluation of the monitored indoor environment, perceived thermal comfort and control in three new-build dwellings connected to a district heating network and in which smart thermostats were installed. The results are also compared with three dwellings located in the same development with identical construction that do not have smart thermostats installed in their homes.
Evidence to date
Smart thermostats belong to the category of energy management and control systems 14 in a broader group of technologies called smart home technologies (SHTs) which includes sensors and monitors that detect presence and environmental factors; interfaces including tablets, phones and smart meter displays; and controllable appliances such as security cameras, fridges, TVs and garage doors all networked together to enable automation and remote control of a home’s environment and experience. The range of reported benefits from SHTs include enhanced energy management, improved security, thermal comfort, healthcare provision and enhanced entertainment. 15
In contrast to the basic on/off interfaces or programable thermostats, smart thermostats allow for greater granularity of user control through highly detailed app scheduling, remote schedule changes, adaptation to occupant presence through occupancy sensors and/or geolocation software. Outside of direct user control, smart thermostats may also incorporate learning algorithms to predict occupant presence with the intent to optimise heating energy use without the occupant’s involvement in programming. 16
Consumer uptake and acceptance
One of the first long-term in-depth qualitative studies on SHTs,
17
in which two of three which were smart heating controls (one, a smart thermostat and the other a smart radiator valve), found that SHTs are not only technically disruptive but are also socially disruptive and can require adaptation from householders that may limit their use. Going into the field trial, four distinct motivations for participation were identified (in order of prevalence)
17
: 1. The desire to save energy and money, 2. Interest in new technology and home automation; what Mamonov and Koufaris
18
refer to as ‘techno-coolness’,
2
3. Overall concern for the environment (however most were sceptical of SHT’s ability to reduce energy use) and 4. Greater level of control over the home.
Over the long-term, users were found to settle into a pattern of using the SHTs less rather than going deeper into maximising the advanced functionality. Participants were concerned; however, that they were not using the systems to their full advantage and often called for help. Overall, learning to use SHTs is demanding and time-consuming and there is currently little support for the householder. 17
Reluctance for uptake has been cited as concern over greater dependence on smartphones, automation evolving into laziness, inability to control or maintain the systems, 17 concern over incompatibility with existing systems and privacy concerns. 18 Despite public and media attention on privacy and data security issues, a large market study of prospective SHT users (over 1000) in the UK found the following to be of greater concern: risks associated with increased dependence of domestic life on interconnected systems and the electricity network, and reduced autonomy. 15 The trust divide between smart meters and other SHTs appears to be the lack of clarity over value provided to householders from smart meters versus marketed SHTs and the method of smart meter rollout from energy utilities. 15
The unique security challenges in the smart home are not without evidence, however. Hernandez, Arias 19 demonstrate how one smart thermostat could be hacked to attack other devices on the local network and Kafle, Moran 20 demonstrated how they were able to remotely disable a security camera via a compromised light switch app. Overall, there appears to be a strong market potential for SHTs given the perceived value proposition for control and convenience.
Energy implications
According to three leading smart thermostat websites, energy savings can range from £115–130 per year in the UK with no evidence provided,21, 22 10–15% or $131–145 (£95–105) in the US citing three US studies 23 and up to 23% on annual energy costs when contrasted with a constant 22°C hold. 24 Based on a review of studies performed in the US, Pang, Chen 25 found potential energy savings ranging from 2–22%. However, despite the many studies, Pang, Chen 25 found the following questions unanswered: What is the impact of occupant temperature preference? How do these savings vary from region to region? and How do these savings vary based on HVAC system type?
The savings sound promising; however, according to a large literature review on smart home technology, 14 the aggregated research on smart thermostats presents as many questions as it has answers about their ability to reduce energy consumption. Furthermore, according to another large literature review on domestic heating controls, 16 there is evidence that smart thermostats may not save energy as compared to non-smart thermostats but could in fact increase energy demand. This observation is also shared by Hargreaves, Wilson. 17 In one case, a field trial in the US modelled learning algorithms of smart thermostats and demonstrated an increase in energy demand from 2–4%. However, there was a moderate quality of evidence that zoned heating controls (e.g. heating only part of the house based on presence), as opposed to whole house control, could save energy. 16
A simulation study evaluating potential energy savings for smart thermostats in the US evaluated various settings and all climate regions. The study found that adjusting the set point during unoccupied periods has a higher savings ratio in hot climates zones, though cold climates can save via this method. 25 Ultimately, the greatest savings appear to be simply a result of the depth of set point setbacks25,26 though the magnitude of savings can vary based on several external factors. For most of the cases in the US study, 2°C of setback during the occupied period could result in a 20% reduction and 40% in extreme cases. 25 One German study considered smart thermostats a beneficial low-cost investment opportunity to reduce heating energy consumption in dwellings that have a low to medium efficiency standard and can be an attractive option for tenants who have limited options for improving the energy efficiency in their home. 27
One concern from the reviews is that all field studies in smart thermostats have been over short periods of observation where long-term drifts in energy demand and potential change in occupant interest were not observed. Definitive evidence would likely require large-scale, multi-disciplinary, multi-year field trials. 16 Overall, evidence has shown that it cannot be assumed that smart systems will reduce energy consumption; however, energy savings appear to be highly dependent on the behaviour of the occupant before and after installation of the system. According to Stopps and Touchie, 26 the limitations to the smart features and the overall realisation of these savings stem from ability or willingness to correctly program the smart thermostat to maximise features and achieve savings.
Behaviour and thermal comfort implications
On studying thermostat behaviours, heating set points, length of time heated and periods of time heated are found to vary widely,
28
smart thermostats, through greater control, tend to allow these differences to diverge even more. A smart thermostat trial in 100 smart homes throughout England identified six distinct heating behaviours
28
: 1. ‘Cool Conservers’ never heat above 20°C and actively focus on keeping cooler temperatures to reduce bills; 2. ‘Hot and Cold Fluctuators’ have unpredictable heating schedules and are always adjusting their temperature (most temperature variation); 3. ‘On-demand Sizzlers’ Always like it around 23°C, sometimes as high as 26°C and never below 20°C; 4. ‘Steady and Savvy’ rarely adjust settings, only seasonally, generally maintaining temperatures between 18–20°C; 5. ‘On-off Switchers’ vary set point least (maintain 20°C), only turning heat on or off (usually from winter to summer); and 6. ‘Toasty Cruisers’ similar to ‘Sizzlers’ but maintain temperatures a little lower, between 21–22°C.
The outcome of the heating behaviour study emphasised with a high degree of confirmation that people care deeply about being warm and comfortable and less so with minimising cost; however, use of heat is highly diverse. 28 With respect to taking advantage of smart controls, two studies found smart thermostat overrides to be infrequent and for short durations.26,29 Though overrides generally were used to maintain comfortable temperatures outside of schedules or to less energy-efficient set points, the short duration of the overrides resulted in minimal energy increase. 29
As a contribution to the collection of work on the assessment of the indoor environment in new low carbon dwellings, the objective of this paper is to explore how the indoor environment varies in new low carbon dwellings with smart thermostats. The primary focus is on the environmental and occupant findings in three dwellings with smart thermostats but three additional dwellings with conventional thermostats are included to assess the difference.
Case study and methods
Case study dwellings
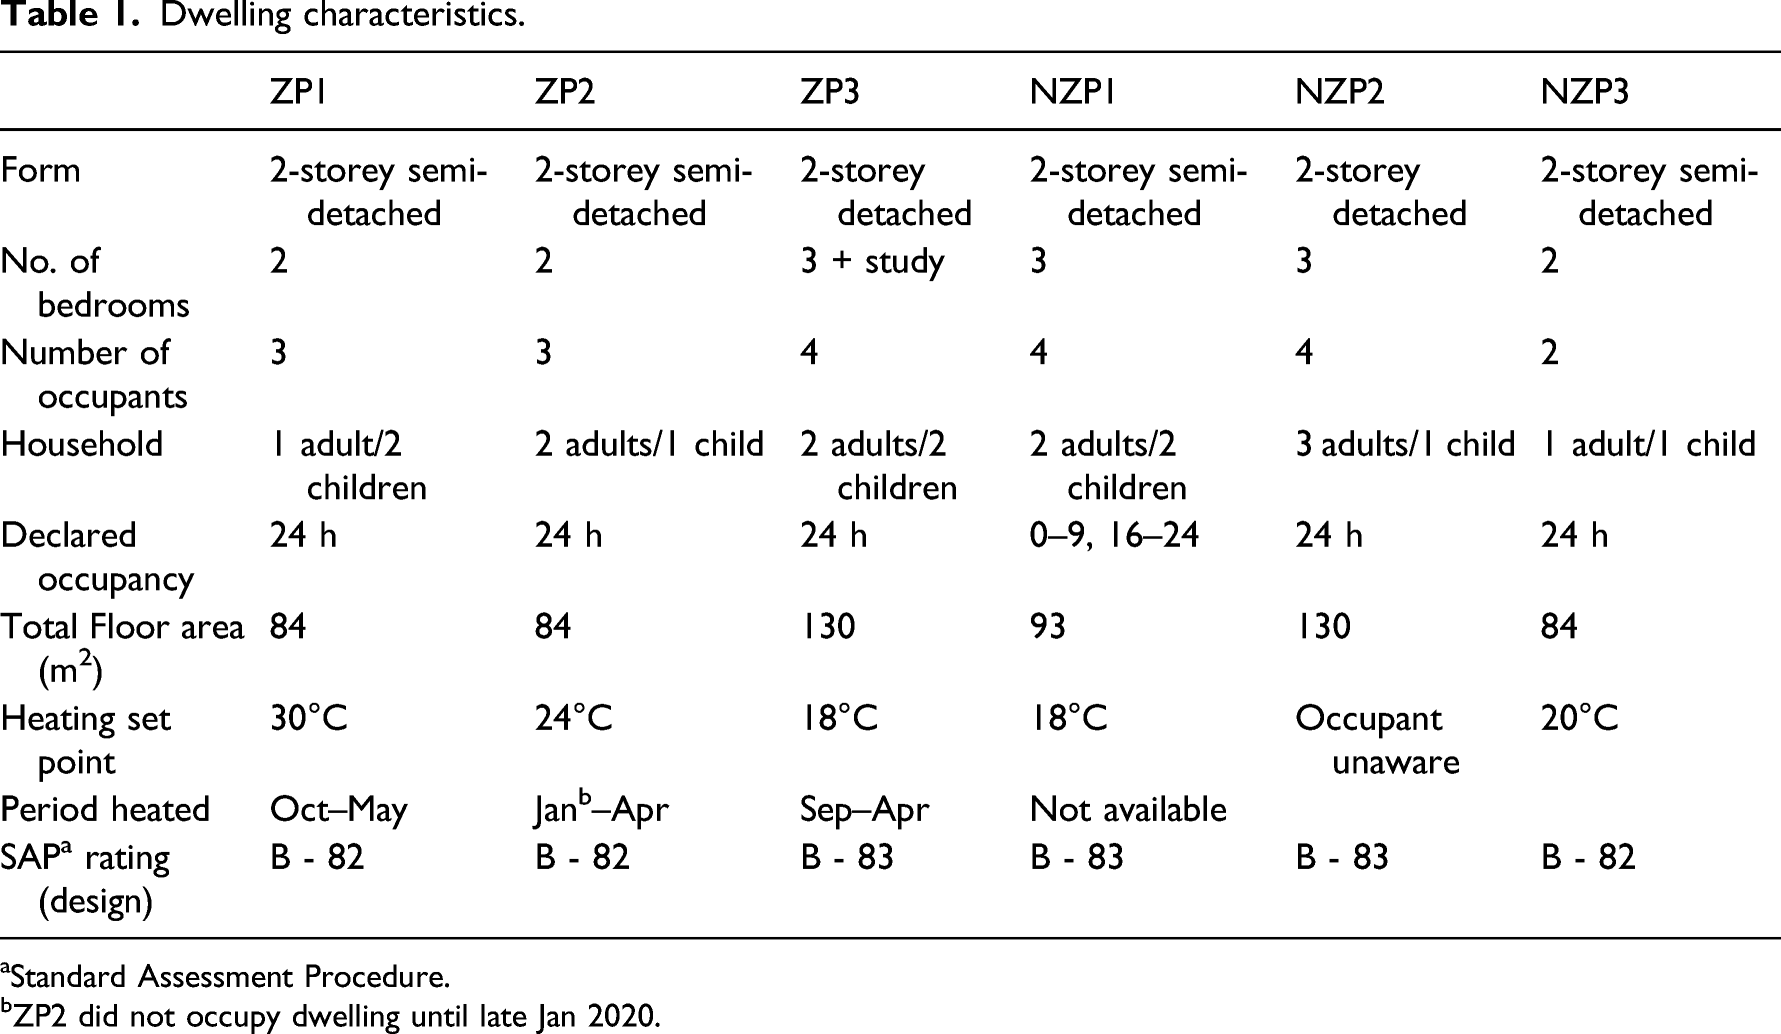
The UK case study dwellings are in a new eco-development consisting of 489 dwellings, on the edge of the city of York, England. All dwellings in the development are built to higher thermal standards (CSH 4) than typical new-build UK dwellings and are connected to a centralised district heating system. The dwelling forms are representative of typical detached and semi-detached homes found in the UK. This study will focus primarily on three case study dwellings as they had smart thermostats (Figure 1) installed and had more intensive monitoring. These three dwellings, the Zero Plus (ZP) dwellings, were constructed in 2019. Three other dwellings, non-Zero Plus (NZP), were constructed in 2016 and were equipped with standard programmable (non-smart) thermostats (Figure 1). These three dwellings will be used at times to briefly compare findings. Table 1 shows relevant characteristics for all dwellings. Smart thermostat (left) and standard programable thermostat (right). Dwelling characteristics. aStandard Assessment Procedure. bZP2 did not occupy dwelling until late Jan 2020.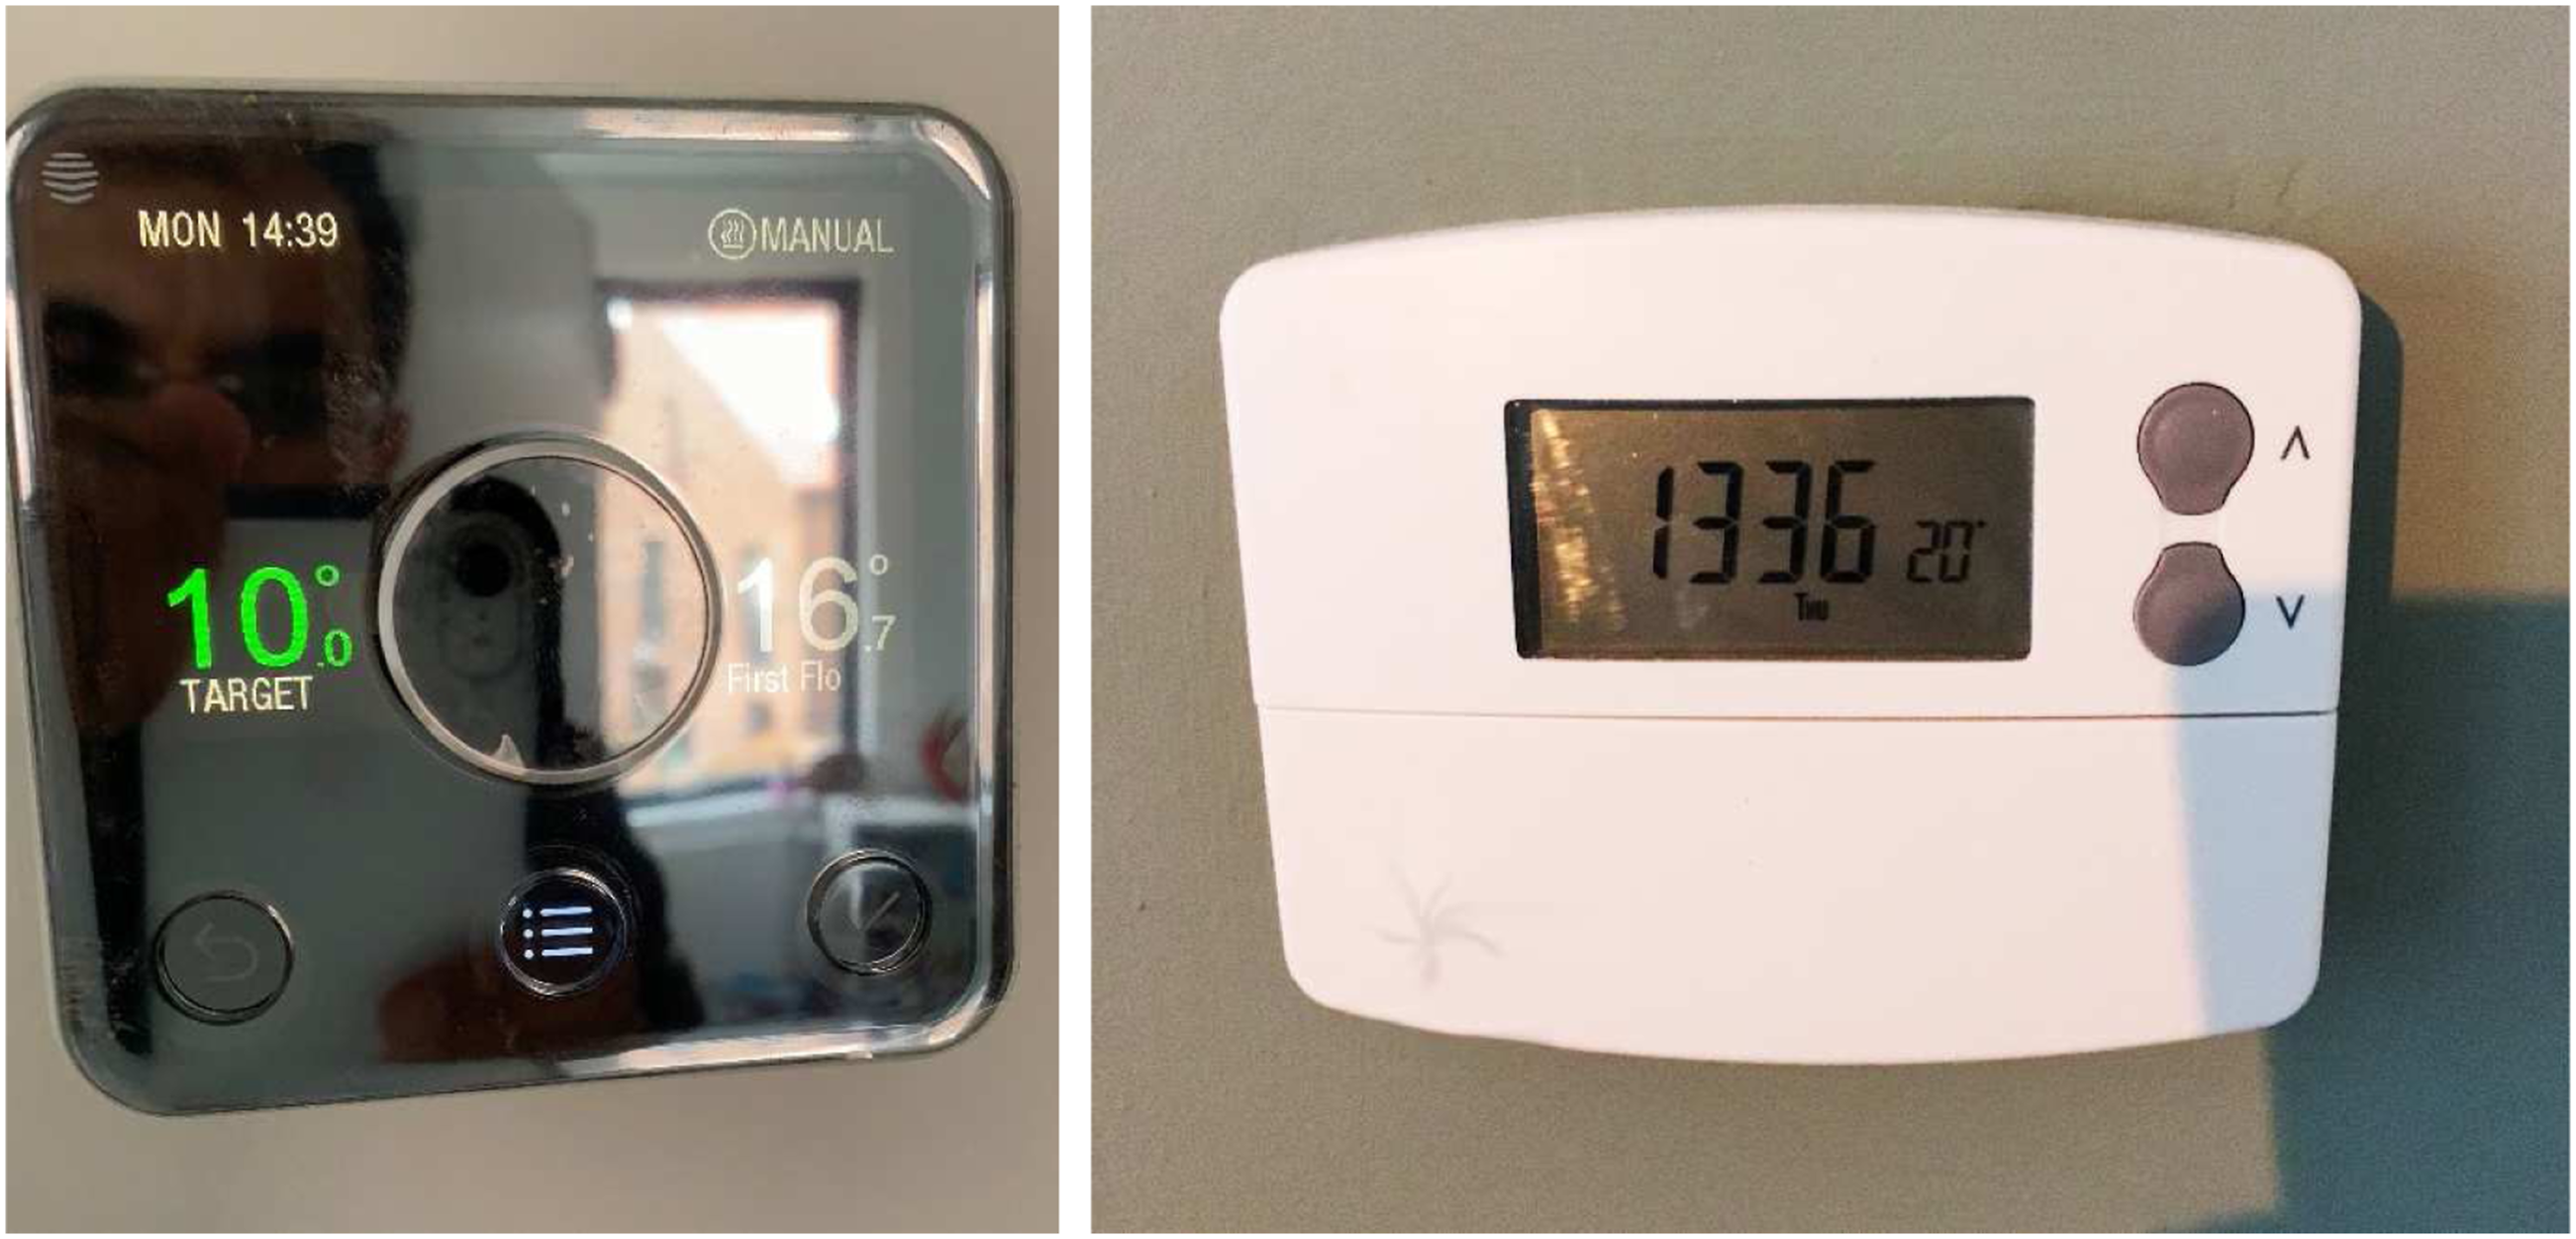
Methods
Environmental monitoring
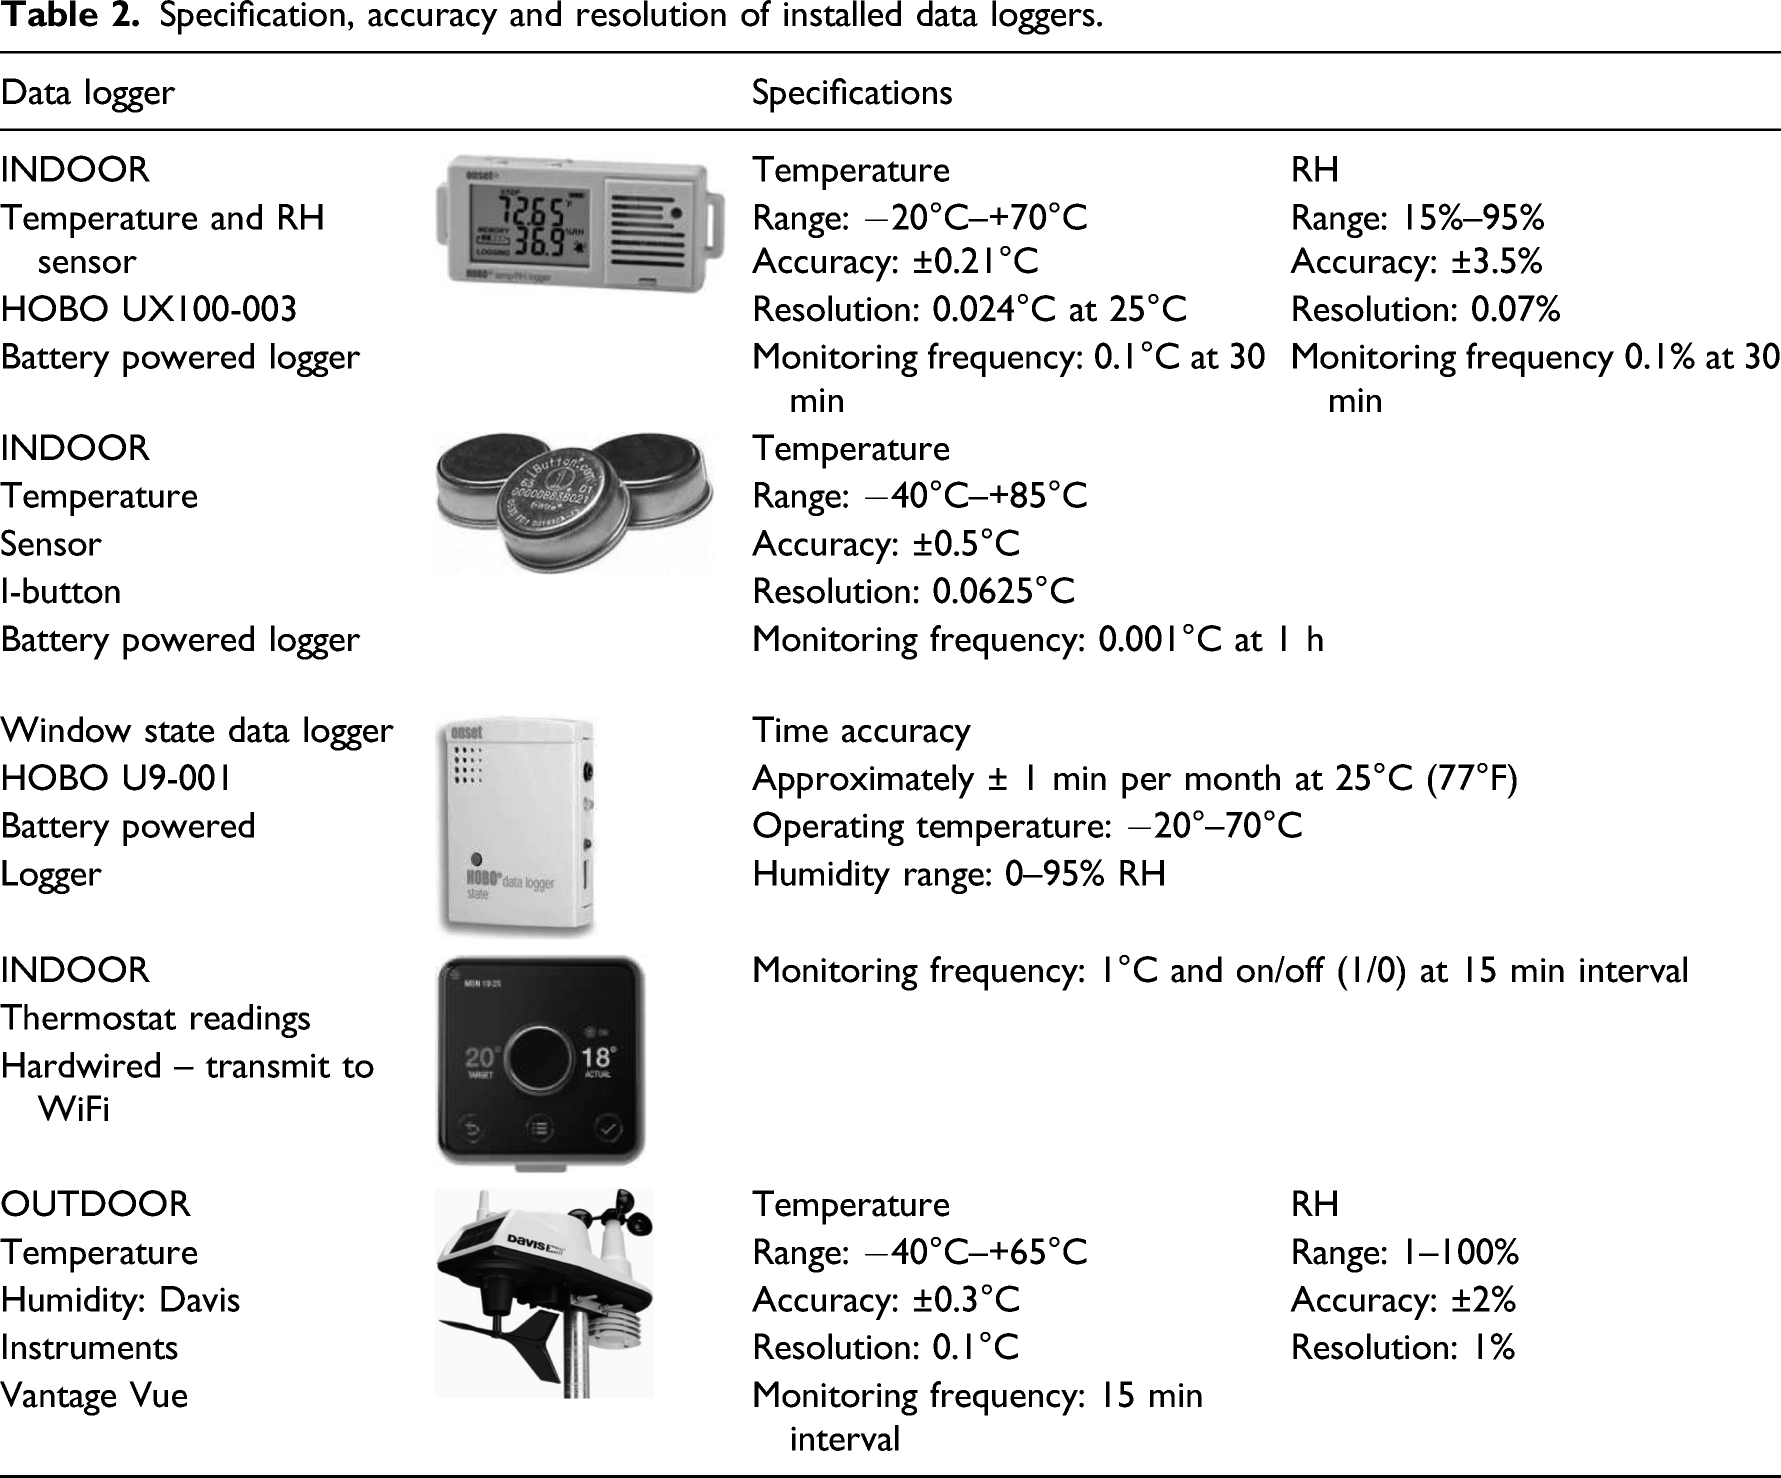
Specification, accuracy and resolution of installed data loggers.
Building performance evaluation and thermal comfort survey
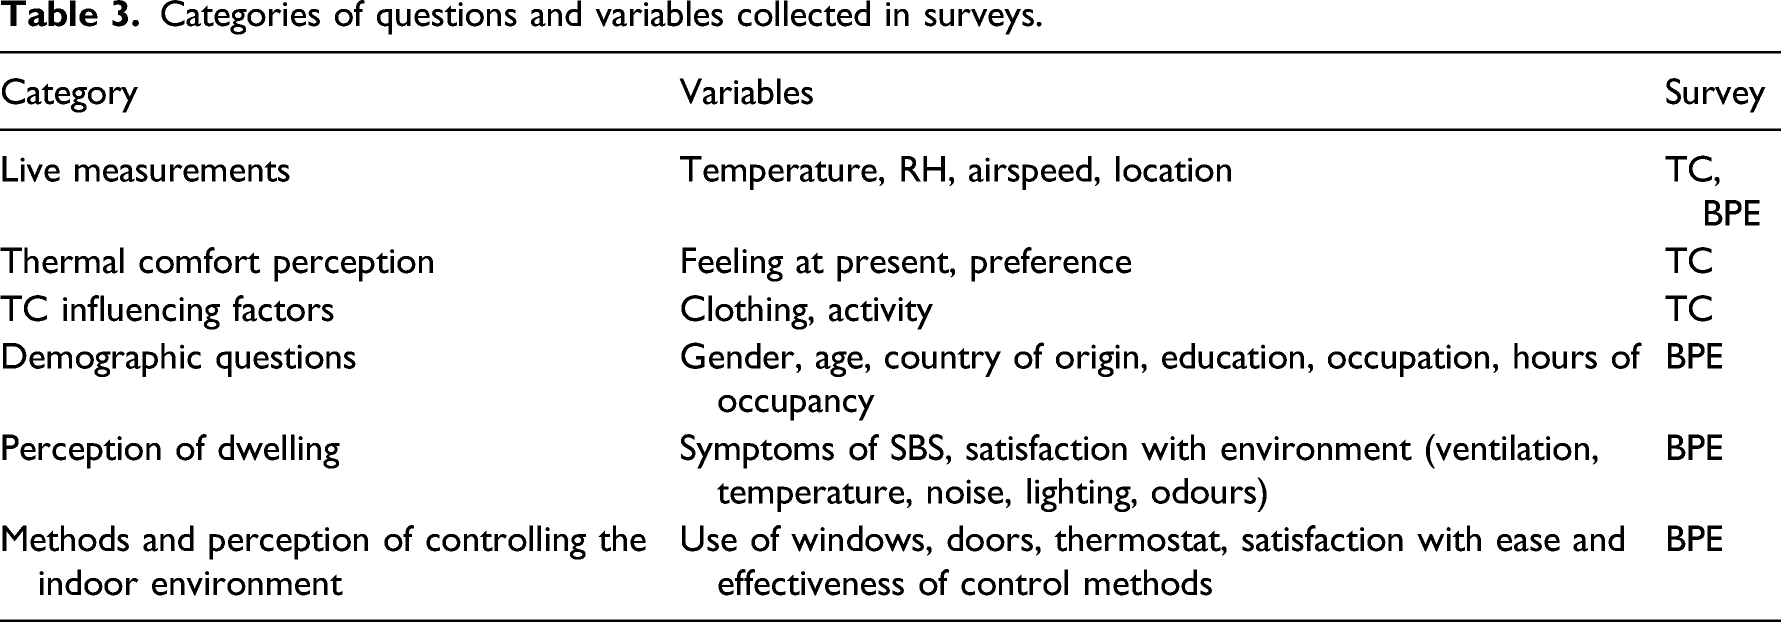
Building performance evaluation (BPE) questionnaires and right-here-right-now thermal comfort (TC) surveys (Figure 2) were implemented in all six dwellings for the winter season in February 2020. All questionnaires were performed in person, before the Covid-19 lockdown which took place around the 23 March 2020. Online versions of the questionnaires were distributed in the summer (August 2020). Thermal comfort survey (left) and BPE questionnaire (right).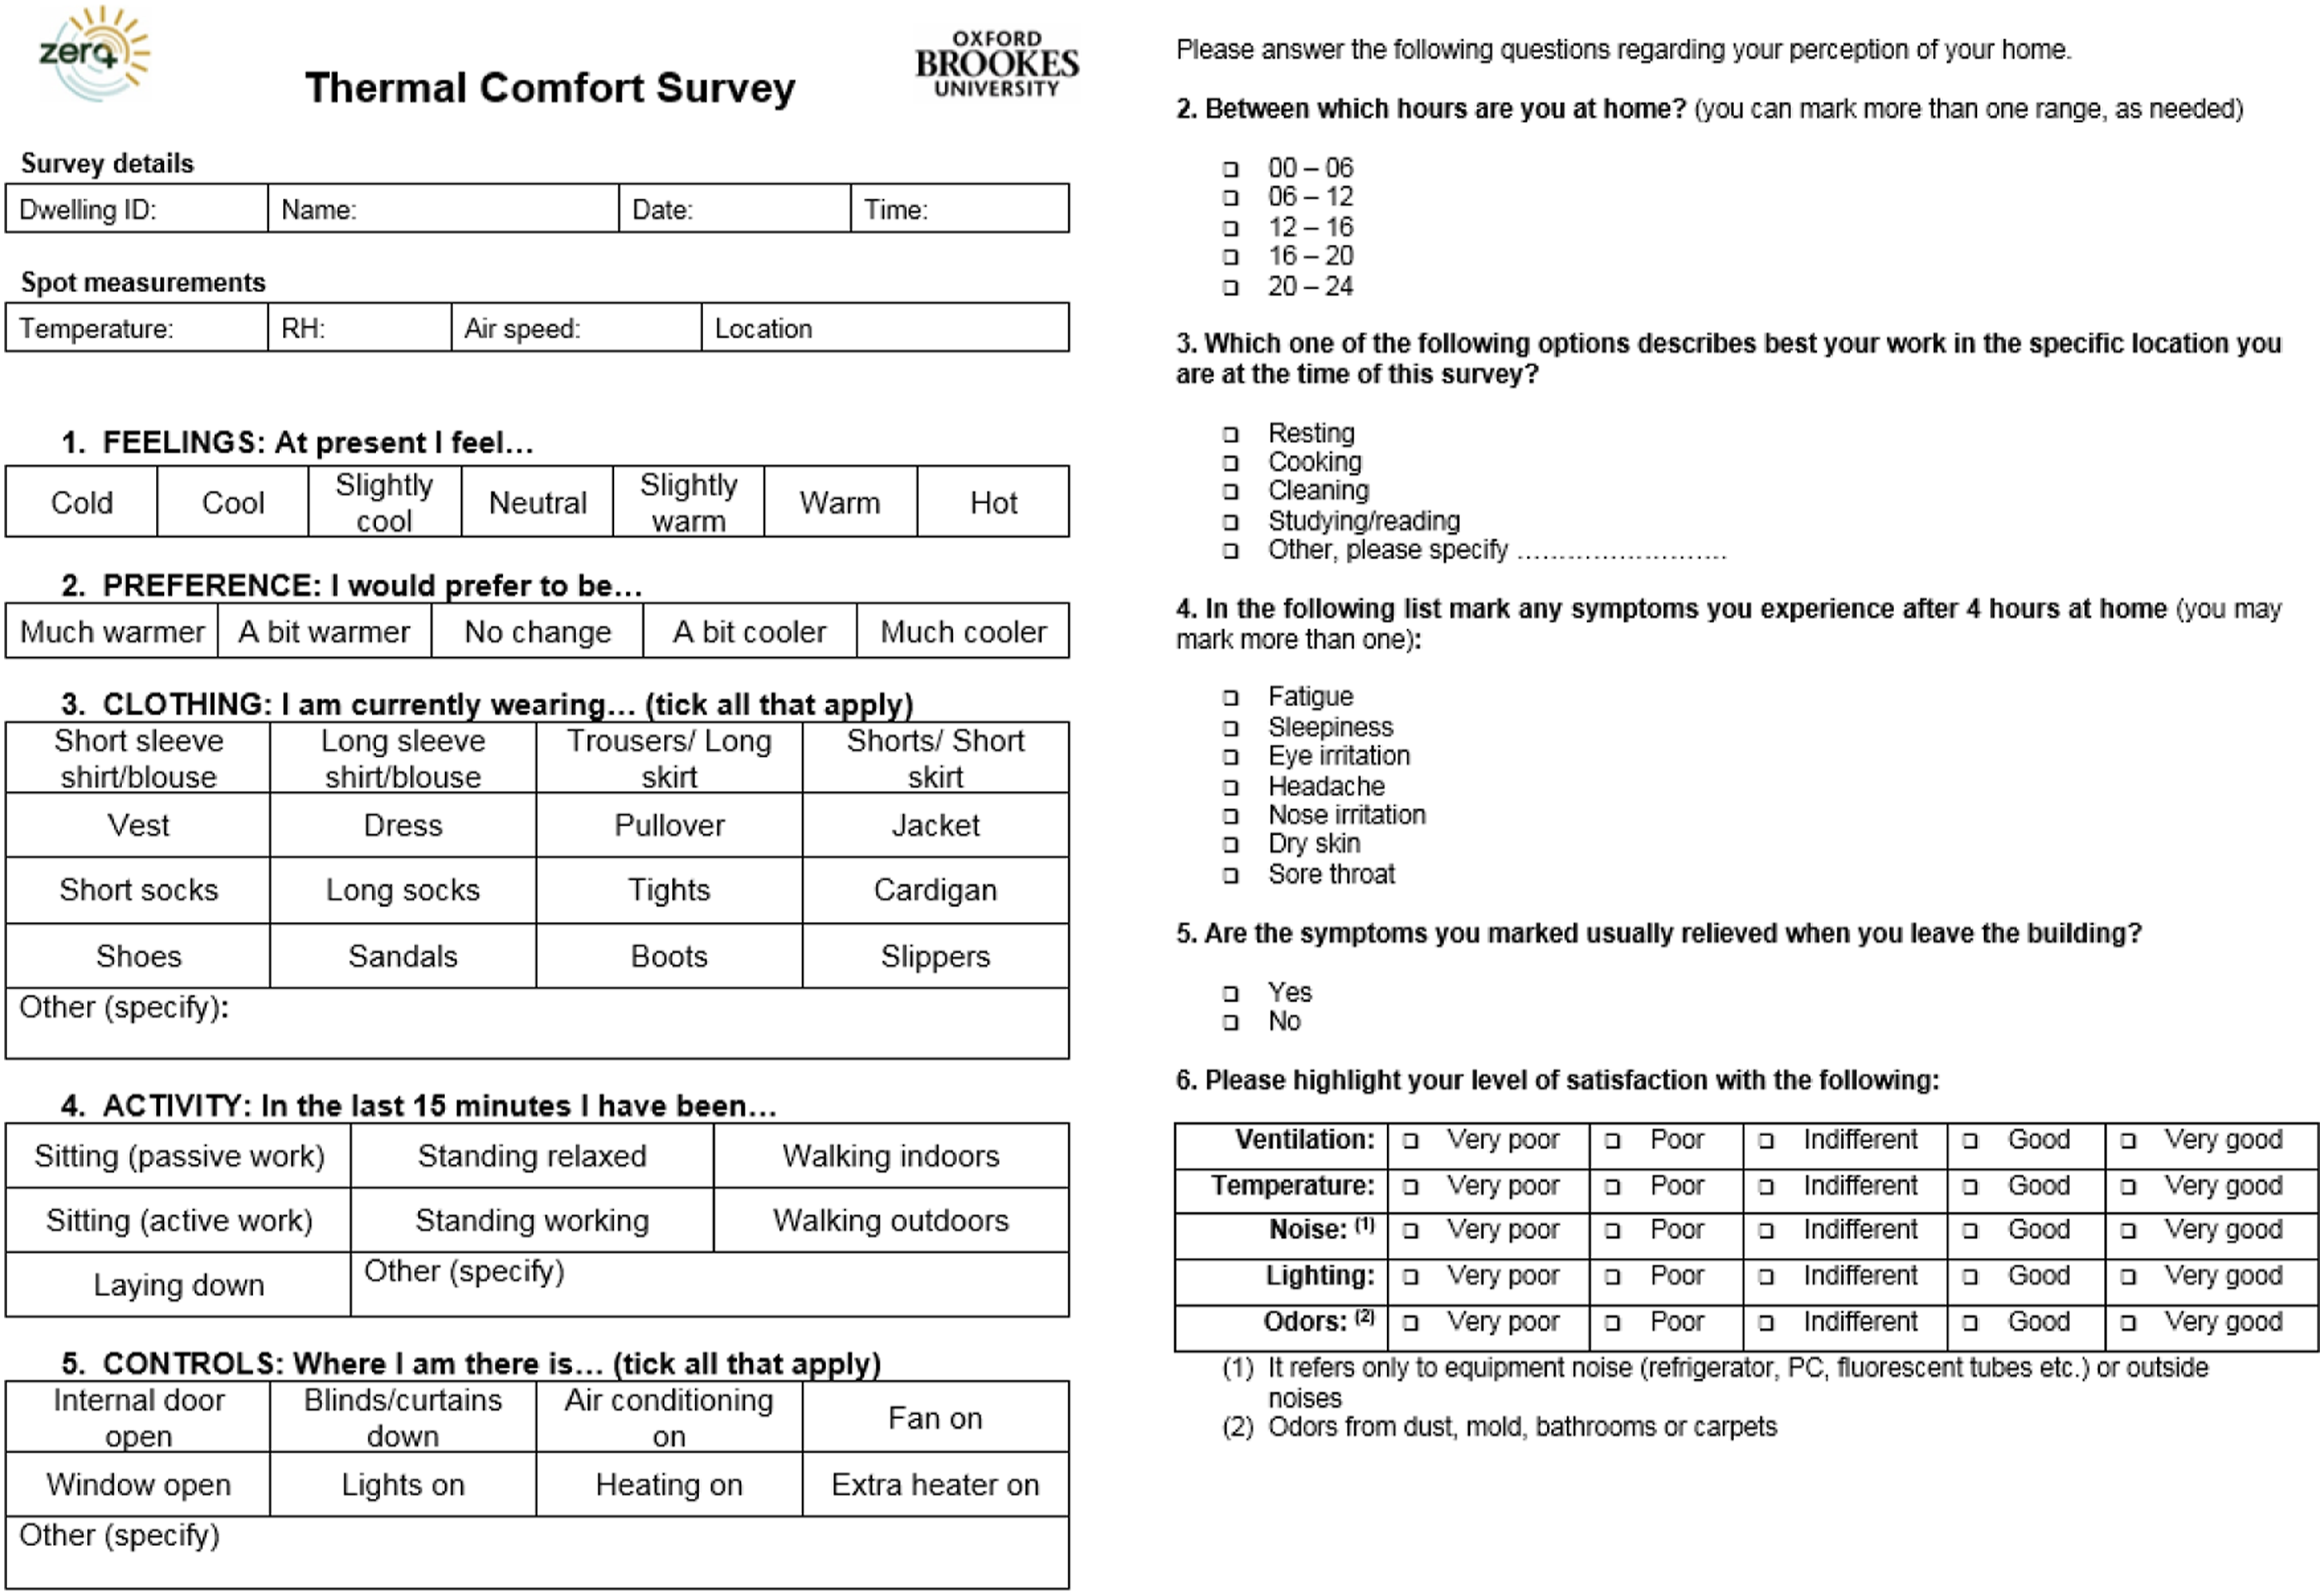
Categories of questions and variables collected in surveys.
Thermal comfort and overheating assessment
In winter, temperature recommendations in the living room ranges from 18°C–22°C; in the bedroom this is 18°C–20°C. CIBSE Guide A (v.2015) 30 recommended comfort criteria suggest 22°C–23°C in living rooms for specific activity and clothing. Though it is considered safe to have temperatures as high as 24°C in the living room, 31 various recent online sources32-34 recommend a maximum setting of 21°C–22°C out of concern for energy consumption and costs. The UK Heath Security Agency (formerly Public Health England) recommend heating homes to at least 18°C in winter as this is the temperature deemed to pose minimal risk to the health of a sedentary person, wearing suitable clothing. However, in bedrooms, for healthy individuals below the age of 64 with sufficient bedding, this threshold is less important. 31
In summer, the temperature recommendation in the living room is 25°C; in the bedroom this is 23°C. These temperatures are based on CIBSE Guide A (v.2006)
35
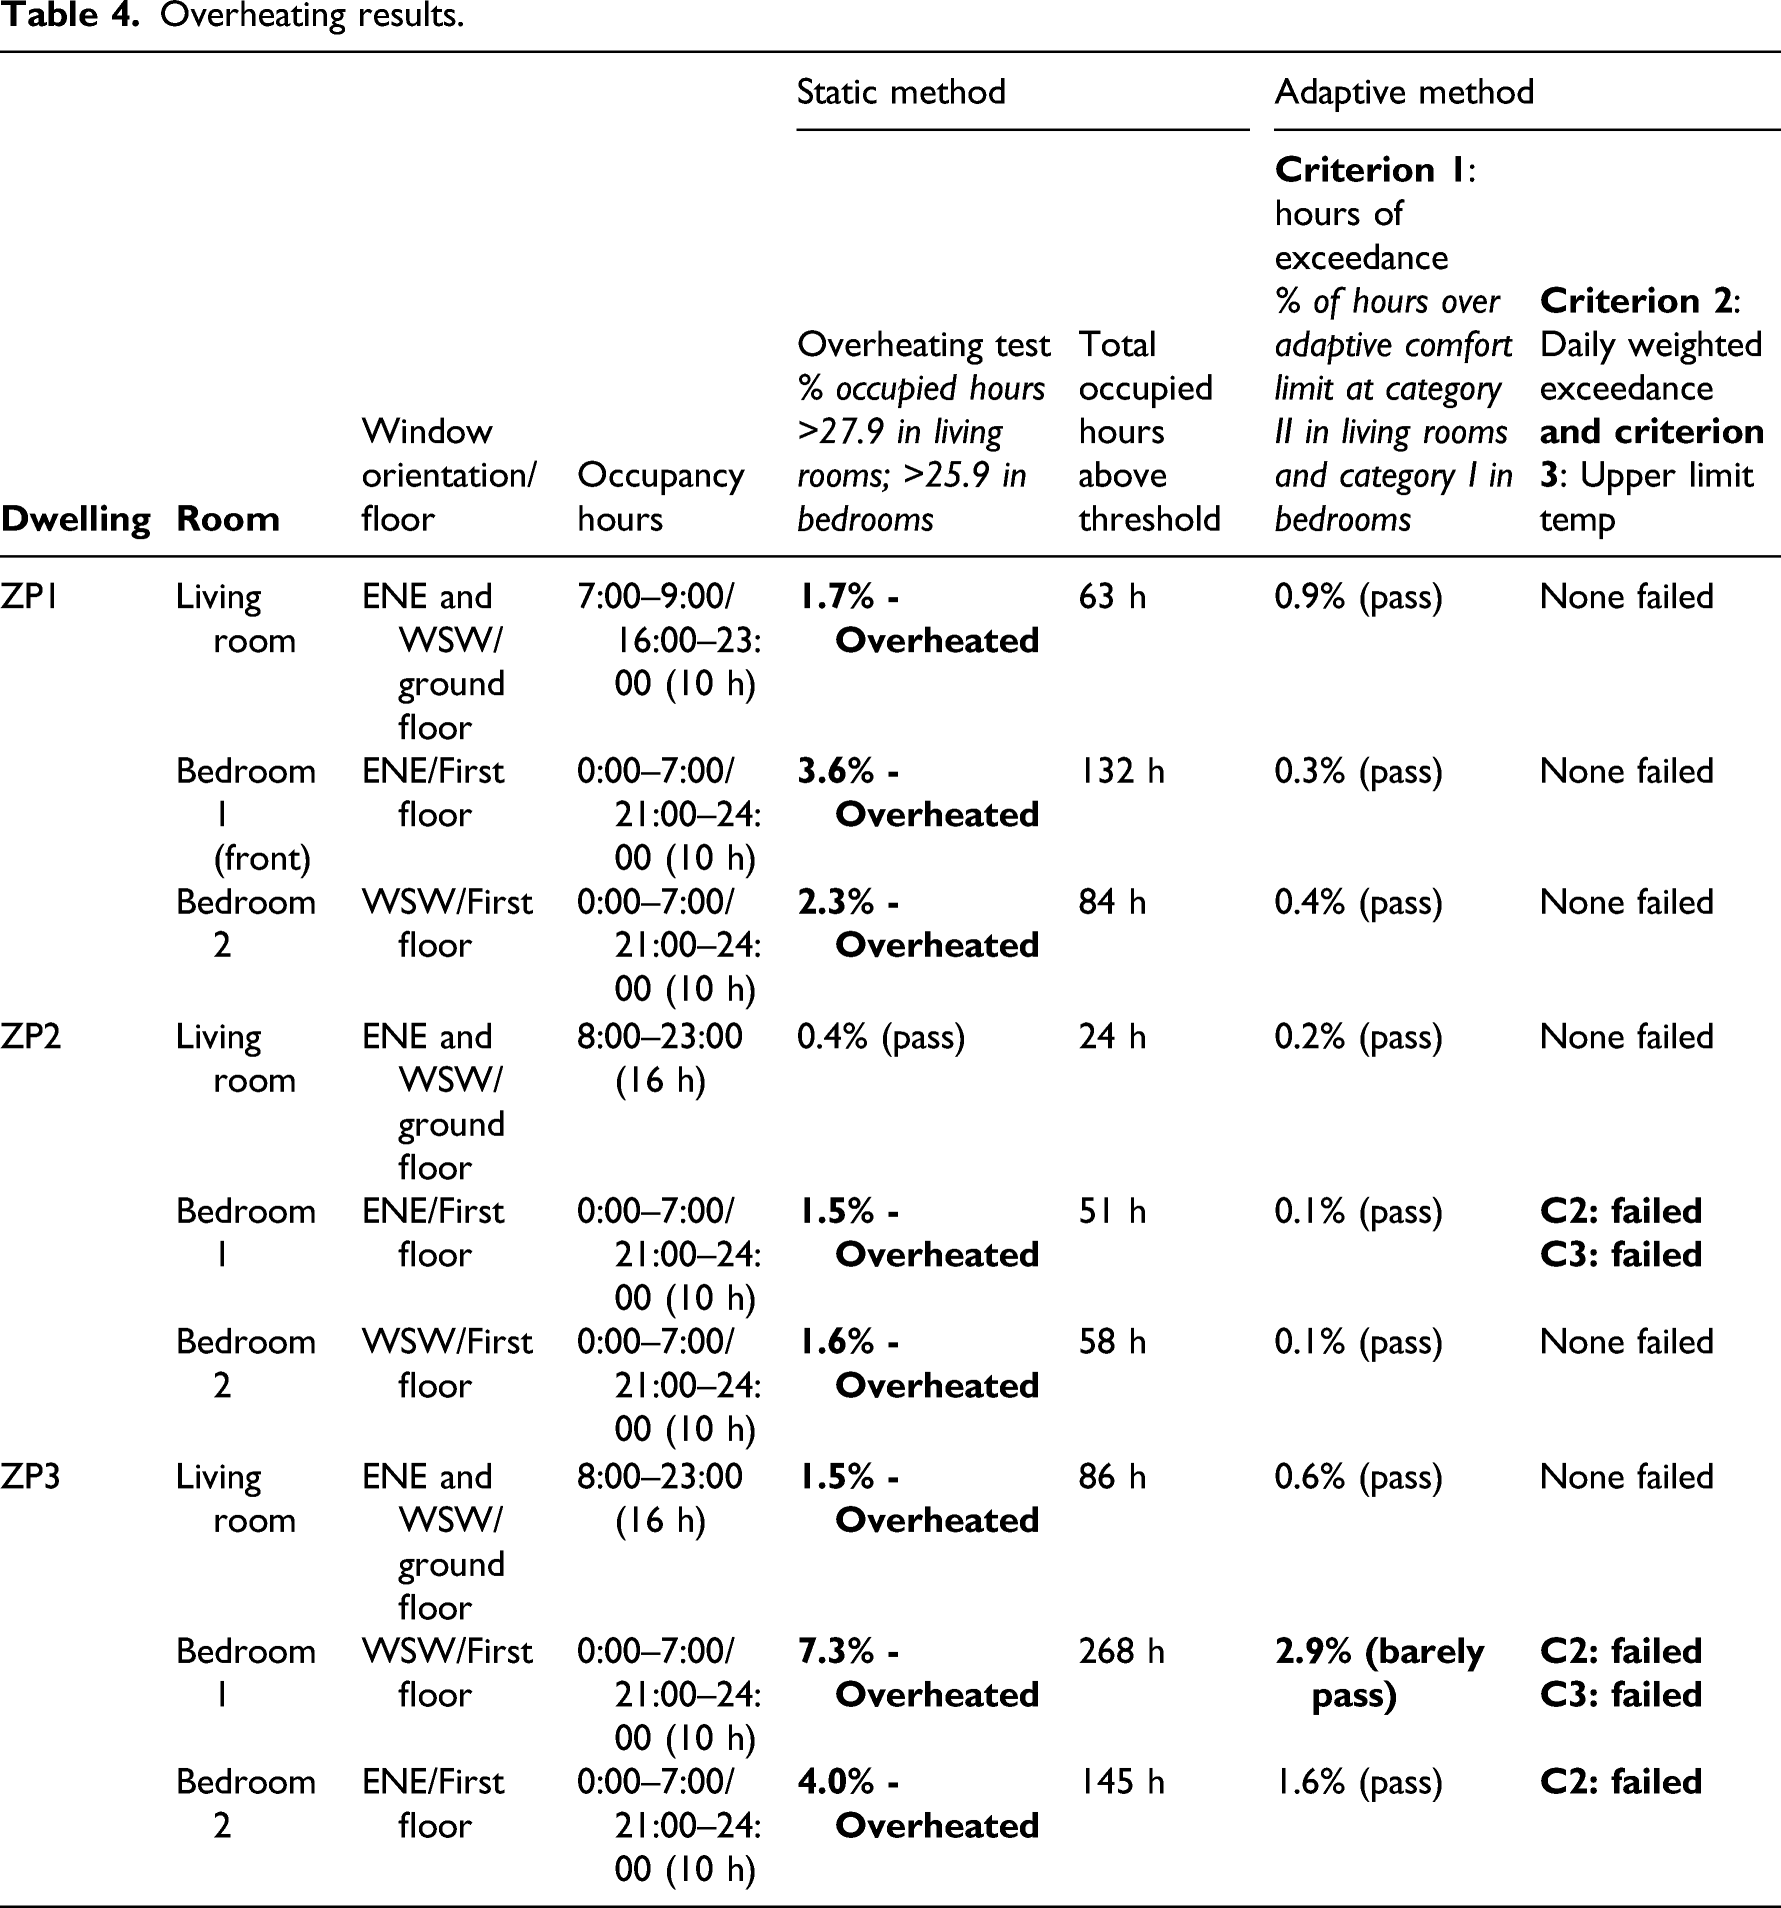
generally acceptable summer temperature in dwellings without air conditioning. Anything below this will also be acceptable. The static and dynamic (adaptive) methods were used to assess the risk of summertime overheating in the dwellings. For static overheating criteria in non-air-conditioned dwellings, CIBSE’s Environmental Design Guide A30,35 recommends that values for indoor comfort temperatures should be 25°C for living areas and 23°C for bedrooms. CIBSE notes that temperatures are expected to be lower at night with people finding that sleeping in warm conditions is difficult, particularly above 24°C. Environmental Design Guide A provides these static benchmark summer peak temperatures and overheating criteria: • 1% of annual occupied hours over 28°C in living rooms • 1% of annual occupied hours over 26°C in bedrooms
Alternatively, dynamic/adaptive overheating criteria were developed taking the outdoor conditions and human adaptation into account by identifying comfort limits based on a running mean of outdoor temperature and the quality of the thermal comfort required. Based on this, the CIBSE TM52 36 document provides a series of criteria by which the risk of overheating can be assessed. These are as follows: • Criterion 1: hours of exceedance – limit for the number of hours that the operative temperature can exceed the threshold comfort temperature • Criterion 2: daily weighted exceedance – severity of overheating within any 1 day • Criterion 3: upper limit temperature – temperatures which exceed the absolute maximum temperature are unacceptable
For Category II, normal expectation for new buildings and renovations, the first criterion recommends that the number of hours during which the indoor temperatures are 1 K higher or equal to the upper comfort limit during the period from May to September should not exceed 3% of occupied hours. The calculations for the criteria will not be repeated here as they are well documented in several references provided in the literature review, for example, 37 as well as in the original document. 36 As is common in many domestic monitoring studies, indoor air temperature is monitored in the study rather than operative temperature (used in overheating criteria). However, Lomas and Porritt 38 suggest that commonly used sensors (such as those used in this study) are likely to record a mix of air and radiant temperatures, making them closer to temperatures experienced by occupants.
Results
Indoor environmental conditions
This section describes analysis of the monitored temperature and relative humidity (RH). The sub-sections analyse the relationship between (1) indoor and outdoor temperature, indoor temperature and RH, (2) indoor temperature and window opening patterns and (3) overheating. The assessment primarily covers the data on a seasonal basis. These seasons are defined as follows: Winter = Dec–Feb, Spring = Mar–May, Summer = Jun–Aug and Autumn = Sep–Nov.
Winter averages in the dwellings range from 17oC in ZP3 to 22oC in ZP2. ZP3 consistently kept the dwelling at temperatures that would be considered cold and borderline potentially harmful for vulnerable occupants
31
in the winter. ZP2 kept the temperature on the high end of what is recommended and ZP1 retained a reasonable range as per recommendations. Interestingly, as will be seen later, ZP1 considered the temperature in winter to be ‘poor’, whereas the others considered it to be ‘good’. ZP1 did, however, have the largest range between max. and min. (Figure 3). ZP2, who did not prefer a change in thermal comfort, maintained a constant average of 22–23oC throughout the year. Seasonal temperature box plots on the ground floor in all ZP dwellings (yellow = ZP1, red = ZP2 and grey = ZP3).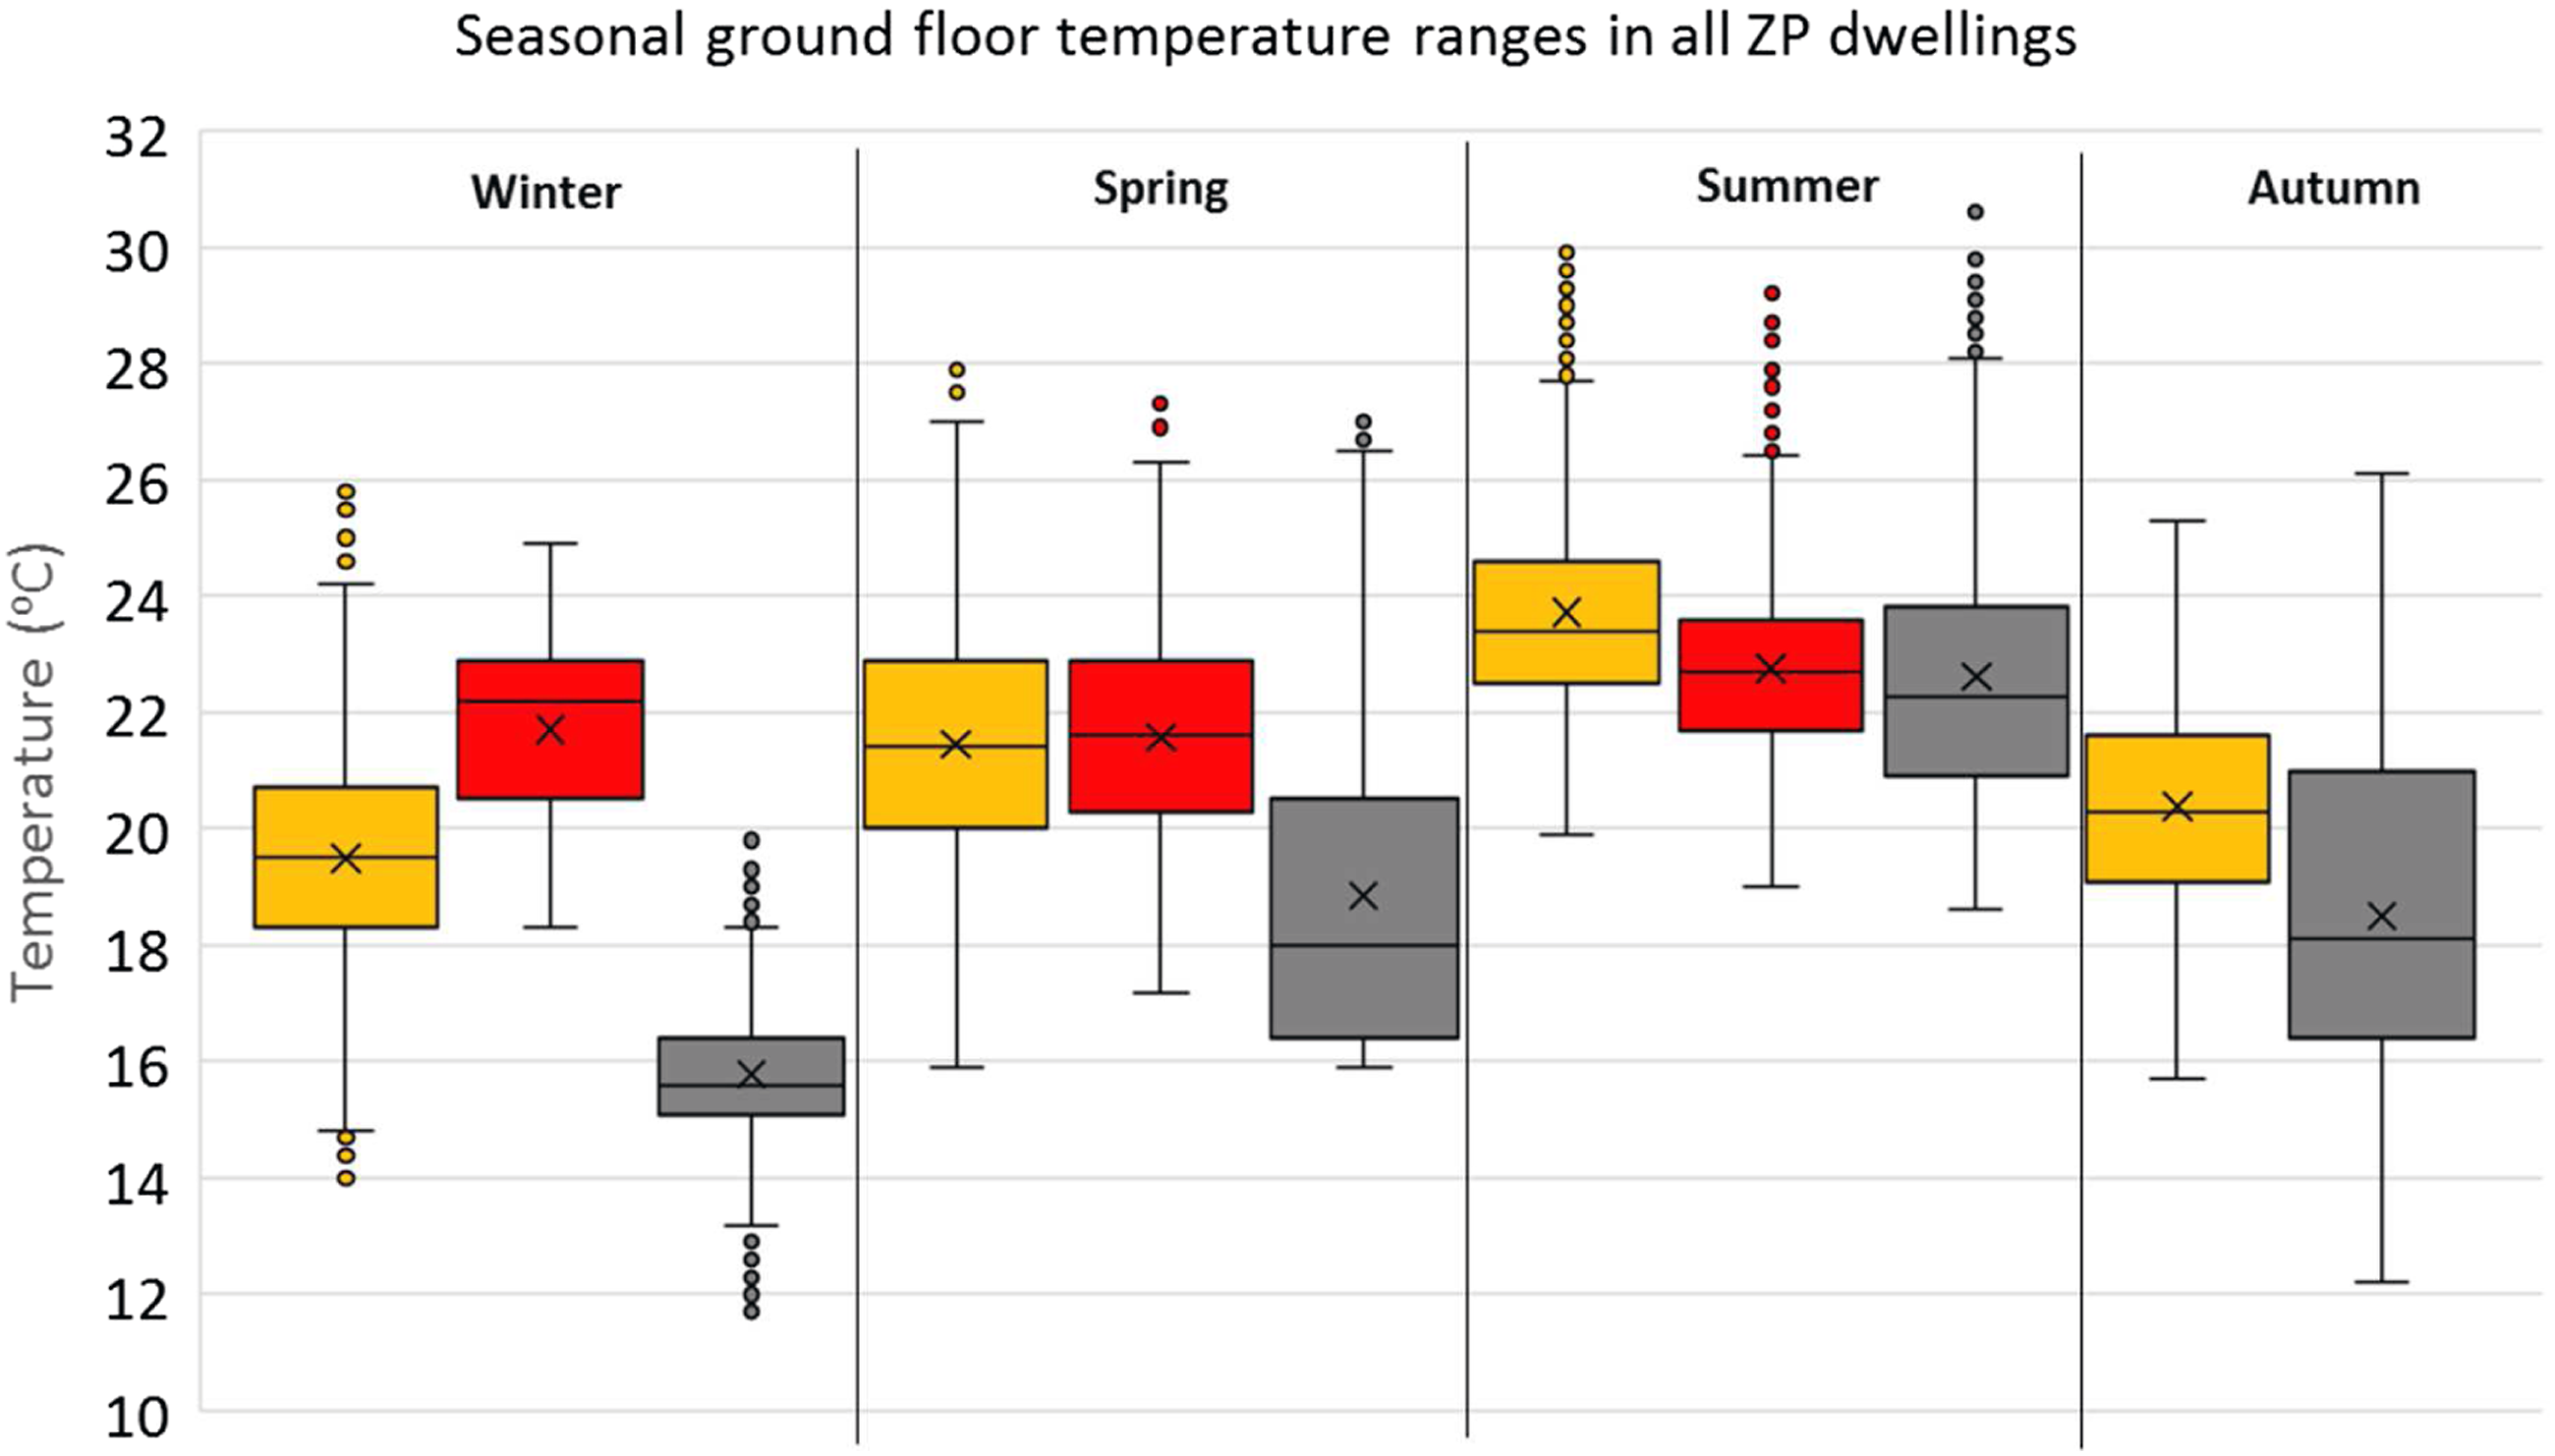
Figure 3 shows the seasonal temperature ranges in all ZP dwellings on the ground floor for all hours. The temperature ranges on the ground floor and first floor (not shown) are fairly aligned with their averages matching in ZP1, slightly lower in ZP2 for all seasons and matching in ZP3. Additionally, quartiles 1–3 in the winter showed a smaller range on the first floor as compared to the ground floor for all dwellings.
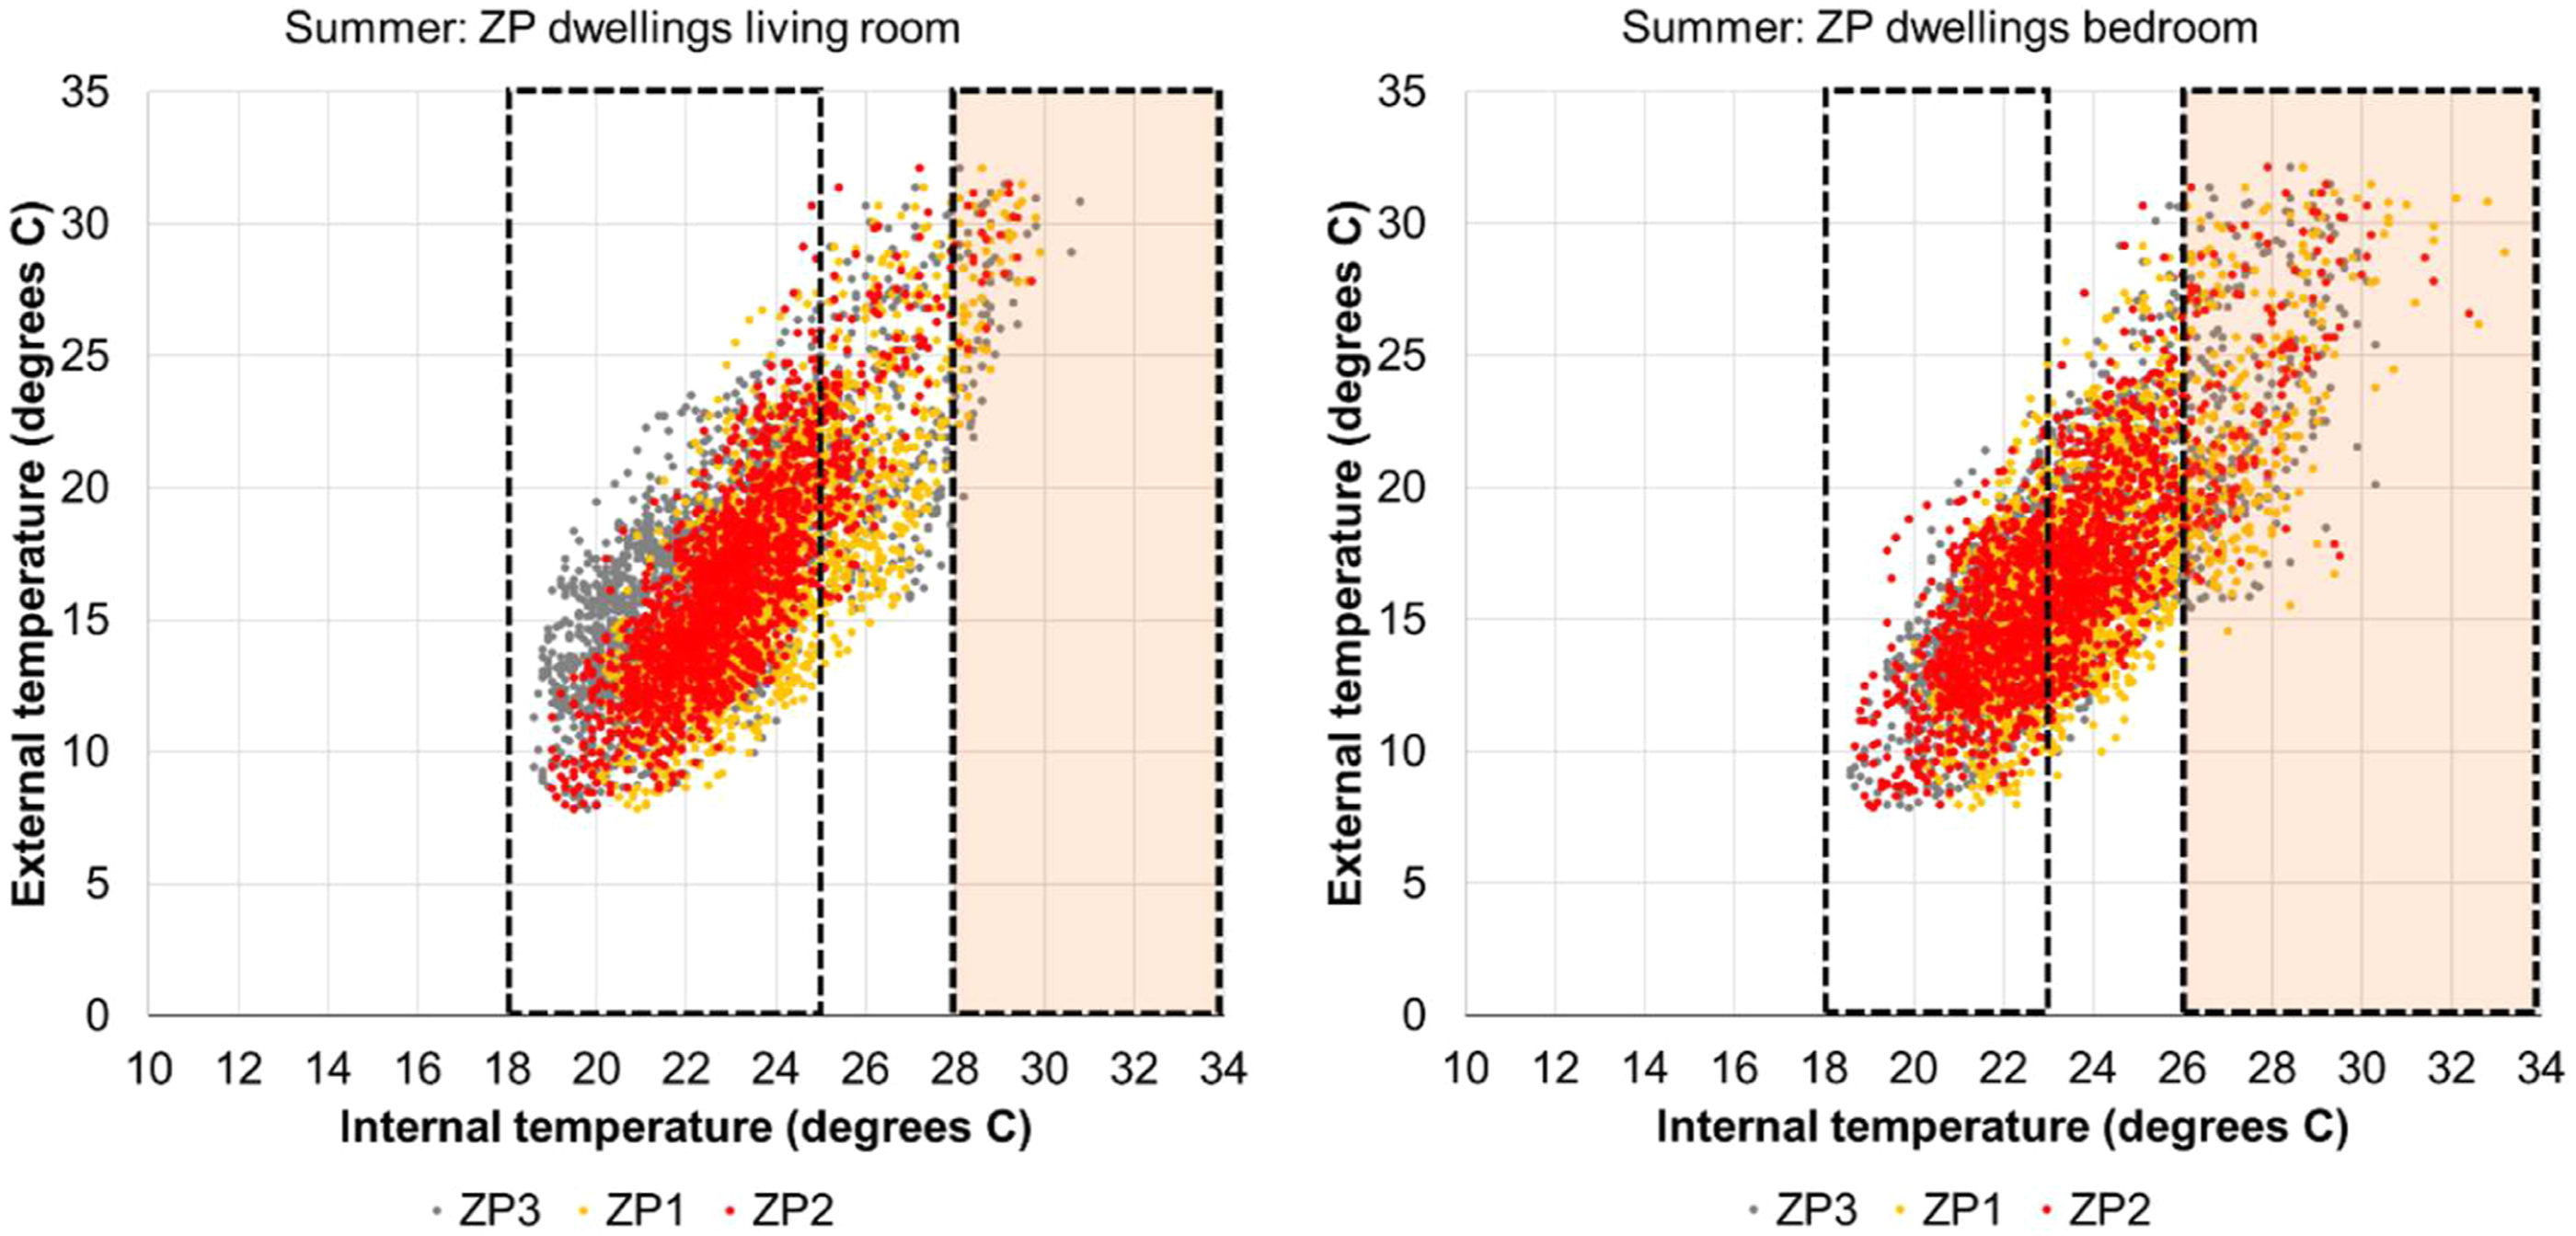
The wintertime over- and under-heating of ZP2 and ZP3, respectively, can be seen in Figure 4. The dashed boxes in the images show the recommended heating ranges for the living room and bedrooms. It is theorised from the data that the bedrooms are too warm in the winter for a majority of the time in ZP2; however, the occupant did not prefer the home to be warmer or cooler. Figure 5 shows the same for summer with an additional box on the left side showing the range at which summertime overheating is possible. This is explored in further detail later. For the most part, summer temperatures are mostly contained in the recommended range in the living rooms of all dwellings. Though bedrooms have a smaller recommended range and lower overheating tolerance, they also showed a greater count of higher maximums. Winter temperatures for all hours: indoor versus outdoor (yellow = ZP1, red = ZP2 and grey = ZP3). Summer temperatures for all hours: indoor versus outdoor (yellow = ZP1, red = ZP2 and grey = ZP3).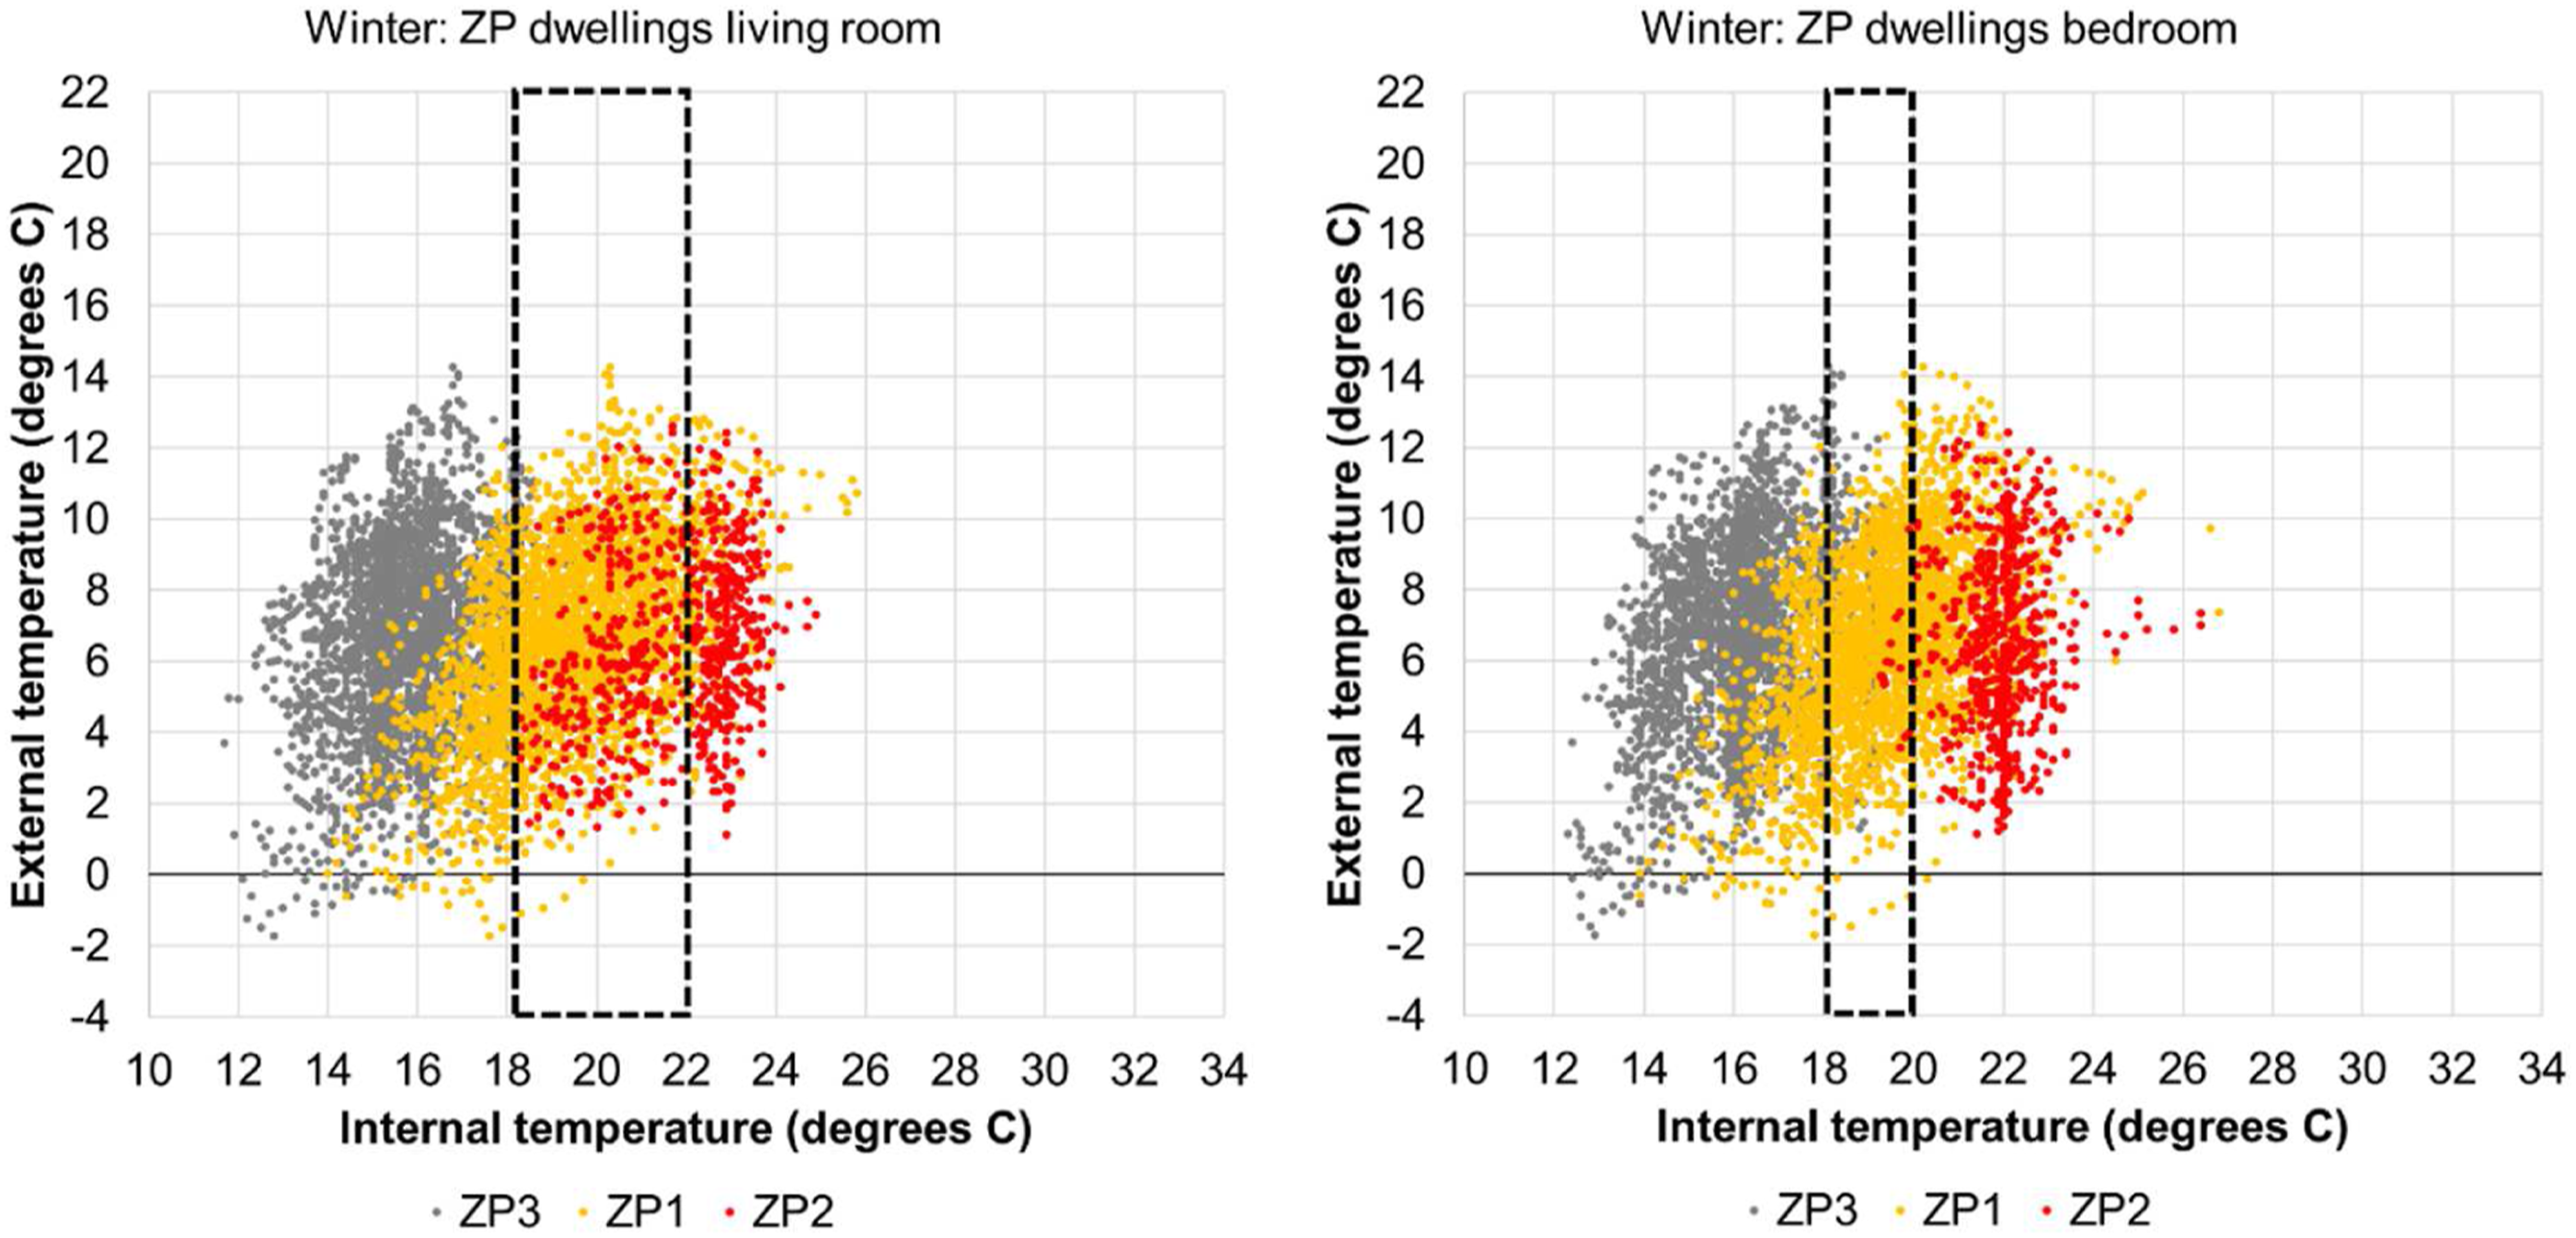
A range recommendation box is also shown for the relationship between indoor temperature and RH. In Figure 6, winter, ZP3 has higher levels of RH than the other dwellings (even higher in the bedroom – not shown). This is likely a result of window opening behaviour as shown in the next section. In the summer, RH is well within recommended range for the dwellings. All dwellings in summer averaged 51%RH in the living rooms and 53–55%RH in the bedrooms. Winter (left) and summer (right) temperature and RH in the living room for all hours (yellow = ZP1, red = ZP2 and grey = ZP3).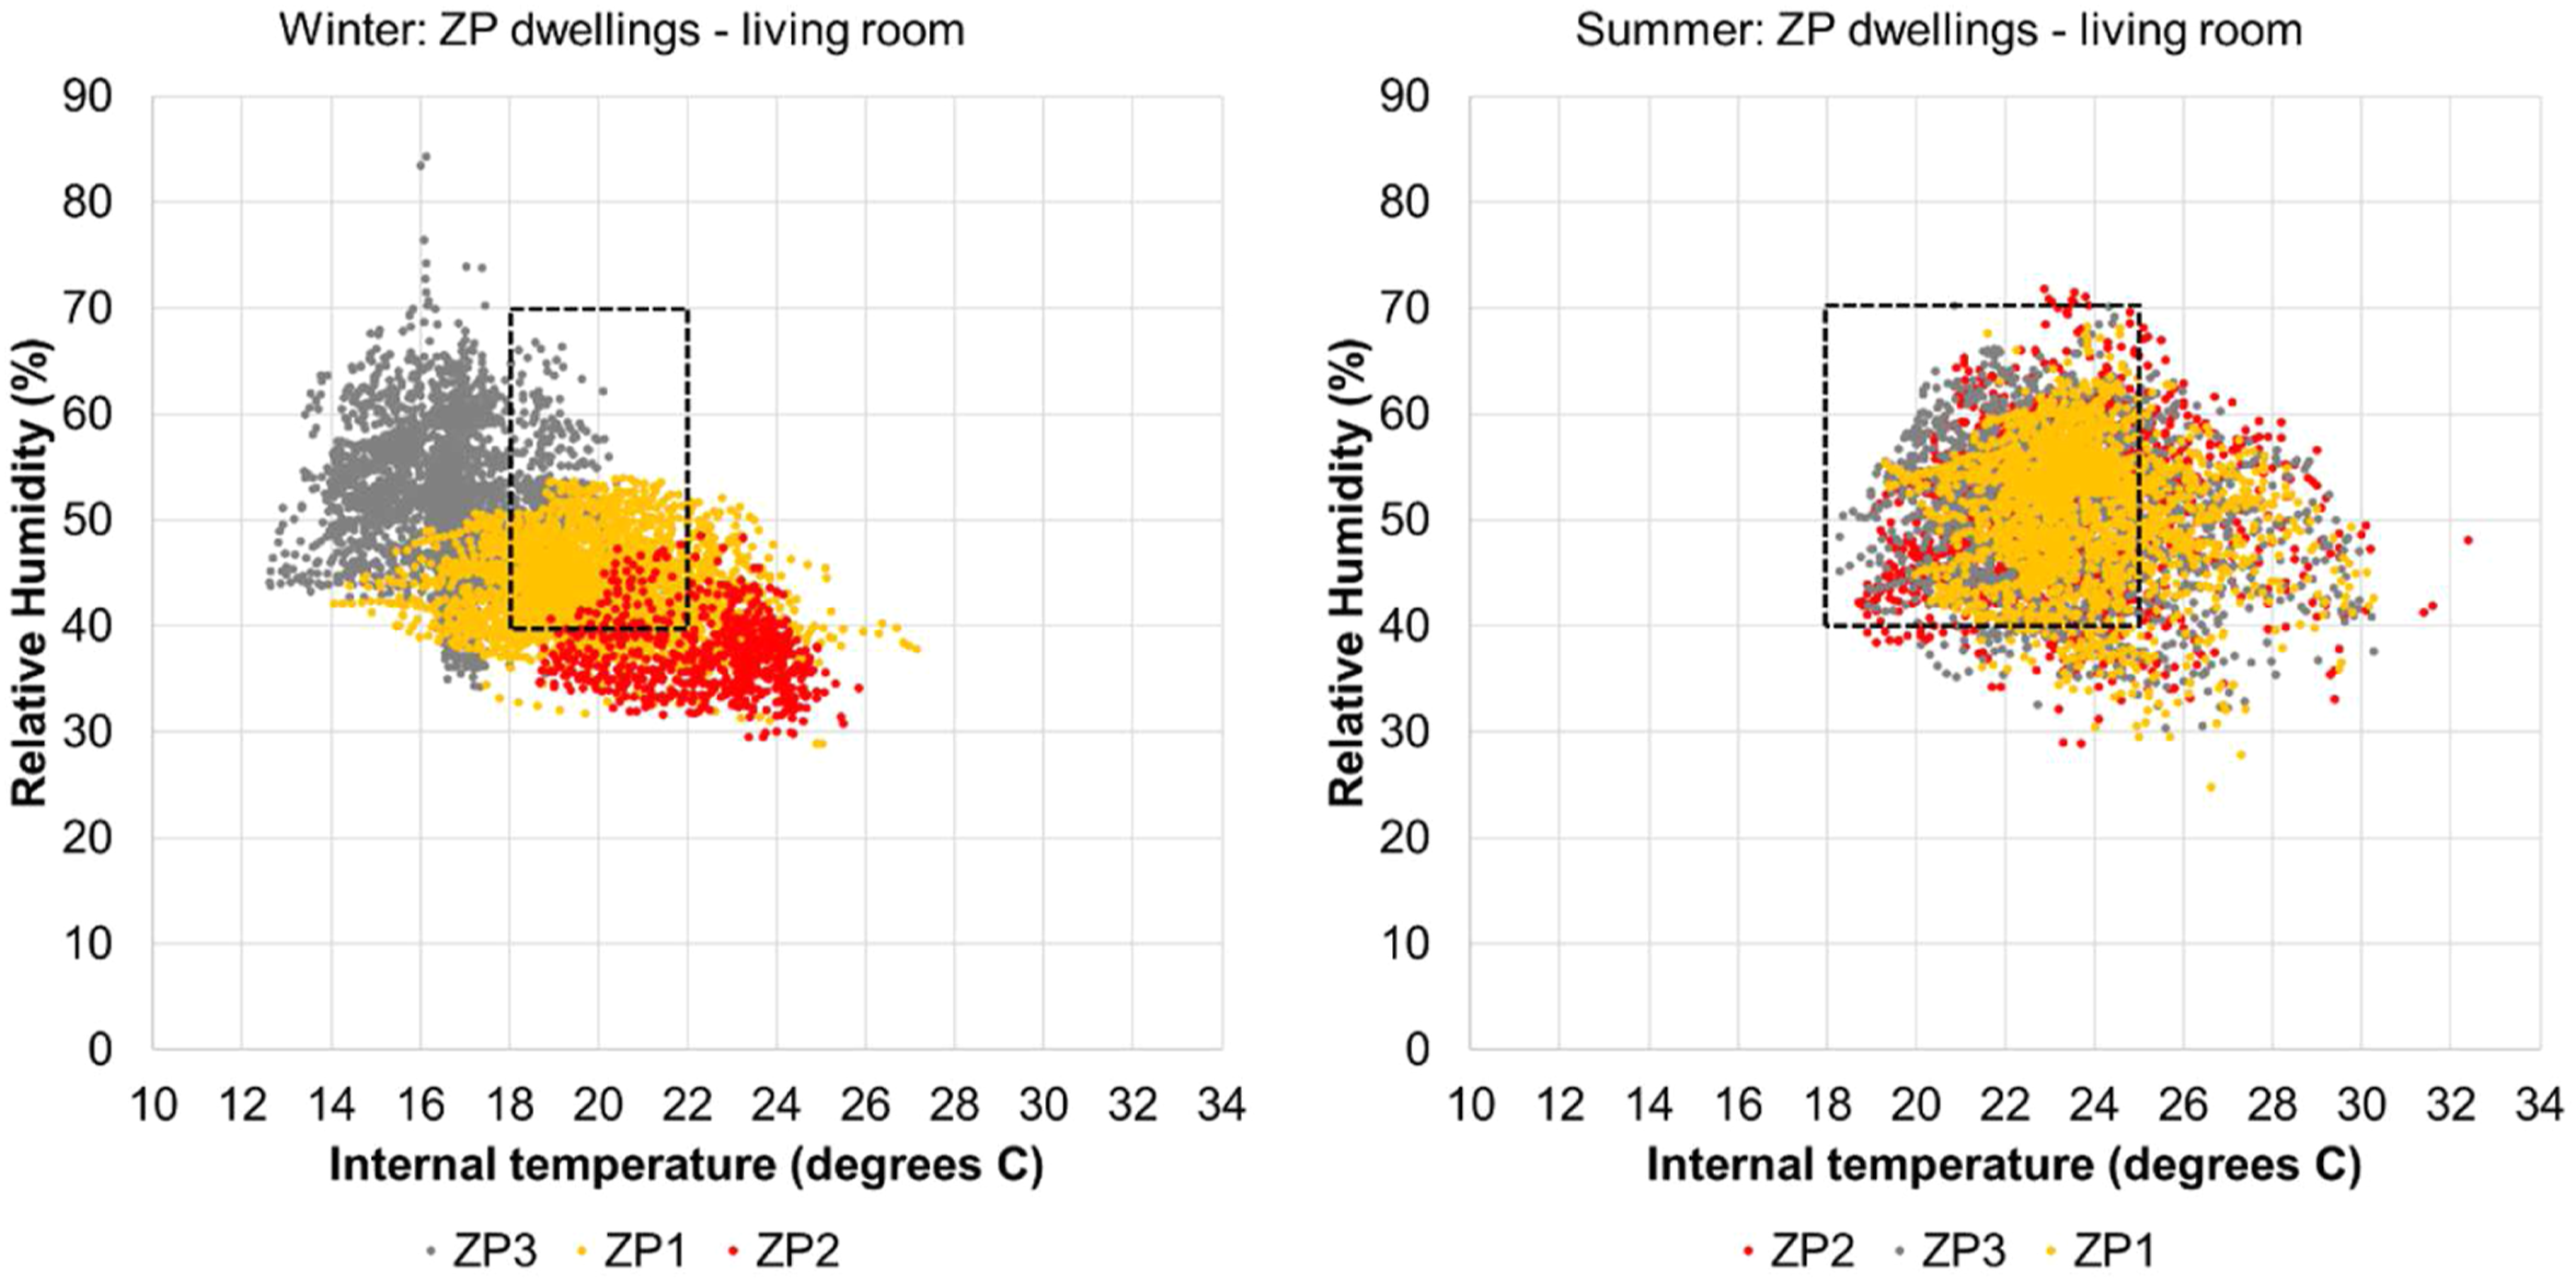
Window opening
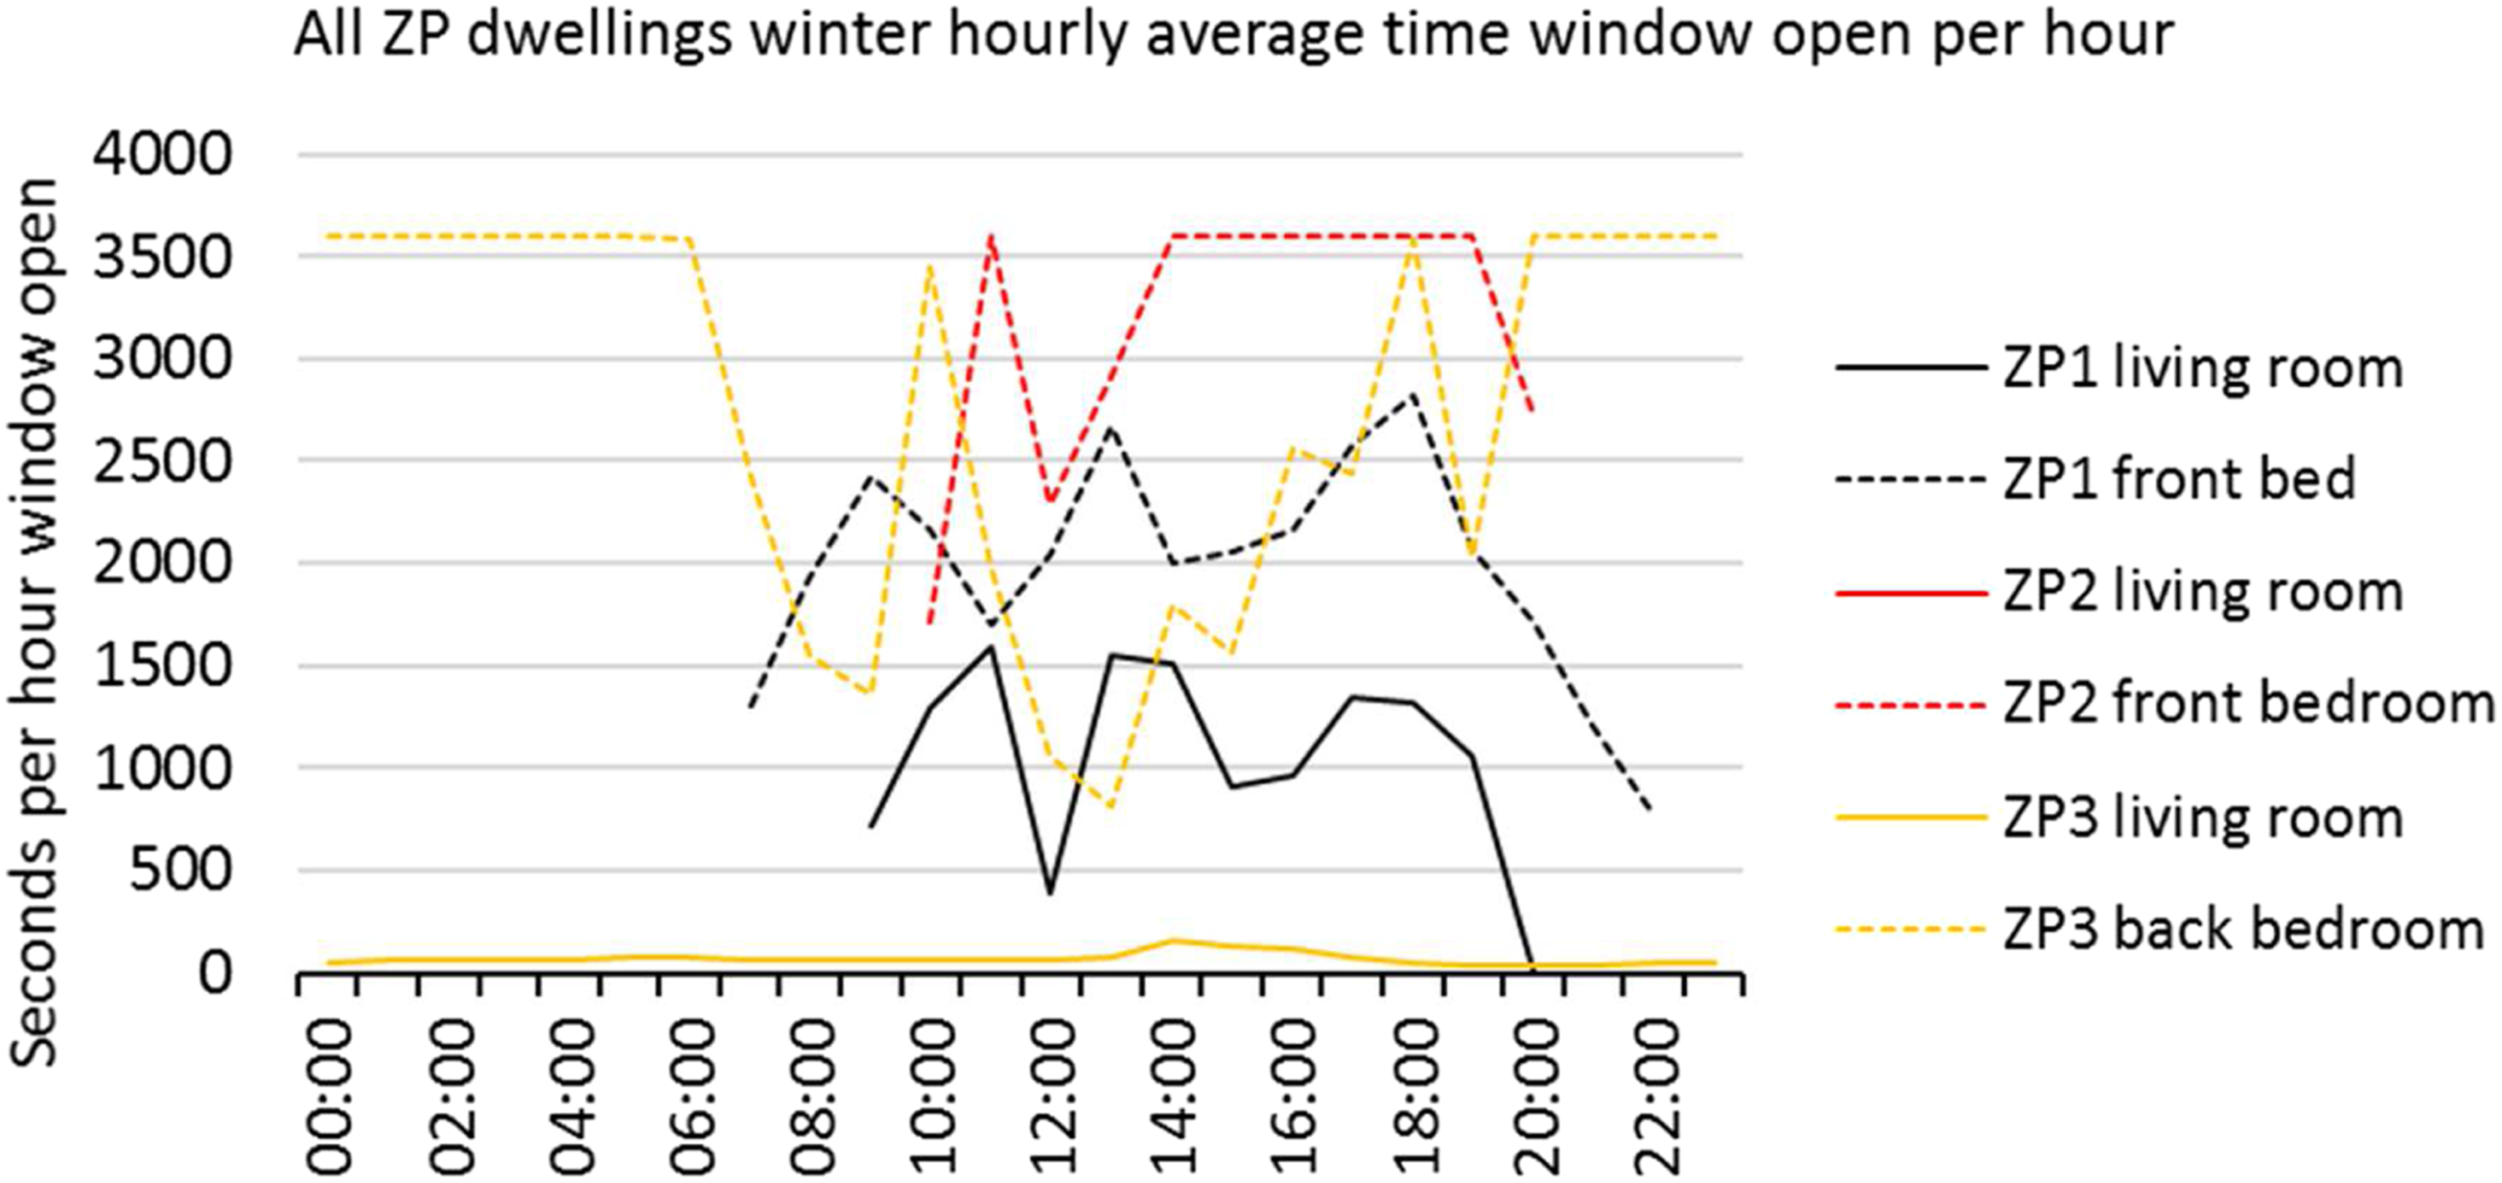
Window opening was measured in the living room and main bedroom of each dwelling during the winter and summer periods. In the living room, the window opening loggers were installed on (full glass) doors leading to the rear (private) garden. ZP3 by far opened their living room garden doors more than any other dwelling’s windows or garden doors (Figure 7). ZP3 had two small dogs and it is likely this was the reason for the great frequency of door opening to the garden. This could further explain the shortness of how long the doors were open as can be seen in Figure 8. In fact, on average the doors to the garden were only open for about a minute at a time. This is a reasonable expectation in the winter. However, ZP3 left the bedroom window open throughout the night from 20:00–06:00. This, coupled with cooler temperatures, is highly likely the reason for higher RH in ZP3 bedroom in winter. In contrast, ZP1 and ZP3 left the bedroom windows open only during the day, less frequently and for different periods of time and shut the windows entirely at night. Hourly average total window opening count in winter (all dwellings). Hourly average period of time in seconds when window is open in winter (all dwellings).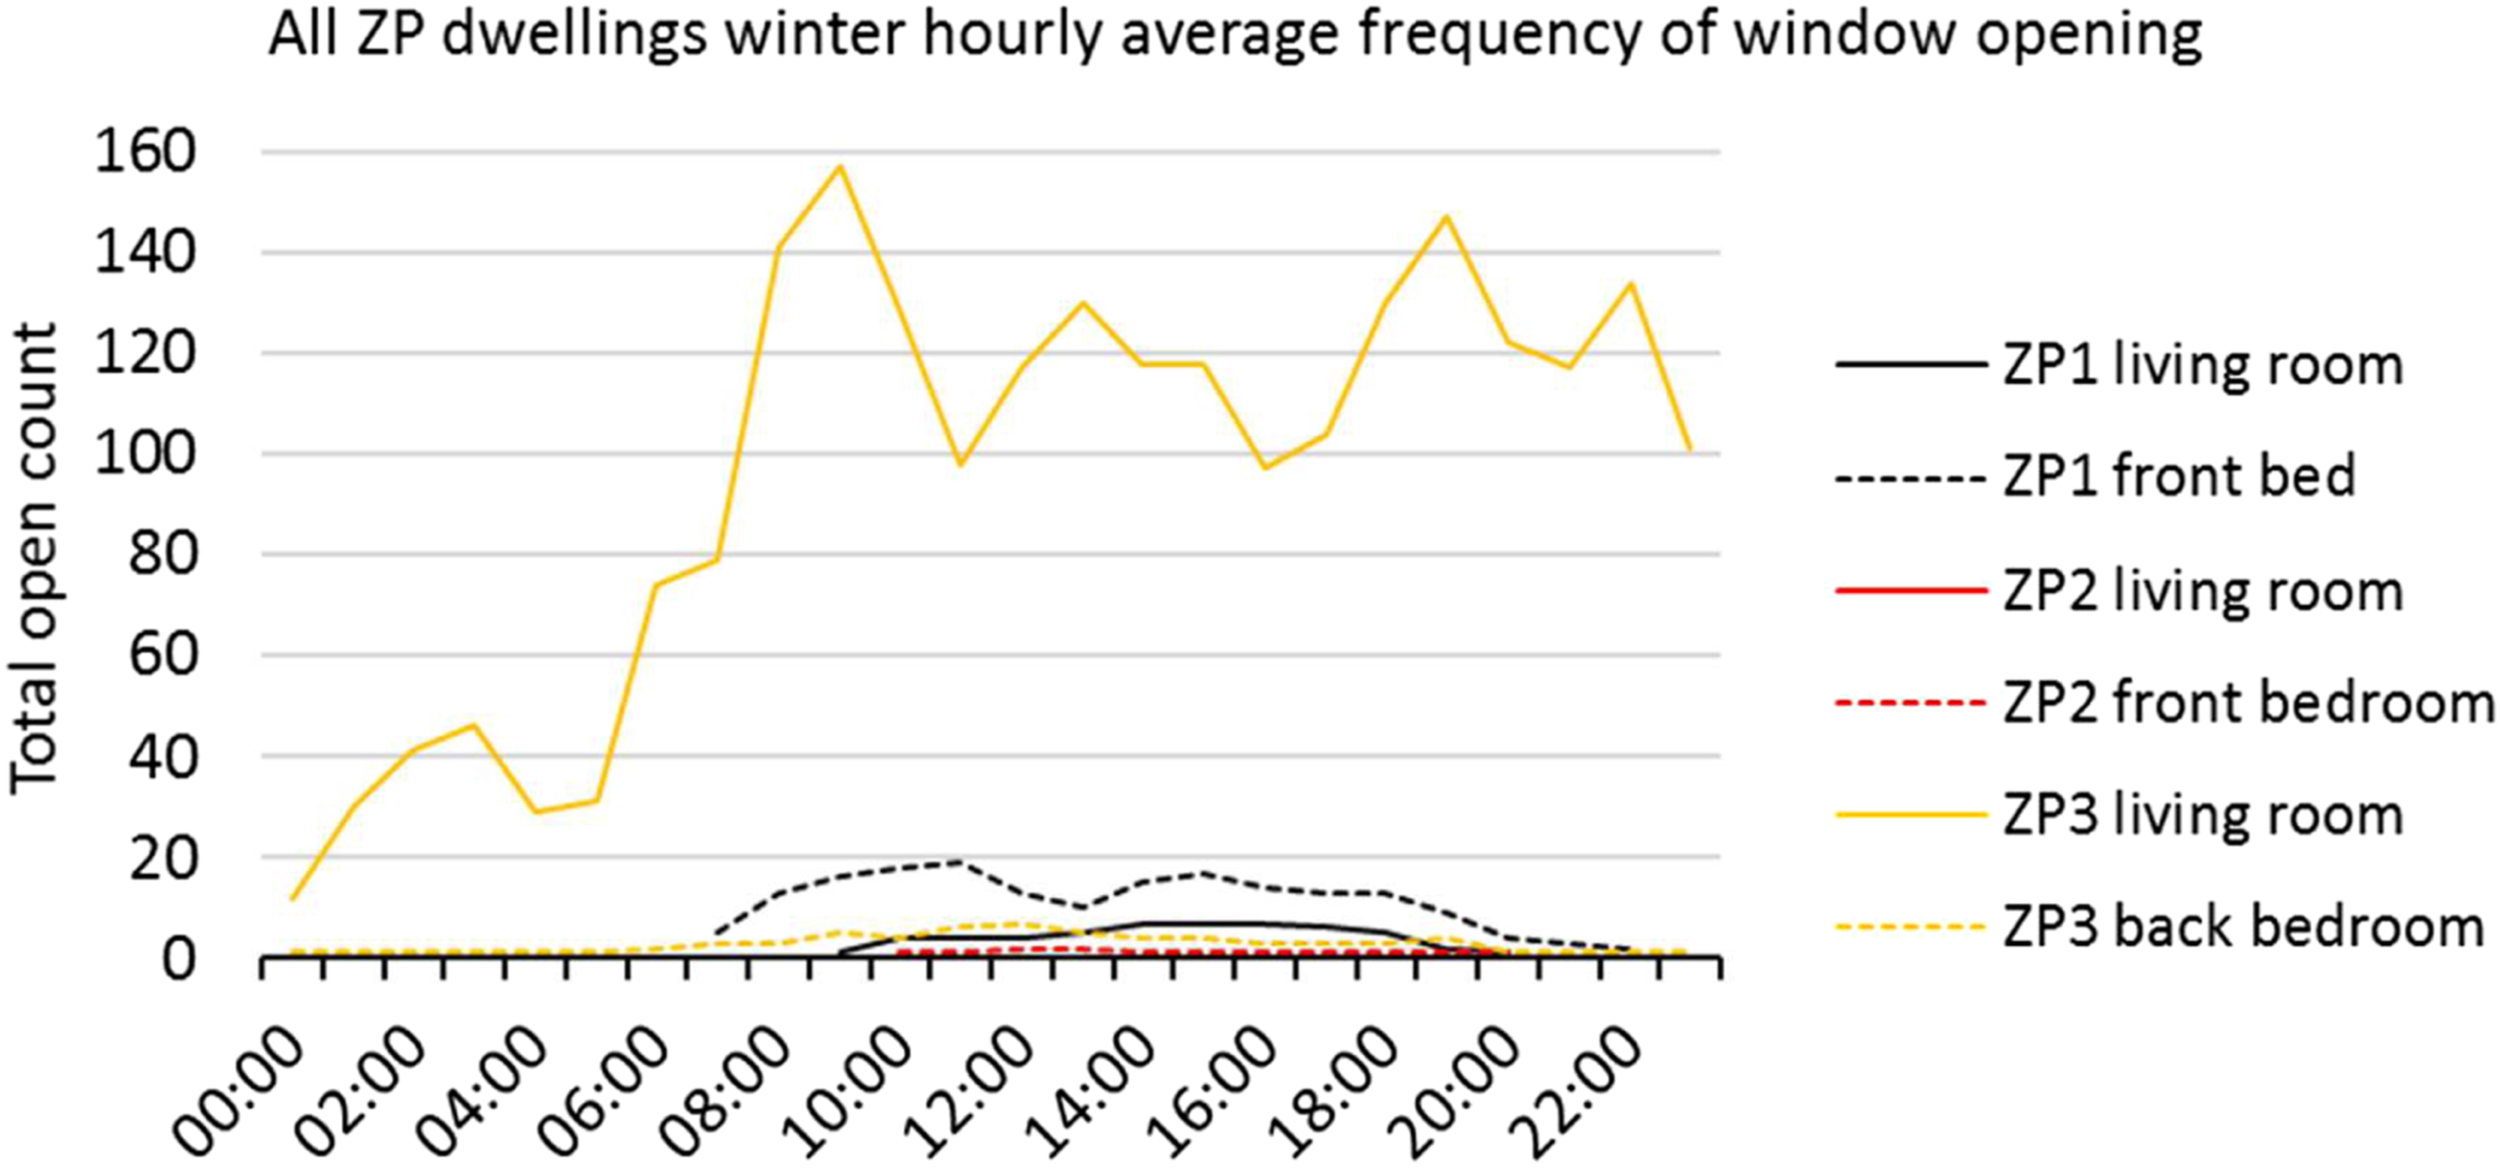
In the summer, windows were opened more frequently as expected. Dwelling ZP2 left the bedroom window open during daytime and nighttime for 26% of the time in summer. In ZP3, the garden door was opened less frequently in summer, but it was left open much longer at a time, possibly because the pet dogs were left outside for a longer period of time as compared to the winter period.
Overheating assessment
For overheating analysis, the ‘non-heating season’ is considered to run from 1 May–30 September. The overheating potential is assessed within this period which includes a month before and a month after the ‘summer’ season (June to August) used in the above analyses.
The summer of 2020 was measured to be hotter than the typical reference year (TRY) with 20 h of temperatures greater than 30oC (zero for TRY) and 71% more hours in the range of 25–30oC. For the TRY the maximum temperature is 28.8oC and the average temperature is 13.9oC. For the summer of 2020 the maximum temperature was 32.1oC and the average temperature is 15.9oC.
The summer of 2020 in York had three heatwaves.
3
Those were as follows: 1. Four days from 23–26 June with maximum of 29.7oC. 2. Three days from 10–12 August with maximum of 31.2oC. 3. Five days from 23–27 August with maximum of 31oC for 2 days in a row; this one would have been considered a heatwave in London (maximum 28oC threshold).
In the third heatwave, during the last week of August, the dwellings experienced high indoor temperatures. Figure 9 shows the temperature readings in the living rooms and bedrooms of the ZP dwellings during this heatwave. In the living room, a high of 30oC was recorded in ZP1 and temperatures above 34oC were recorded in the bedroom of ZP3. Living room (left) and bedroom (right) temperatures during August 2020 heatwave.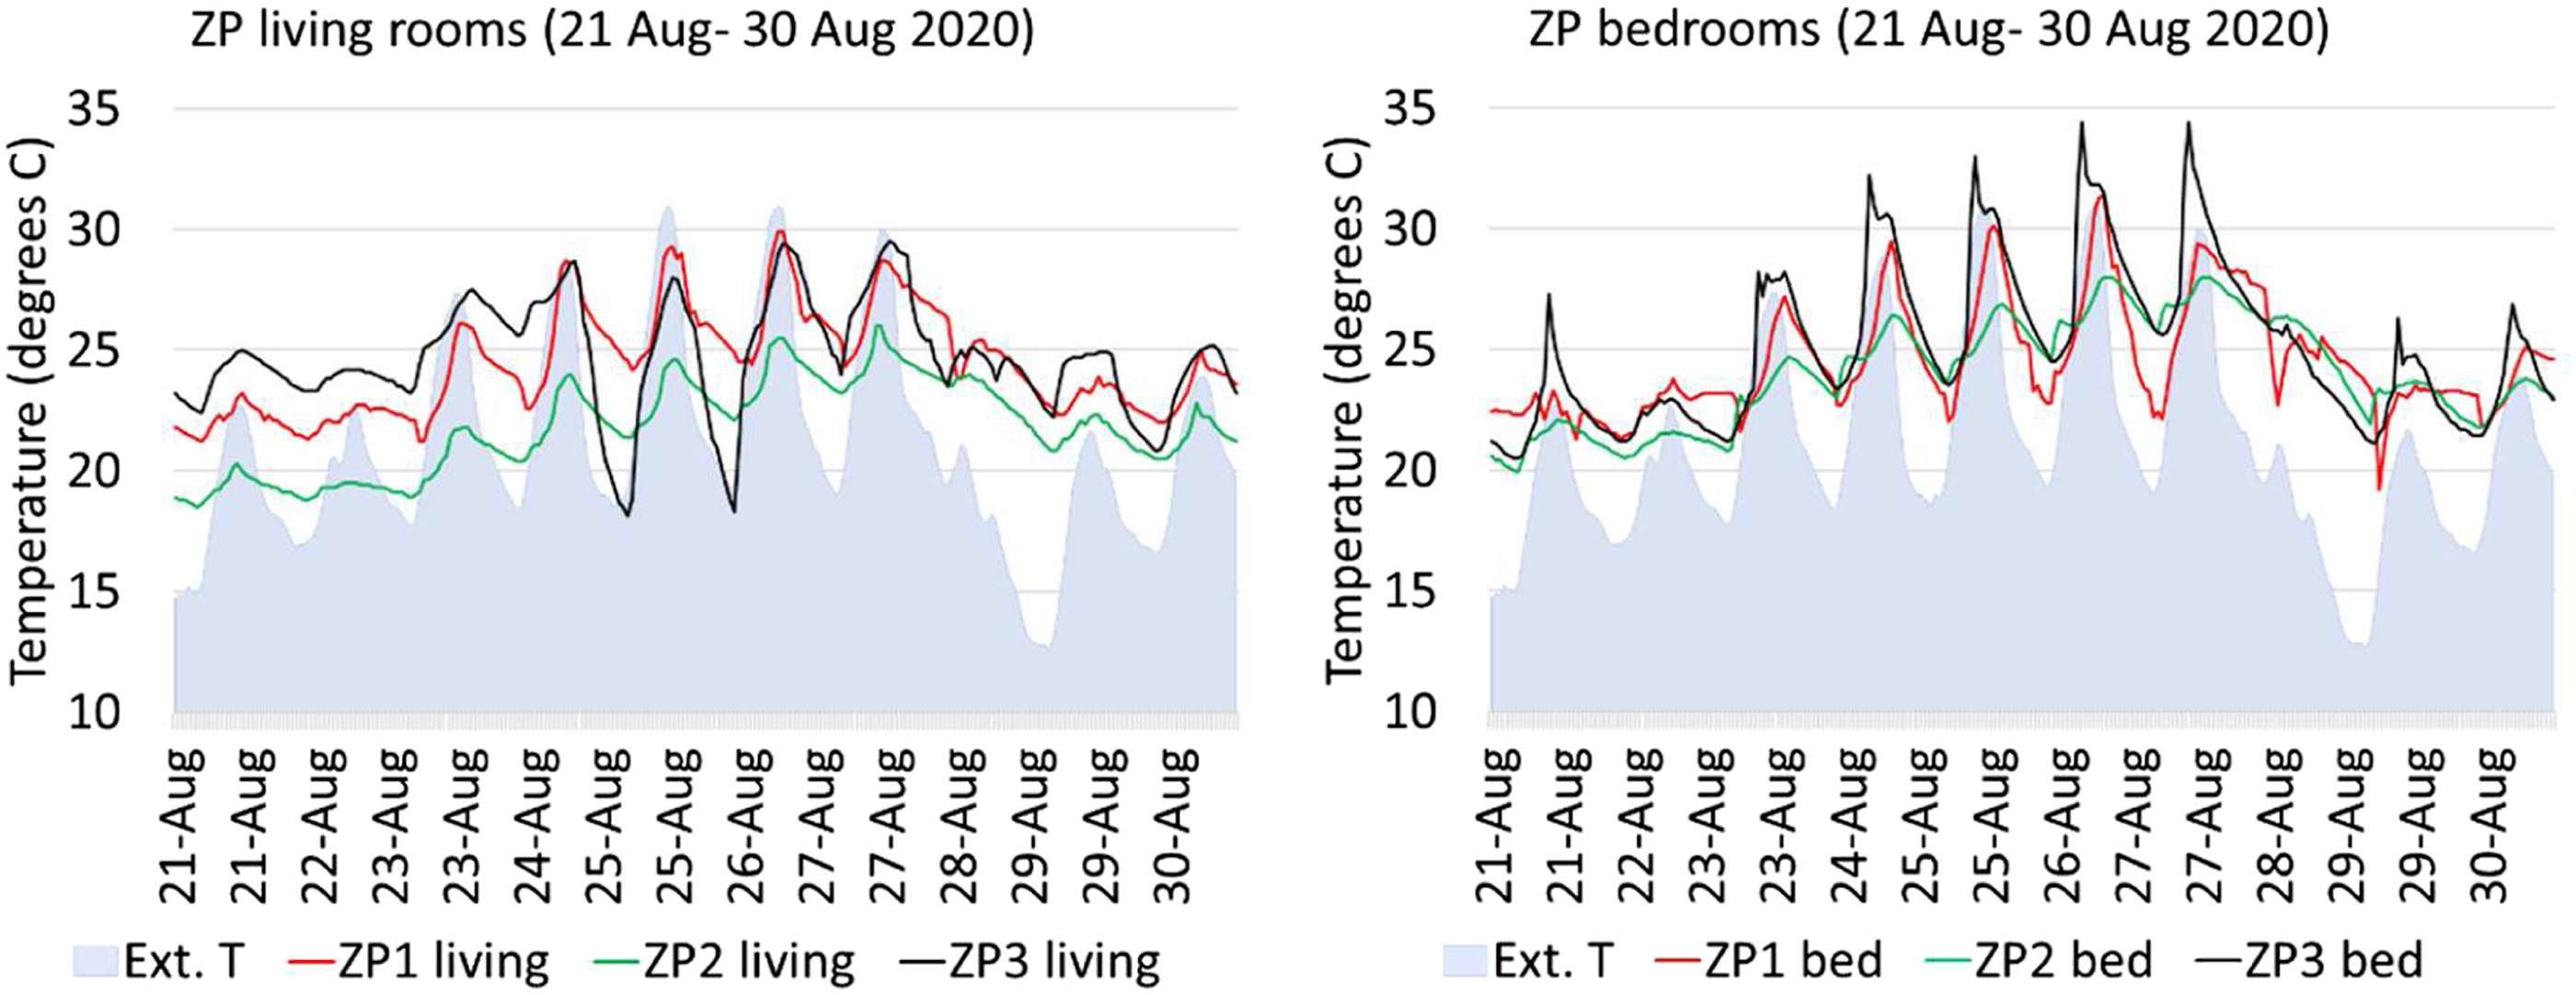
In detail: • • • ZP1 (left) and ZP3 (right) living room temperatures and window opening during August 2020 heatwave.
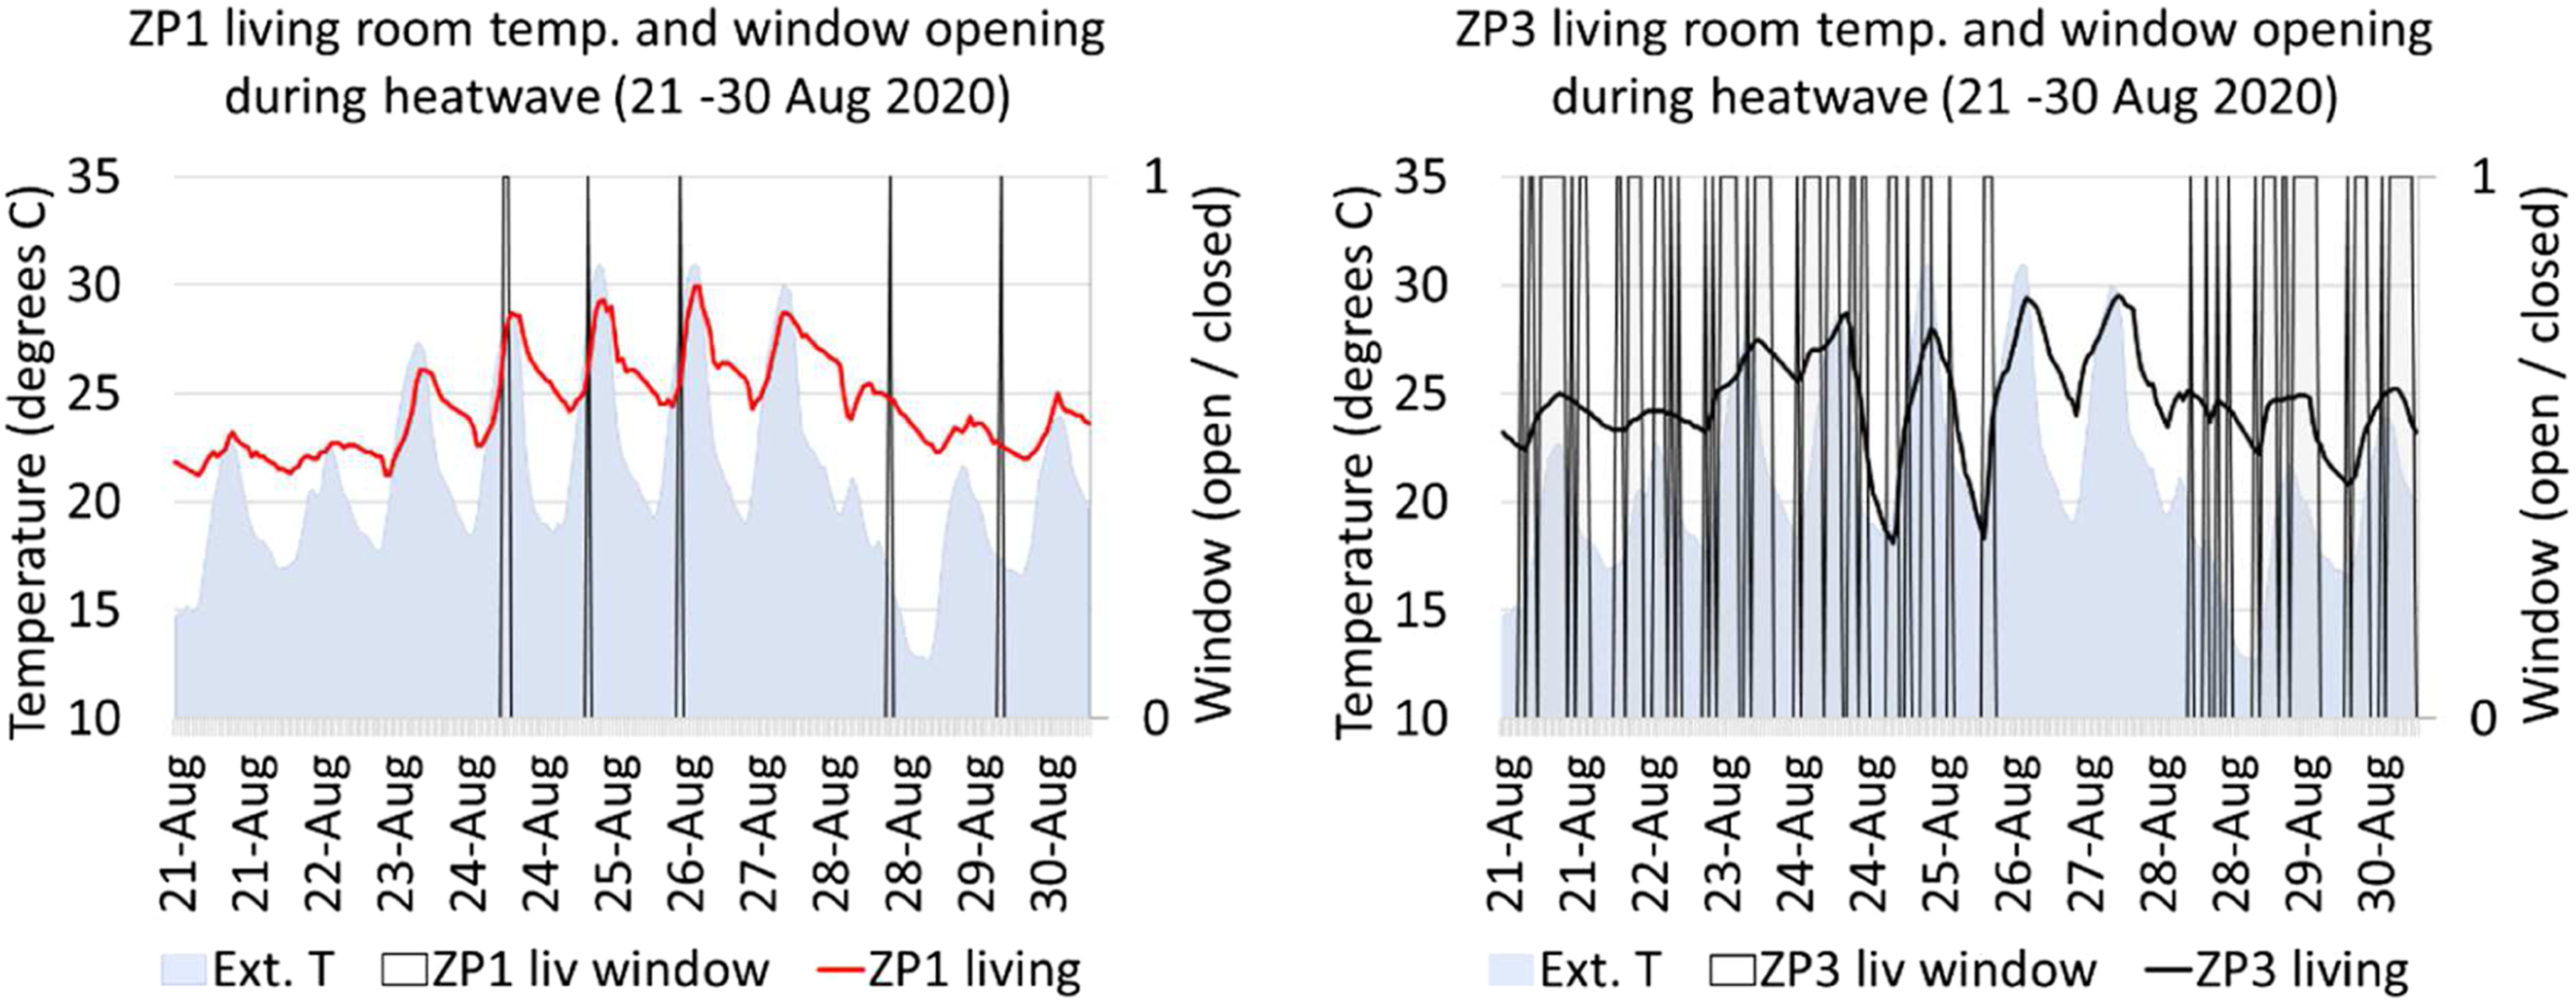
Overall, it appeared that window opening led to higher indoor temperature and higher highs during the heatwave period in the dwellings. It was possible to achieve cooler temperatures at night by opening windows, but the timing of window opening appeared to be crucial for success in cooling off spaces overnight.
Overheating results.
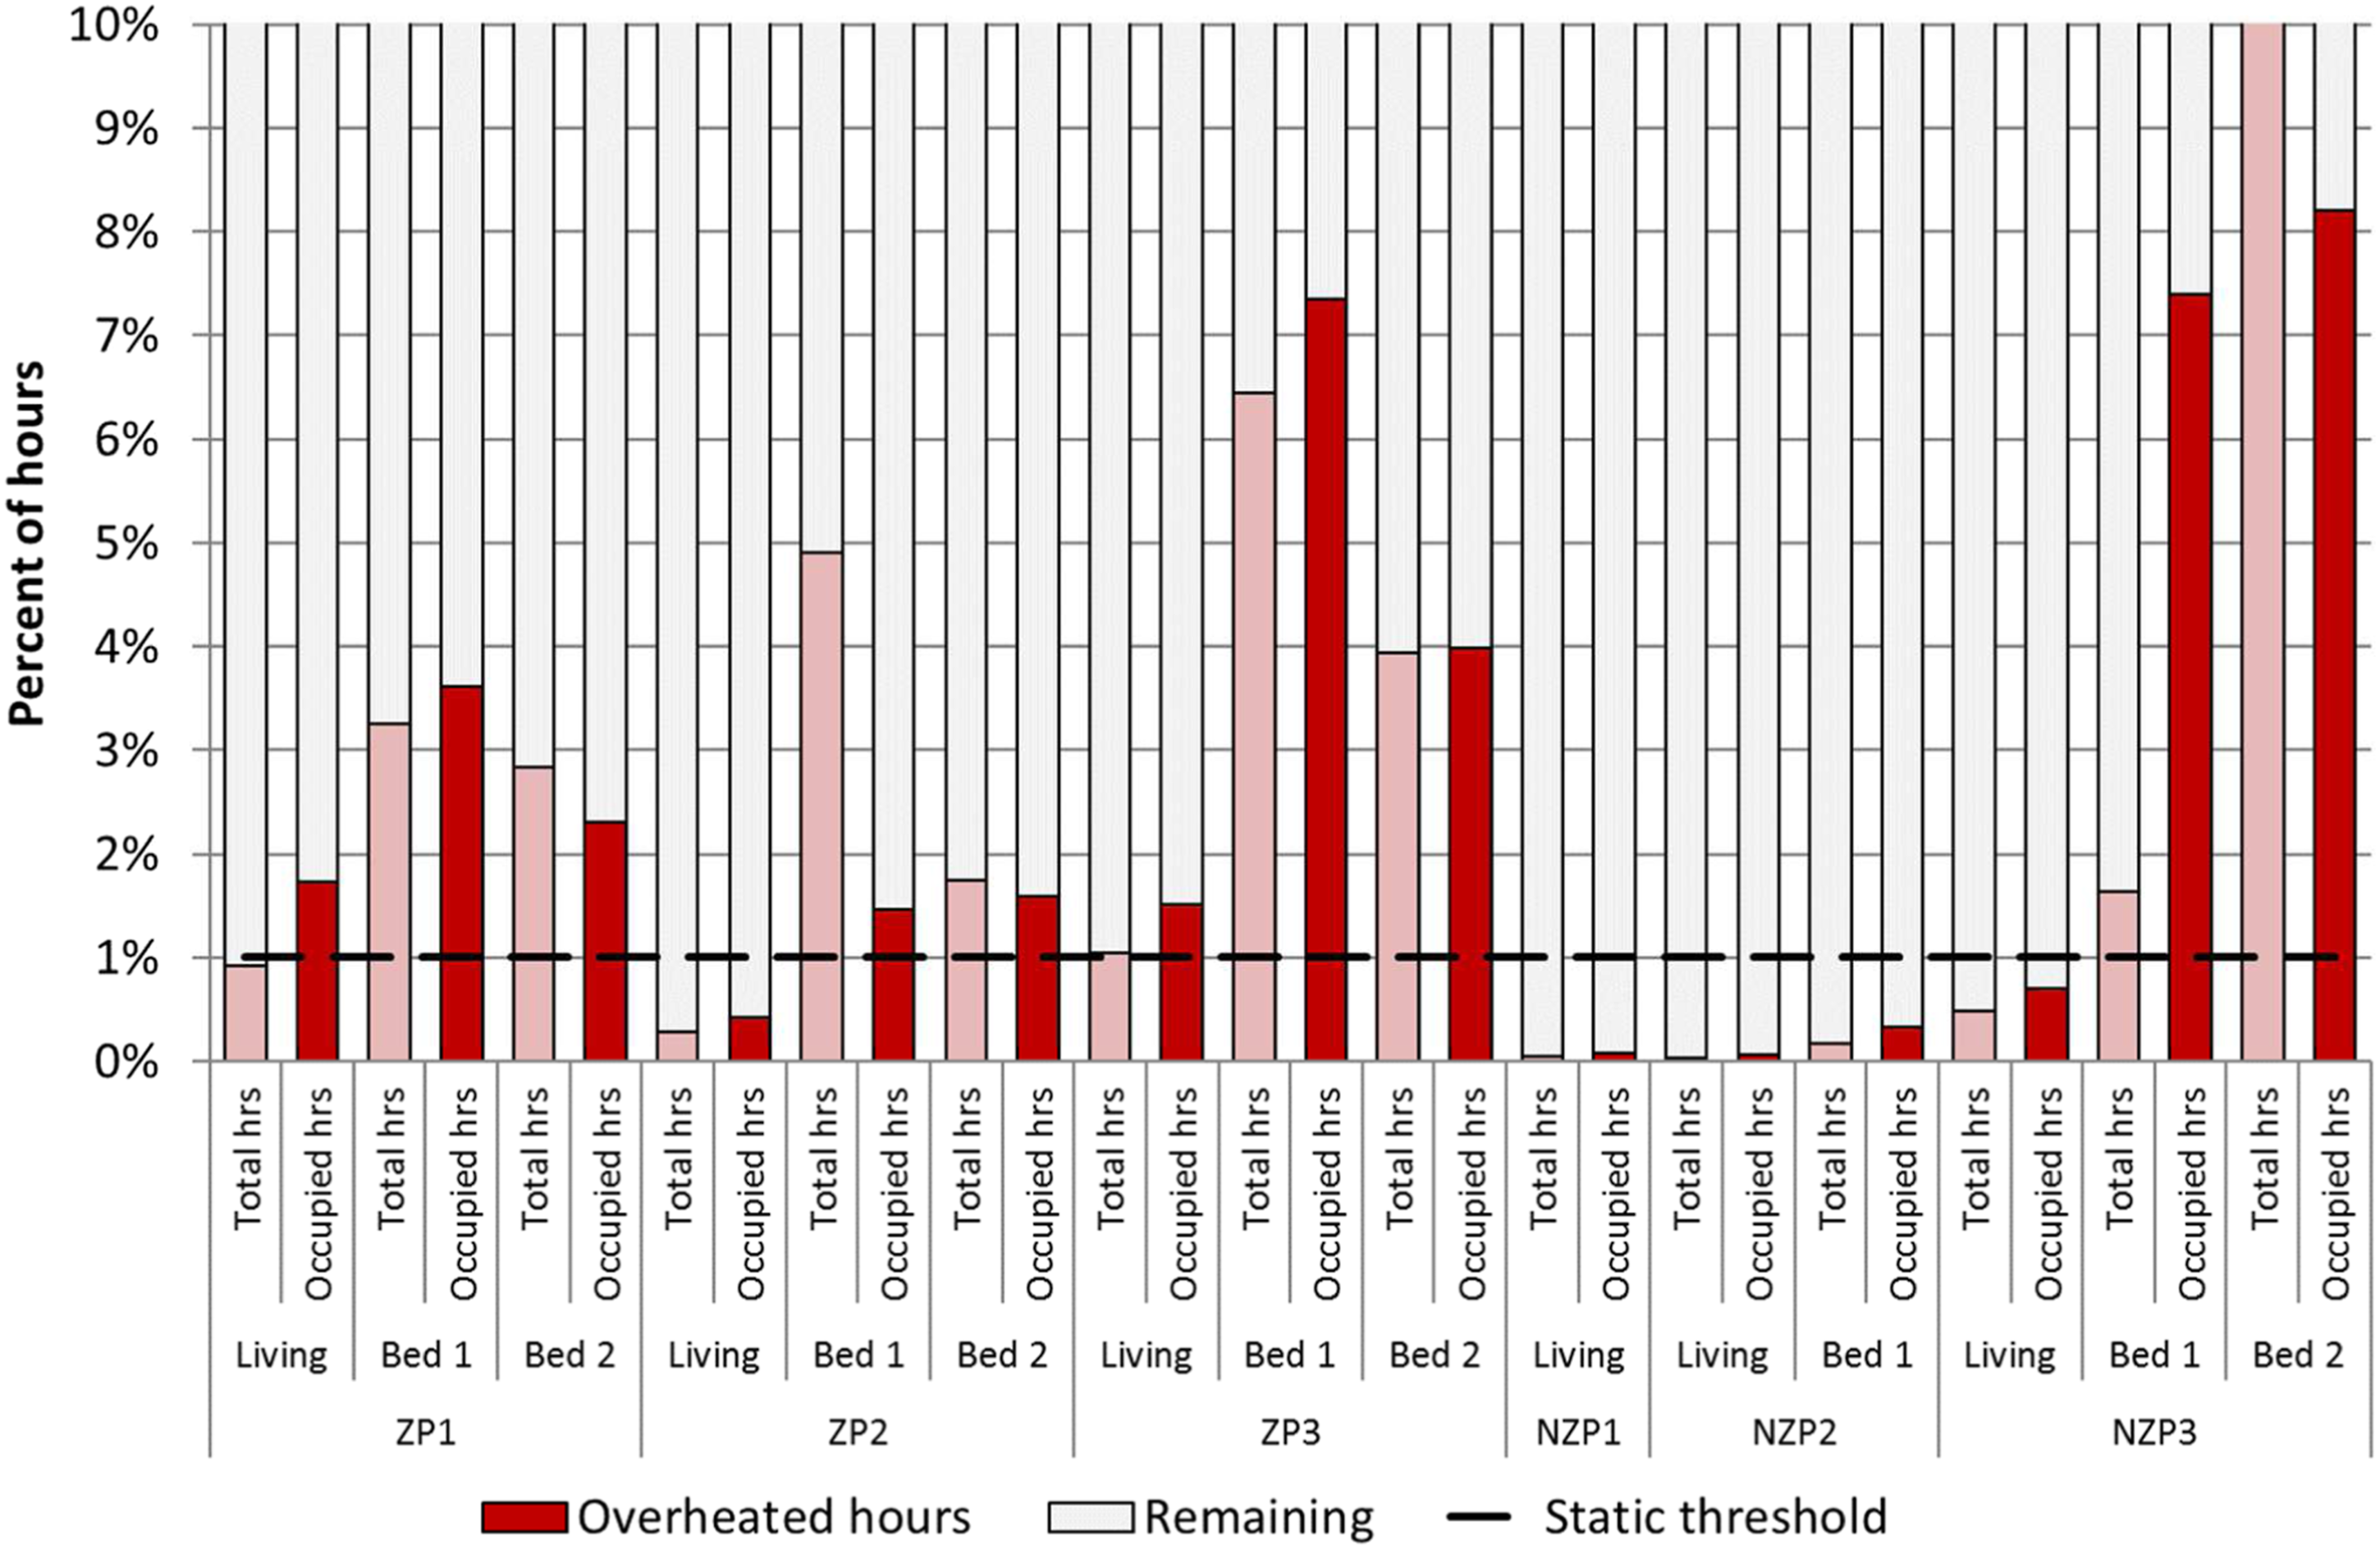
Static overheating bar graph for ZP and Non-ZP dwellings.
Set point and indoor temperature
Descriptive statistics of set point temperatures for ZP dwellings with smart thermostats.
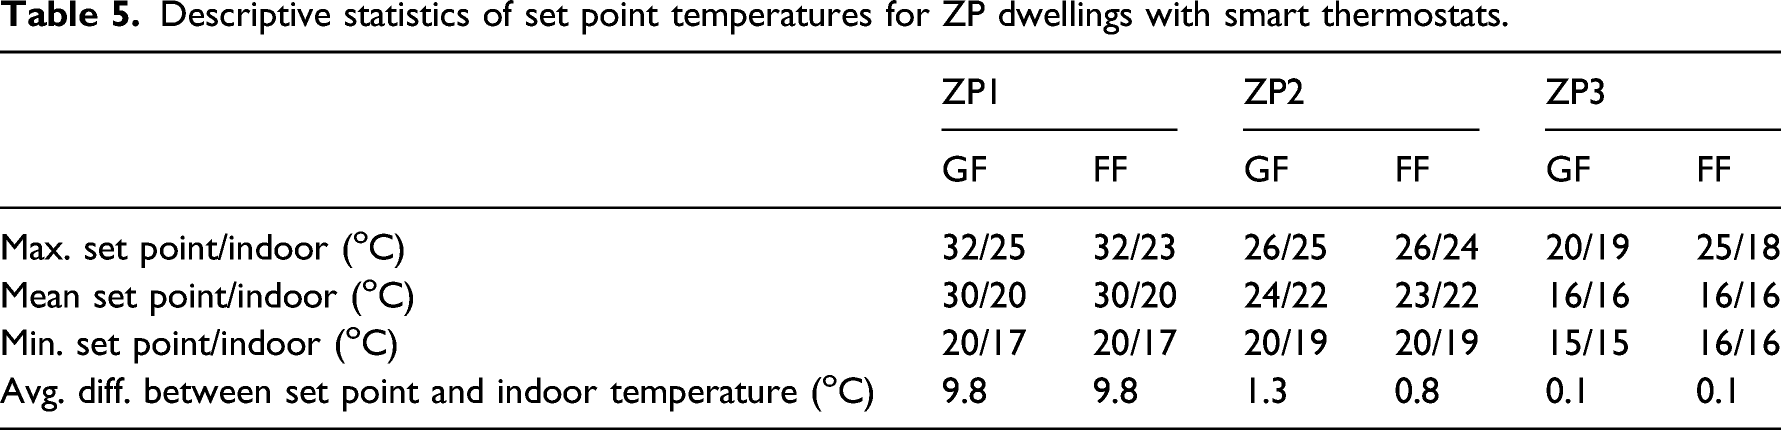
Generally, the heating season in all dwellings was from October through March with limited heating in April and even less in September. February 2020 was selected for winter indoor temperature analysis as it was the second coldest month on average for the monitoring period and allows for ZP2 data to be observed as the occupants did not occupy the dwellings until the end of January 2020. Figure 12 shows the hourly average temperatures and standard deviation of hourly temperatures in February for the ZP and NZP dwellings as clusters. The hourly average between the two groups are close although the NZP dwellings as a group maintained slightly higher temperatures throughout the day. The highest (mean 22.3oC) and lowest (mean 17oC) heat consumers are both smart thermostat users (ZP2 and ZP3). Hourly average temperatures in the ZP and NZP dwellings (left) and average standard deviation in hourly temperatures in ZP and NZP dwellings for February (right).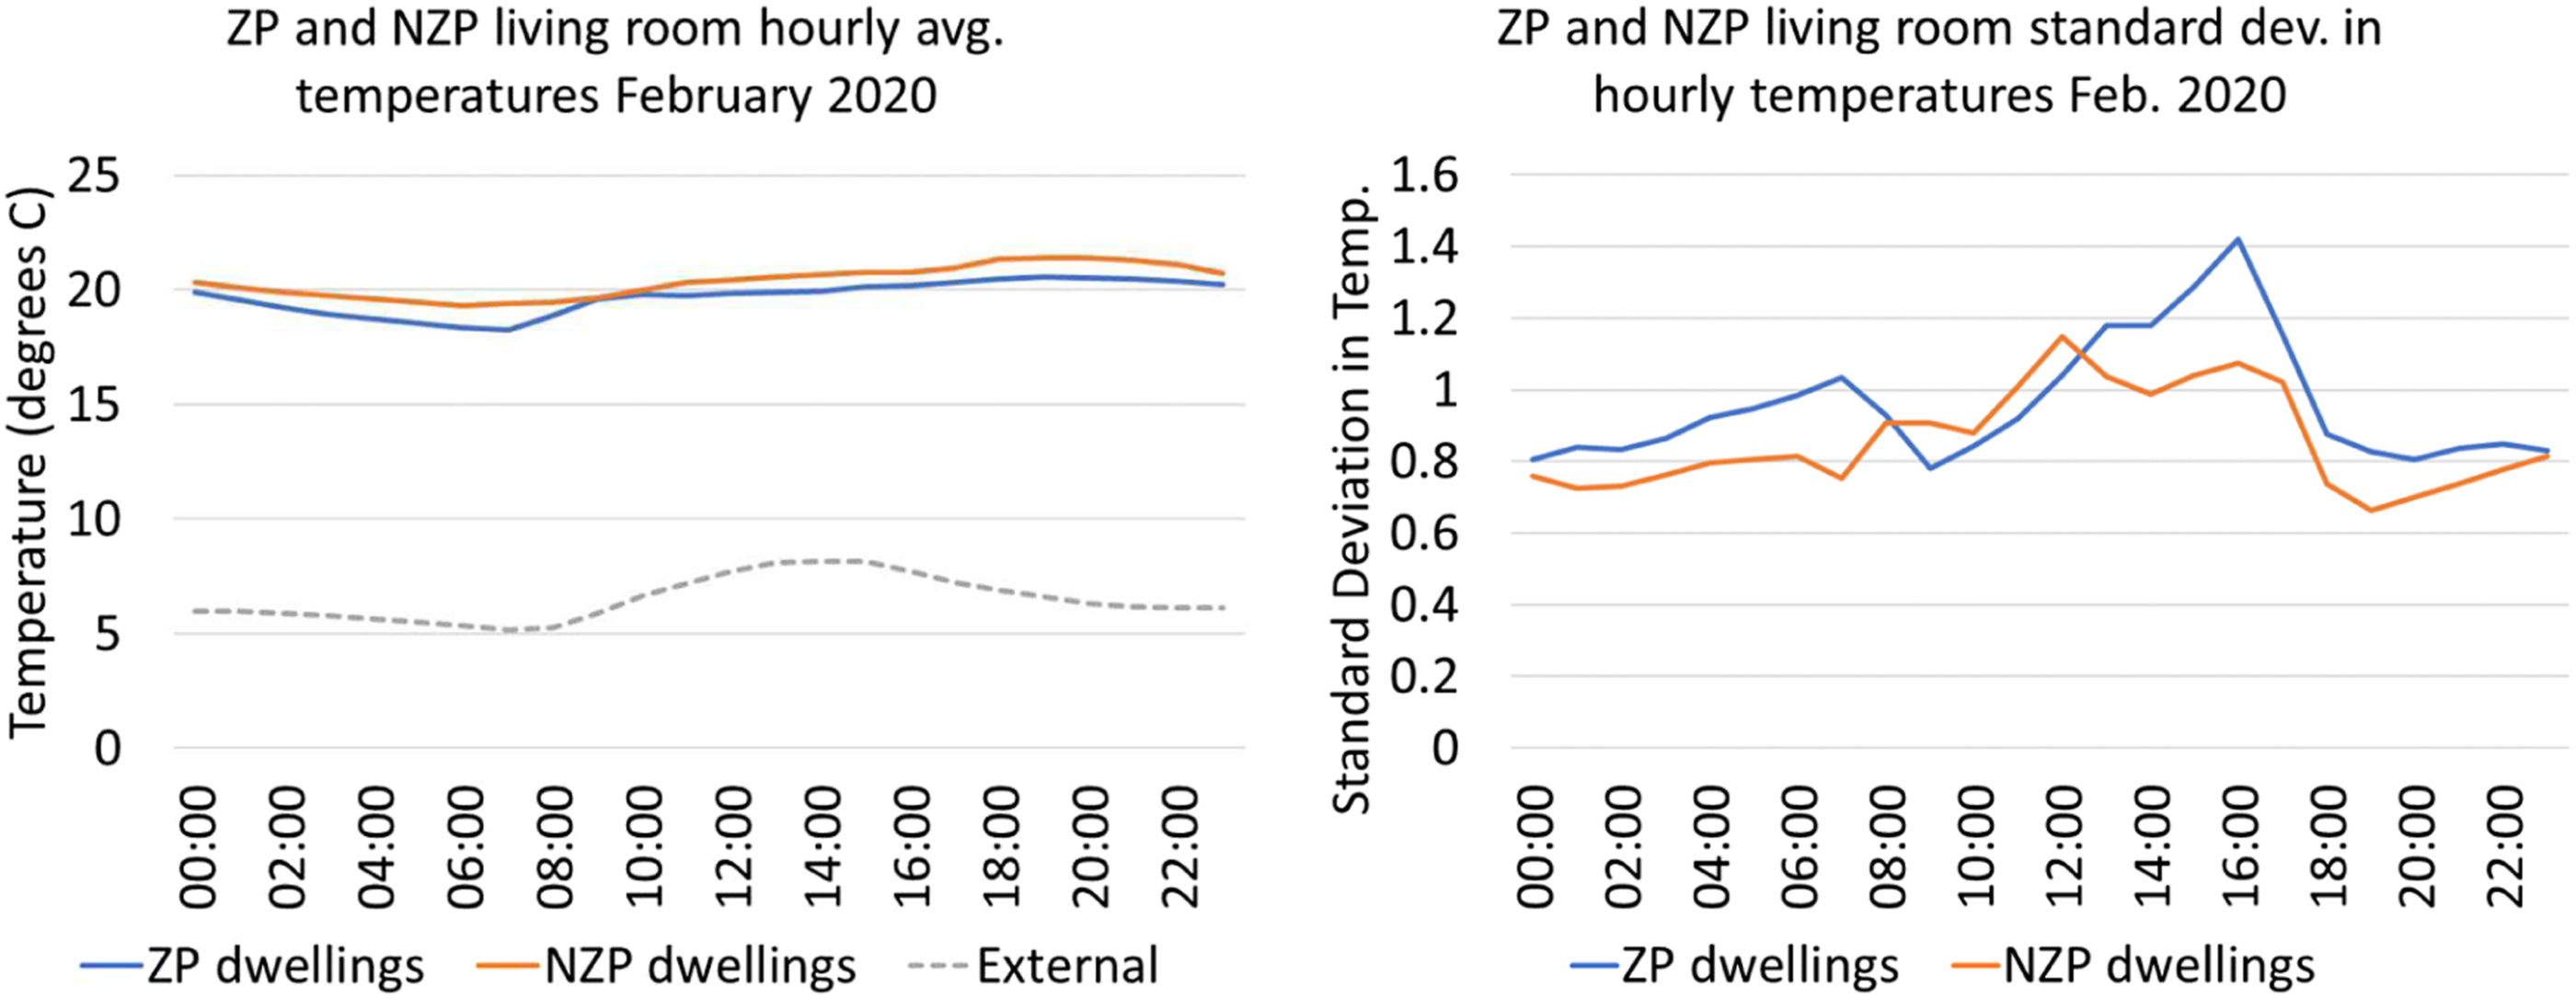
The ZP dwellings had a greater standard deviation in hourly temperature. This would suggest that the smart controls were less used to maintain constant comfort temperatures and possibly more actively used to meet on-demand temperatures. The largest difference in deviation was at 7:00 and 16:00, morning and afternoon peak hours. In detail, ZP1 and ZP2, two dwellings with the smart thermostats had much greater indoor temperature swings than the NZP dwellings. This may suggest more hands-on control of the smart thermostat but may also indicate control through other means such as at the radiator and window opening.
The distribution of temperature for the month of February for all hours in the living room and bedroom of all dwellings (Figure 13) show the presence of a wider distribution and more outliers in the ZP dwellings. This may also indicate frequent use of the thermostat to control the indoor environment outside of a set schedule. Overall winter data indicated an additional 2–3oC difference in spread between upper quartile and the maximum, and higher outlier temperatures in the ZP dwellings which would indicate more use of on-demand heating when desired, potentially resulting in more energy use. Temperature distributions in February 2020. Note: Dwellings are shown in order from left to right, that is, ZP1, ZP2, ZP3/NZP1.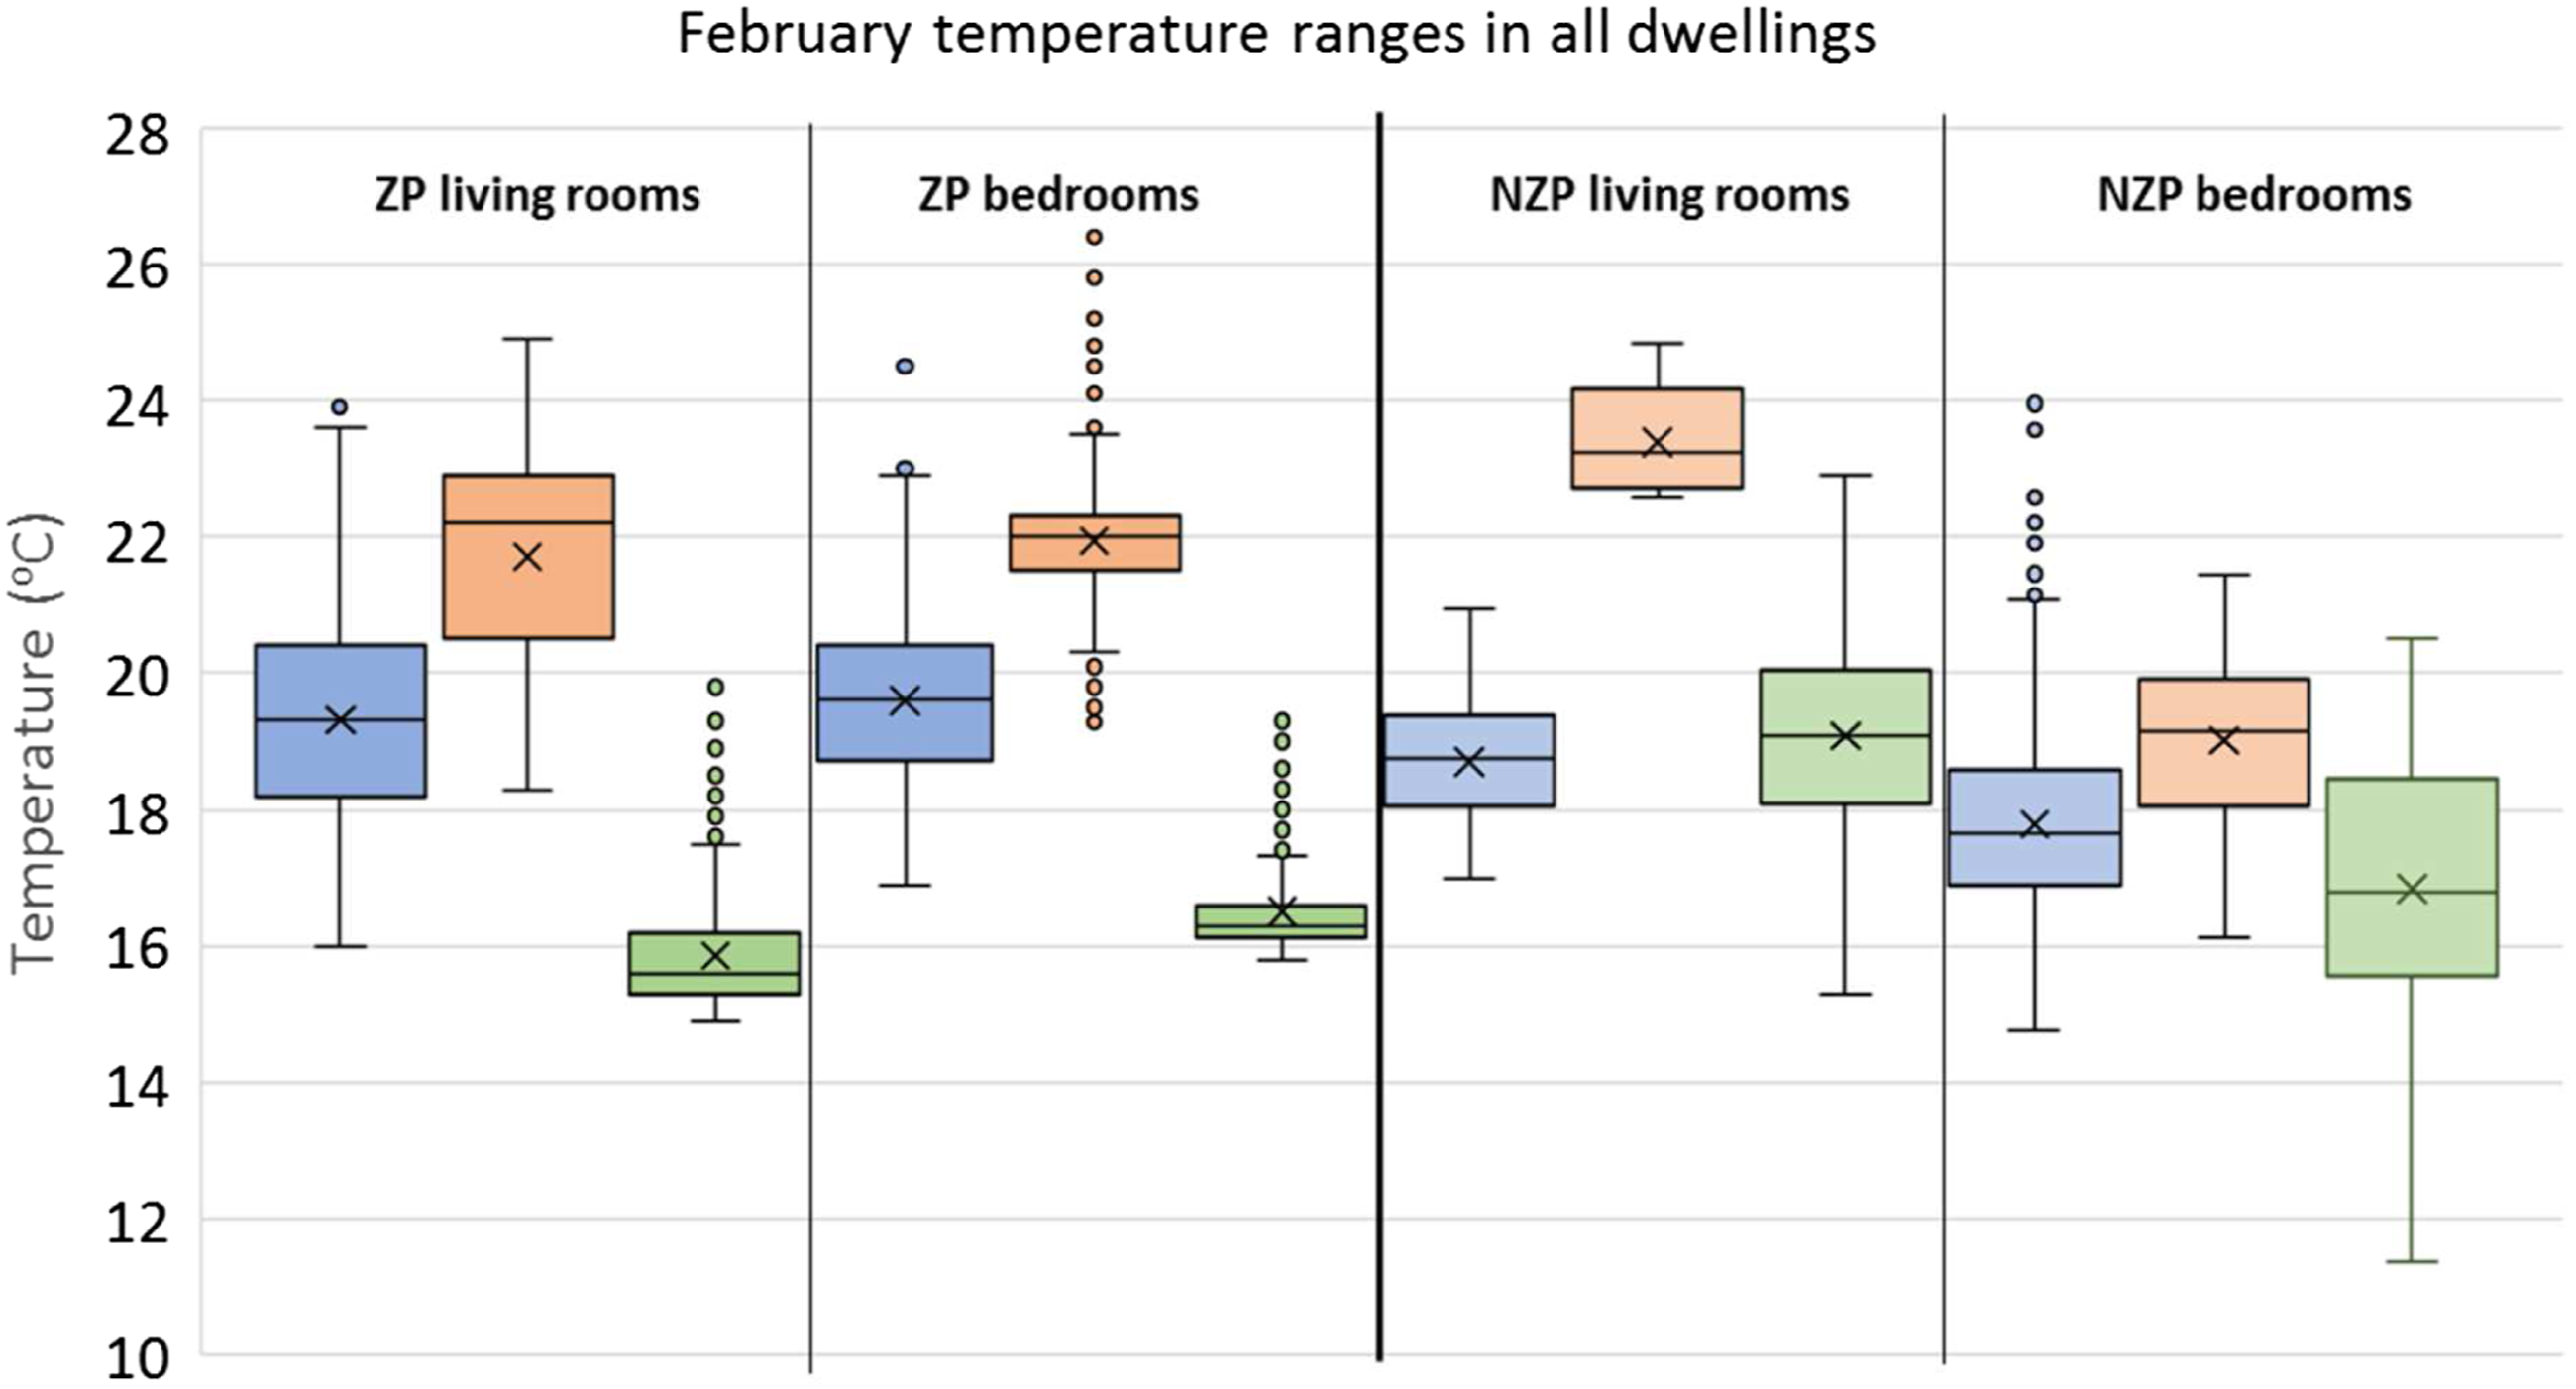
Space heating energy use data was available for the ZP dwellings, although, 75% of data for ZP1 and 33% of data for ZP2 had to be estimated through simulation. Annually, space heating energy was found to be 26.4 kWh/m2 in ZP1, 44.6 kWh/m2 in ZP2, 37.1 kWh/m2 in ZP3. In most months, as with temperatures, space heating in ZP2 was highest with the exception of March 2020, where space heating was higher in ZP3.
Perception of comfort, indoor environment and control
The BPE surveys were performed in person for the winter period (mid-February 2020) and through online questionnaires (COVID-19 protocol) for the summer period (early August 2020). For each survey period, four responses were returned (one in ZP1, one in ZP2 and two in ZP3). All respondents were fairly young with young families; native to England and typically spending most time at home. Their self-reported health condition is nearly equally split between ‘usually healthy’ and ‘chronic condition’ (one with asthma (ZP2) and one with Ehlers–Danlos syndrome (ZP3), the latter with potential impact on blood vessels and inner organs, which could lead to a general discomfort in poor environmental conditions).
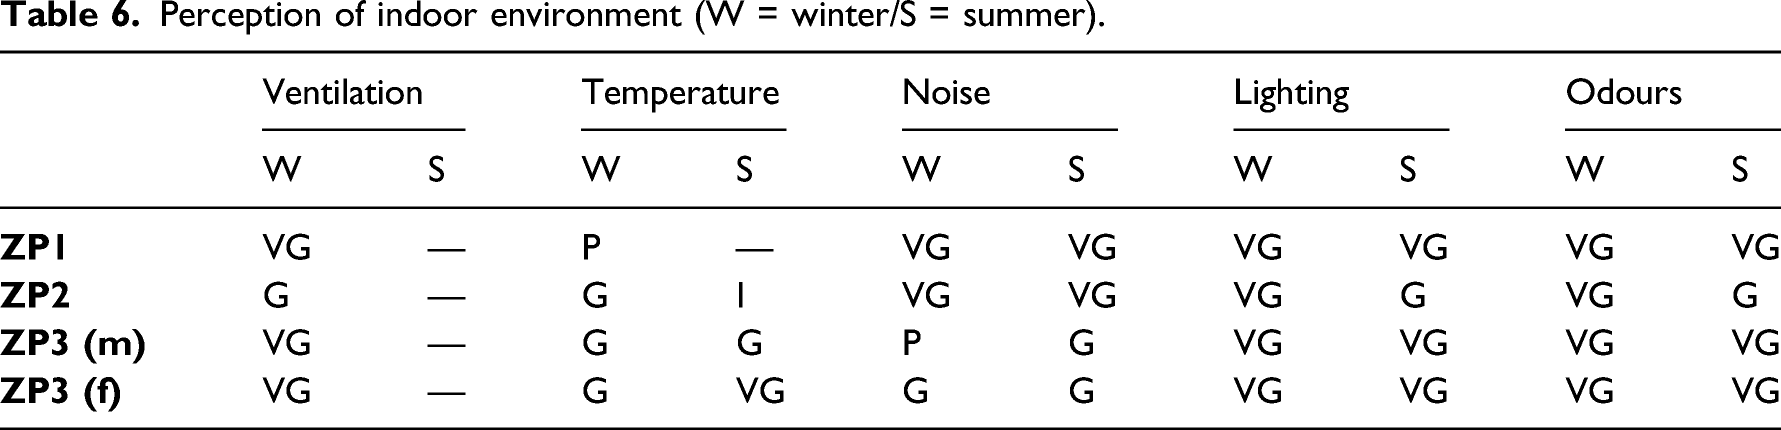
Perception of indoor environment (W = winter/S = summer).
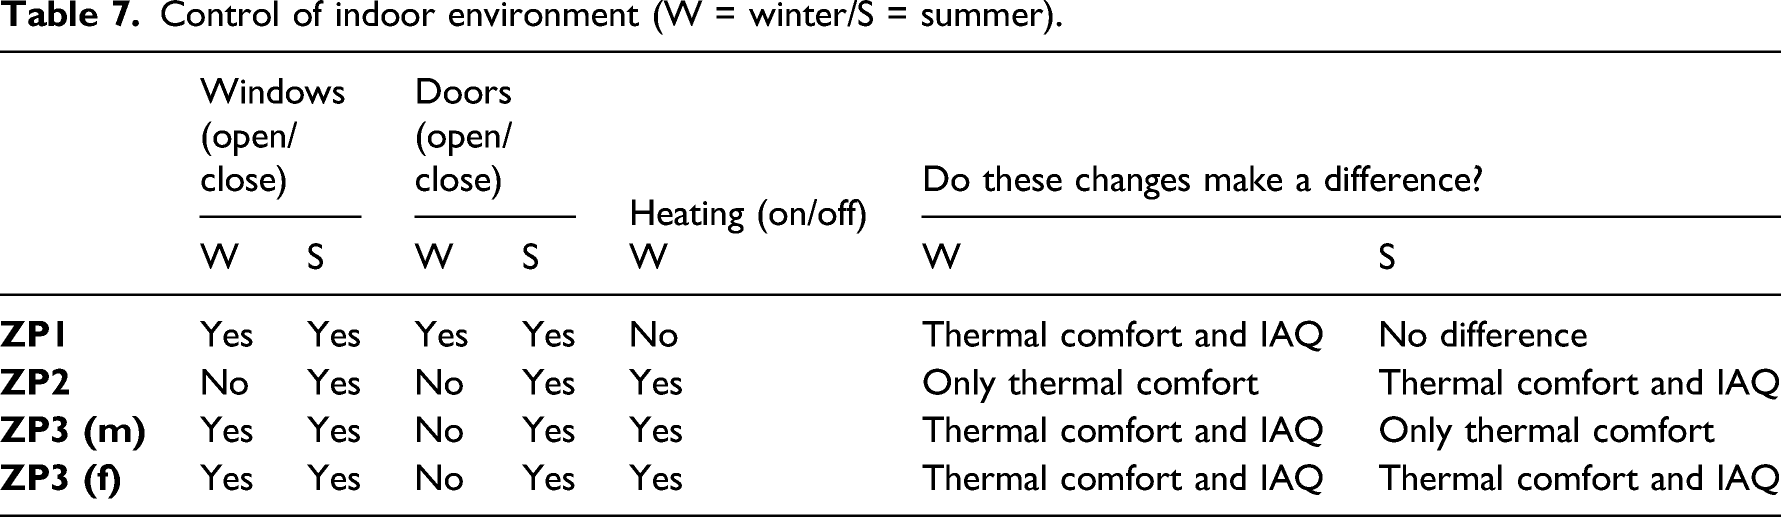
Control of indoor environment (W = winter/S = summer).
The BPE questionnaire asked the occupants to rate the heating system on two points. 1. Overall, how easy is it to control the heating? Very difficult [1] to [7] very easy. 2. Overall, how effective is the heating system at maintaining comfortable conditions? Ineffective [1] to [7] effective.
Perception of indoor environment and statistics in ZP and NZP dwellings.
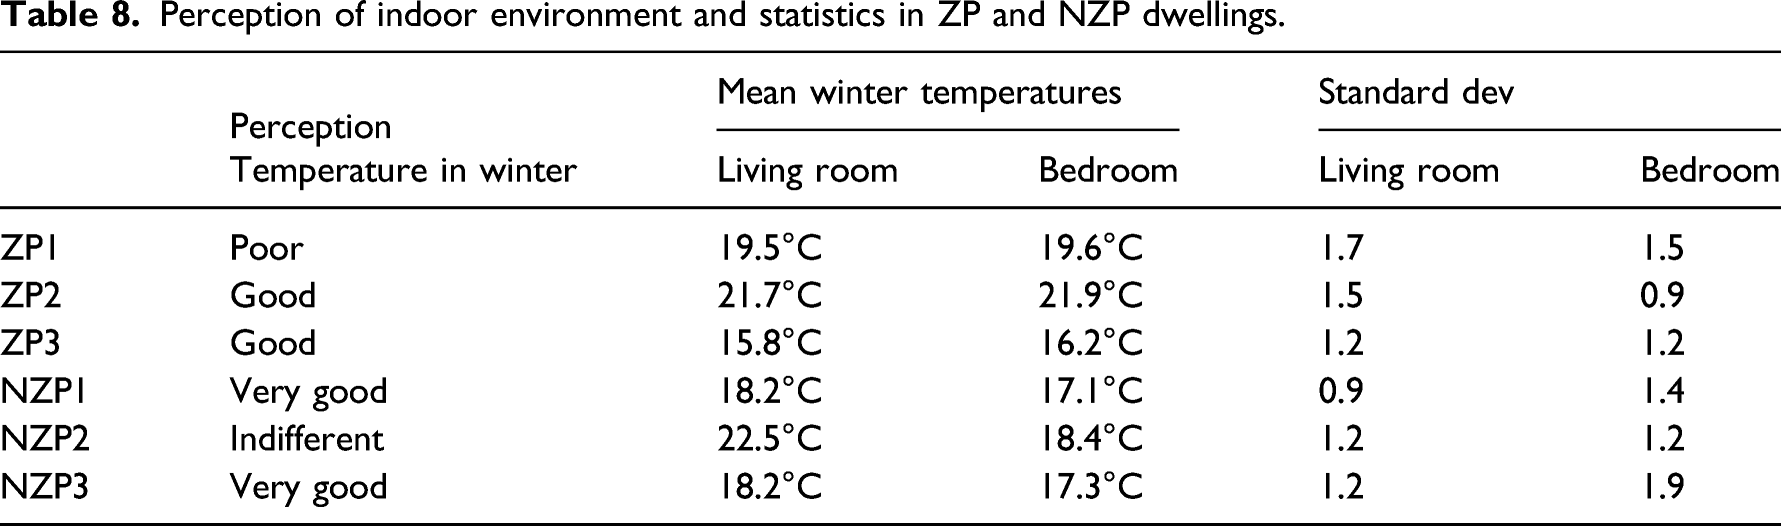
In comparing the mean temperatures and standard deviations to the perceived overall comfort (Table 8), it is evident that different mean temperatures can be perceived as good and very good.
Discussion
The presence of smart thermostats did not indicate more adequate temperature management in the ZP dwellings as compared to NZP dwellings with standard thermostats. The most notable difference was more upper quartile and outlier temperatures in the ZP dwellings which indicate regular use of on-demand heating when desired, potentially leading to more energy use. Borrowing from Sovacool et al.
28
defined heating behaviours and the monitoring results discussed in the section before, the following findings emerge: • ZP1 is considered to be an ‘On-off Switcher’ or ‘Steady and Savvy’ as they varied their set point the least and were able to maintain a household range between 18 and 20°C. • ZP2 is considered either an ‘On-demand Sizzler’ or a ‘Toasty Cruiser’, maintaining set points mostly between 22–24°C with household temperatures around 22–23°C • ZP3 is considered to be a ‘Cool Conserver’ never heating above 20°C; however, it is not known whether their motivation was due to concern for energy costs. • NZP1 and NZP3 are considered ‘Steady and Savvy’ as they generally maintain temperatures between 18–20°C in the living rooms; however, their bedroom temperature changes may qualify as a different category; generally cooler preferences in NZP3. • NZP2 is considered an ‘On-demand Sizzler’ with a tight temperature range around 23°C though it appears they prefer to sleep much cooler than they keep their living room.
The above variation across a small sample of six dwellings shows the significance of resident expectations and behaviour related to indoor heat management. It is clear that ‘smart’ features of a thermostat may not lead to energy conserving behaviours on its own, unless there is awareness raised amongst residents about the link between heating behaviours, energy use and climate emergency. Interestingly, dwellings with smart thermostats, that had more options over thermostatic control (assuming they took on a higher level of control), had slightly less satisfaction with their overall winter temperatures and their thermal comfort surveys indicated a preference for higher temperatures, implying that in some periods the controls did not work as expected. The ZP dwellings’ perceived greater control over their environment could have been a perception of control due to the expectation of the potential of the smart thermostat technology despite lack of confidence in how to use it.
Though the occupants of the ZP dwellings were instructed on how to use the smart thermostats it appears that they would have benefited from a follow-up session from the housing provider or the energy company. In ZP3’s particular set point pattern, from October–January, there was active variation in the set point from hour to hour; however, from February on, the occupants appeared to have either become accustomed to how they would prefer to operate the thermostat or became disinterested or even frustrated with trying to learn/use the fine-tuning features. A similar sentiment was found while studying smart thermostat users in Hargreaves, Wilson 17 ; Lomas, Oliveira 16 furthermore, were concerned with long-term drifts in energy demand and potential change in occupant interest not being observed in short-term studies.
Given poor ratings related to ease of control in the NZP dwellings and one dwelling outright saying that they do not know how to use the programmable thermostat, it is likely there was no training on how to use the programmable thermostats. There may be an assumption that people already know how to use ‘standard’ thermostats, thereby neglecting much needed training on how to set useful schedules, for example. As a lesson learnt, it is important to integrate training to use not only smart thermostats but also what are considered standard thermostats to influence desirable heating patterns. In addition, NZP occupants that appeared to be hesitant or unable to use their thermostat may benefit from smart thermostat accompanied with training on how to use it and or the smart learning feature in contrast to ‘always on’ high temperatures.
Conclusion
The paper analysed objective data on indoor/outdoor temperature and subjective data on thermal comfort in six similar dwellings located in the same development. Three out of the six dwellings were equipped with smart thermostats and three had standard programmable thermostats. The intent was to examine if there was any difference in the measured indoor thermal conditions and perception of thermal comfort across these dwellings.
While there was no apparent difference in the measured and perceived indoor temperatures between homes with and without smart thermostats, the six dwellings were different in heat management, ability and ways of controlling the internal environment. Since the six dwellings were similar in built form and construction, it is evident that heating preferences and expectations can overtake the capabilities of a smart thermostat or a standard programmable thermostat. In light of the wide variation in measured indoor temperature across the six dwellings, it is vital that energy models consider a range of heating preferences to avoid a gap between expectation and reality.
Assuming indoor temperature during the heating season as proxy for heating energy consumption, the highest and lowest consumers were found to both be smart thermostat owners. This would suggest that factors such as resident expectations, preferences and understanding of heating controls are more consequential than simply installing a smart thermostat. Without appropriate training, overarching preferences and behaviours of the occupants can be carried from one type of thermostat to the next, negating any special or ‘smart’ features.
For the upcoming ECO smart heating technology rollouts, it is vital to have training of residents on use of the system and trouble-shooting should the control not yield the expected result. The different needs and requirements of the occupants need to be addressed and the solution will need to be highly customisable to the user. This will be an important step in achieving the intended energy savings of these smart controls that are expected to become widespread in a smarter energy system.
Footnotes
Declaration of conflicting interests
The author(s) declared no potential conflicts of interest with respect to the research, authorship, and/or publication of this article.
Funding
The author(s) disclosed receipt of the following financial support for the research, authorship, and/or publication of this article: This work was supported by the Zero Plus research project, which has received funding from the European Union’s Horizon 2020 Research and Innovation programme under Grant Agreement No. 678407.