
Abstract
This paper presents the energy and environmental performance of whole house energy systems implemented in six 1970s bungalows in South Wales, owned by Swansea Council. The objective was to reduce energy demand and carbon emissions, maximise renewable supply whilst ensuring a comfortable and affordable home for the residents. The whole house energy system for each home involved the installation of a combination of passive and active low carbon solutions. Detailed monitoring was carried out for a year before and for more than 2 years after the work, annual figures have been validated and normalised for weather. Analysis of monitored data confirms that Standard Assessment Performance ratings improved from 12 to 95. The average annual energy consumption across the six bungalows was reduced from 16,117 to 4560 kWh. 2418 kWh was provided by the PV panels and battery, with 1963 kWh of excess electricity that could be sold back to the grid. Real-life average Ground Source Heat Pump CoP was monitored at 3.3. Embodied carbon for retrofitting each house is estimated at 22,980 KgCO2e +/−20%, approximately 5-years carbon payback. Indoor conditions have been improved with internal temperature and relative humidity achieving standards with residents reporting levels of improved comfort satisfaction.
Introduction
The importance of improving the energy performance of UK homes to achieve ambitious emission reduction targets has been emphasised by the UK Government. 1 The Building Research Establishment (BRE) has highlighted the benefits of improving poor housing to the National Health Service (NHS) and society. 2 Financial incentives have been established to help push towards upgrading and decarbonising buildings, especially homes. For example, the Welsh Government has funded a series of programmes to upgrade the energy efficiency of homes targeting Registered Social Landlords and local authorities. 3 Programmes such as the Optimised Retrofit Programme (ORP) aim to set the standard for retrofit schemes, to help share best practice and set out a pathway to net-zero. 3
The Low Energy Transformation Initiative (LETI) and the British Standards Institute (BSI), through PAS2035 have developed guides and frameworks to assist in the retrofit decision making process.4,5 The ORP, LETI Standard and PAS2035 emphasise the importance of environmental and energy monitoring to provide quantifiable evidence and assess retrofitting strategies.
The Centre for a Low Carbon Built Environment (CLCBE) at the Welsh School of Architecture at Cardiff University has been providing evidence to support the scale up of low carbon retrofits. CLCBE has delivered whole building energy systems with relevant stakeholders from planning, through design, procurement, installation, to maintenance and operation.6–10 By working closely with residents, local authorities, social housing providers and supply chains, research has ensured that low carbon solutions are practical and appropriate. 11 The objectives of the CLCBE projects were to reduce carbon emissions, reduce energy bills, therefore reducing fuel poverty 12 whilst providing an improved built environment, including comfort and aesthetics. All the CLCBE projects have been monitored extensively to provide information for the retrofit decisions and to quantify the impact of the applied solutions.
This paper will focus on a case study project where the CLCBE team worked collaboratively with Swansea Council to retrofit six bungalows (anonymised as A, B, C, D, E and F) taking a whole building energy systems approach to combine reduced energy demand, renewable energy supply and energy storage. The homes, located in a semi-rural area of Swansea County in south Wales. They are single-storey bungalows, L-shaped and terraced with a floor area of 64 m2 including 2 bedrooms, living-room, kitchen and bathroom with gardens to the front and rear (Figure 1). The roof has four aspects including south-west and south-east. Windows and doors were double glazed PVC. The homes are off mains gas and prior to retrofit they used oil, bottled liquid petroleum gas (LPG) or individual electric resistive heaters for space heating and hot water. Occupants indicated high bills and comfort issues including damp, draughts and cold temperatures. Six pre-retrofit bungalows (credit: CLCBE team).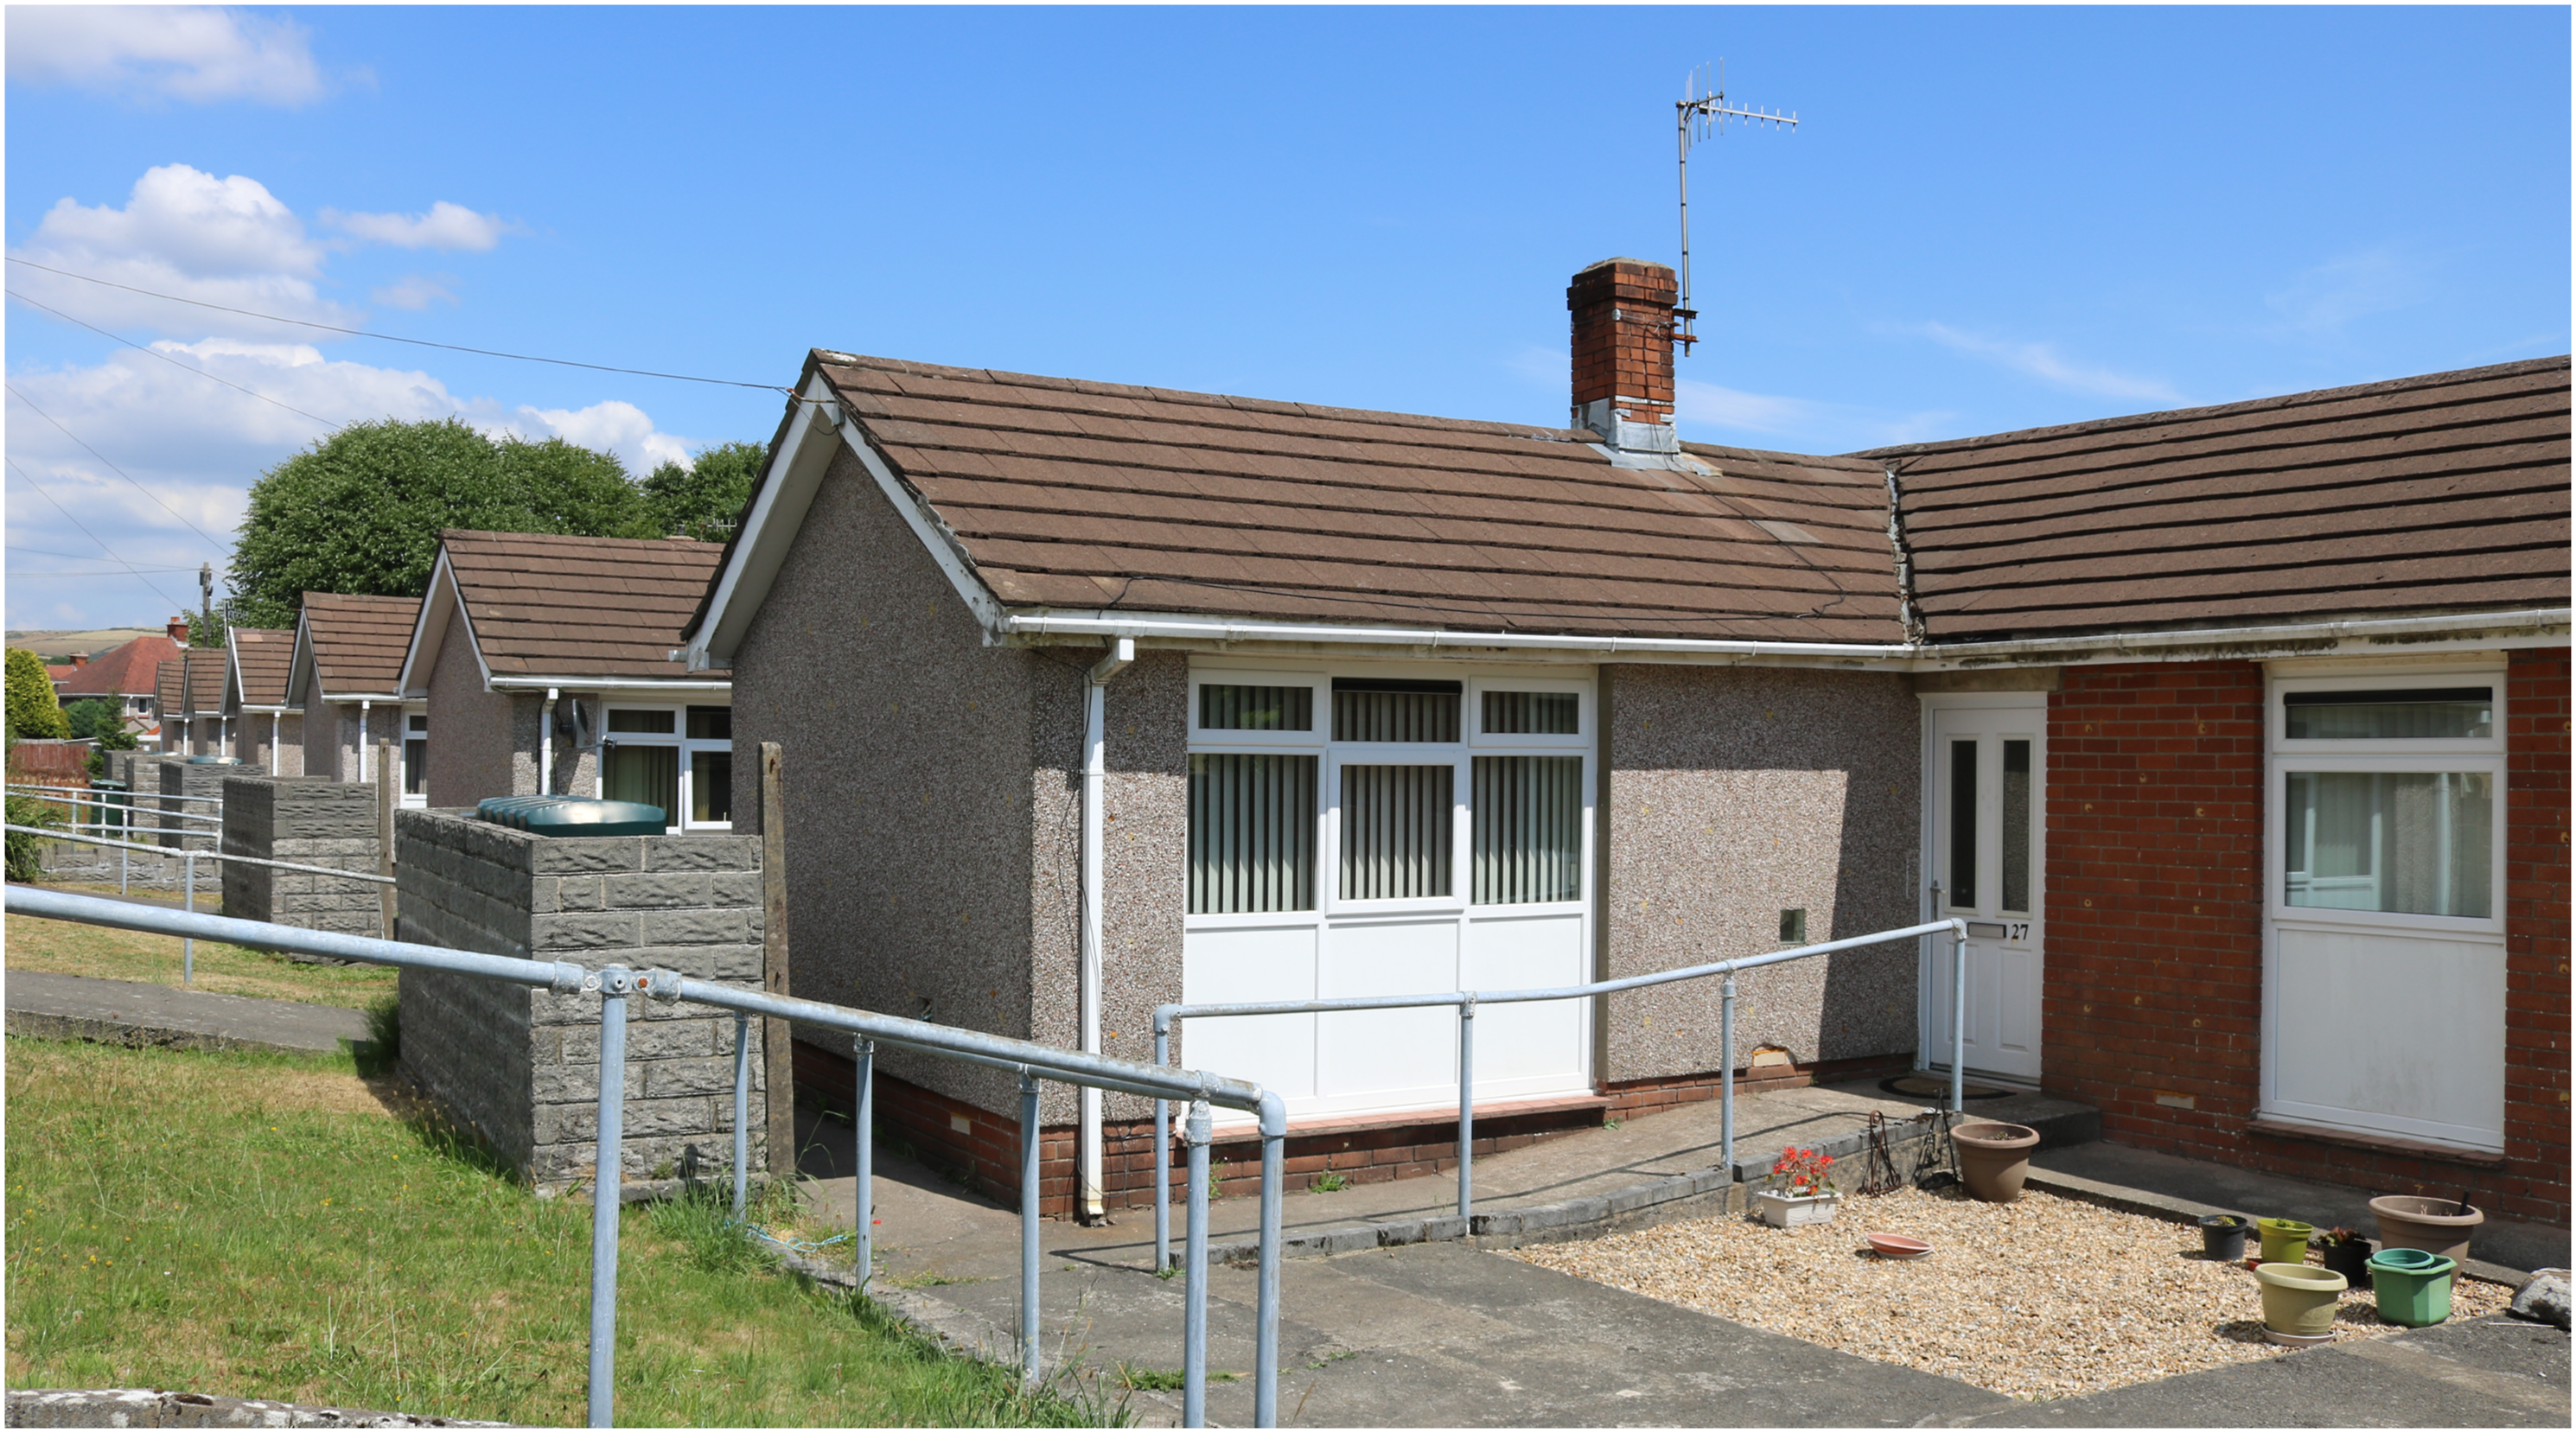
A comprehensive pre- and post-retrofit monitoring program was deployed based on a holistic building performance evaluation approach previously developed and implemented by researchers at the Welsh School of Architecture, Cardiff University.13,14 Monitoring was undertaken to understand how residents use their homes, to quantify the performance of the fabric and systems, evaluate the comfort and diagnose specific issues for each home. The program allowed for modelling calibration, building diagnostics, quantification and comparison of operational energy, cost and carbon reductions between pre and post-retrofit and against benchmarks and evidence performance gap reduction. 15 This paper presents the methodology taken to carry out retrofitting based on informed decision making and also monitoring to evaluate real-life performance of the solutions applied. All homes benefitted from the same solutions and results present intercomparison of the homes’ energy performance and impact on energy reduction and comfort.
Methodology
The main retrofit priorities set by Swansea Council and CLCBE were to reduce carbon emissions, reduce energy bills and therefore fuel poverty whilst improving the built environment for improved comfort and aesthetics. A fabric-first approach with electrification strategy including electricity services, generation and storage on site was taken. It was agreed that residents should not decant during the works as it would add additional cost and would be disruptive for everyday living. With residents remaining within the homes whilst works were carried out, timelines were carefully planned to minimise disruption for residents. Where changes were required communication with stakeholders was critical to ensure that trust was maintained. A workflow was developed by the CLCBE team that was based on RIBA Plan of Work Figure 2. 16 Adjustments were made to focus on retrofits whilst also simplifying the language for all stakeholders to clearly understand the difference between the stages to enable communication (During the design stage). Data collection, analysis and communication were fundamental at all stages to ensure information flowed horizontally (between stages) and vertically (between stakeholders). Evidence such as photographs of systems, fabric and details of problems such as damp was collected throughout the stages.
Both parties agreed that modelling and monitoring would provide valuable evidence to allow informed decision making for both this project and for future retrofit programmes. LCBE retrofit workflow stages (credit: CLCBE team).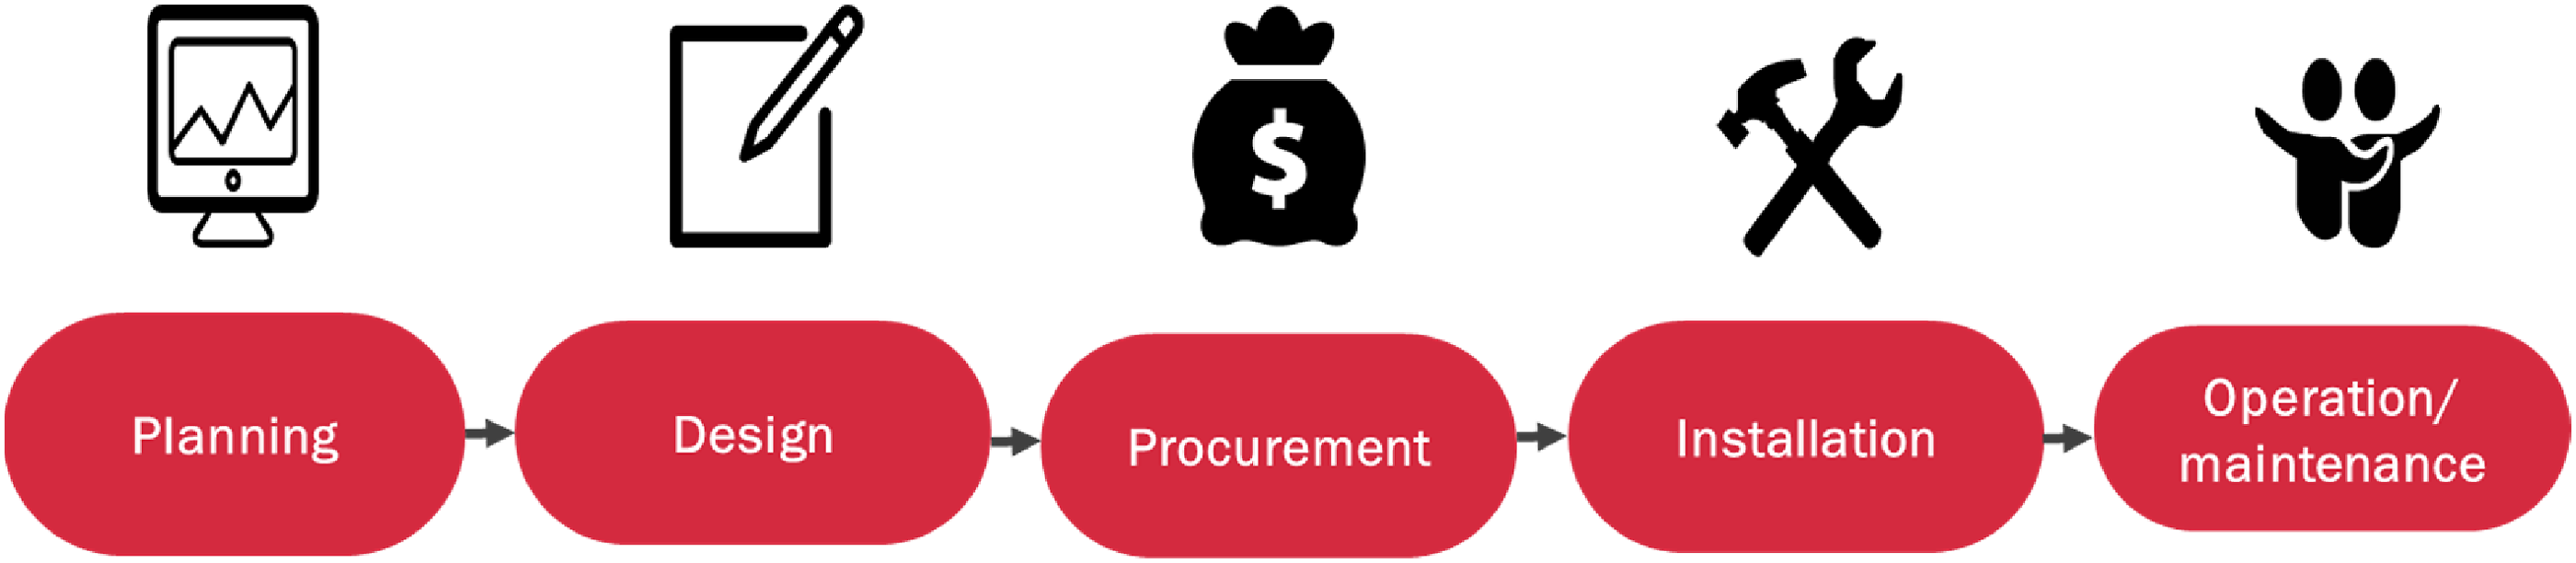
Data to inform retrofitting decisions
During the planning stage a broad range of data were obtained through surveying the homes, residents and systems, collecting information such as shading and roof geometry, and through gathering data on energy use and behaviour through engagement with residents and by using information collected through tools such as the Energy Performance Certificate (EPC). Also, information about the condition of existing components of the system, such as the distribution board and the heating system were collected and assessed to ensure appropriateness for combining with other components of solutions and the whole house energy system proposed.
During the design stage potential retrofit strategies were identified using information collected in the planning stage. In addition to descriptive information, long term 1-year monitoring information such as energy and comfort profiles were collected to tailor modelling exercises to the architype and resident group. Potential options were modelled using software HTB2 17 and VirVil SketchUp 18 where the performance of a range of solutions were compared to enable informed decision making to select technologies that fulfilled the priorities set during the planning stage. Modelling provided comparative carbon emission reductions, energy use reductions, energy bill reductions and cost of the individual components of the system. Designs were presented to Swansea Council, the residents and the supply chain where appropriate to allow for feedback and modification where required.
Data were used to provide specification details during the procurement phase. This facilitated clear communications of the agreed design requirements whilst also attempting to enable the local supply chain to be involved where possible. Factors such as delivery timescales, track record, fair trade, warrantee provision, after-sale care, compatibility and liability were included in the procurement process.
Data were collected during installation and commissioning by the CLCBE team to ensure appropriate delivery of the solutions. The integration of innovative solutions was not ‘business-as-usual’ and therefore not a well-understood process. Collecting data and achieving the design targets such as the mechanical ventilation air flow rates that fulfil the Building Regulations are essential to ensure successful delivery of the whole system approach.
At the maintenance and operation stage, all warrantee and instruction documents were provided to the residents by the supply chain. CLCBE team members also co-designed a 2-sided information sheet with residents using a format and language that was understandable. This included practical information about the individual solutions installed including how to operate and maintain them along with ‘Frequently Asked Questions’ with responses. The local Housing Officer at Swansea Council, who had been involved in the project from the planning stage, visited residents post-retrofit to explain the solutions to the residents, answer questions and enable a response to any issues. The Swansea Council Building Services maintenance team were trained to ensure effective operation of the solutions.
An estimation of embodied carbon was intended at the planning stage but was concluded after the retrofit delivery. This was based on the FCBS CARBON tool, a commercial tool developed by FCBStudios Ltd. 19 The results were compared against a second assessment, following the process-based method on stages A1–A5, cradle to site. Due to lack of Environmental Product Declaration (EPD) documents, the calculations were based on carbon factors derived from the inventory of Carbon, ICE Energy Database 20 and literature sources.
Monitoring methodology
Monitoring can provide evidence on how the built environment and systems are performing and how occupants are behaving to help decision making before, during and after the retrofit process. The building performance evaluation approach used within this research project was based on techniques developed at the Welsh School of Architecture informed by literature and guidance on building metrics and performance evaluation protocols.4,5,13,14,21–25 Within this Swansea Council case study, semi-structured interviews and one-off tests took place pre- and post-retrofit as well as monitoring of individual solutions and system performance for 1 year before and 2 years after the retrofit. The location of all equipment can be seen in Figure 3. 150 energy and environmental sensors were placed long-term across the six homes to provide evidence of the impact of all the solutions. Post-retrofit long-term remote monitoring set-up – repeated in all six bungalows (Credit: CLCBE team).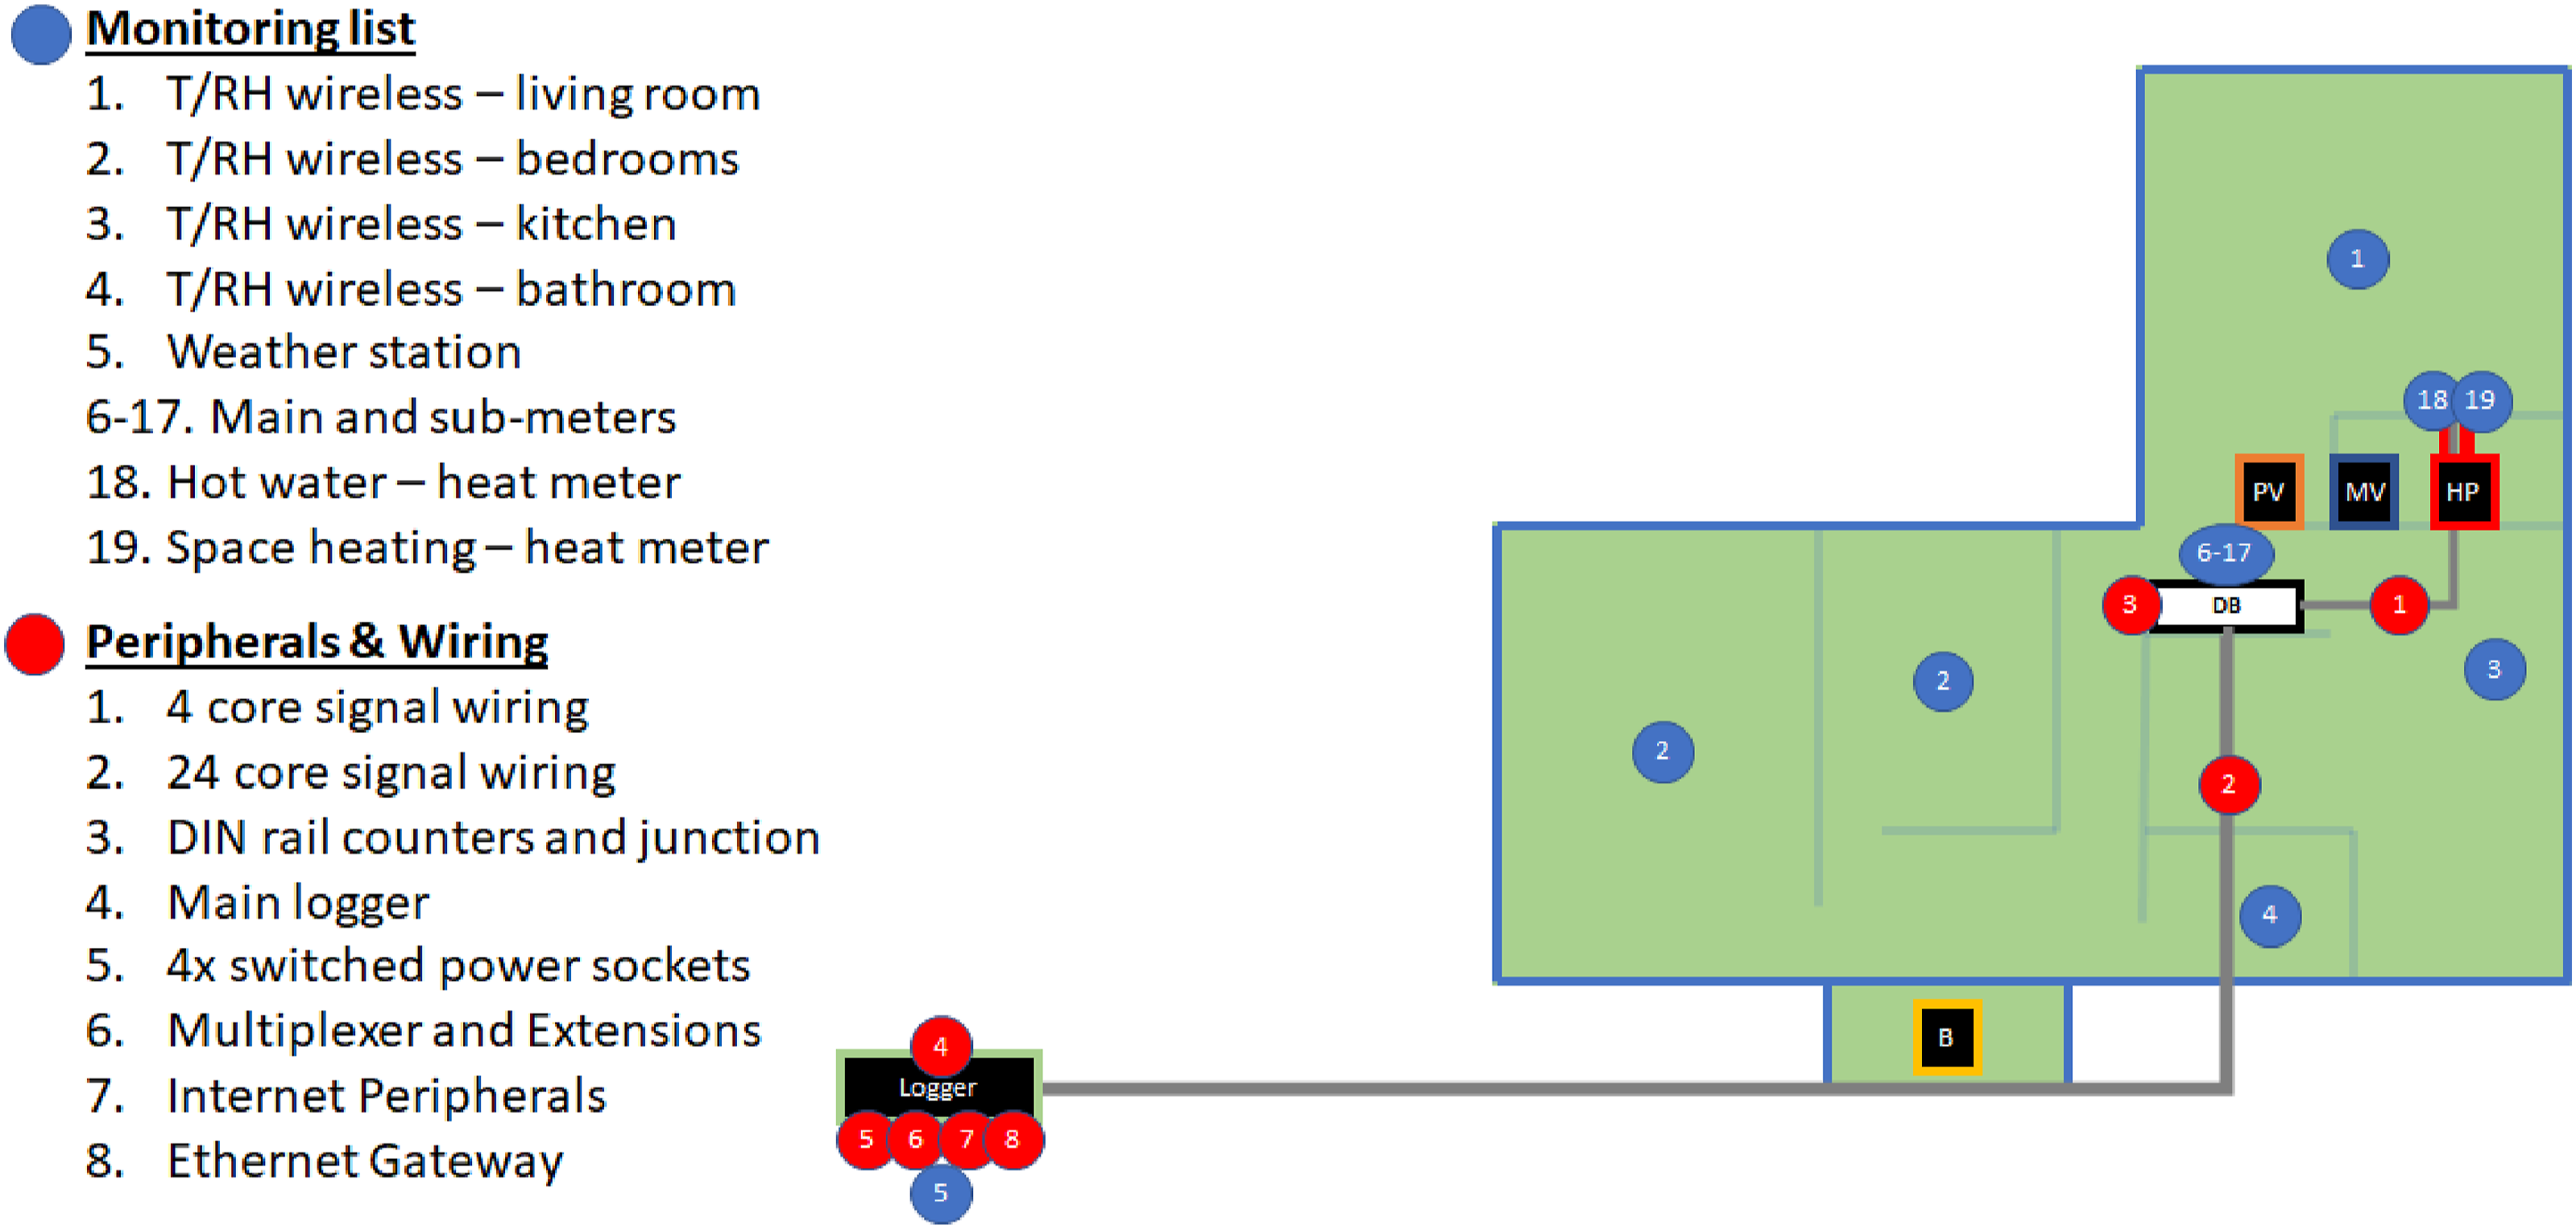
Monitoring results were analysed and compared against design or/and modelling values as well as benchmarks such as average performance of similar homes. Monitoring results were also used to generate other metrics such as carbon emissions and cost information to broaden the spectrum of performance analysis
One-off and long-term monitoring included: • Fabric performance – The U-value of four wall points in each property were tested by following ISO 9869 Standards.
26
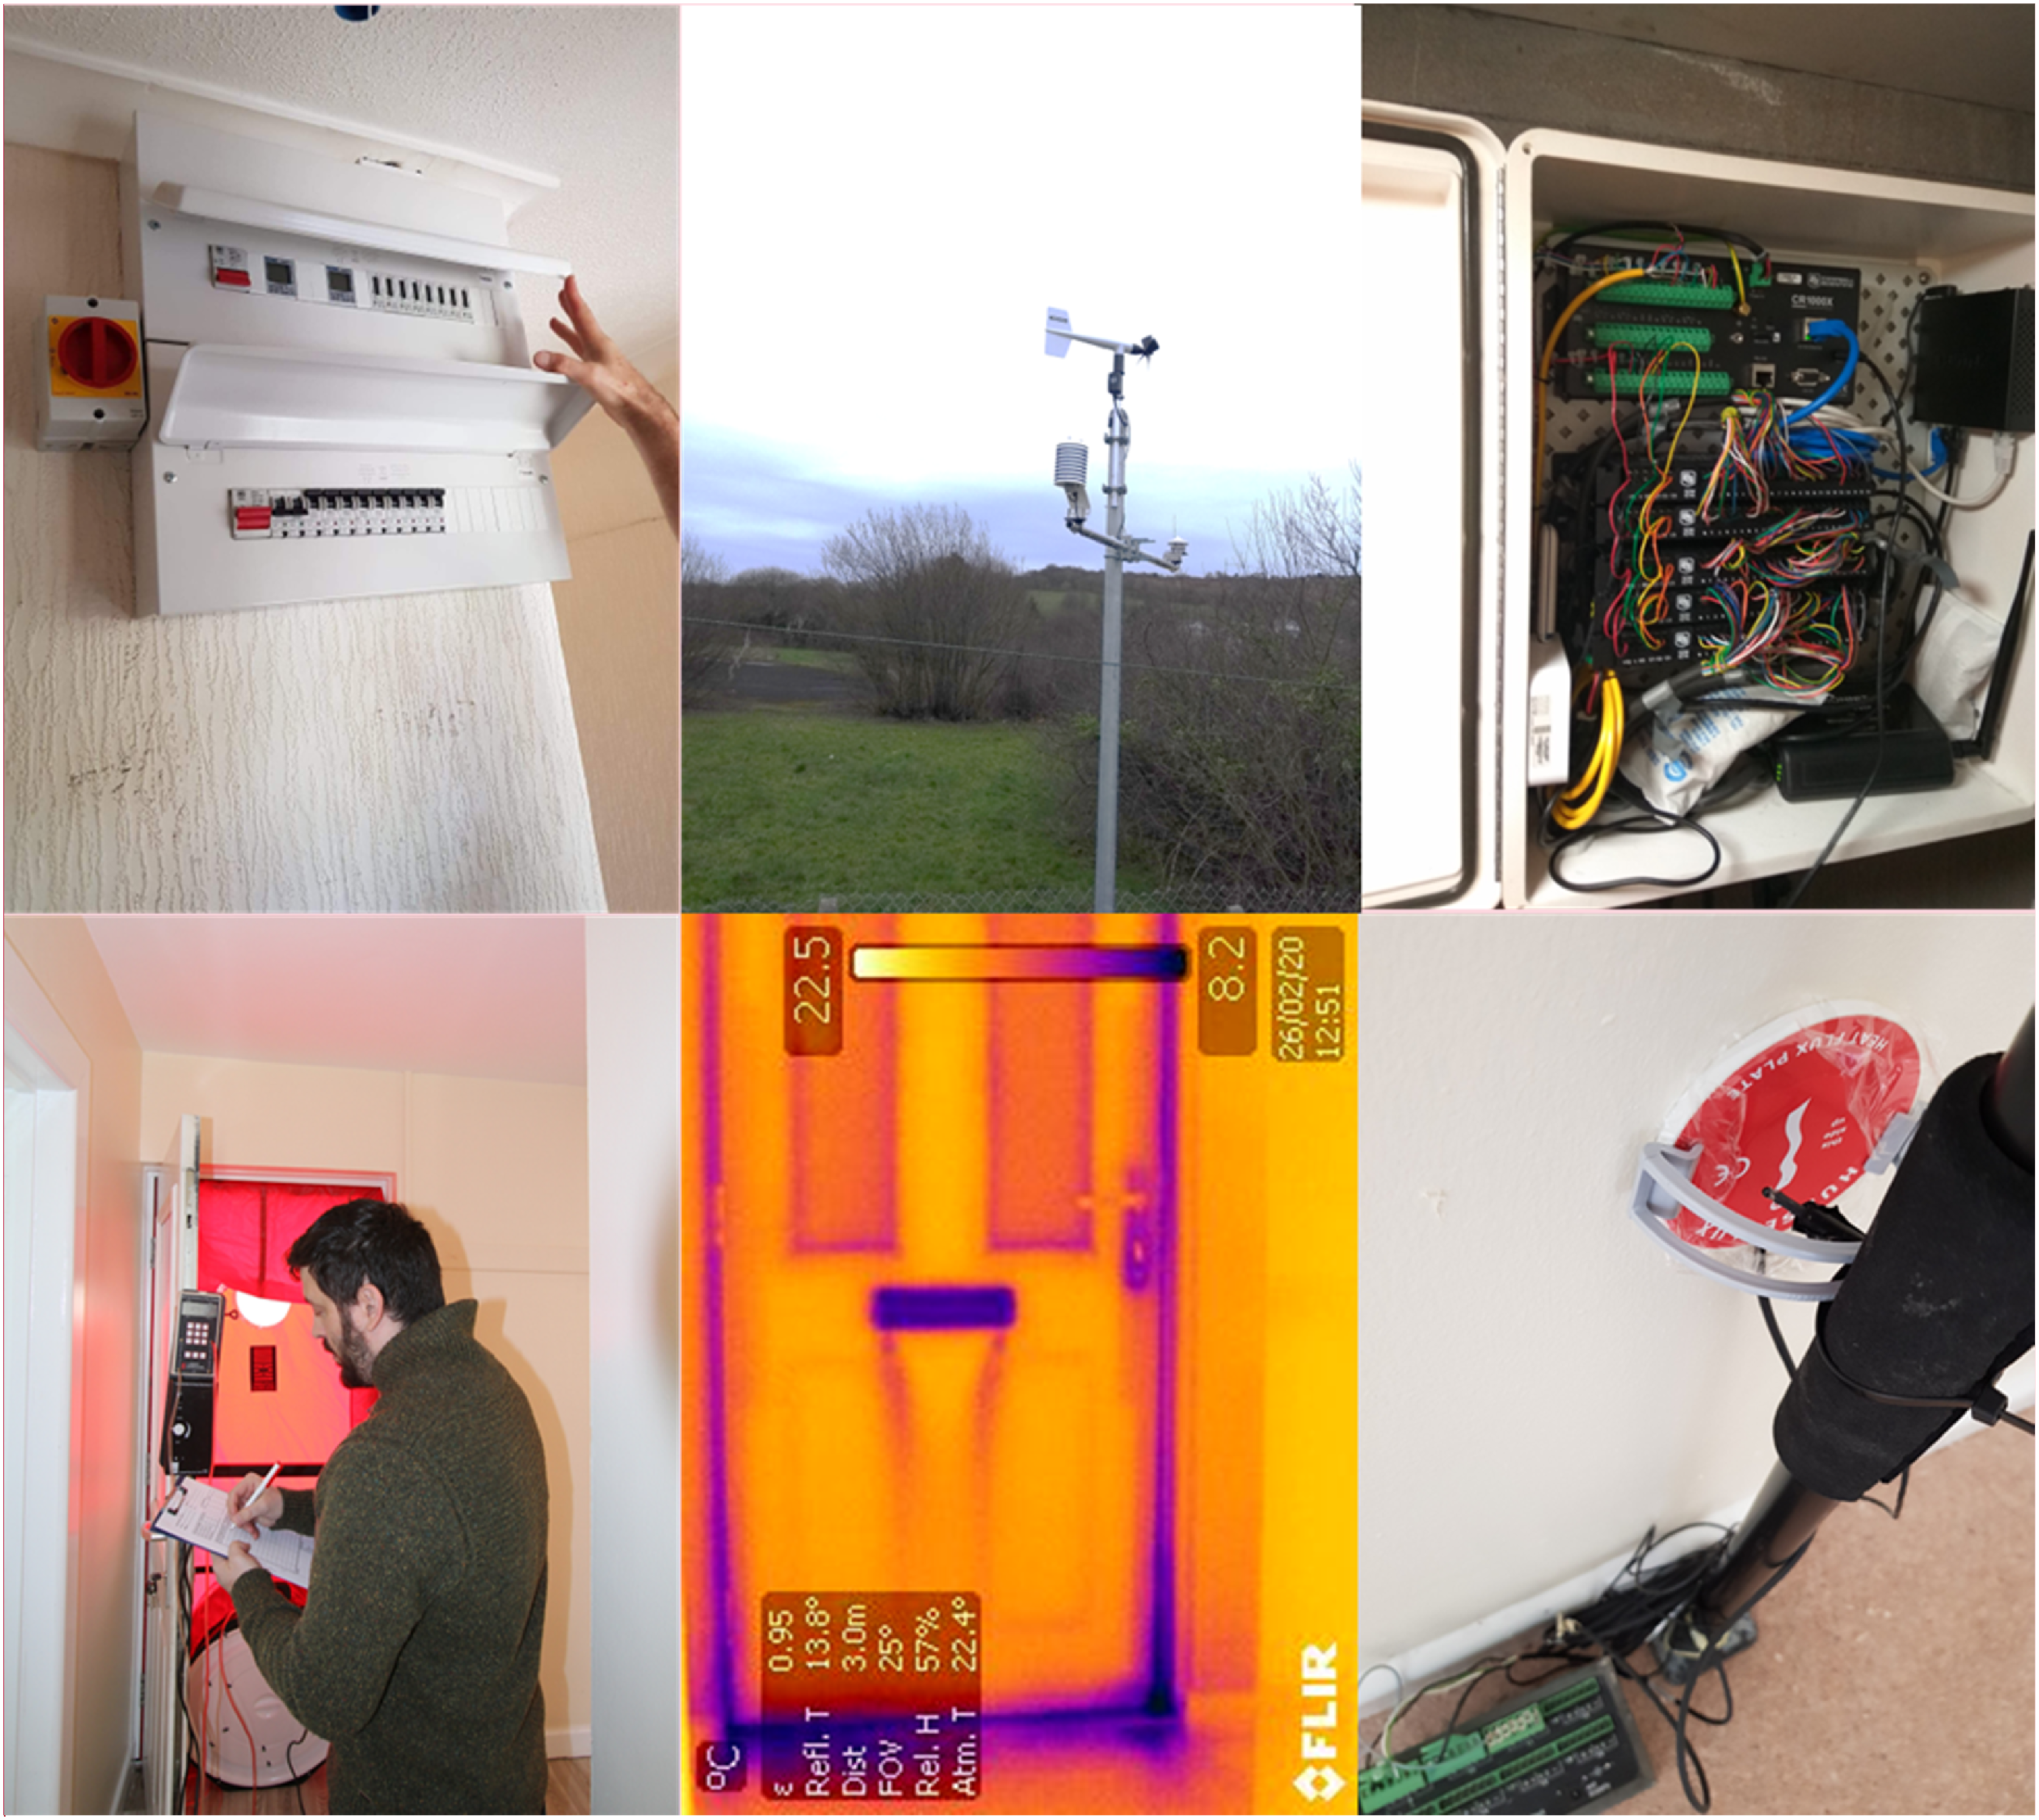
A Campbell Scientific 1000X Logger, HukseFlux heat flux plates and Type-T thermocouples (Figure 4) were programmed and assembled by the CLCBE monitoring team. Floor and ceiling U-values were estimated based on construction type and era. • Airtightness - performed according to ATTMA Standards.
27
A Minneapolis Blower Door kit (Figure 4) was used accompanied by a DG-1000 digital pressure Gauge, temperature, humidity, barometric pressure meters and distance meter to calculate internal fabric area and volume. • Thermal bridges - assessed using thermography (FLIR thermal camera) from outside during the airtightness test over-pressurisation and from inside during airtightness test de-pressurisation (Figure 4). The evaluation of thermal bridges was assisted by a microflow velocity meter to identify draughts. Top left - consumer unit with DIN rail meters, top centre – weather station, top right – logger and peripherals, bottom right – airtightness test, bottom centre – thermography during depressurisation, bottom right – U value measurements (credit: CLCBE team).
U-value, airtightness and thermography tests were repeated post-retrofit to compare with pre-retrofit data and as-designed values. • Ventilation - flow rate tests were performed to ensure correct MVHR commissioning using a balometer kit from TESTO according to Building Regulations Part F.
28
• Energy use - Collection of energy bills together with clamp-on meters assisted in capturing electricity and oil/LNG data. Intervals were set at 30-min. • Weather conditions - a weather station was installed onsite that measured wind direction and speed, temperature and relative humidity and local solar radiation (Figure 4). The weather station was connected to a Campbell 1000X logger with a 5-min interval and the logger was connected to an internet router allowing for remote monitoring with real time data transfer to Cardiff University servers. • Internal temperature and humidity - Pre-retrofit Tiny tag temperature and humidity sensors were used to capture the indoor comfort with 30-min intervals. Post-retrofit an Imonnit wireless system was used replacing the Tiny tags to provide a more permanent system allowing for automatic remote data transfer.
Two remote monitoring systems were used to send real time values back to the Cardiff University servers: • A CR1000X logger (Figure 4) was used to capture and transfer the weather station data. The logger was also connected to pulse counters via extension multiplexers to capture 14 energy meters with pulse outputs from each bungalow. Meters were installed by qualified plumbers and electricians and included two heat meters for the space heating and hot water delivery. Electricity import, export, PV generation, battery charge, battery discharge and heat pump, mechanical ventilation with heat recovery (MVHR), lighting and electrical sockets circuit consumption. • An Imonnit remote monitoring system was used to capture and transfer comfort data. The system included a radio wireless data transfer from the sensors to a gateway and an internet transfer from the gateway to an online platform.
To quantify the real-life operation CoP of the heat pump the delivered energy was divided by the consumed energy. The pump consumption was measured via a pulse counter (1 Wh/pulse) submitter at the distribution board and data stored in the logger at 5-min intervals. The heat delivery by the heat pump was monitored through heat meters at the delivery of space heating (flow and return) and delivery of hot water. The heat meters were connected to pulse counters (10 Wh/pulse) and data stored in the logger at 5-min intervals. For the calculation of the CoP, energy consumption and delivery monthly weighted averages were used separately for the hot water space heating delivery.
Results
A whole house energy system retrofit and monitoring approach was implemented in all six bungalows within the Swansea Council case study homes. The first part of this section provides an overview of the low carbon solutions applied to the homes, while the second section presents the results of the pre and post retrofit monitoring.
Whole house energy system implementation results
Pre-retrofit conditions and details of low carbon solutions installed.
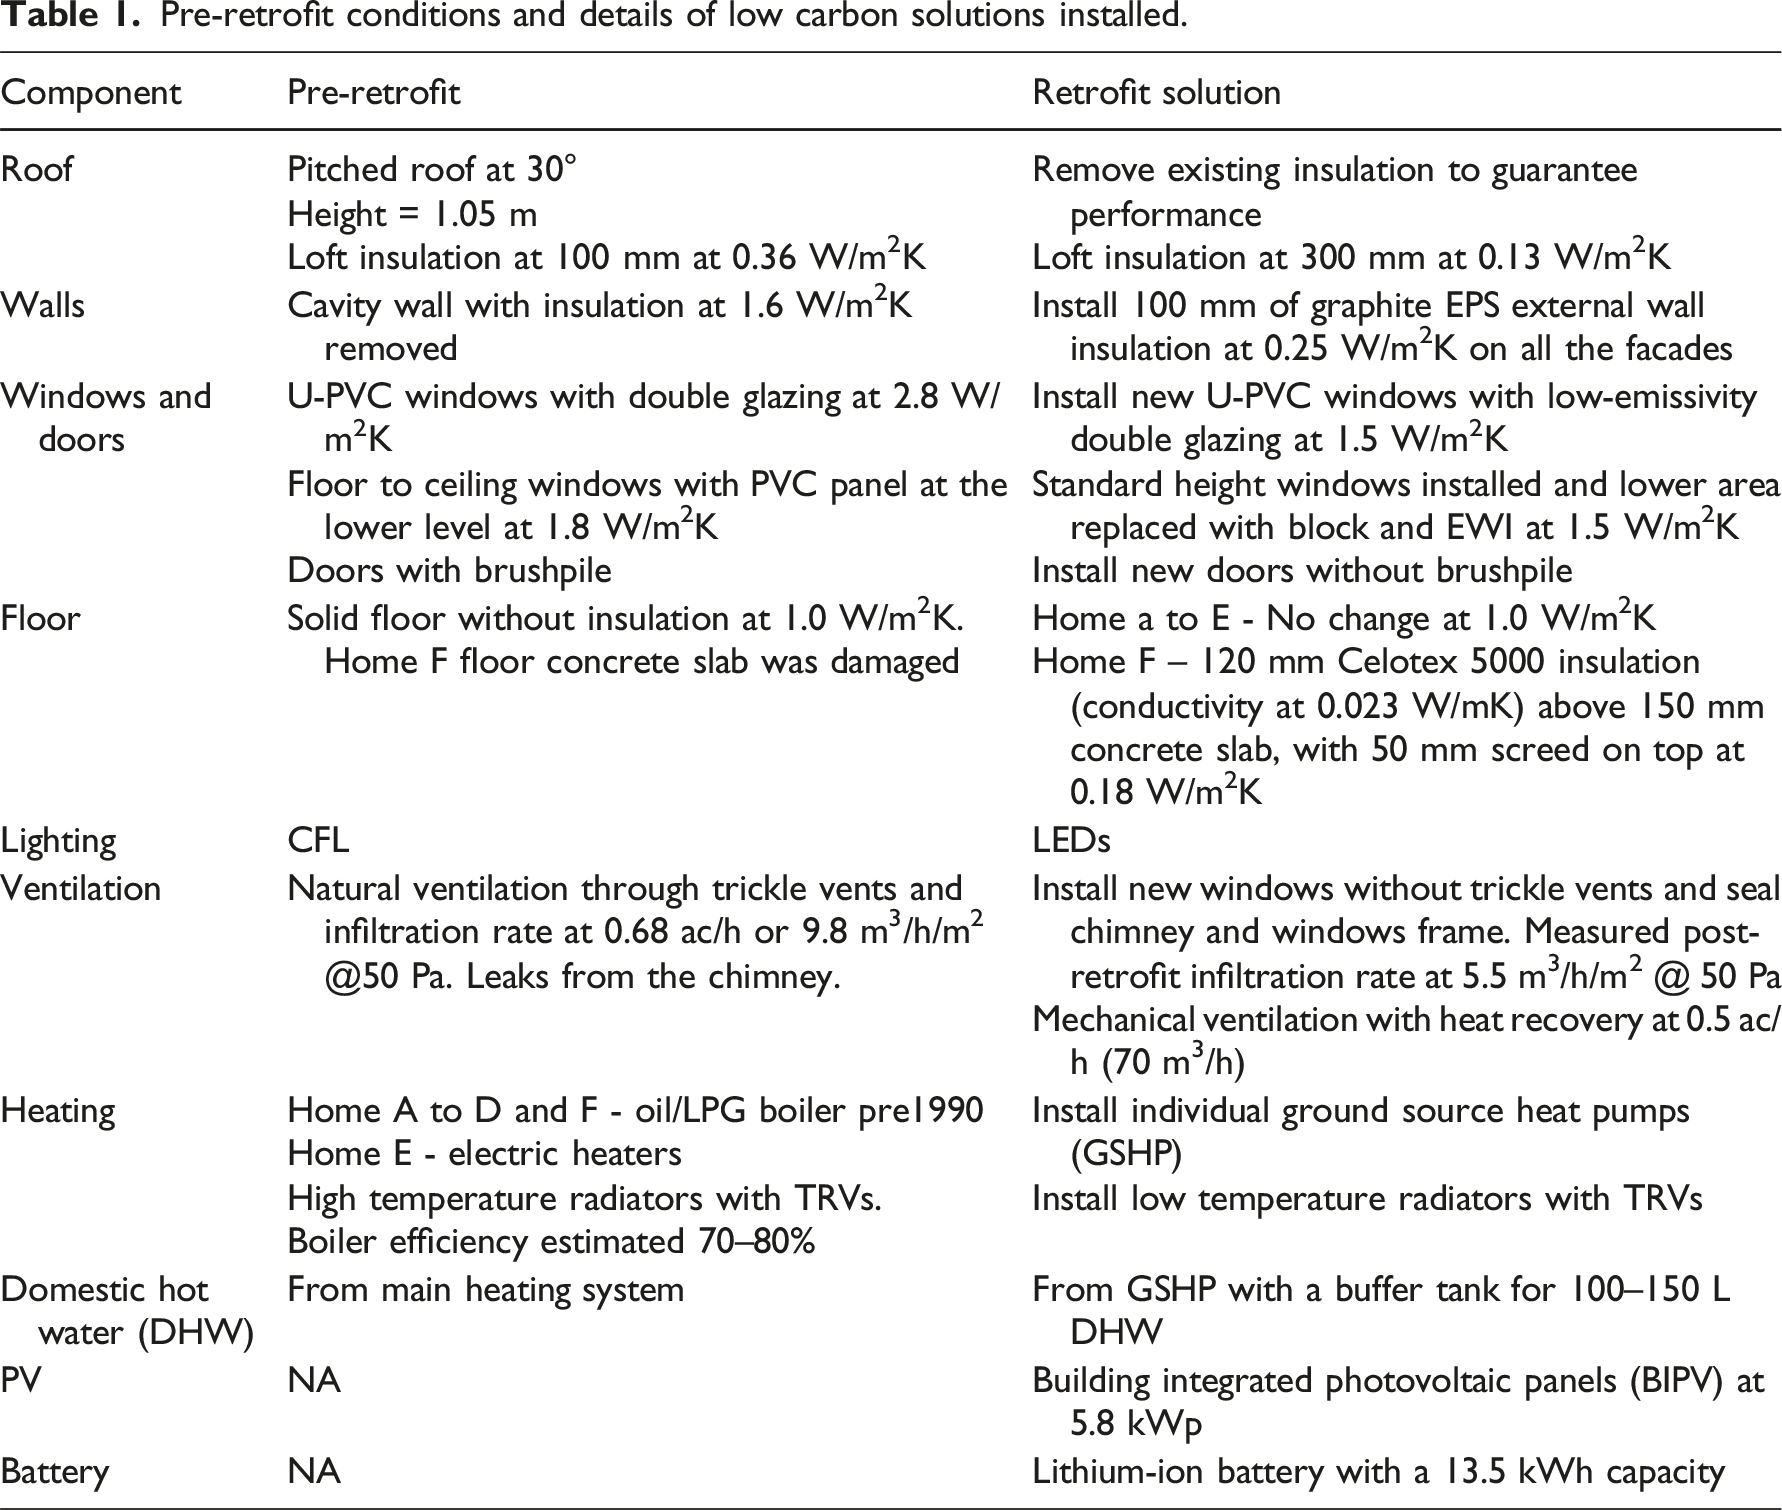
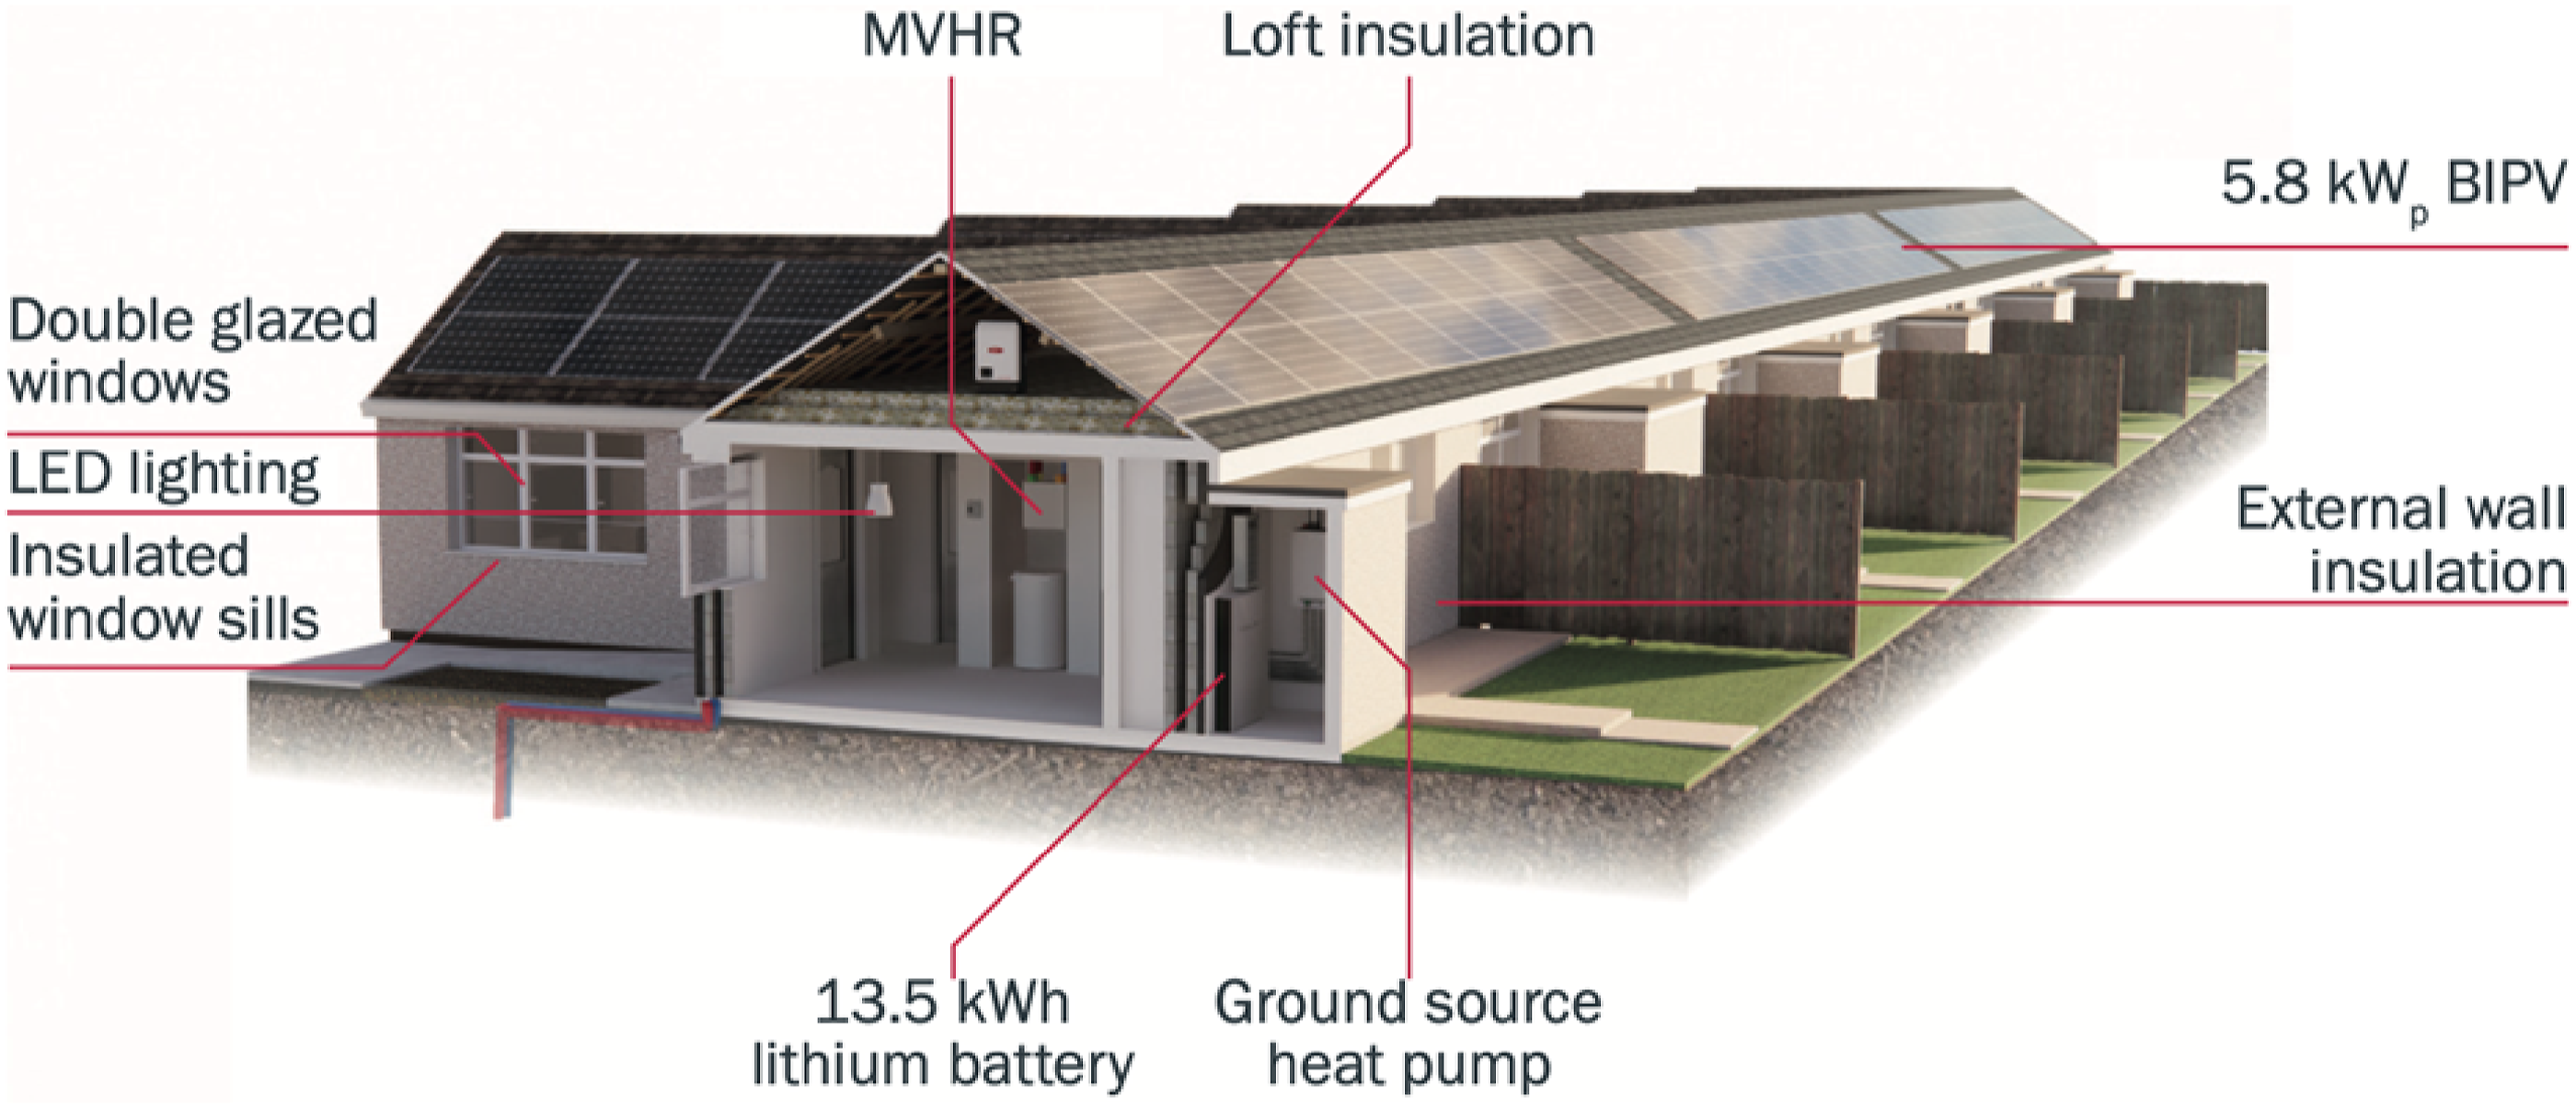
Low carbon solutions installed (Credit: CLCBE team).
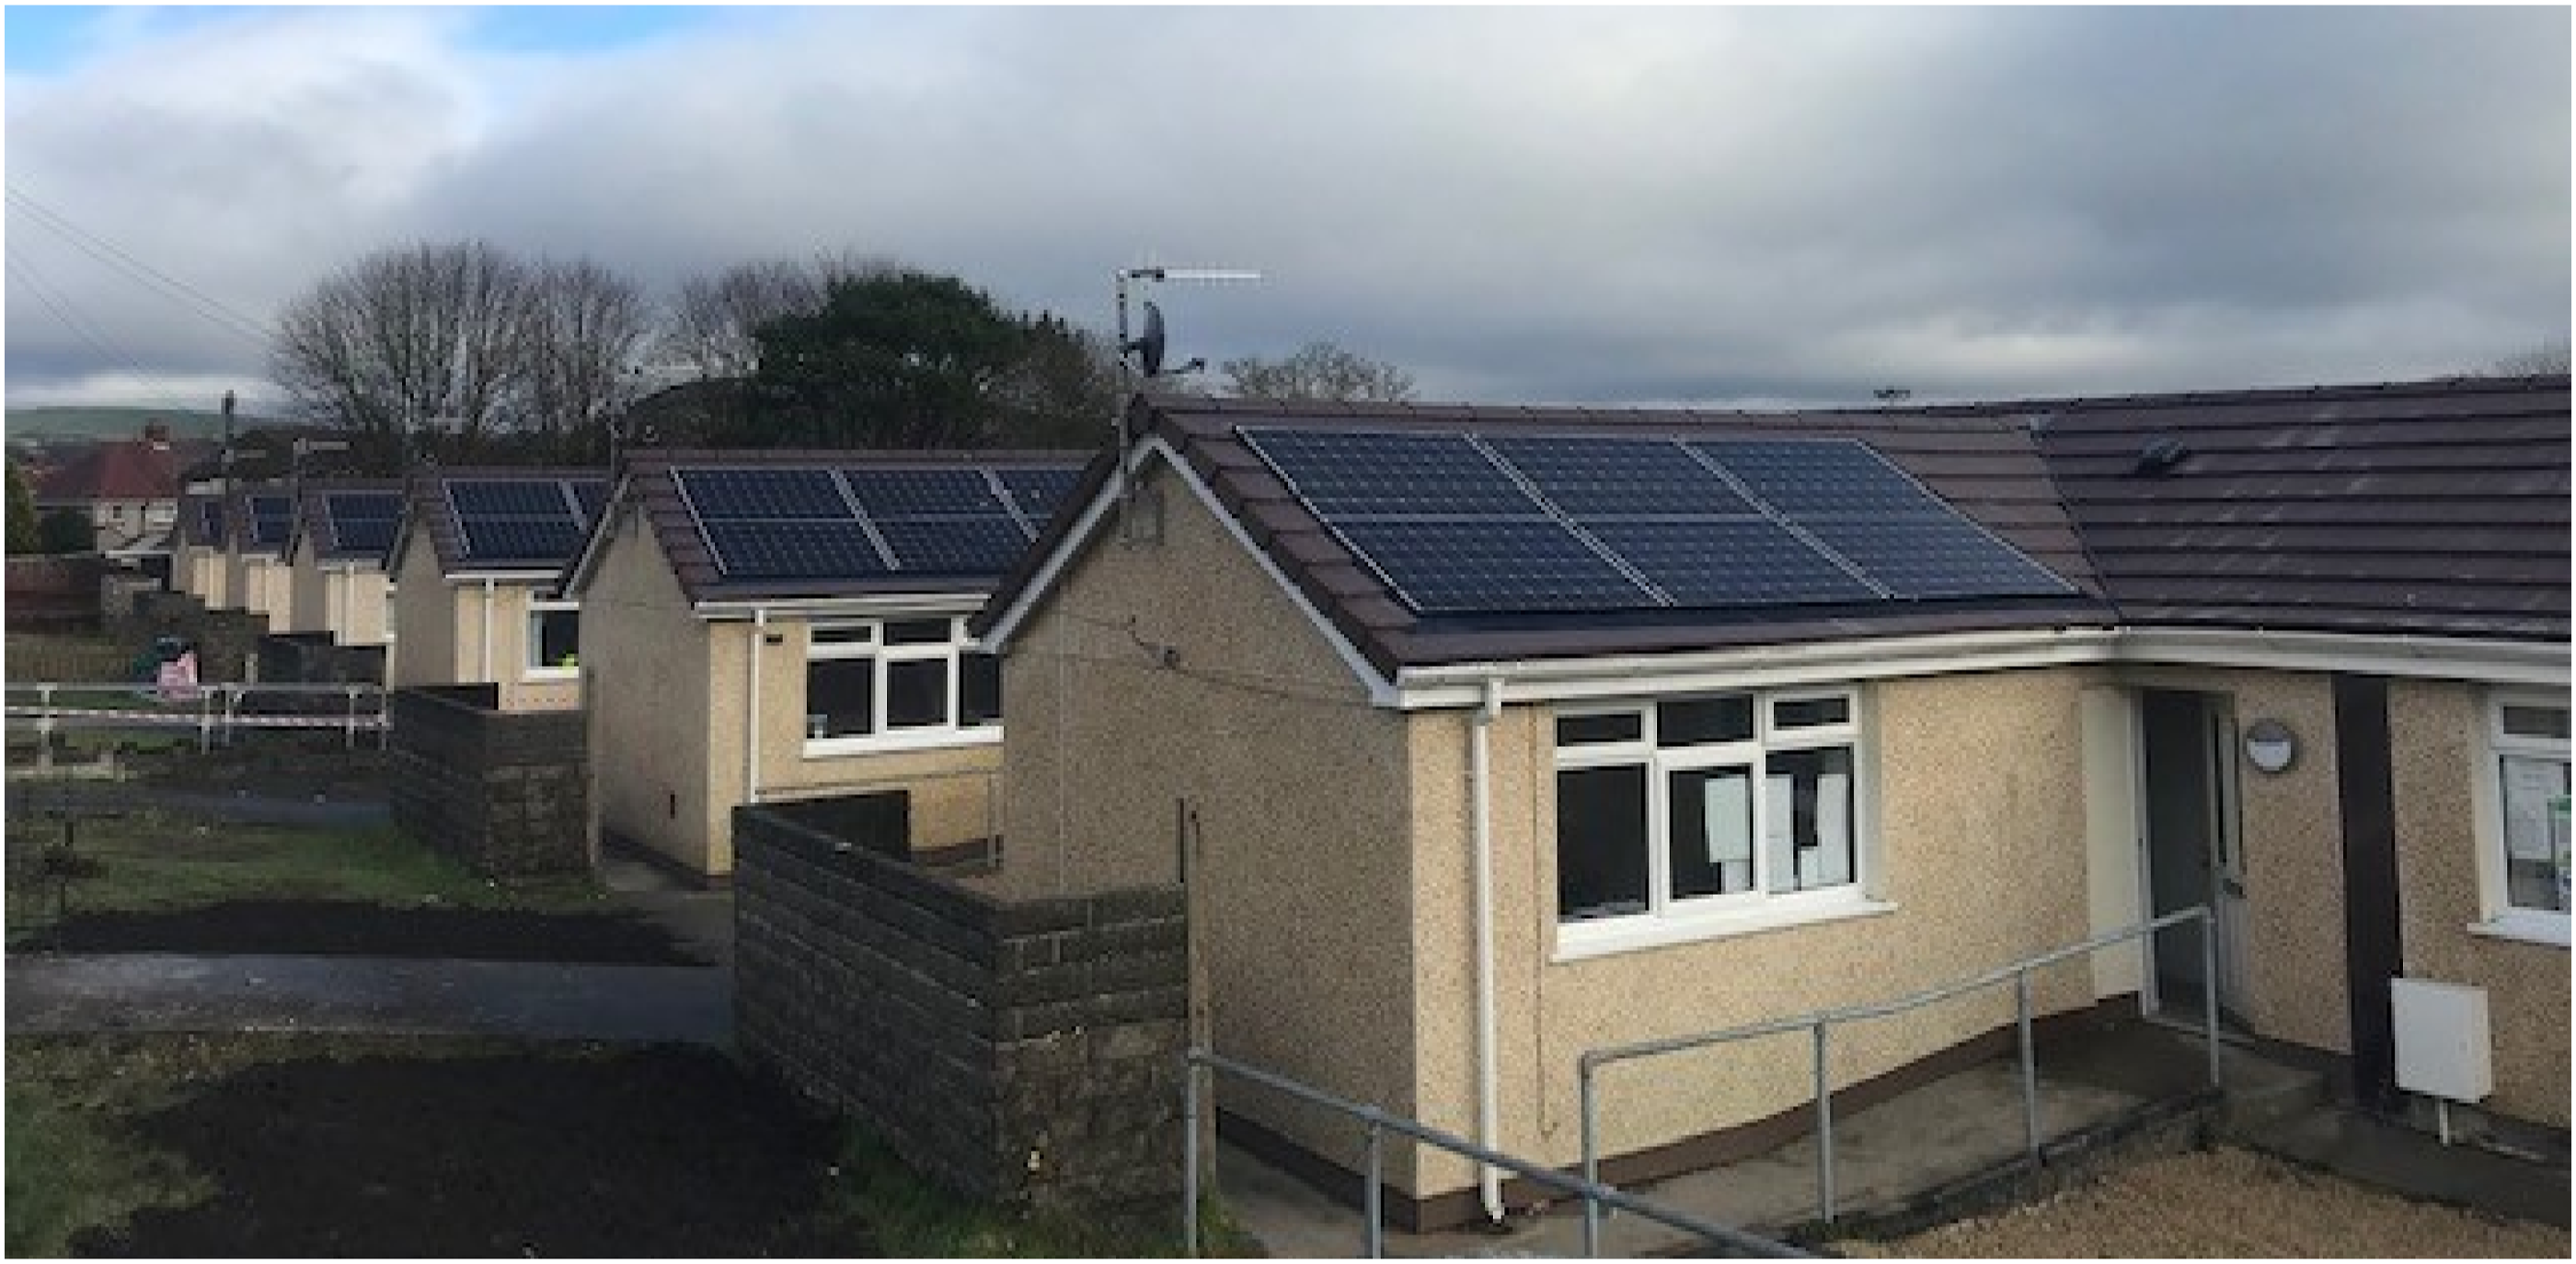
Six bungalows post-retrofit (CLCBE team).
Monitoring results
The success of the whole house energy system retrofit is reflected in the reduction of energy consumption, carbon emissions and energy cost, as well as the thermal comfort within the home.
Figure 7 presents the electricity balance of the average across the six bungalows and per bungalow. As the bungalows are powered by electricity post retrofit, the electricity balance equates to energy balance. On an annual basis, the energy demand of the bungalows is covered by on-site renewable energy generation. On average, 46% of energy demand is imported from the grid, with an equivalent amount of energy generated from renewables exported to the grid. However, import from the grid is necessary to cover the difference between the energy generation and demand during winter months. Across the six bungalows, there is a fluctuation at the energy demand level with A, B and C using less energy than D, E and F. This is supported by occupants’ thermostat preference especially during summer as stated in the interviews. Renewable energy generation is similar across all the dwellings except for bungalow F which is partially shaded by a tree. Annual electricity balance per bungalow and average.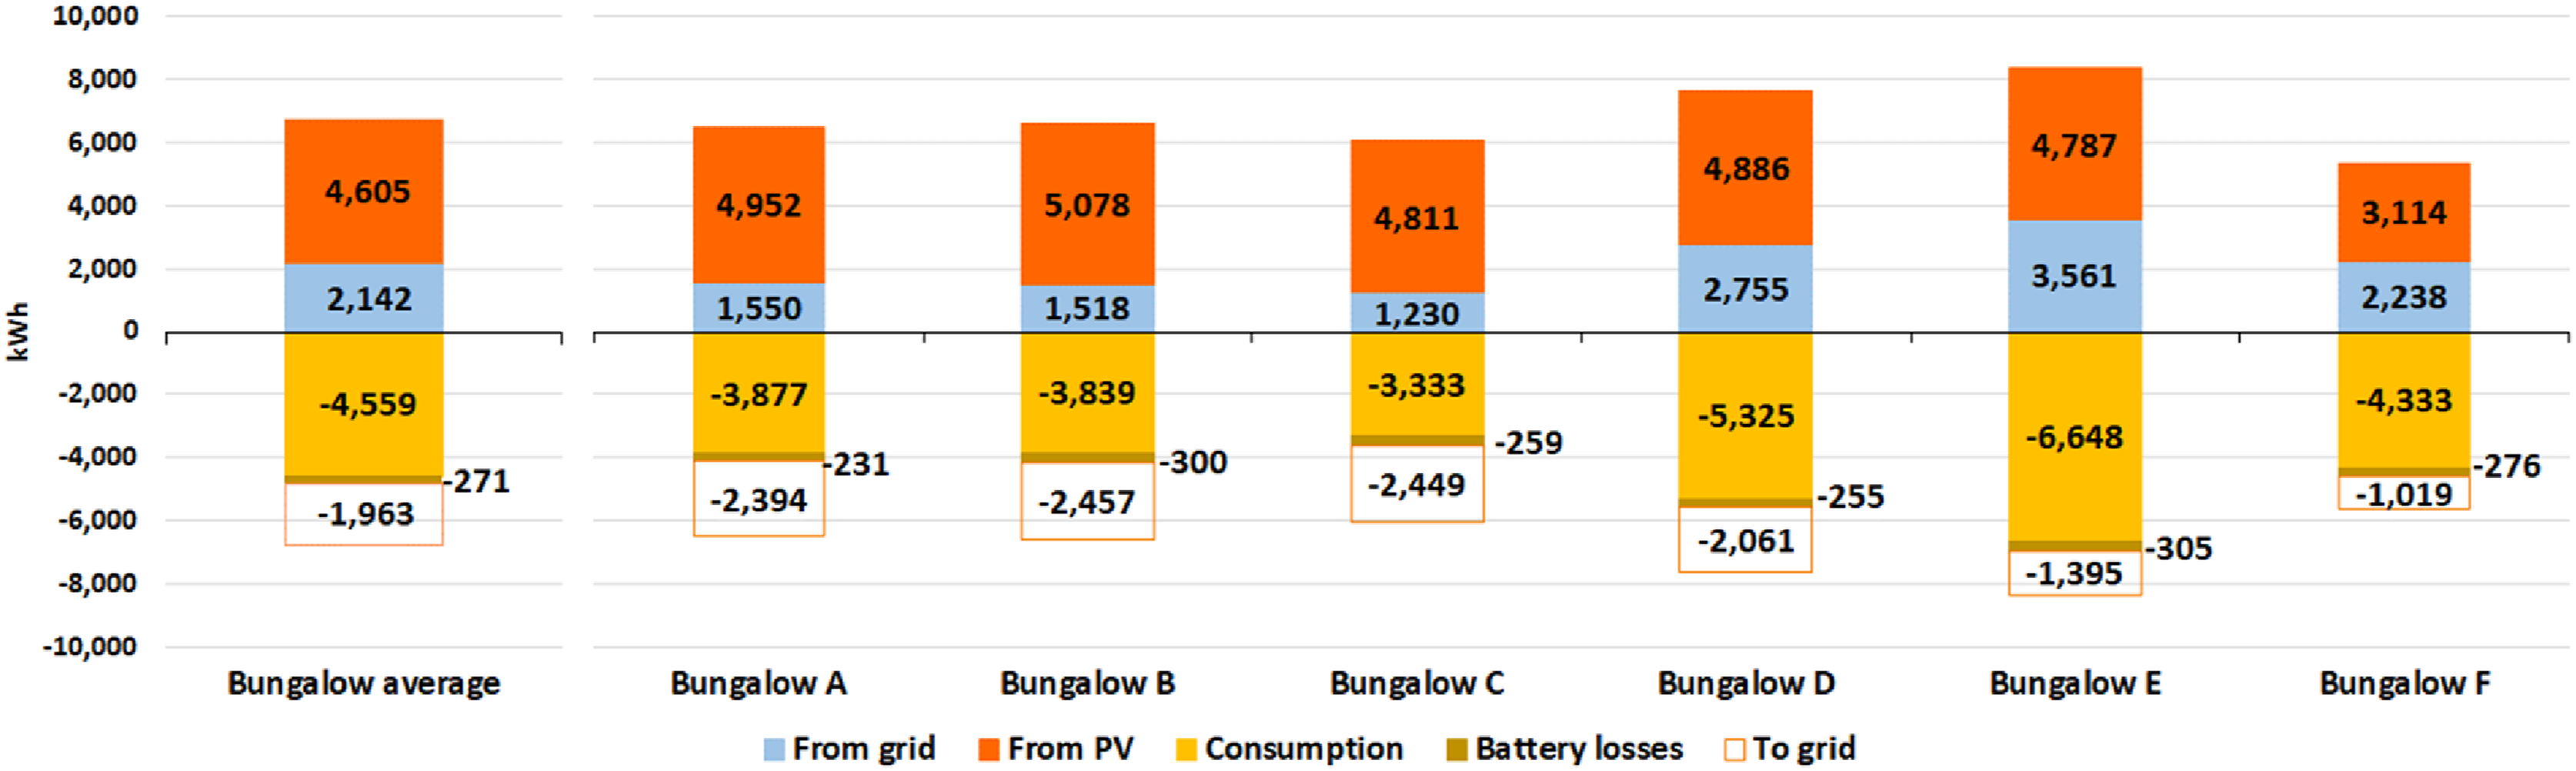
Figure 8 presents the comparison of pre- and post-retrofit annual energy consumption by source of supply. The mean energy consumption benchmark for similar dwellings across England and Wales is included for reference.
29
The benchmark and the pre-retrofit have a very similar energy consumption indicating that the dwellings are representative of the building stock. The pre-retrofit annual energy consumption from the electricity grid and from oil/LPG tanks was 16,117 kWh on average for the six bungalows. Post-retrofit, consumption (all electric) fell to 4559 kWh with battery consumption (loss) at 271 kWh. This is a 75% reduction in consumption and approximately 53% of the energy consumed was provided by either the solar panels directly or the batteries. Annual energy consumption and excess by renewable energy source.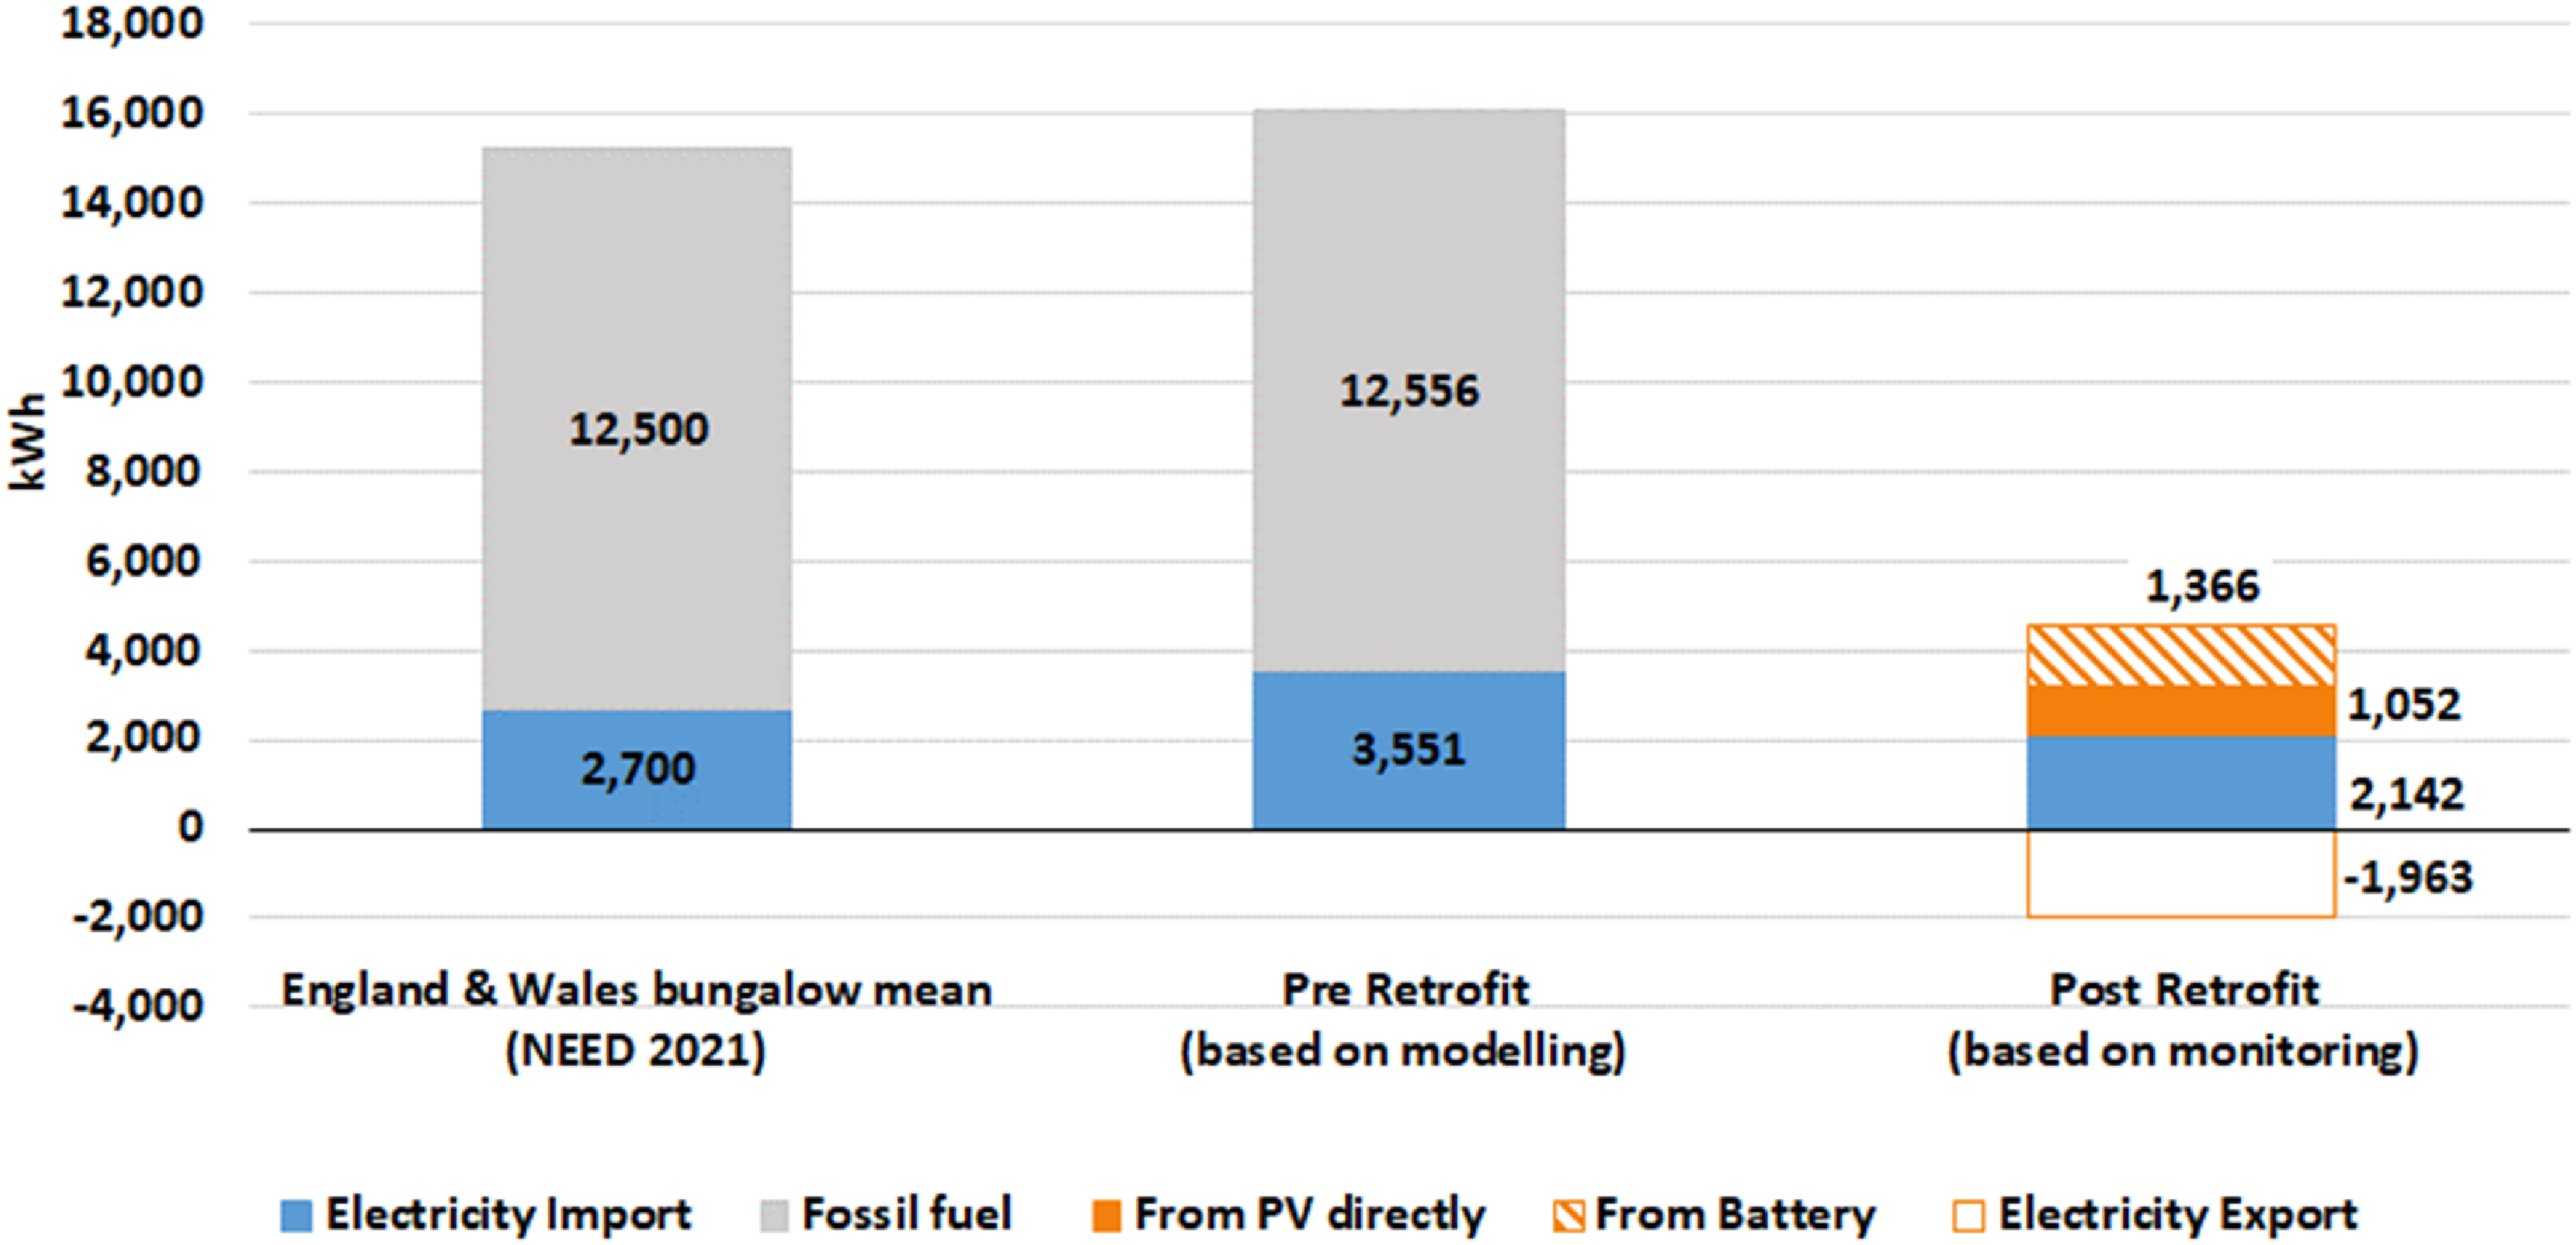
From April to September, import from the grid was close to zero, with an export to the grid at approximately 2000 kWh, indicating a beyond net zero energy balance. The reduction of energy demand along with the on-site generation of renewable energy leads to a significant operational carbon emissions reduction, compared to the pre-retrofit situation.
Figure 9 shows annual carbon emissions per bungalow and the average across all 6, based on the carbon conversion factors published by DBEIS 2023.
30
The blue areas represent carbon emissions, while the orange areas represent carbon emissions that were avoided due to energy provided directly from the PV (orange solid fill) and due to the battery (orange diagonal stripes). Carbon emissions follow energy consumption, showing a wide fluctuation across the bungalows, with the highest being 3 times higher than the lowest. The benefit from the renewable energy generation is proportional to the energy consumption. Annual operational carbon dioxide emissions and avoidance.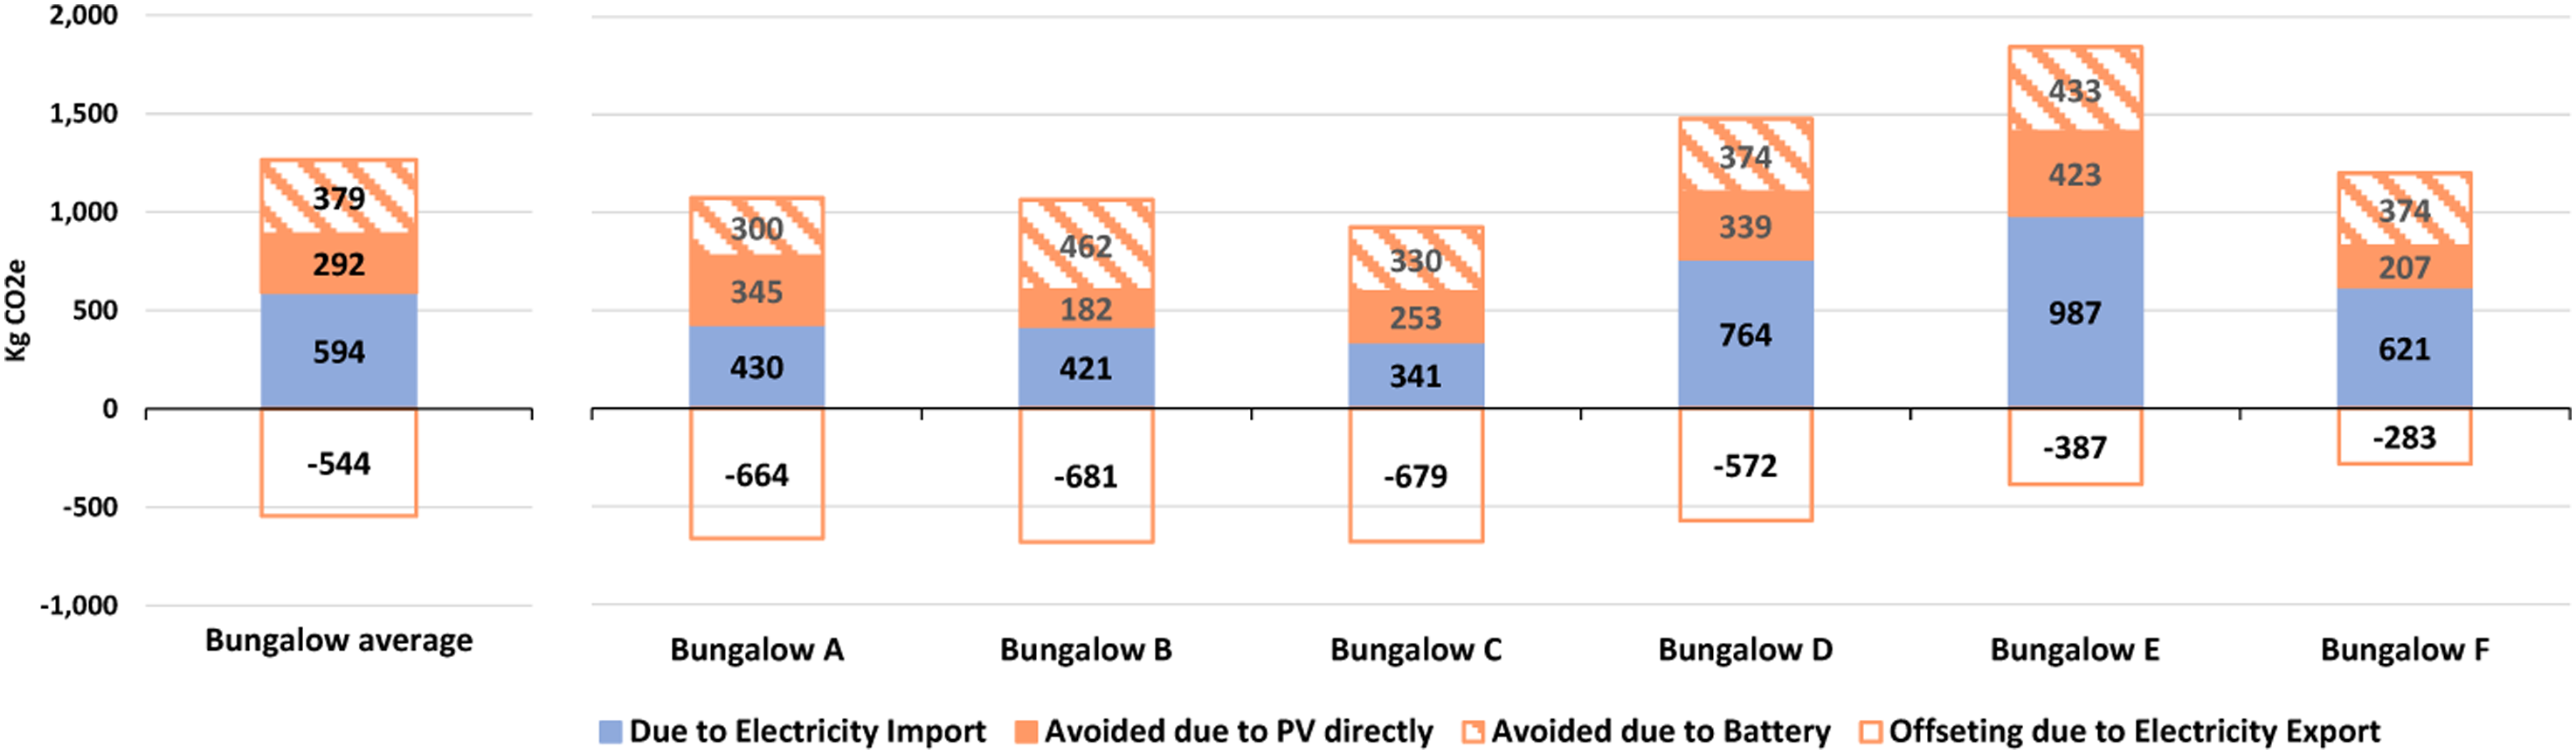
Figure 10 presents the annual post-retrofit operational carbon emissions compared to the pre-retrofit, with the equivalent mean value for bungalows across England and Wales added for reference. Pre-retrofit energy consumption shows slightly higher carbon emissions compared to the equivalent mean in England and Wales due to the use of LPG or oil rather than gas from the grid. Carbon emissions, due to electricity import from the grid, reduced from 4,011 KgCO2e to 594 KgCO2e for each bungalow on average, illustrating an 85% reduction. An equivalent amount of 544 KgCO2e carbon emissions is avoided due to export to the grid. If this amount is subtracted from the carbon emissions, then the net carbon emissions are 50 KgCO2e, reaching a 99% reduction and approaching the net zero carbon target. Annual operational carbon dioxide emissions.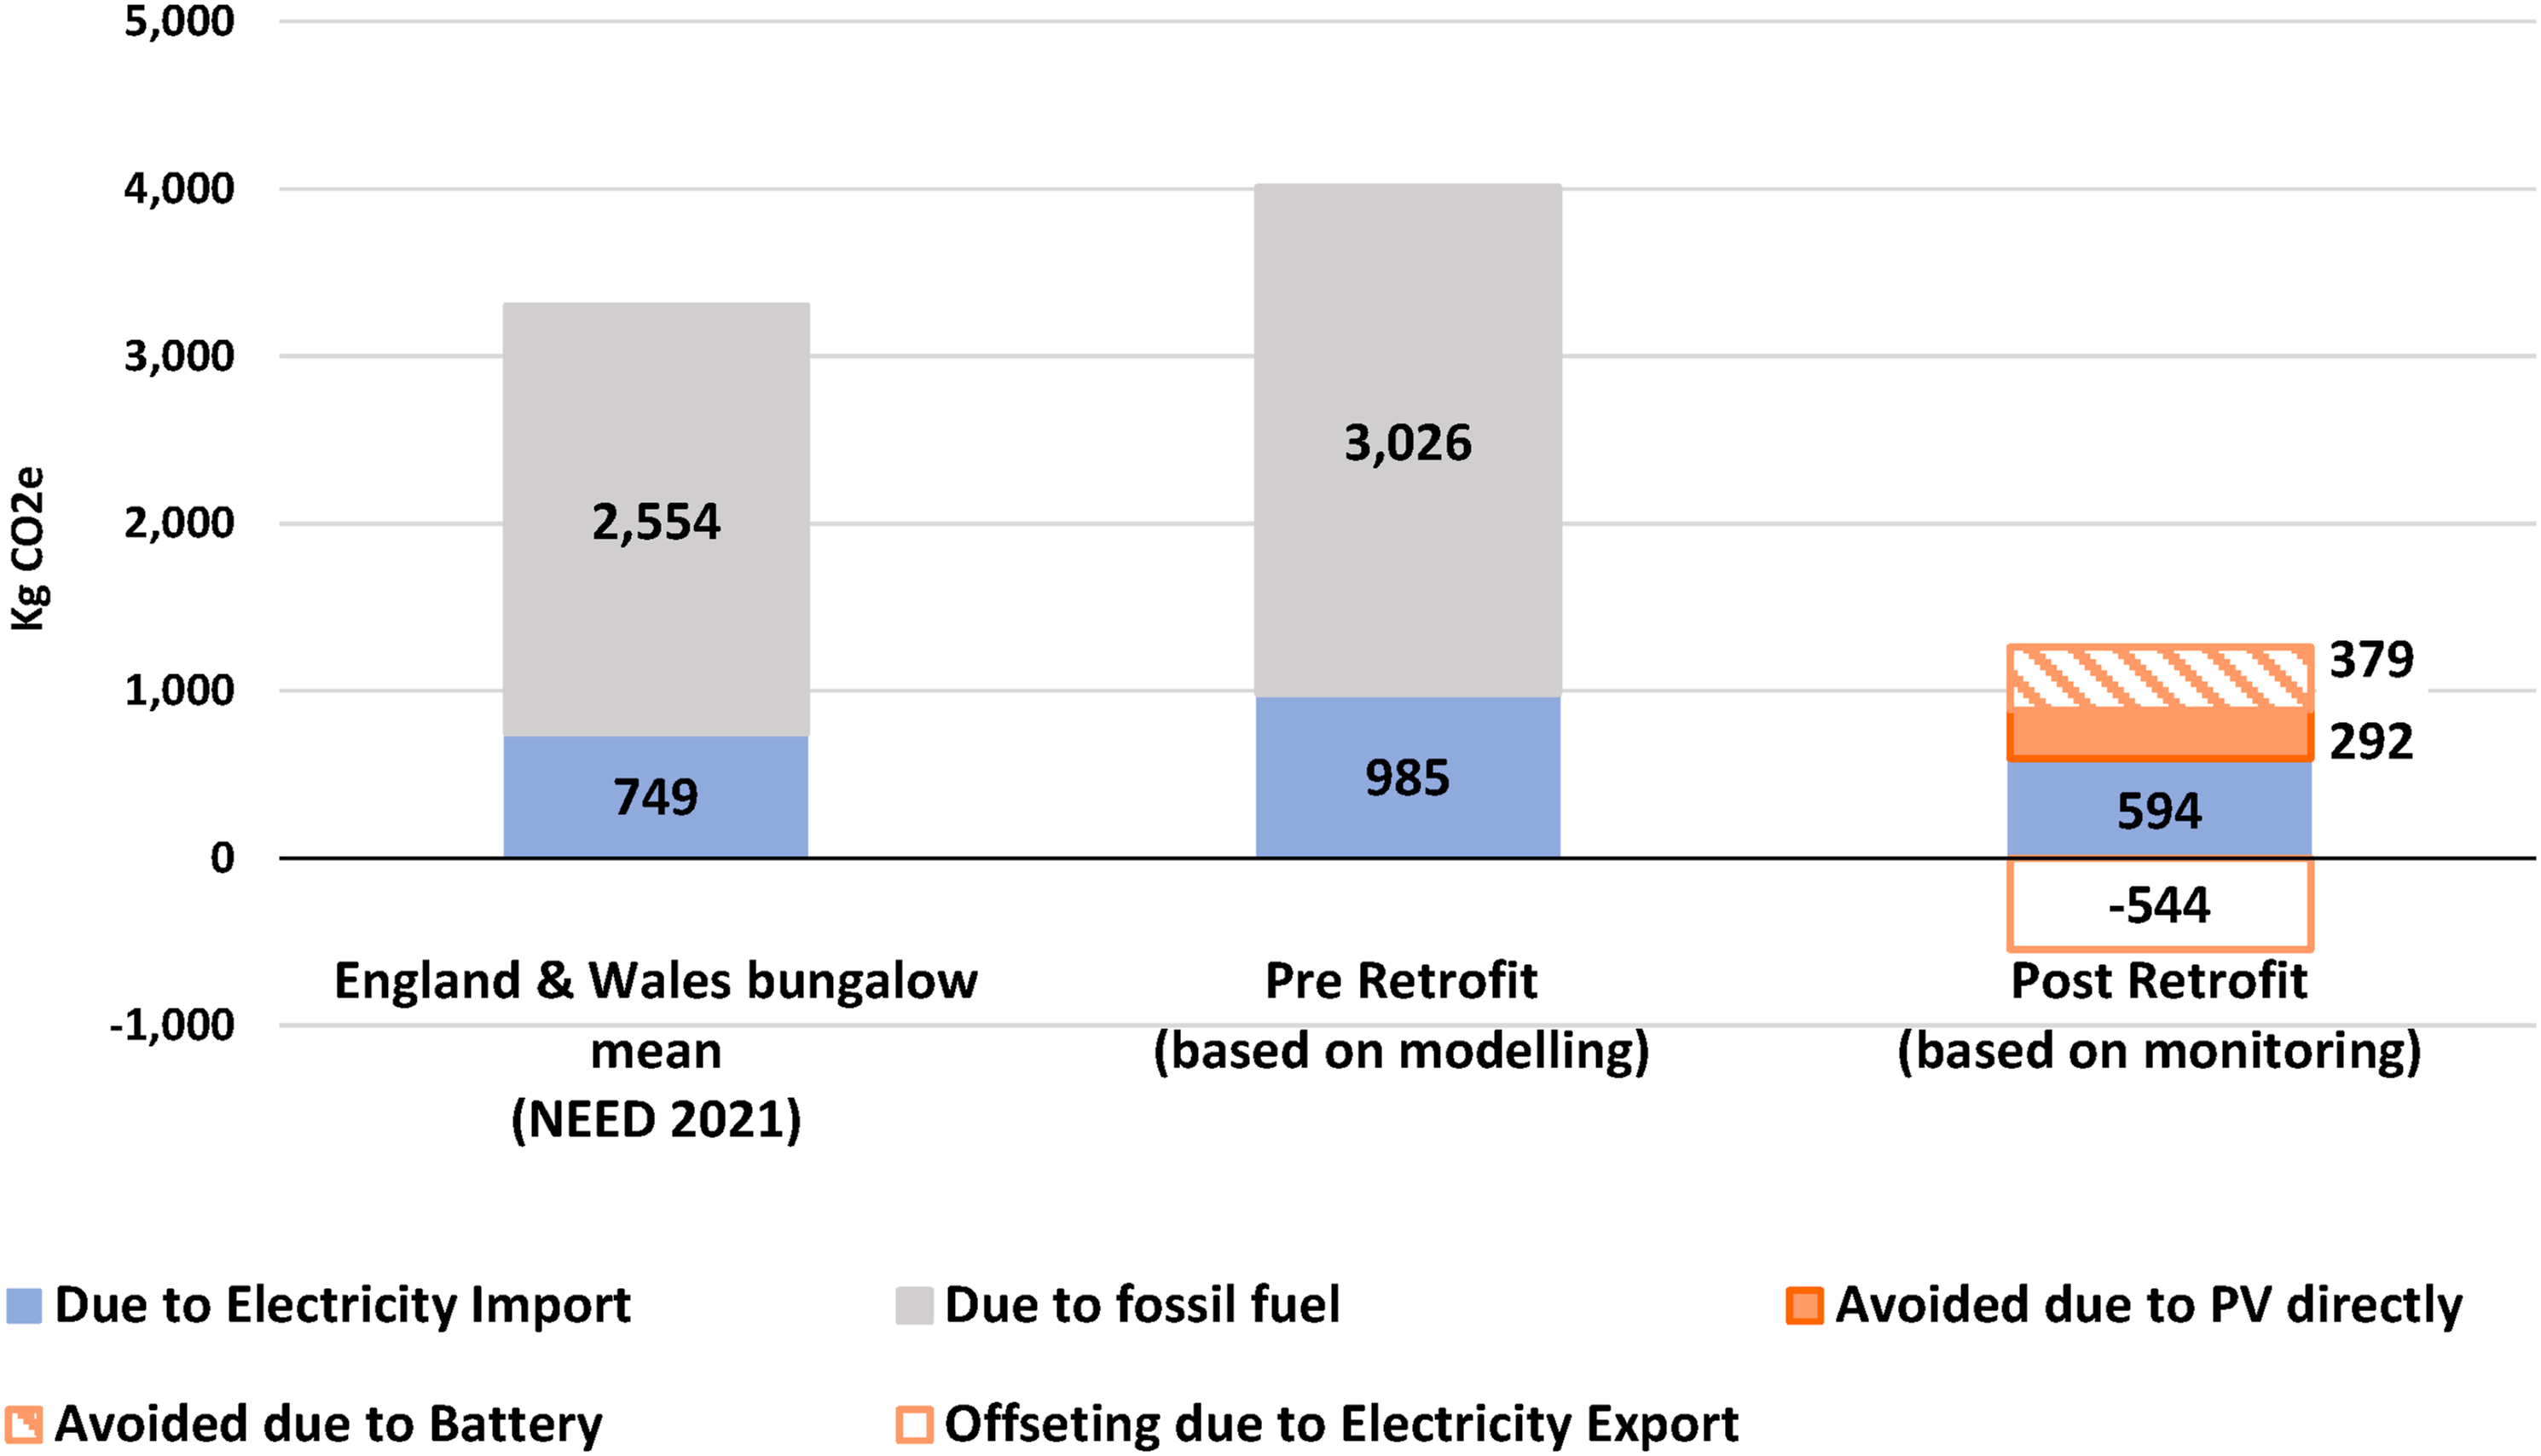
Embodied carbon estimation per component.
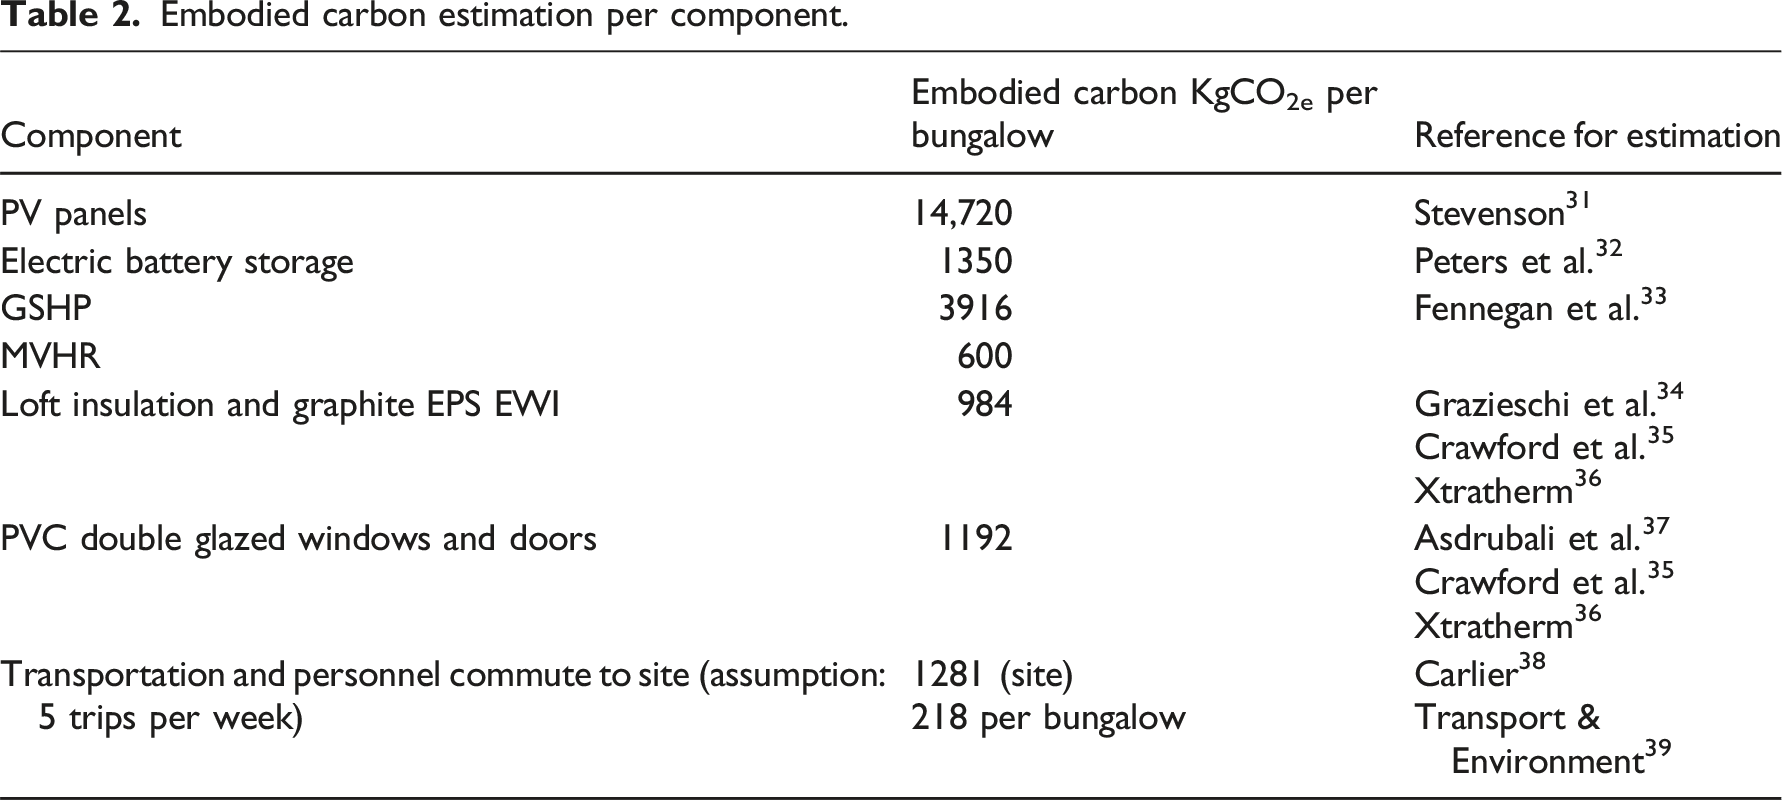
Figure 11 illustrates the comparison of the energy cost before and after the retrofit, including standing charges, calculated at 2023 average prices.
40
The orange bars represent the savings due to the PV generation and energy storage. The graph shows an average annual 70% (£1323) reduction in energy bills. An annual income could also be generated though the sale of excess electricity exported to the grid. By using a conservative export income (£0,05/kWh), calculations indicated in Figure 11 and given that the retrofit costed approximately £65,000, the total payback time would be 45 years without considering energy prices or retrofitting costs projections. Indicative annual energy cost including standing charges (2023 energy prices).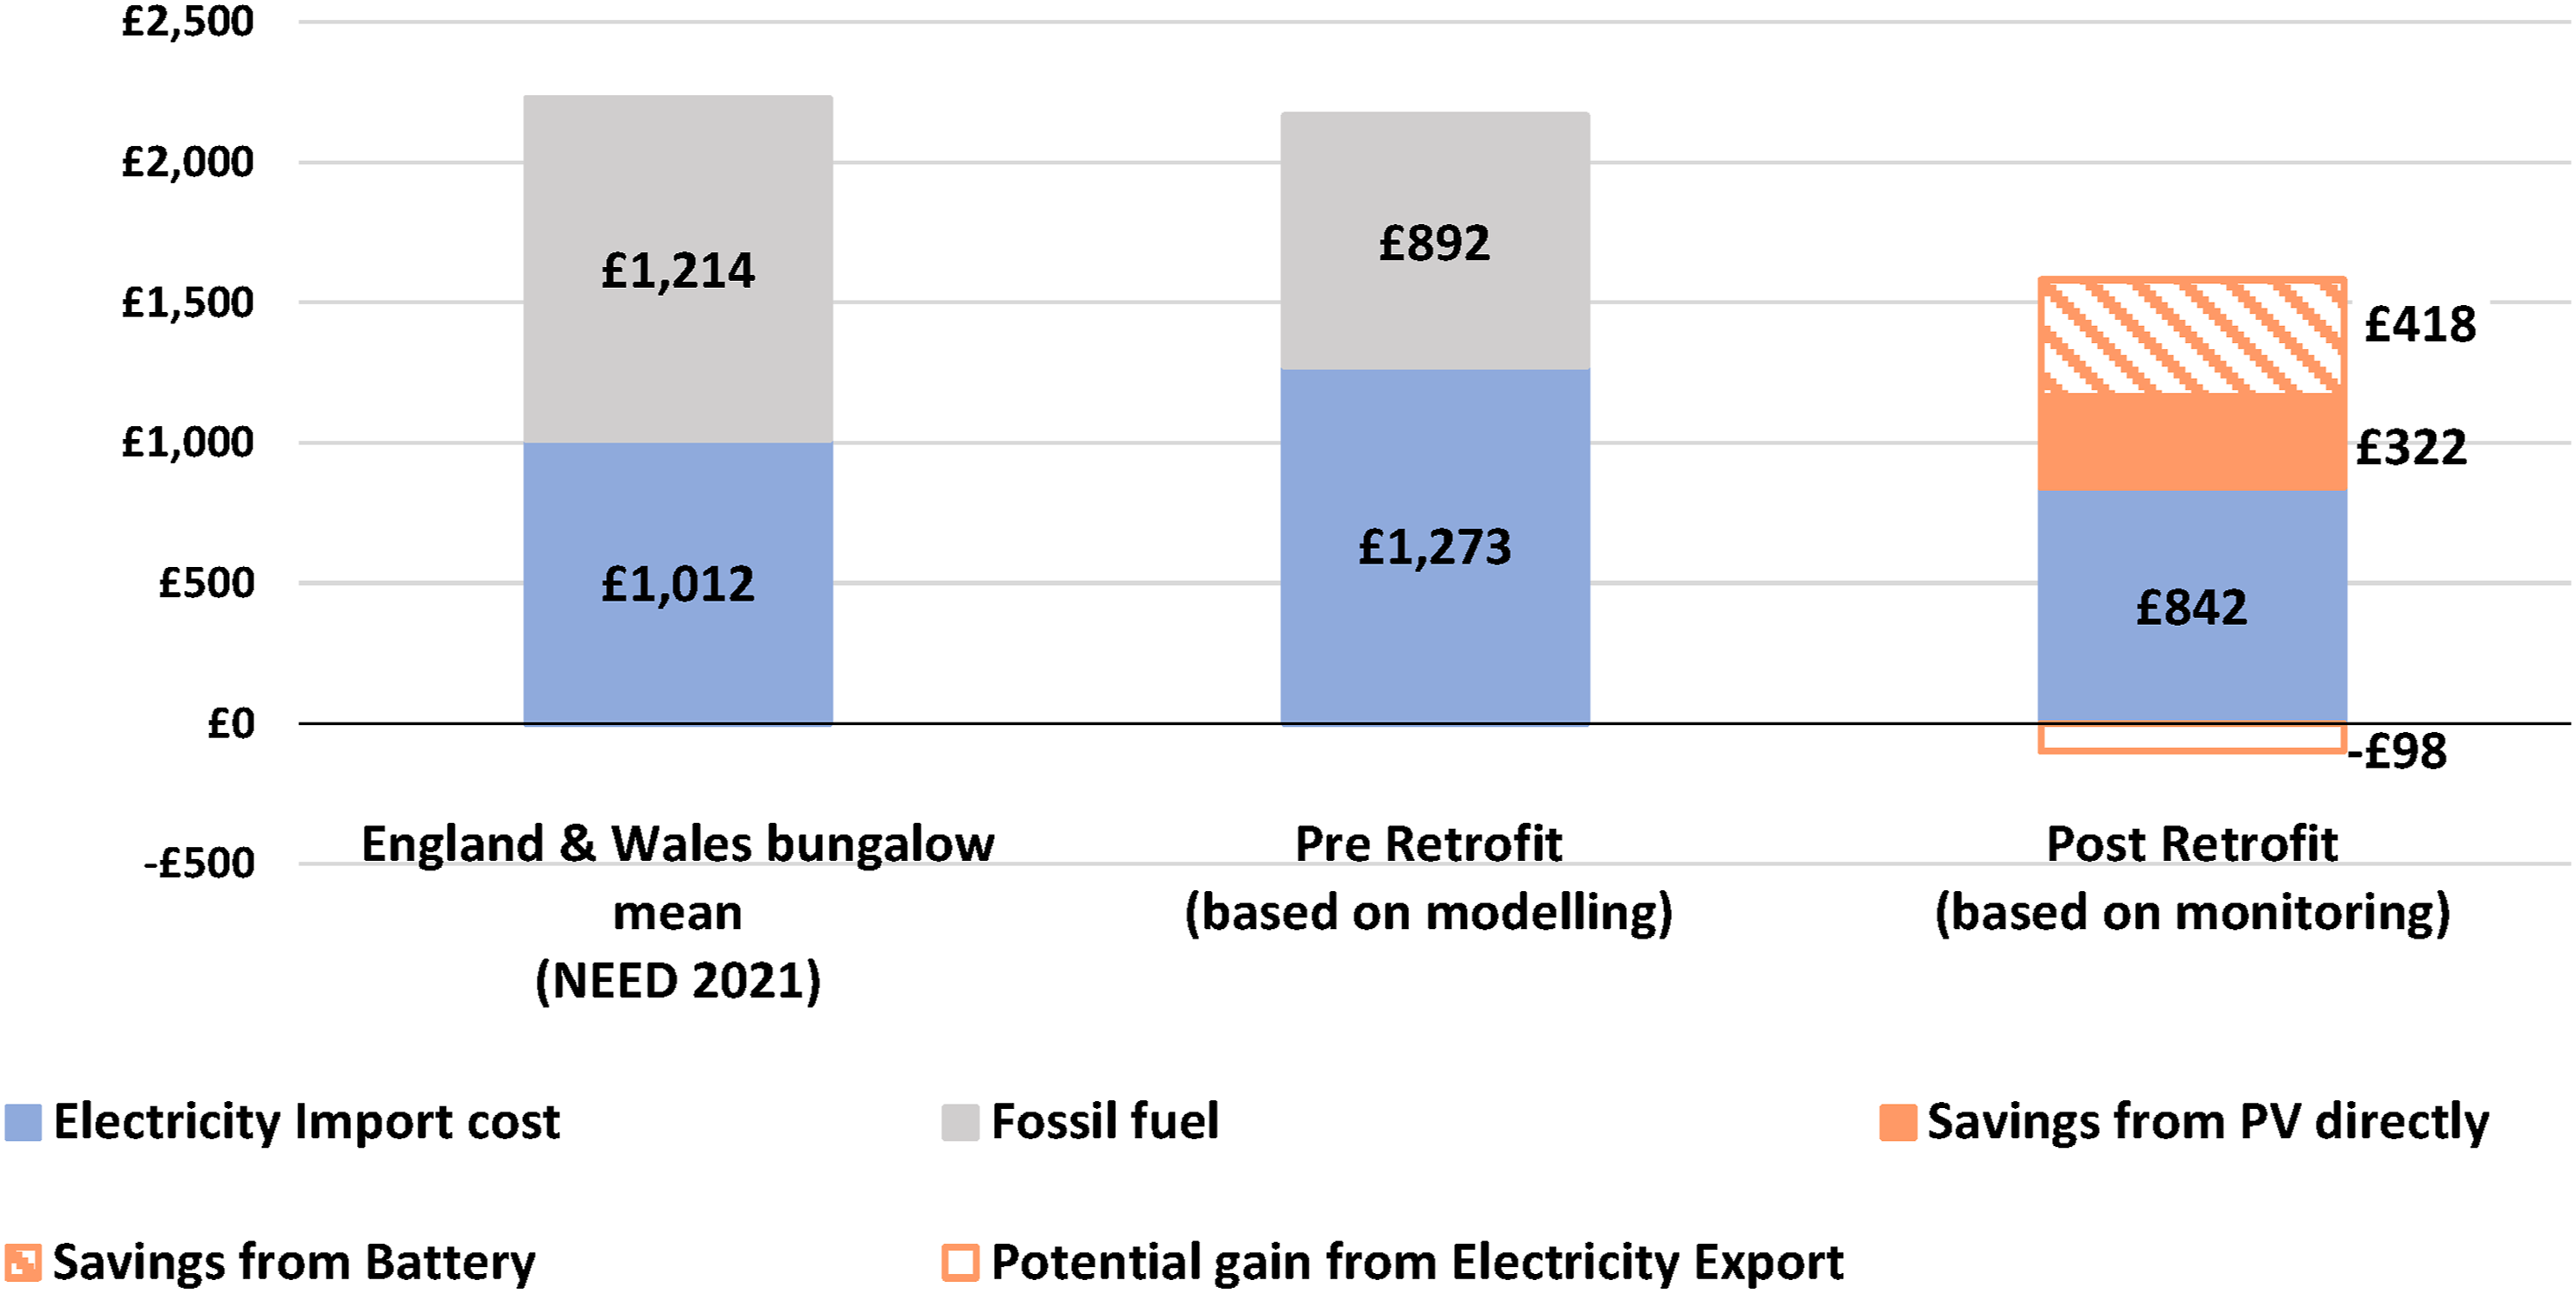
Figure 12 shows average monthly delivered energy for space heating per bungalow, along with the internal and external temperatures. Internal temperature is averaged between living room and two bedrooms, while external temperature is monitored by the onsite weather station. The temperature variations do not necessarily explain heating delivery variations as residents’ behaviour and occupancy are not indicated in the graph. However, bungalows E and F, have higher demand for space heating with indications that thermostats were active during the summer. This finding was backed up by interviews as residents were satisfied by the post-retrofit comfort but some would forget to change thermostat settings during summer or long absents. Internal temperature seems to be maintained within the comfort range, as set by CIBSE guide A.
41
The sporadic lower temperatures that appear in bungalow B are due to intermittent occupancy and they are accompanied by significant less amount of space heating delivery as shows in November 2020 and March 2021. Daily space heating delivery per month with internal and external monthly average temperature.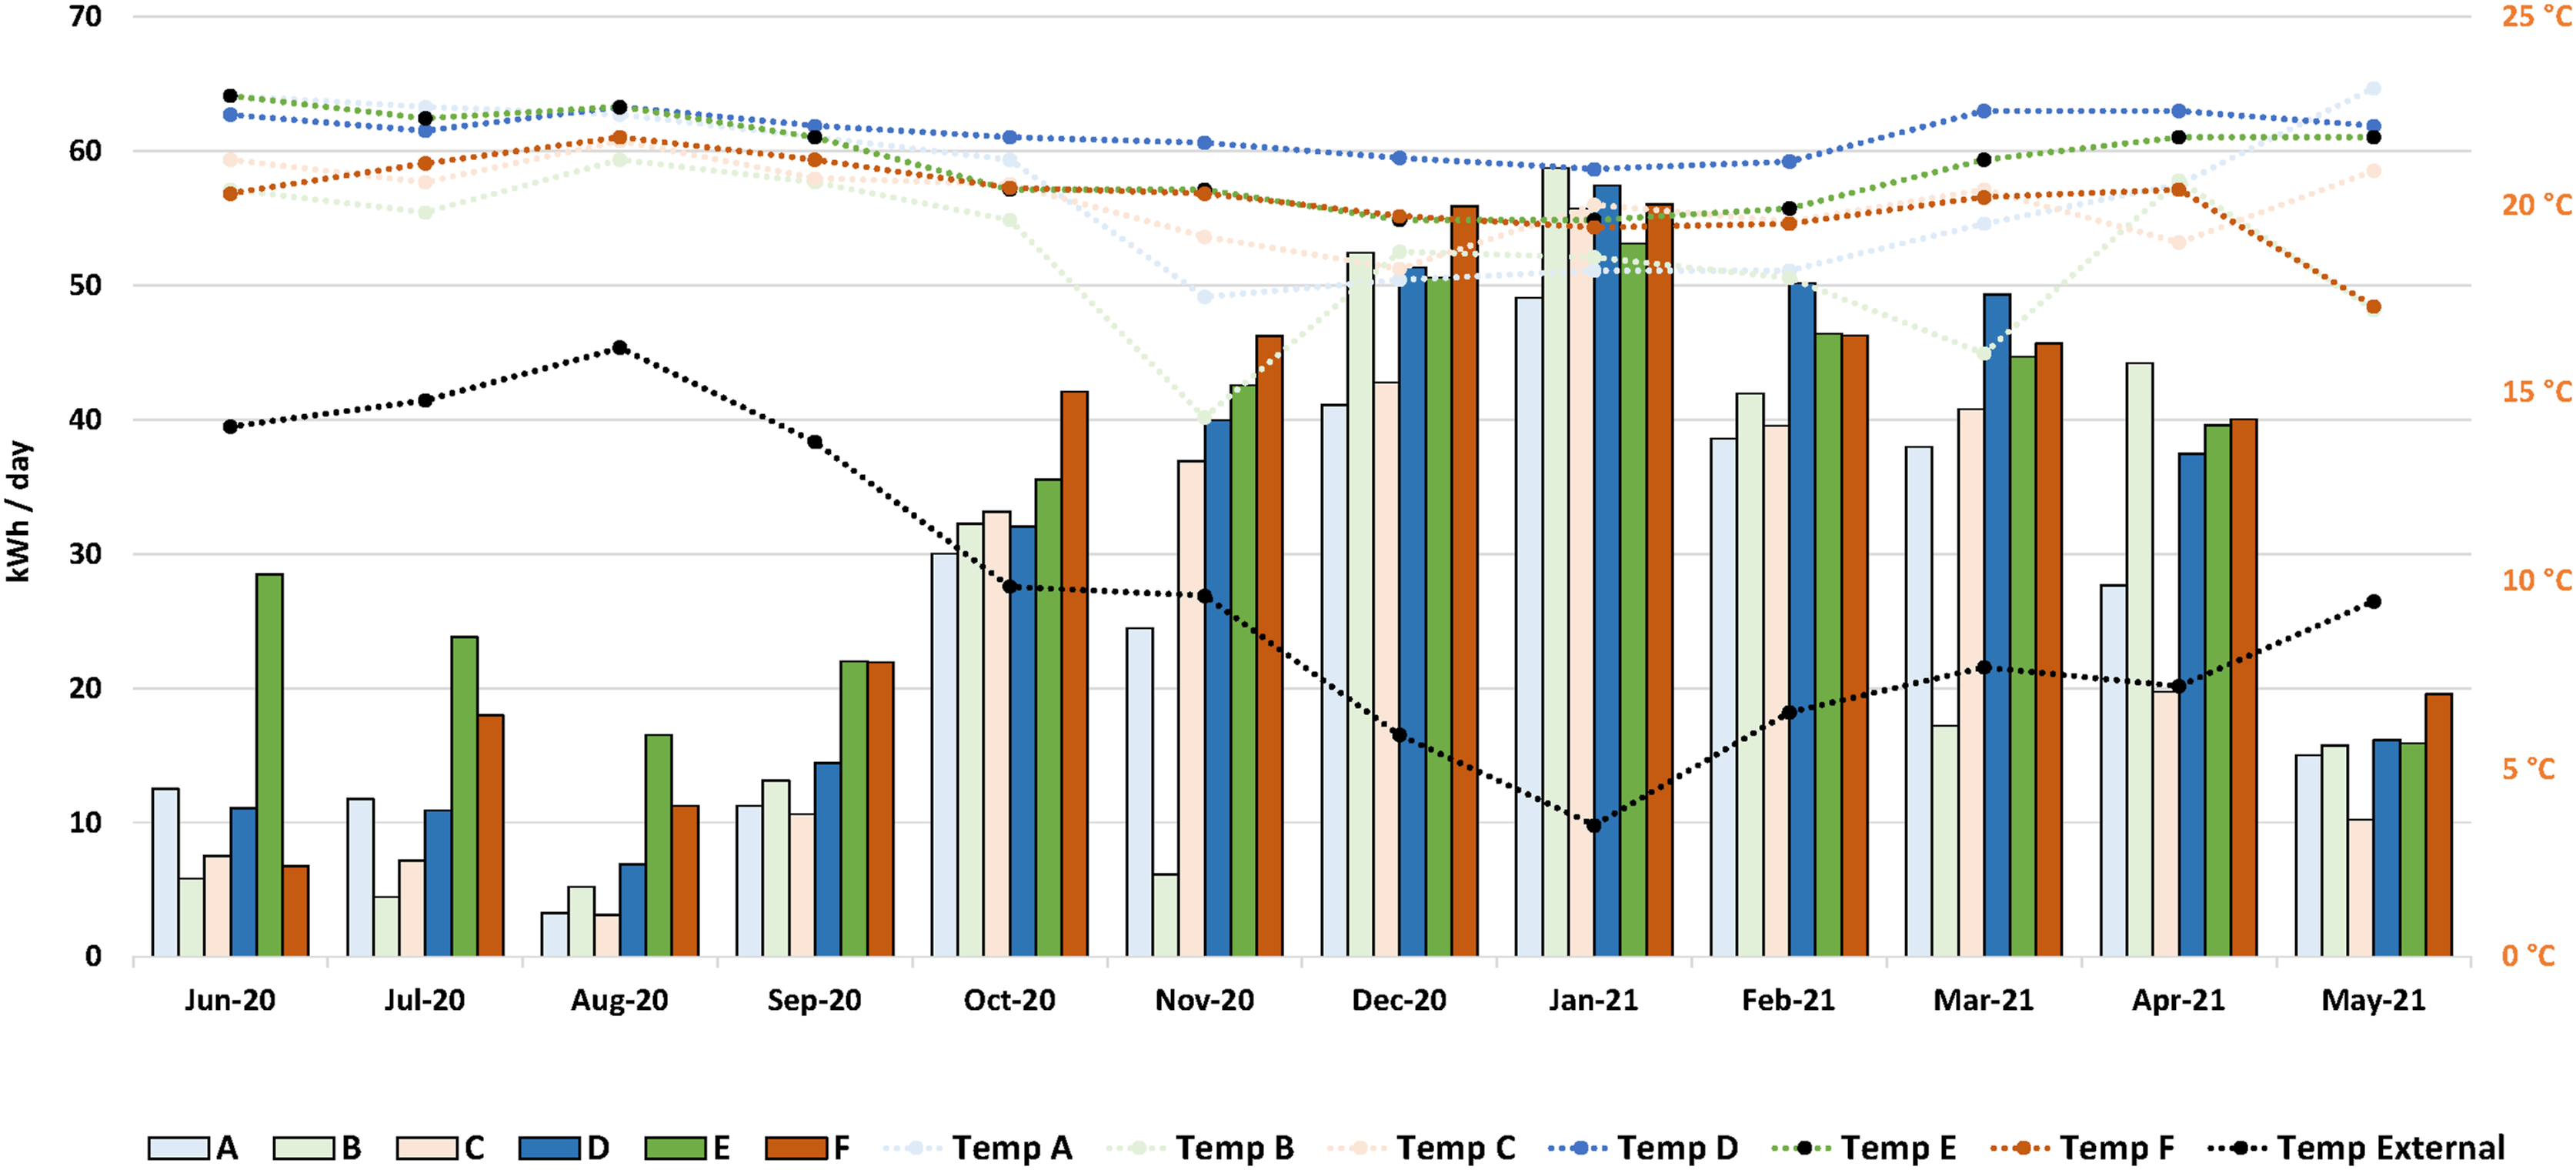
Evidence of the performance of the GSHP can be seen in Figure 13. Average daily electrical consumption of the GSHP per month, is presented along with monthly CoP for each bungalow GSHP. The COP of the GSHPs is very stable over the year as 90% of the time it fluctuates between 3.0 and 3.6 with an average of 3.3. GSHP electrical consumption follows the space heating delivery, with some discrepancies due to the domestic hot water demand. For example, A has a significant hot water demand in the summer which increases the electricity consumption and lowers the CoP. Average daily GSHP electrical consumption per month per bungalow together with monthly average CoP per bungalow.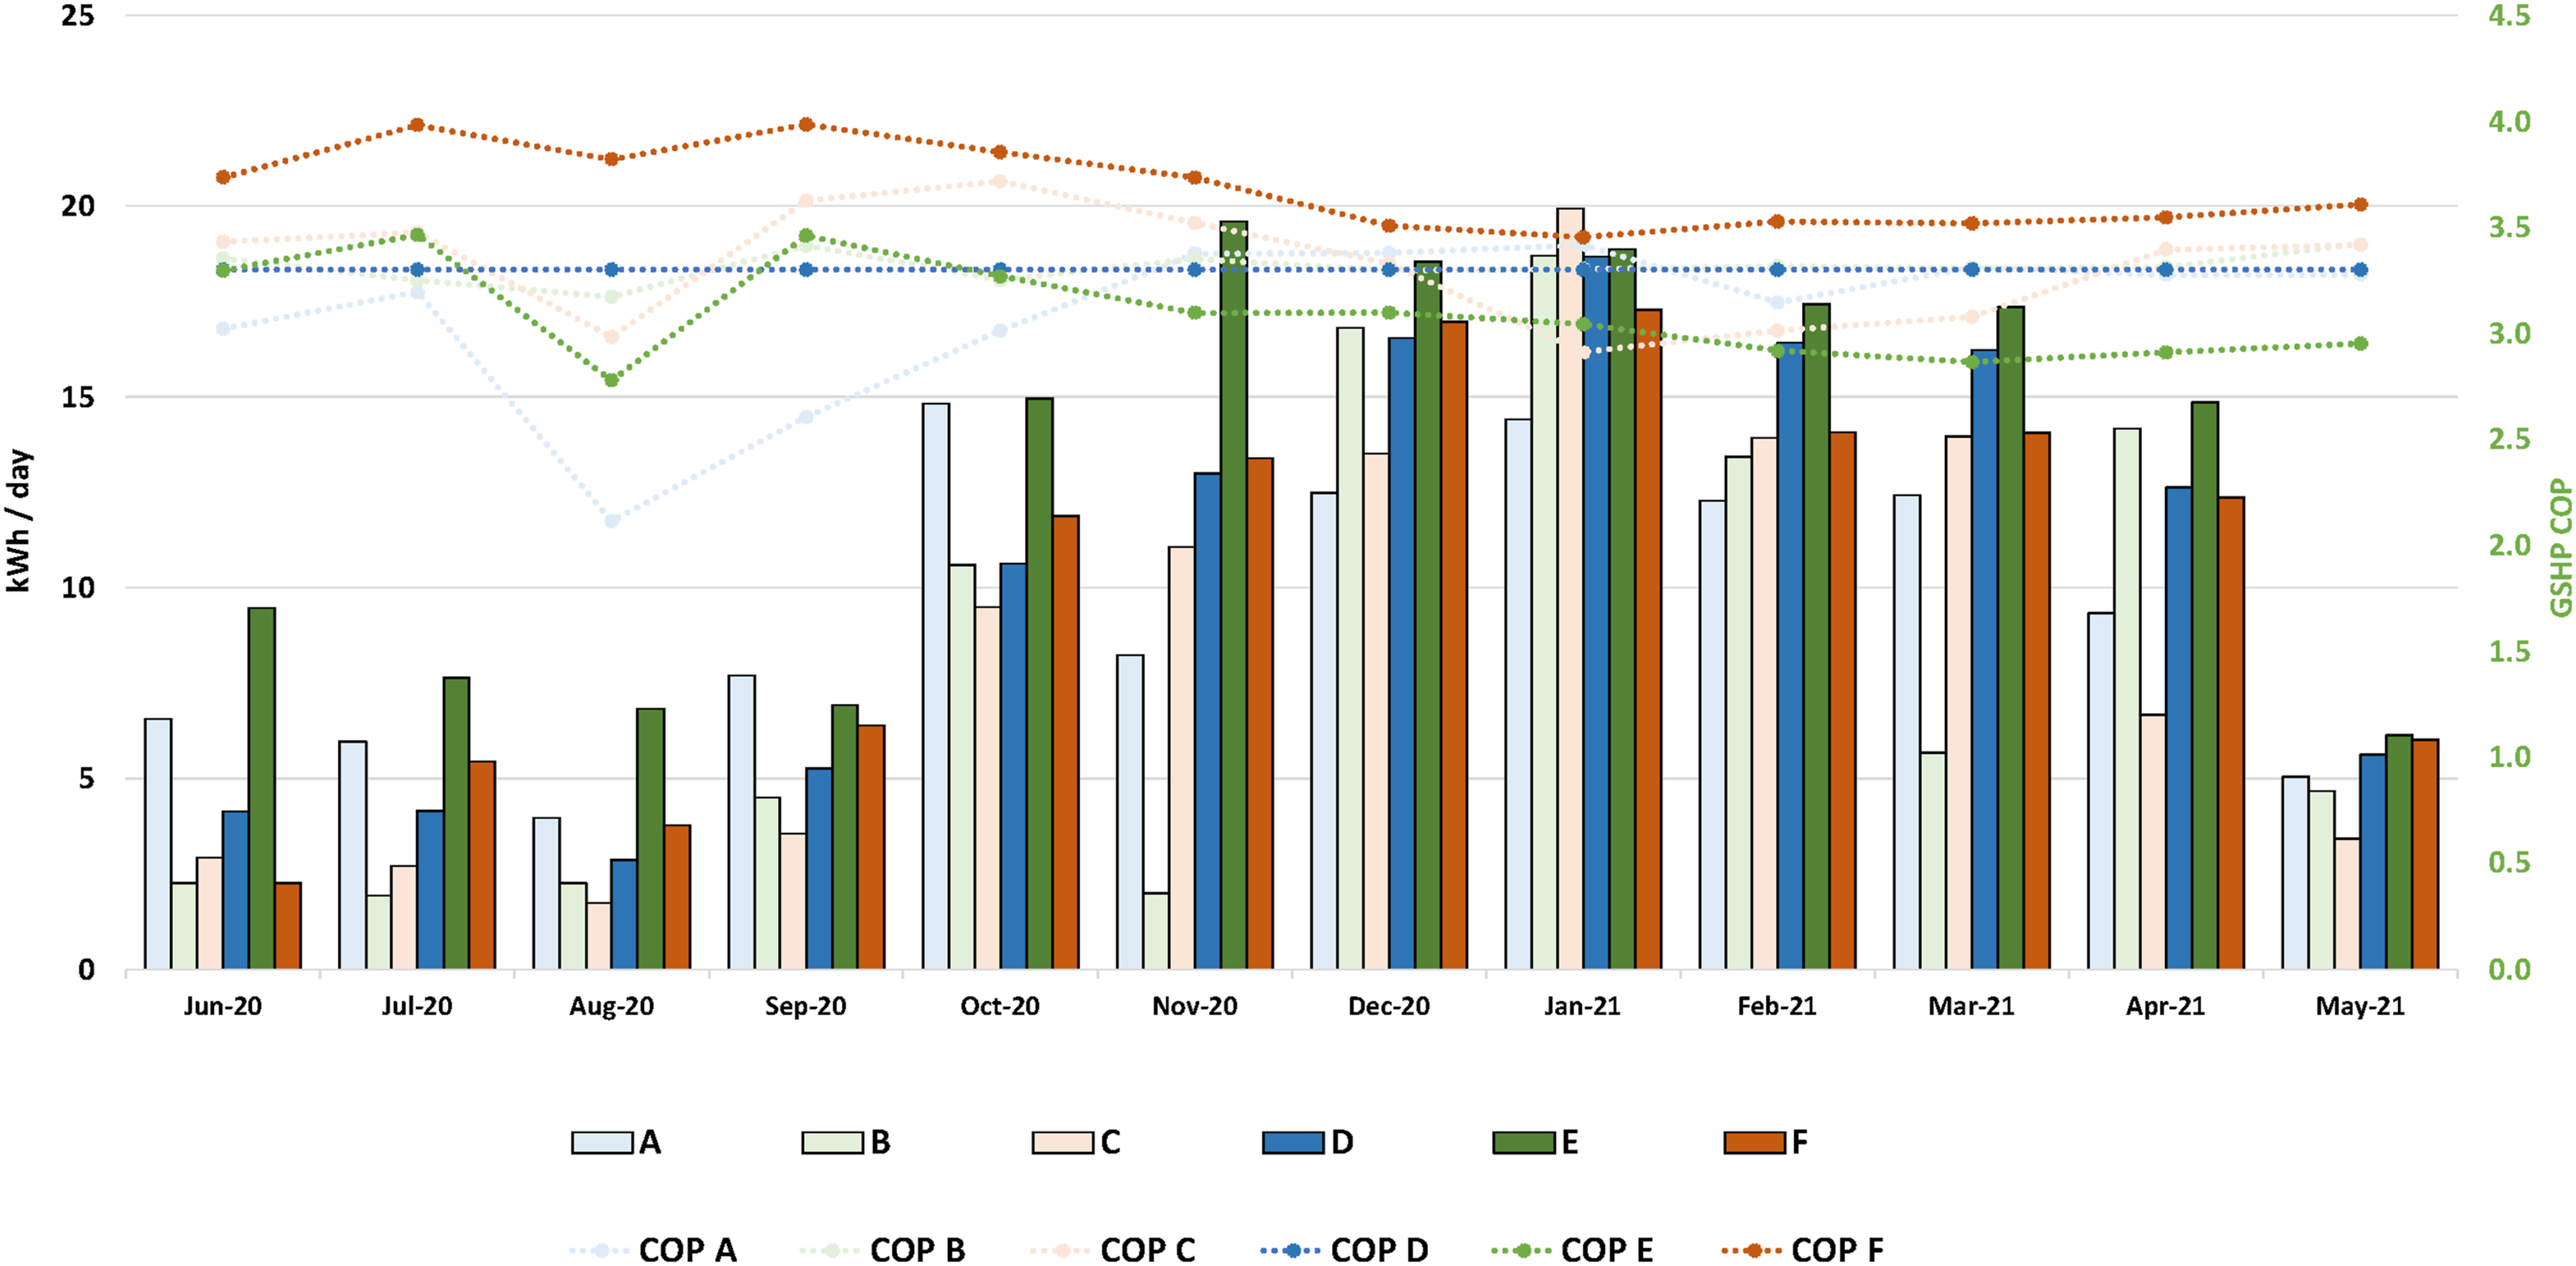
Figure 14 shows annual GSHP consumption, with space heating and hot water delivery per bungalow. The annual amount of delivered energy for space heating confirms the observed varied energy consumption across the bungalows. Bungalows A, B and C have similar values of around 9000 kWh and with D, E and F with higher amount of space heating delivery around 12,000 kWh. Annual GSHP consumption and space heating and hot water delivery per bungalow.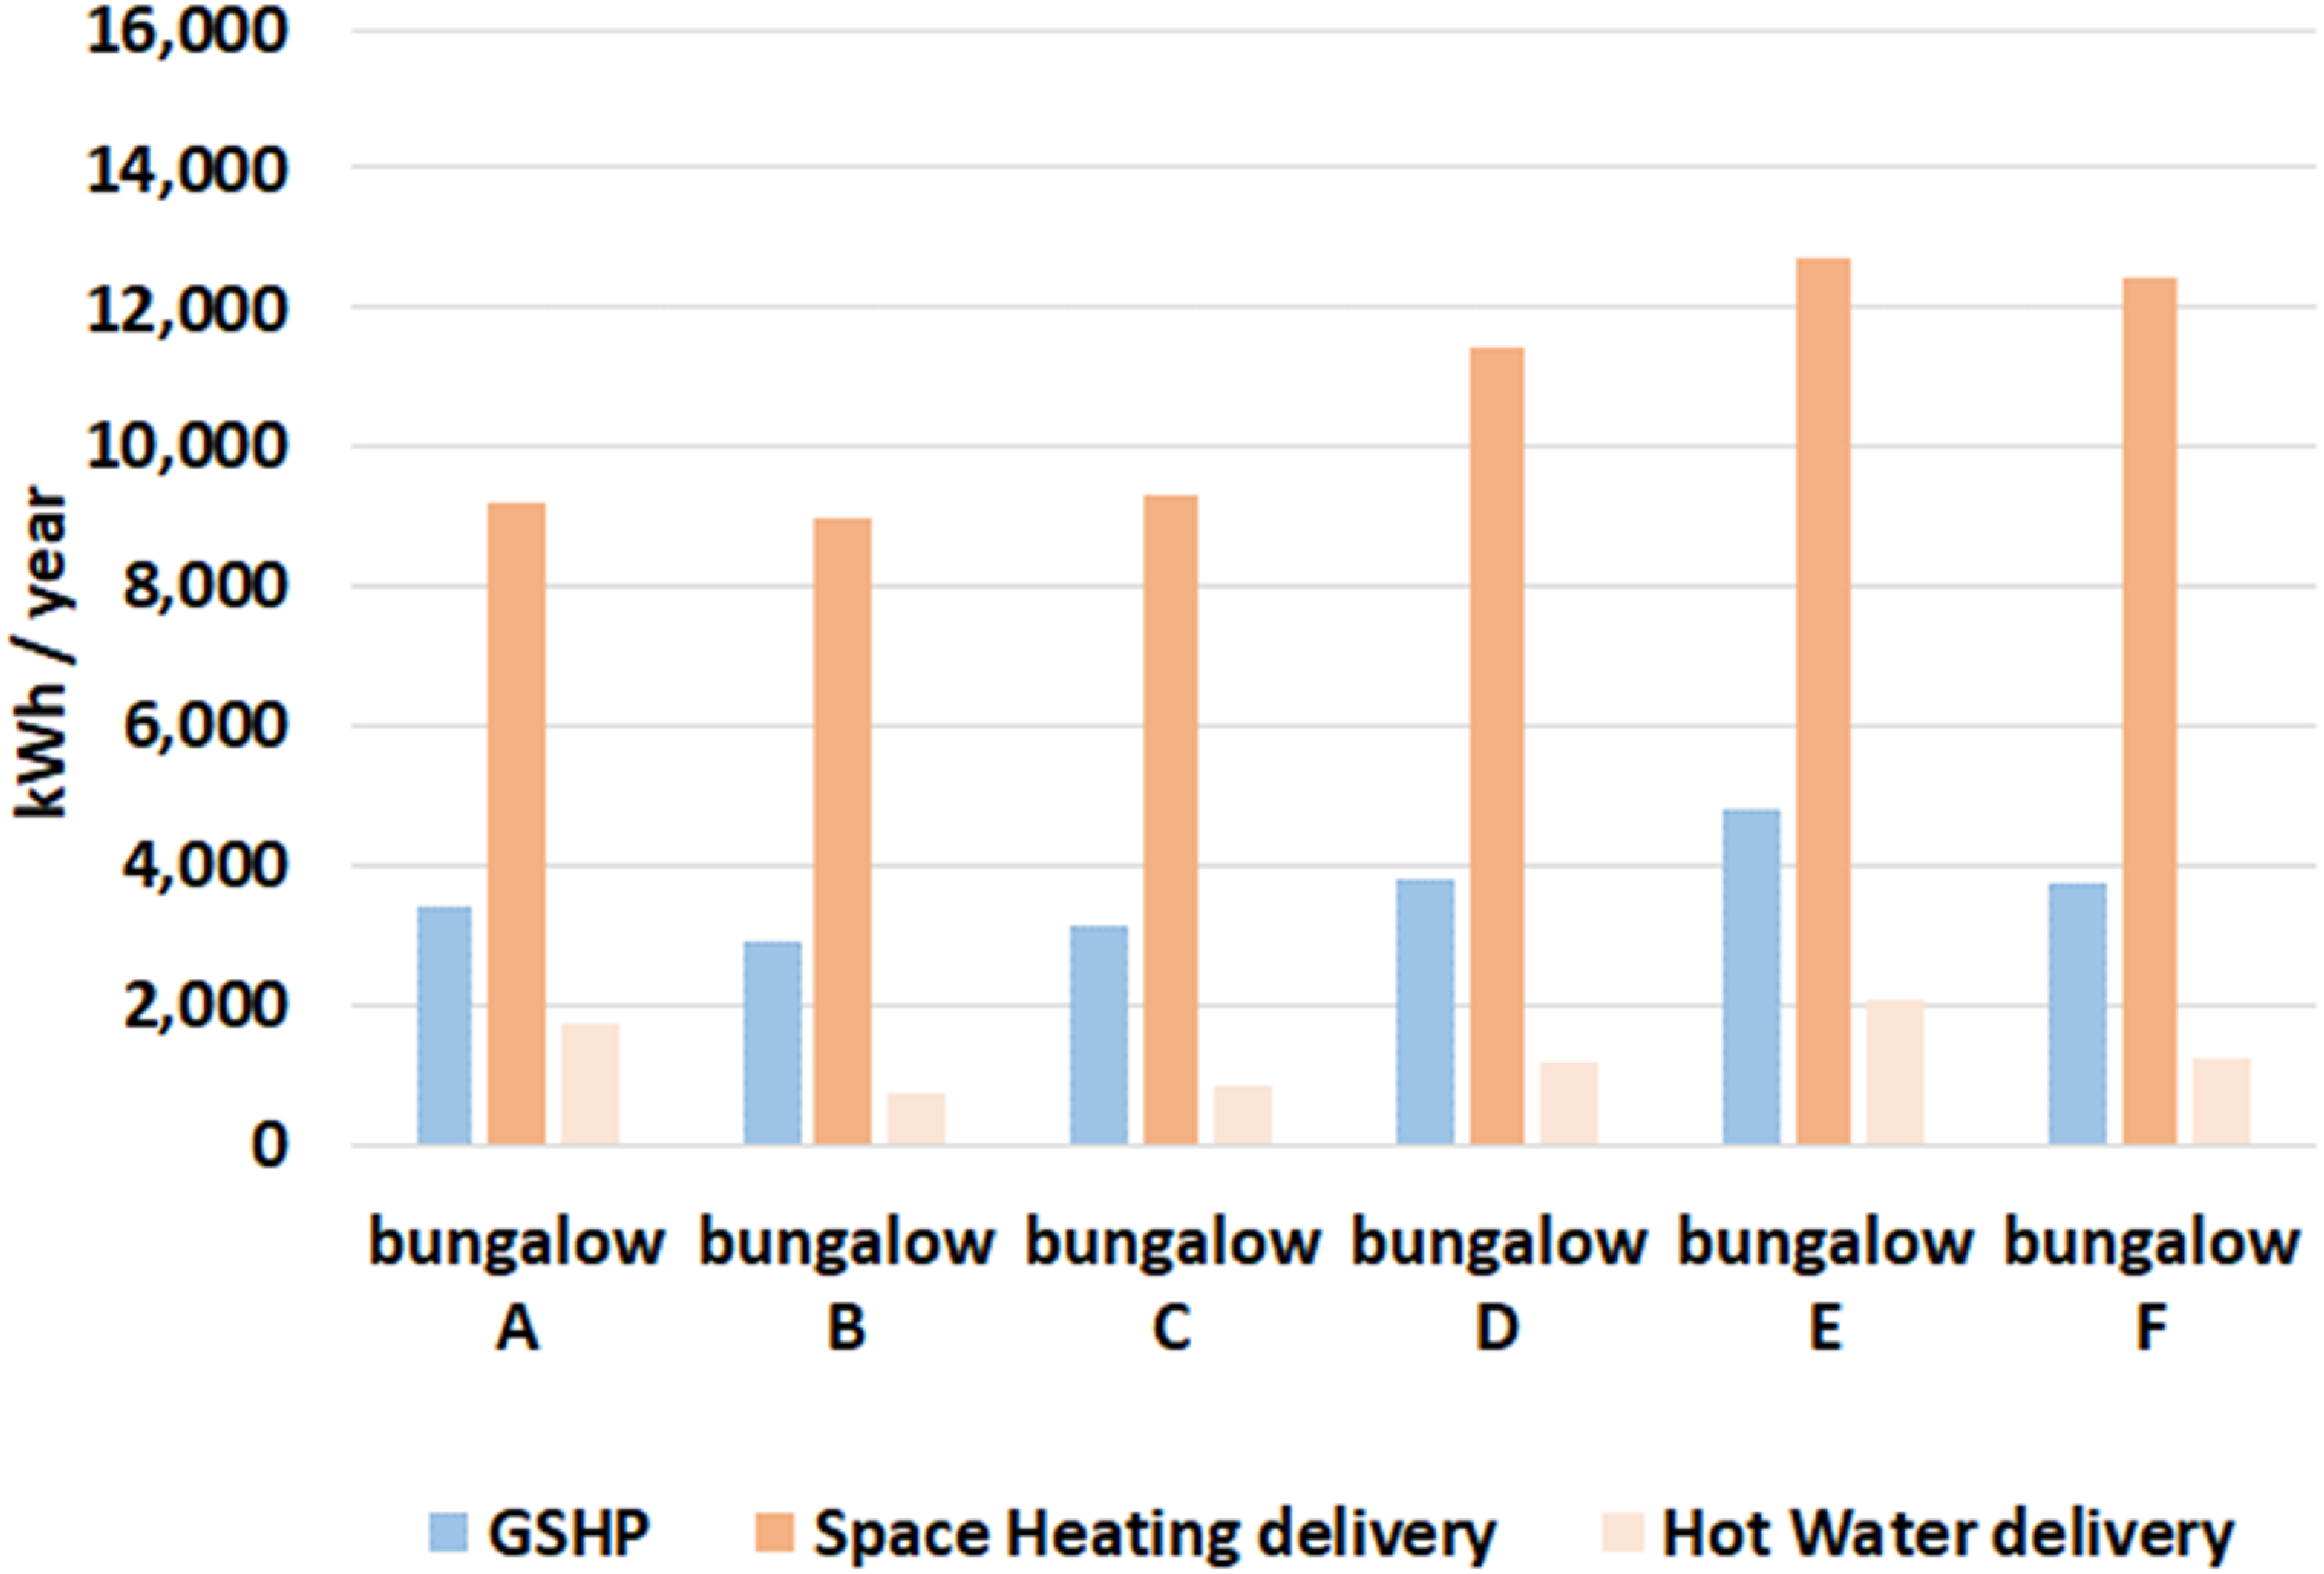
When looking at indoor thermal conditions post-retrofit, bungalows A, B and C set their thermostat at a lower temperature compared to bungalows D, E and F. This explains the higher GSHP heat delivery and electricity consumption as well as total energy consumption observed in bungalows D, E and F.
Pre-retrofit monitoring showed that living rooms were cold and draughty with fluctuations in temperatures throughout the day, tracking external temperatures. One of the goals of the retrofit was to maintain comfortable temperature and relative humidity levels and to avoid draughts by improving airtightness (improved from 9.8 to 5.5 m3/h/m2 @50 Pa).
Monitoring shows that post-retrofit internal temperatures are more consistent, remaining around the temperature set on the thermostat. An example of this is presented in Figure 15, illustrating average daily profile of the living room temperature throughout a heating season pre and post retrofit. The graph depicts pre-retrofit temperatures fluctuated by 3°C during the day, falling as low as 14°C. The recommended by the Council minimum temperature of 18°C was not achieved before retrofitting. Post-retrofit, the internal temperature increased (+3.4°C on average) and was consistent throughout the day (±0.55°C). Comparison of lounge temperature pre- and post-retrofit.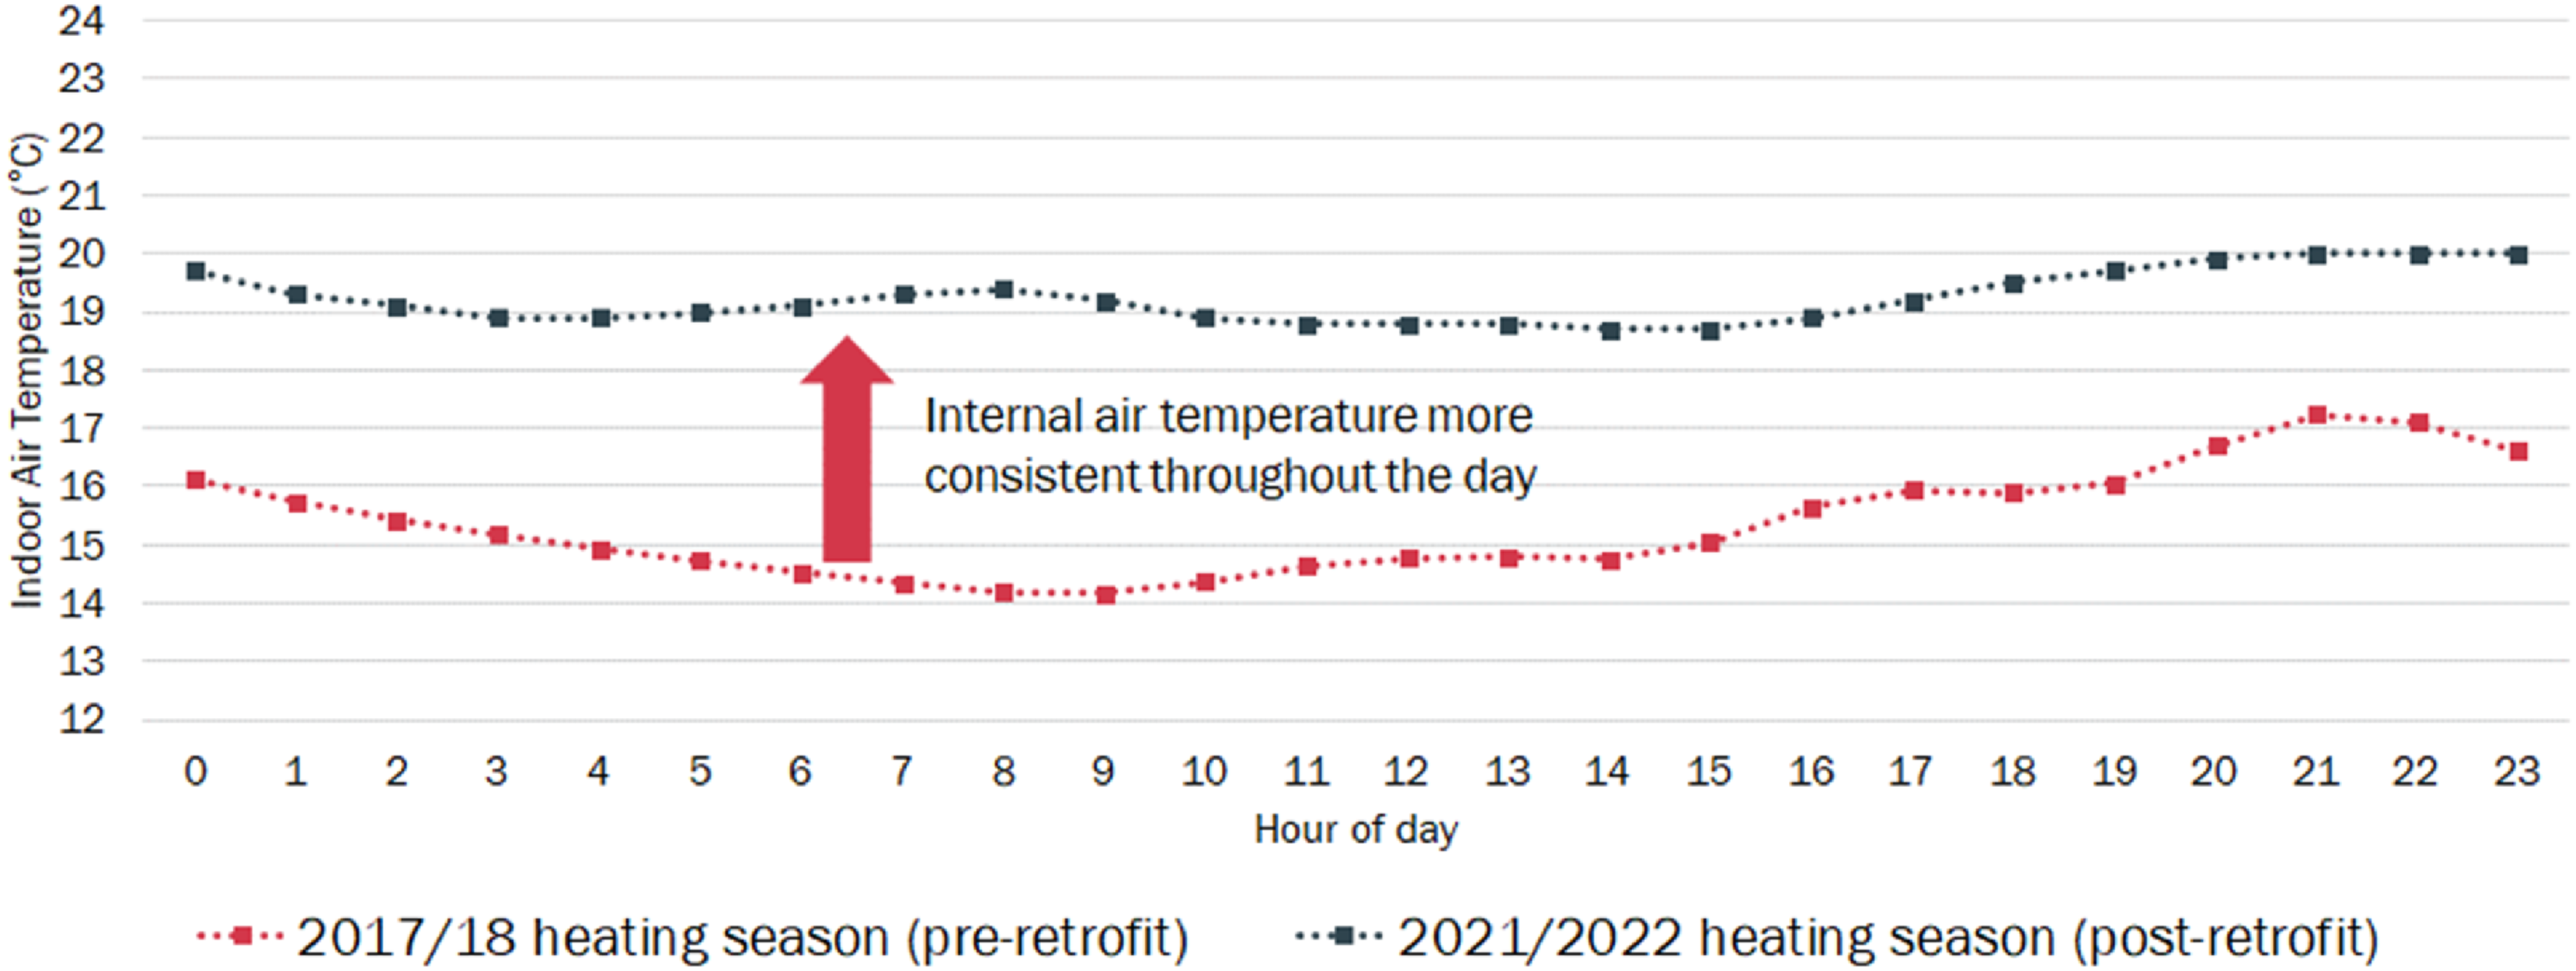
Relative humidity in all bungalows is generally within the acceptable range provided by CIBSE guide A (40–70%). Average values vary between bungalows ranging from 47% to 58% with a standard deviation of between 8% and 10%.
Conclusions
This paper presents the outcomes associated with the implementation of a whole house energy retrofit across six bungalows in South Wales. The case study provides an example of good practice where operational energy, carbon and energy bill reduction and increased quality of the built environment including internal conditions were achieved. The case study demonstrates that having access to detailed, reliable data through all stages of a retrofit enables useful modelling to be carried out providing outcomes that can be communicated to all stakeholders, optimising installation, operation and maintenance. The research also highlights that gathering data and carrying out pre and post retrofit monitoring optimises decision making as well as providing evidence to support replicability at different scales and across building types.
Despite variability of demand profiles, all six homes became operationally energy positive over an annual period, generating an average of 2 MWh more than they import. The installation of PV panels on two roof orientations allowed for more generation throughout the day to better match demand. Battery storage doubled the self-sufficiency and the combination of generation and storage enabled nearly zero energy bills to be achieved for 6 months of the year when export was utilised. The GSHPs achieved a stable CoP across the year with minimum impact from external conditions. The MVHR in combination with the fabric improvements, assisted in stabilising internal temperature variations, eliminating the damp and ensuring fresh air supply and control over relative humidity. Commissioning of the MVHR is vital to ensure comfort, energy balance and trust in the whole system. Monitoring provided evidence that attention to detail was lacking during the first phase of commissioning, therefore recommissioning was necessary.
The embodied carbon of the interventions was calculated to be 75% less than a similar new build, justifying the decision to retrofit rather than rebuild. Embodied carbon payback time is 9 times quicker than cost payback. This highlights the challenges around funding for whole house retrofits when financial cost is the only factor considered. When embodied carbon is considered, justification for carrying out works is stronger, supporting longer term carbon targets.
This case study provided knowledge to the CLCBE team to develop the Practical Retrofit Early-Stage Survey (PRESS) Tool 42 which enables rapid but effective data gathering early at the planning stage. PRESS tools has been used by a range of social housing companies to gather data for retrofitting. Gathering evidence through pre- and post-retrofit monitoring, collates evidence to demonstrate whether set objectives are achieved. This can highlight valuable evidence such as positive impact on occupants as comfort levels are consistent and energy bills drastically reduced. Monitoring methods are scalable and replicable facilitating production of performance evaluation at scale to assist with decision making, both in the short and long term.
Footnotes
Acknowledgements
This research has been made possible through the Welsh European Funding Office (WEFO) and UKRI. The Low Carbon Built Environment (LCBE) projects could not have been delivered without the support of staff at the Welsh School of Architecture, Cardiff University particularly those within the Centre for a Low Carbon Built Environment (CLCBE), together with the many colleagues in partner organisations who have worked with them to deliver the projects, particularly Swansea Council.
Declaration of conflicting interests
The author(s) declared no potential conflicts of interest with respect to the research, authorship, and/or publication of this article.
Funding
The author(s) disclosed receipt of the following financial support for the research, authorship, and/or publication of this article: Welsh European Funding Office and UKRI.