
Abstract
In this study, computational fluid dynamics (CFD) was used to examine the efficiency of ventilation and airflow patterns in a multi-level layer hen house. The utilization of windcatchers as a natural ventilation system was the main area of focus. By comparing CFD simulations with experimental data using ANSYS Fluent, the results were validated. The findings showed good agreement in airflow velocity within the windcatchers and throughout the entire building between the CFD calculations and the experimental tests, resulting in uniform airflow distribution and the absence of turbulence in the area where the chickens were kept. This setup provided the layer hens with an acceptable level of comfort by maintaining a consistent and steady temperature profile. The windcatcher-based model demonstrated better temperature uniformity than mechanical window ventilation. The study also emphasized the importance of maintaining appropriate humidity levels throughout the building to ensure the comfort and productivity of layer hens. The advantages of the windcatcher-based system in terms of temperature distribution and airflow control were highlighted by comparison with an alternative ventilation model. These results underscore the importance of using natural ventilation systems, such as windcatchers, to create optimal ventilation conditions and provide layer hens with a comfortable and productive environment (resulting in a temperature reduction from 29°C to 19.85°C with a low and uniform air velocity ranging from 0 m/s to 0.7 m/s at cage level).
Practical application
An effective and eco-friendly approach to enhance animal health and productivity in poultry farms is to install a natural ventilation system with wind collectors. This setup creates optimal conditions for the animals by improving air quality, regulating temperature, and fine-tuning ventilation. Additionally, it promotes overall sustainability in poultry facilities by lowering energy costs and advocating for environmentally friendly management, aligning agricultural practices with stringent environmental standards.
Keywords
Introduction
Maintaining comfotable internal climatic conditions within chicken houses is one important part of maintaining successful poultry production. The health and wellbeing of the birds depend on the proper control of temperature, humidity, air flow, and air quality. 1 Due to their heightened sensitivity to heat, birds can suffer from heat stress, which can lower their production and cause serious health problems. 2 Farmers frequently choose to close poultry buildings to control the indoor climate, exercising control over elements like the lighting cycle and the HVAC system. 3 It is vital to investigate alternate cooling options because weather conditions outside can affect how effective HVAC systems are. Natural ventilation is one of these alternate technologies. Using natural ventilation in poultry houses can keep the birds comfortable while lowering the energy requirements and CO2 emissions of the buildings. Mechanical air cooling is not a viable substitute since it uses a lot of energy and is incompatible with the current energy grid. 4 This is crucial in countries like Tunisia where there are limited main energy sources and a growing need for energy. The primary resources in Tunisia fell from over 7500 ktoe in 2010 to 3957 ktoe in 2018, even while the country’s energy demand climbed to 9660 ktoe in 2019. 5 In conclusion, the internal climatic conditions of poultry buildings are crucial for successful poultry farming. To ensure the birds’ thermal comfort and productivity, proper regulation of temperature, humidity, air movement, and air quality is essential. Natural ventilation offers a sustainable solution to regulate the internal climate of poultry buildings, while also reducing energy consumption and CO2 emissions. With the depletion of fossil fuel resources and rising energy demand, it is imperative to develop and implement sustainable solutions for poultry farming to ensure its long-term viability.6,7 The windcatcher is a common type of natural ventilation equipment that helps to maintain a comfortable environment in cattle facilities and agricultural greenhouses. 8 The most important natural ventilation parameter to ensure aeration, cooling and thermal comfort in a poultry house is the wind speed. In the past, windcatchers were used in Persian architecture to provide natural ventilation in structures. This uses prevailing local winds and does not need electricity. Passive ventilation can be used to adequately ventilate enclosed buildings such as barns and chicken coops, which require large rates of ventilation. Wind capture devices, also called wind collectors, are traditional architectural elements that have been used in many parts of the world to provide natural ventilation and cooling to buildings. They are typically used in dry, hot climates where traditional air conditioning systems are not practical or affordable.9,10
Critical research on wind collectors has highlighted some gaps. Afshin et al. 11 conducted wind tunnel tests on a reduced two-sided model (1:50 scale) and observed transition angles between 39° and 55° for wind-exposed openings and windows. This indicates that the manifold acts as a chimney beyond this angle. The widening of a two-sided collector has been observed to considerably improve thermal comfort. 12
Montazeri et al. 13 analyzed the efficiency of a wind collector integrated into an isolated building. Their results showed that the proximity of the manifold outlet is detrimental to air quality, but integration with a window improves performance. Ghadiri et al. 14 examined the cross-ventilation with a two-sided manifold and an opening window. They observed a reduction in airflow on the opposite side of the wind and through the window.
In addition, the results of the study conducted by Mohamed Farouk 15 reveal that hexagonal wind collectors have air flows 12% to 24% higher than square and circular models with six openings. However, the hexagonal air supply is reduced by about 20% due to internal short circuits. The hexagonal manifolds thus offer more efficient air renewal, while the square manifolds offer higher thermal comfort.
According to the CFD analysis, 16 the parallel arrangement of the wind manifolds can reverse the flow by affecting the flow of air in the neighboring manifolds. This effect is reduced by increasing the spacing (up to 5 m), while the offset arrangement improves downwind ventilation. The first arrangement has the capacity to reintroduce CO2, while the second limits its amount.
Then, wind capture devices, by exploiting local air currents and operating without requiring energy, provide an efficient alternative for natural ventilation and cooling of buildings. These devices can significantly reduce a building’s carbon footprint by avoiding the use of electricity or other fossil fuels for their operation. Additionally, affordable solar chimney for ventilation and space cooling integrated with windcatcher with low maintenance are a popular choice for many building owners and inhabitants. 17 The movement of air brought on by variations in pressure and temperature between the interior and exterior of the building is the basis for the operation of windcatchers used for natural ventilation of buildings. In order to offer ventilation and cooling for the building, windcatchers are made to take use of the natural airflow patterns produced by wind, solar chimney, and temperature changes. 18 A low-pressure area develops at the peak of a tower when wind blows over the top of a windcatcher. Through apertures at the windcatcher’s base, this low-pressure area forces air out of the building, bringing in fresh air. The cooling effect produced by the windcatcher’s circulation of air can aid in bringing down the inside temperature. Windcatchers can benefit from the stack effect, which is the warm air’s natural inclination to climb and exit through apertures at the top of a building, in addition to wind-induced ventilation. A constant flow of fresh air can be created by combining wind-induced and stack-effect ventilation, assisting in maintaining a cozy and healthy environment inside the building. 19 A device known as a windcatcher takes advantage of the wind to circulate air inside structures. The design of the windcatcher, the orientation of the building, and the normal wind patterns in the area are only a few of the variables that affect how efficient windcatchers are as natural ventilation and cooling systems. For best performance and energy efficiency, windcatchers need to be properly sized, placed, and maintained. The performance of windcatchers is influenced by a number of significant factors, including wind direction and speed, temperature differences between indoor and outdoor environments, building orientation and shape, size, and design, building occupancy, and weather conditions. The most important factors that affect the windcatcher’s placement and orientation as well as how much air it can suck through are wind speed and direction. The airflow rate, pressure differential, and cooling efficiency are also influenced by temperature difference, building orientation, height and form, windcatcher size and design, building occupancy, and activity level. The effectiveness and usability of windcatchers can also be influenced by climate factors including temperature, humidity, and wind patterns, which are more effective in arid and hot areas with significant daily temperature fluctuations. 20 Compared to other opening kinds, windcatchers have a number of benefits. 21 They are particularly helpful in crowded cities where windows might not be able to provide the necessary ventilation rate. For instance, adding a windcatcher greatly enhanced the ventilation in research on a three-story house with limited natural ventilation. 22 Additionally, compared to other apertures, windcatchers have a larger pressure coefficient (Cp), which allows for greater ventilation rates. 23 In fact, a wind tunnel test 24 found that windcatchers performed better in terms of Cp than other openings. In areas without access to windows, like basements, windcatchers can be especially useful. When compared to the outside environment, they can significantly lower the internal temperature by up to 3–5°C during the day, 25 and they can also lessen temperature swings. 26 The significance of windcatchers in creating cozy temperature conditions has been proven by another study. 27 Additionally, wind catchers can serve as an effective passive cooling device and assist reduce the cooling loads in contemporary structures. Additionally, their efficiency can be increased by including evaporative cooling, leading to better indoor conditions. 28 The usefulness of windcatchers in providing natural ventilation cooling for buildings has been the subject of numerous research. For instance, Calautit et al. 29 evaluated the performance of a windcatcher with a passive heat recovery wheel using computational fluid dynamics (CFD) models and experimental analyses. The findings showed that the windcatcher recovered heat from the exhaust air while also supplying natural ventilation. Similar to this, Sadeghi et al. 30 looked into how windcatchers affected Tehran, Iran, university buildings’ thermal comfort and indoor air quality. According to the study, windcatchers improved indoor air quality and occupant comfort by reducing indoor air pollutants such carbon dioxide and volatile organic compounds. Nejat et al.’s 31 experimental and simulation investigation evaluated how well windcatchers enhanced thermal comfort and indoor air quality. The study showed that windcatchers can reduce the concentration of pollutants while boosting air exchange rates, making them a practical option for passive cooling and natural ventilation, especially in hot and arid areas. Additionally, Kabir et al. 32 used CFD techniques to assess the performance of air flow and thermal comfort. According to a different study, square windcatchers with a height-to- width ratio of 1.5, an inlet size that is 0.2 times the plan area, and the best cooling performance are available. 33 Numerical models were utilized to optimize the design of windcatchers in a high-rise building in a work by Nasrollahi et al. 34 The scientists concluded that rectangular windcatchers with a 1:1.5 aspect ratio and an entry area that was 0.2 times the plan area performed the best in terms of cooling. CFD simulations are also used to investigate the best aerodynamic design for wind catchers. 35 Enhancement of the summertime evaporative cooling rate for multi-story buildings was discussed in another study. 36 The authors discovered that evaporative spray cooling caused the temperature to drop by 12°C to 6°C while increasing relative humidity by 80%. They made use of CFD models to examine the effectiveness of alternative windcatcher configurations, including single and multiple windcatchers with variable entry regions and heights. Their findings revealed that increasing the inlet area and height of the windcatcher could enhance its cooling effectiveness. In another study by Saif et al., 37 windcatchers were used to improve thermal comfort as well as indoor air quality in desert areas. Livestock farming is an important sector for the economy of Tunisia, where hot and arid climatic conditions can cause significant challenges for animal welfare and productivity. To address this issue, the present study aims to develop a design tool for natural ventilation of livestock buildings in such conditions, with a particular focus on poultry houses. The development of a three-dimensional computational fluid dynamics (CFD) model with various boundary conditions is suggested in this study to simulate the distribution of humidity, temperature, and airflow inside a chicken house with a windcatcher system. The objective is to contribute to the assessment of indoor environmental parameters in such systems, which can ultimately lead to better indoor conditions for livestock and improved productivity. The validation of the CFD model by comparing the simulated results with other results from the literature will enhance the reliability of the tool and its usefulness in practical applications. The novelty and significance of this work lie in its contribution to the development of sustainable and cost-effective solutions for natural ventilation in livestock buildings, which can enhance animal welfare, productivity, and economic benefits for farmers.
The windcatcher system description
The cooling model of the poultry building, which houses chickens in cages, relies on the use of roof-mounted wind collectors, as illustrated in Figure 1. The building considered is 30 m × 10 m × 4 m (L × W × H) with a sloping roof shape (the most used in Tunisia) (Figure 2). Schematic diagram of a windcatcher cooling air system in a poultry building. The different dimensions of the building as well as the enclosures inside.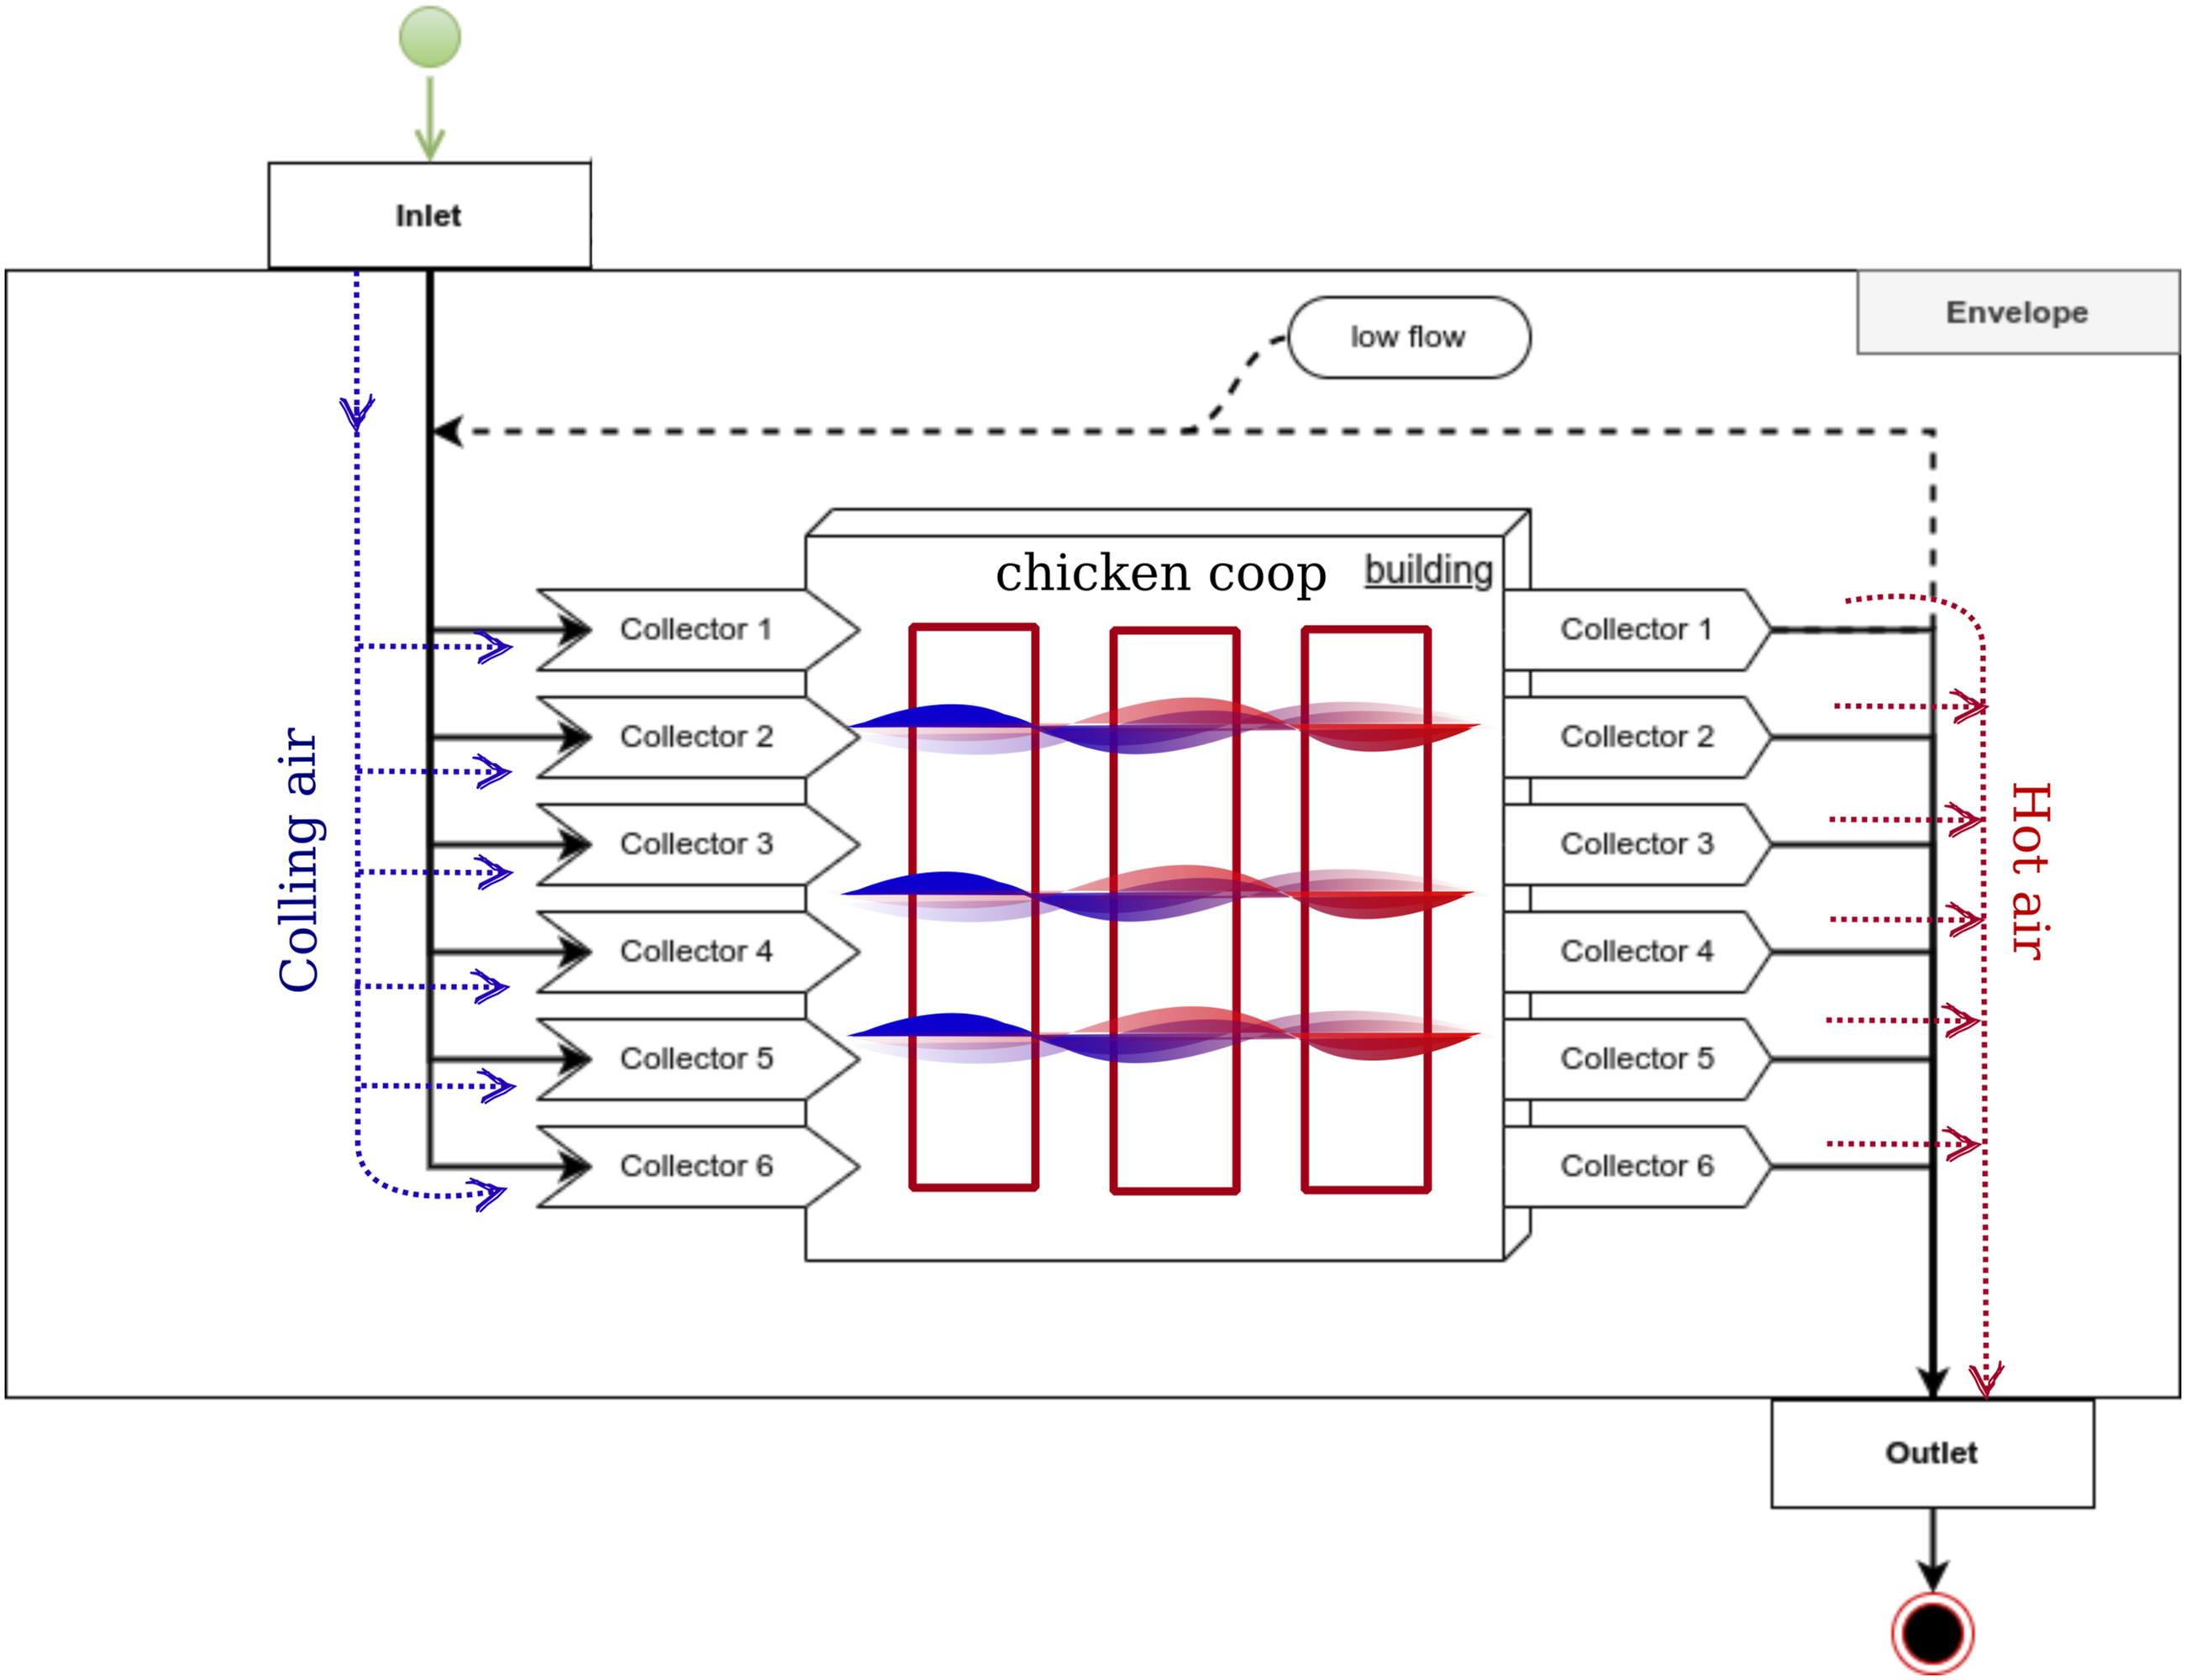
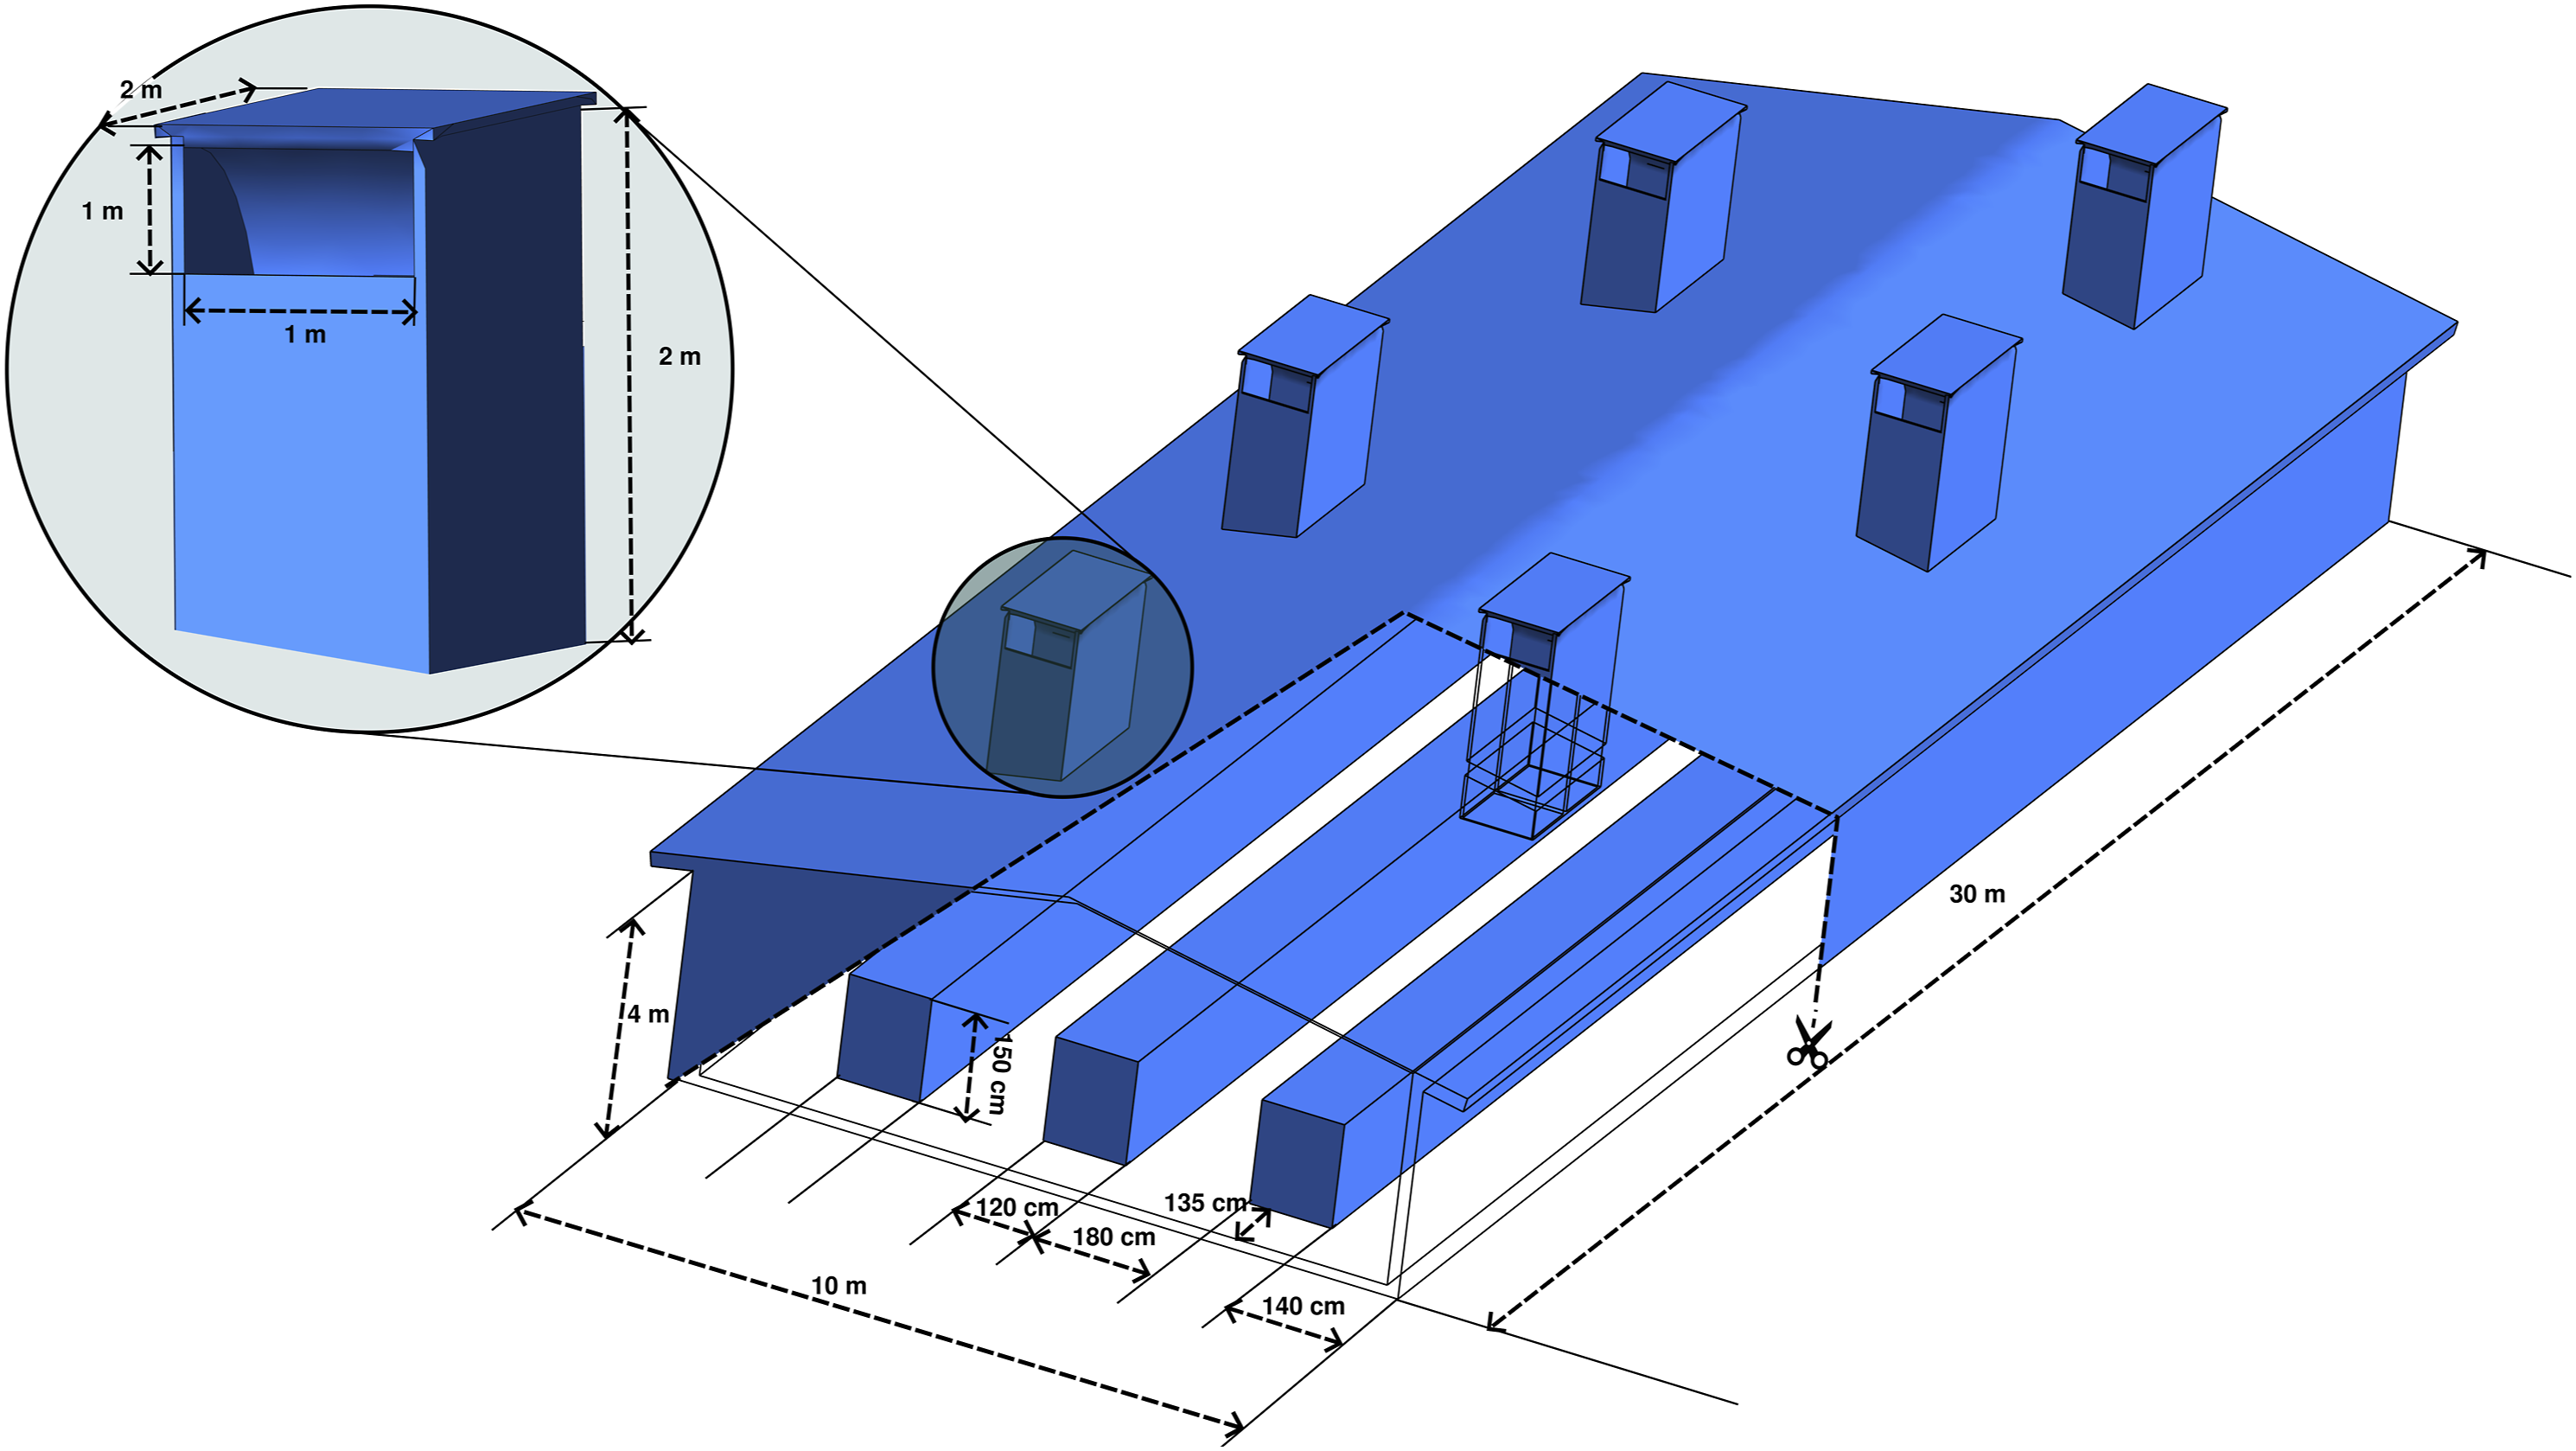
This system includes six wind collectors positioned in an offset manner with a spacing of 5 m between the collectors to maximize the supply of fresh air to the poultry building. Each collector, whose dimensions are 1 m × 2 m × 2 m (L × W × H) (Figure 2), is designed to capture and orient the external wind towards the interior of the poultry structure. These manifolds are specially designed to minimize turbulence and optimize air circulation, thus ensuring efficient ventilation. When the wind blows, these manifolds capture outside air, creating a pressure differential that promotes fresh air into the poultry building. This natural ventilation approach helps reduce ambient temperature by expelling the accumulated hot air and replacing it with fresh air. The dimensions of the cages are as follows: they are 27 m long, 1.2 m wide and 1.5 m high (Figure 2). The building houses three cages, 1.8 m apart, to allow adequate air circulation. The orientation of the wind with respect to the opening of the collectors is 0°. The strategic positioning of the wind collectors on the roof ensures a uniform distribution of fresh air throughout the poultry building, including the areas where the cages are installed. This arrangement makes it possible to maintain an optimum temperature range for the welfare of the chickens. By improving air circulation and maintaining comfortable temperatures inside the building, this cooling system with wind manifolds helps improve the welfare and productivity of chickens.
Mathematical modeling and computational fluid dynamics setup
A computer-based simulation technique known as computational fluid dynamics (CFD) modeling is used to investigate and forecast the behaviour of fluid flow, heat transfer, and associated phenomena in a variety of engineering systems. The method entails modeling the system of interest as a computational grid, which is then numerically solved to simulate fluid flow and its interactions with various system components. CFD modeling makes predictions of temperature, pressure, and velocity at different points in the system while taking into consideration variables like fluid viscosity, turbulence, and pressure gradients. There are many applications for CFD modeling, including planning buildings, establishing industrial processes, designing vehicles, and designing energy systems. The technique allows engineers to virtually test and optimize designs, reducing the need for costly and time-consuming physical testing. Recent advances in computer hardware and software have enabled the simulation of complex fluid flow problems with high accuracy and efficiency, making CFD modeling an increasingly important tool in engineering.
System modeling
The Reynolds-Average Navier Stokes equations and the energy equation have been solved in the simulation, by discretizing the velocity, temperature, and pressure fields by the finite volume method.
38
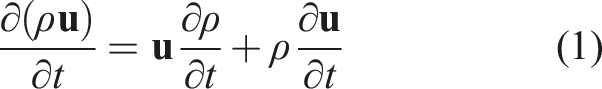
The most used equations are the continuity equations of conservation of momentum and energy. Momentum conservation equation: • ρ designates the density of the fluid (kgm−3)
Energy conservation equation: • E
i
is the total energy at the initial state of the closed system • E
f
is the total energy at the final state of the closed system • Q is the amount of energy lost in the form of heat • W is the work done on the system.

To shorten the calculation time, the conventional k-Epsilon model was used to model the flow in the turbulent regime. The fundamental tenet of this model is that the turbulent viscosity, or the ratio of the Reynolds stress to the average strain rate, is isotropic, meaning that it is constant in all directions. This model’s prominence can be attributed to the fact that it is the most often applied and validated turbulence model, with applications in both industrial and environmental flows. The algorithm utilized for speed-pressure coupling is SIMPLE. To examine indoor air movement, air temperature, and relative humidity, a three-dimensional CFD model of a laying chicken house with a tunnel ventilation system is used as the foundation for the modeling of the poultry house. 39 By contrasting simulation results with field measurements at 30 places, the model is proven to be accurate. The results will also be validated by experimental tests carried out.
Computational fluid dynamics modeling parameters with ANSYS fluent
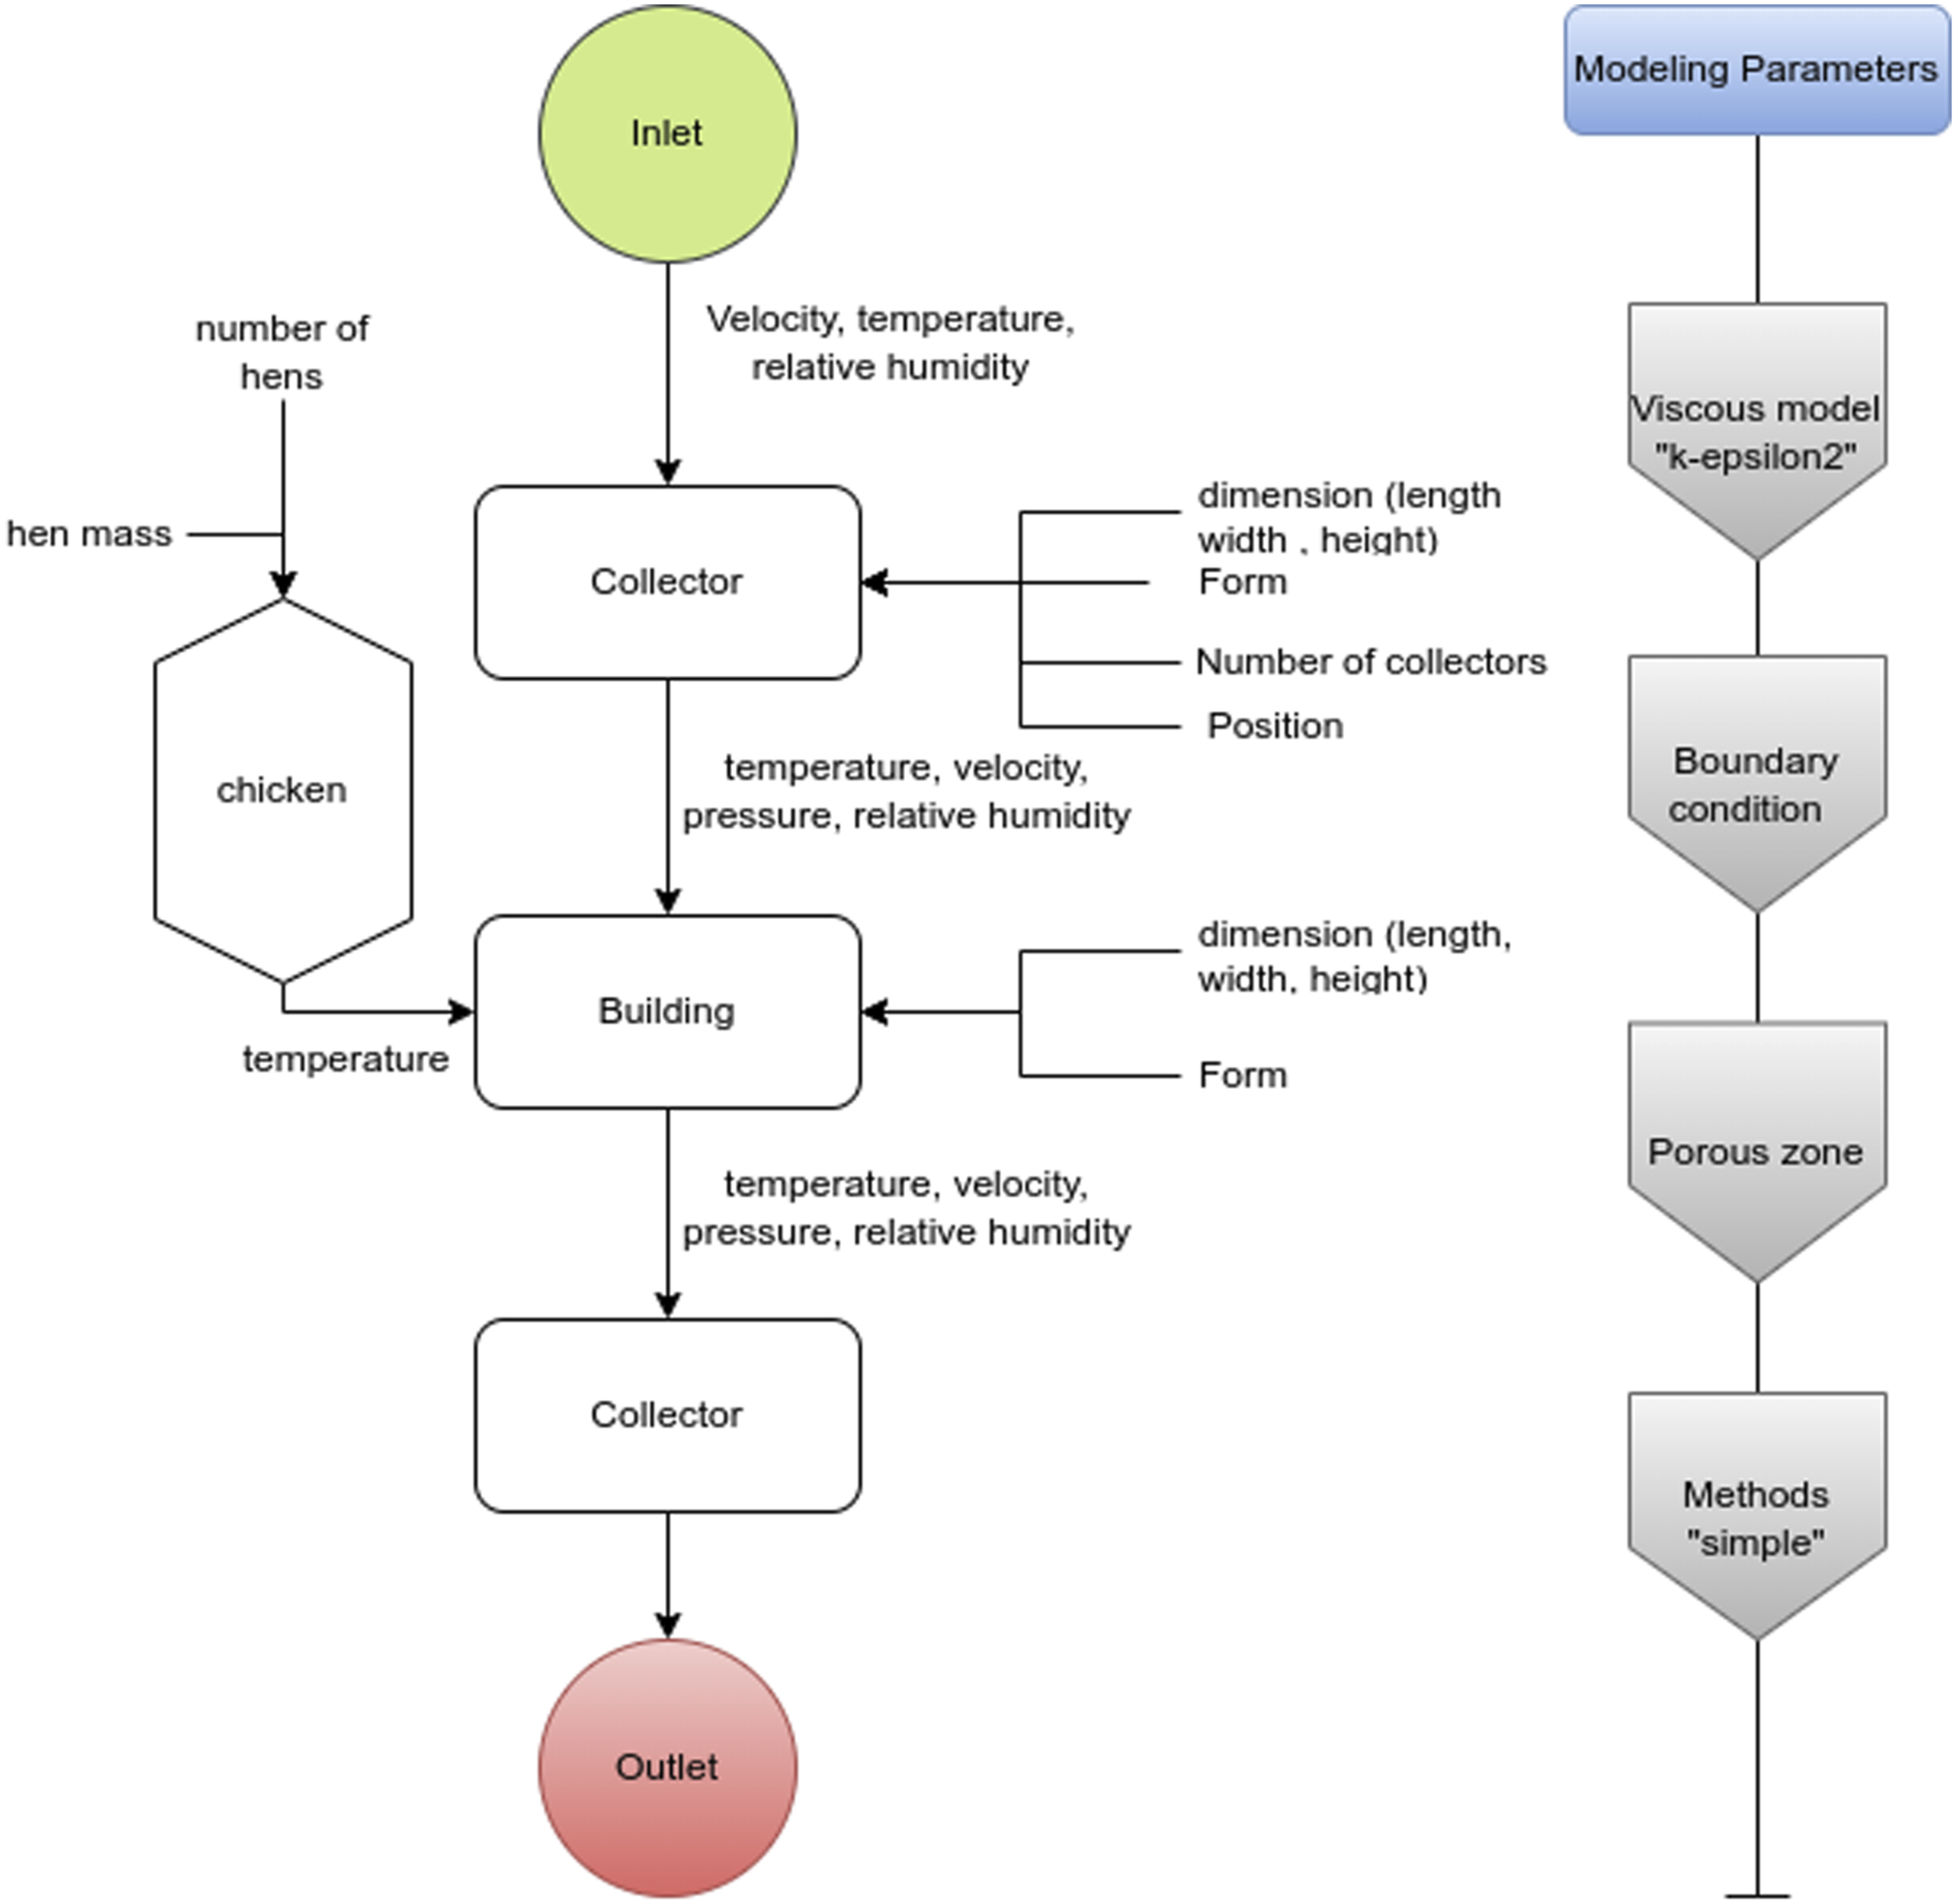
ANSYS Fluent is a widely used software tool for CFD modeling, offering a range of adjustable parameters to simulate various fluid flow problems with accuracy and efficiency. The key parameters in ANSYS Fluent include geometry and mesh, physical properties, boundary conditions, solver settings, and post-processing. The geometry of the system is defined using CAD software, we created an envelope for the geometry, with dimensions of 130 m × 40 m x 20 m, in order to minimize the computational load (Figure 3), and meshed with ANSYS Fluent’s meshing tools, allowing for adjustments in mesh density, quality, and type to optimize simulation accuracy and efficiency. Physical properties of the fluid, such as density, viscosity, and thermal conductivity, must be specified, while boundary conditions define fluid behaviour at system boundaries. ANSYS Fluent also offers various solver options, including steady-state and transient simulations, turbulence models, and multiphase models, with solver settings adjustable to optimize simulation accuracy and efficiency. Finally, post-processing tools in ANSYS Fluent allow for visualization and analysis of simulation results, with parameters such as flow velocity, pressure, temperature, and turbulence intensity all available for visualization and analysis. Figure 4 shows the chart of the methodology used in the model. Schematic drawing of the building with an envelope showing the study area and the coordinates used in this study. Flow chart of the methodology adopted for the cooling system.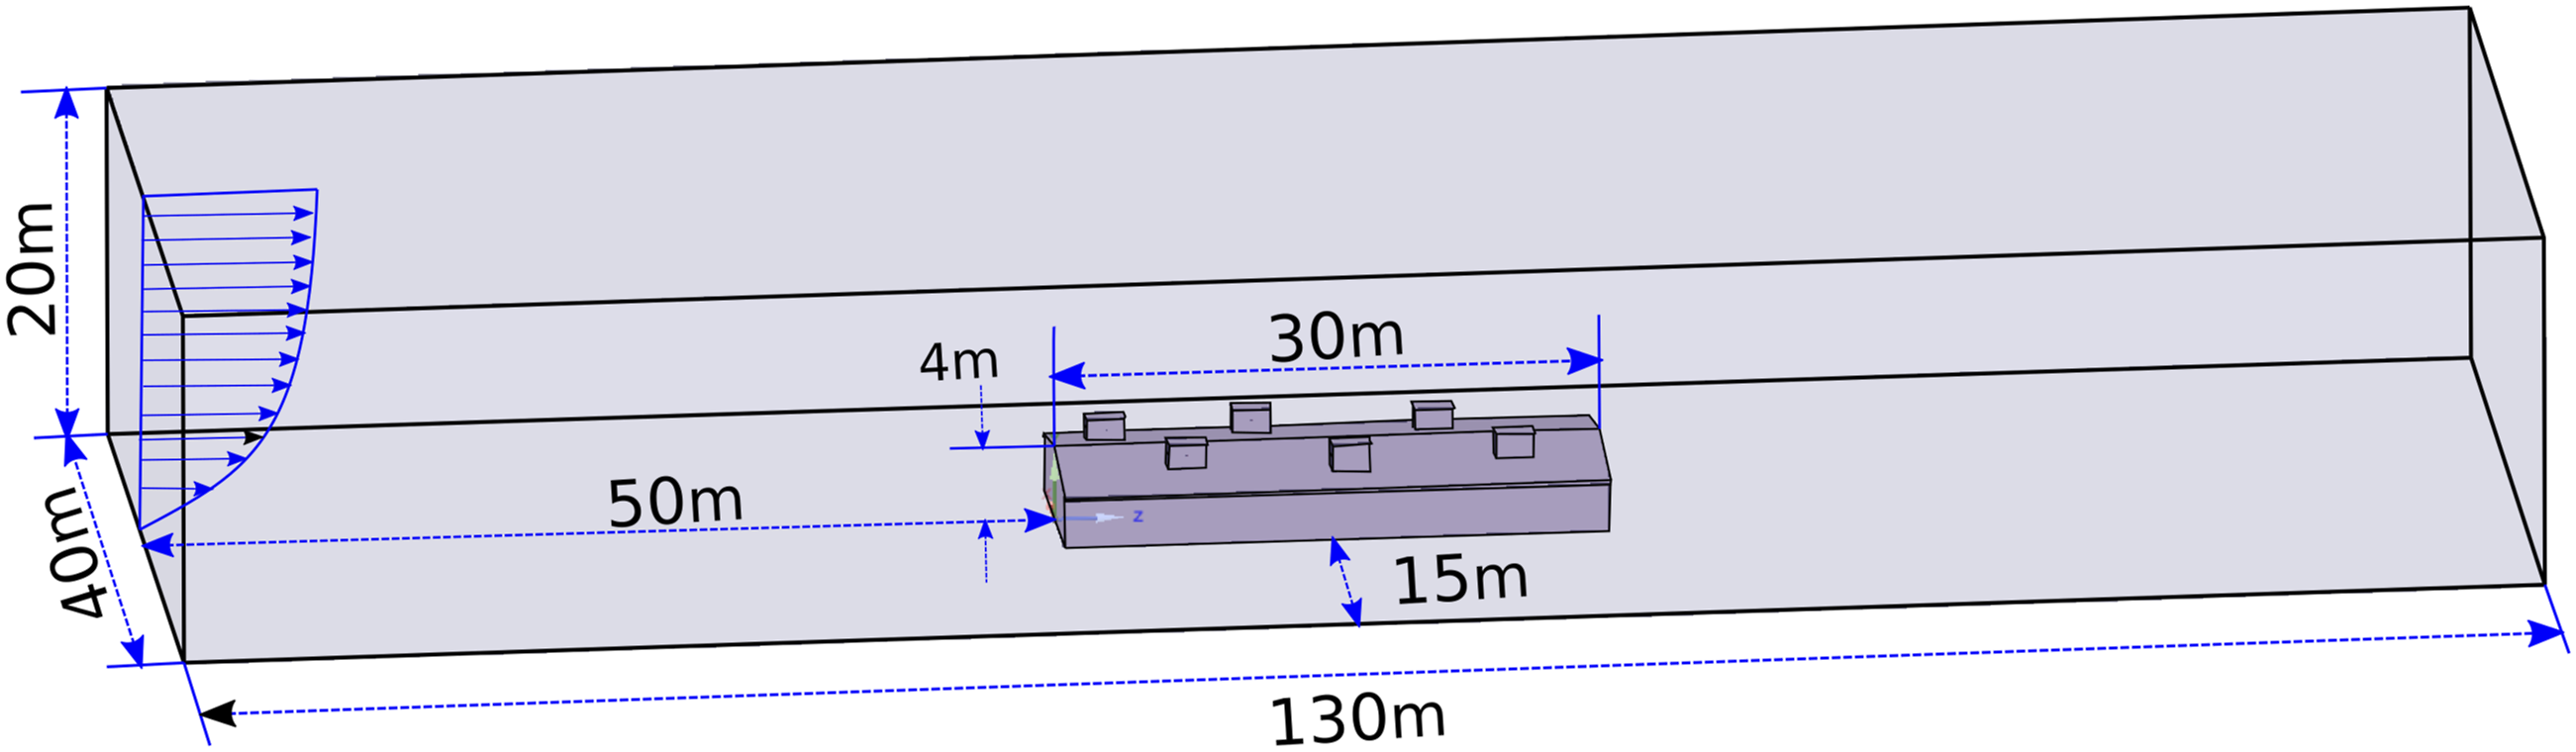
The porous zone
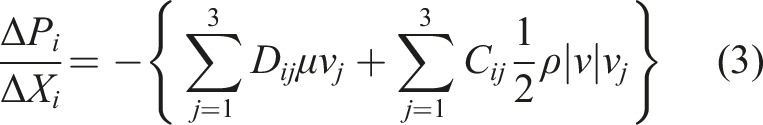
Achieving high precision in modeling a chicken coop by discretizing all the poultry is a daunting task. To circumvent this issue, a more effective approach would be to incorporate a porous medium in the area occupied by the laying hens in the cage, disregarding the feeding and water supply systems. Three parallelepipeds were constructed with dimensions matching the actual three-level cages. The porous medium is composed of two main parts: the loss of viscosity term and the loss of inertia term. To enhance the model’s accuracy, a source term must be included in the Navier-Stokes equations. The coefficients of resistance of viscosity and inertia, which are stated using the following formula,
40
must be precisely calculated in order to produce a robust model: • • |υ|: is the velocity amplitude in ms−1; • D and C: are prescribed matrices for the viscous and inertial resistance coefficients in m−2 and m−1, respectively; • v
j
: is the intake air velocity in the x, y or z directions in ms−1; • μ: is the dynamic viscosity of air in Pa; • ρ: is the air density in kgm−3.
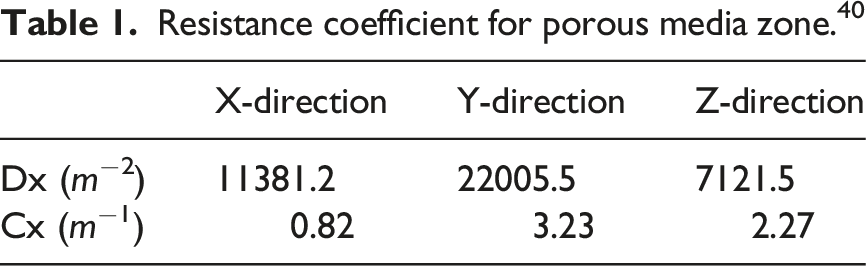
Resistance coefficient for porous media zone. 40
Boundary conditions
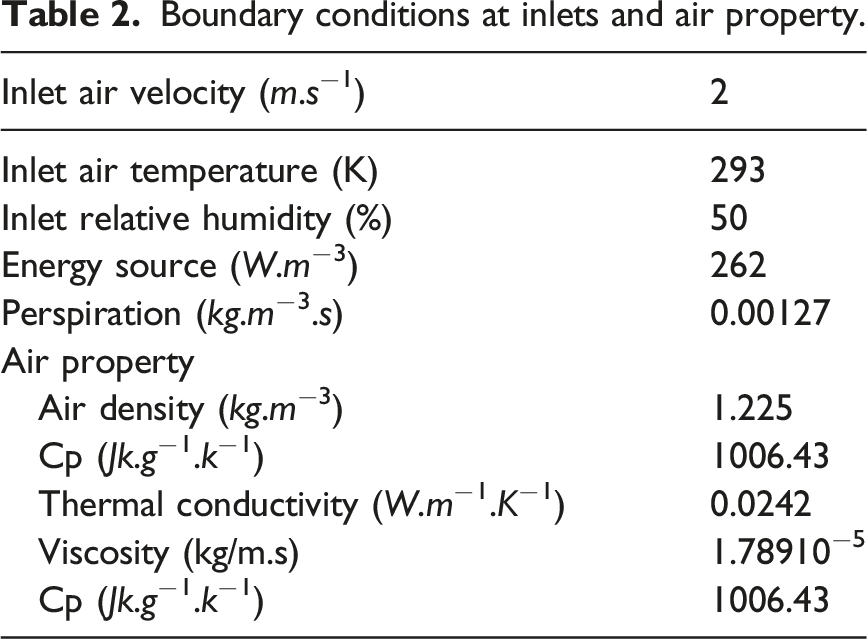
Boundary conditions at inlets and air property.
Results and discussion
This section gives the findings and a discussion of the airflow behaviour and ventilation efficacy within the investigated system based on the CFD simulations performed on the windcatcher model. The investigation examines the effects of various factors on the performance of the windcatcher as well as the validation of the model results through a comparison of CFD results with experimental data.
Validation of the airflow velocity
Six collectors uniformly spaced around the surface of a building model with a slanted roof were used in this study. In order to assess the effectiveness of the model, the same dimensions as the previously studied were maintained. The validation process was based on the validation of the collectors, and the CFD results were used to predict the airflow velocity within the windcatcher of a naturally ventilated poultry house, which were then compared to experimental results. 32
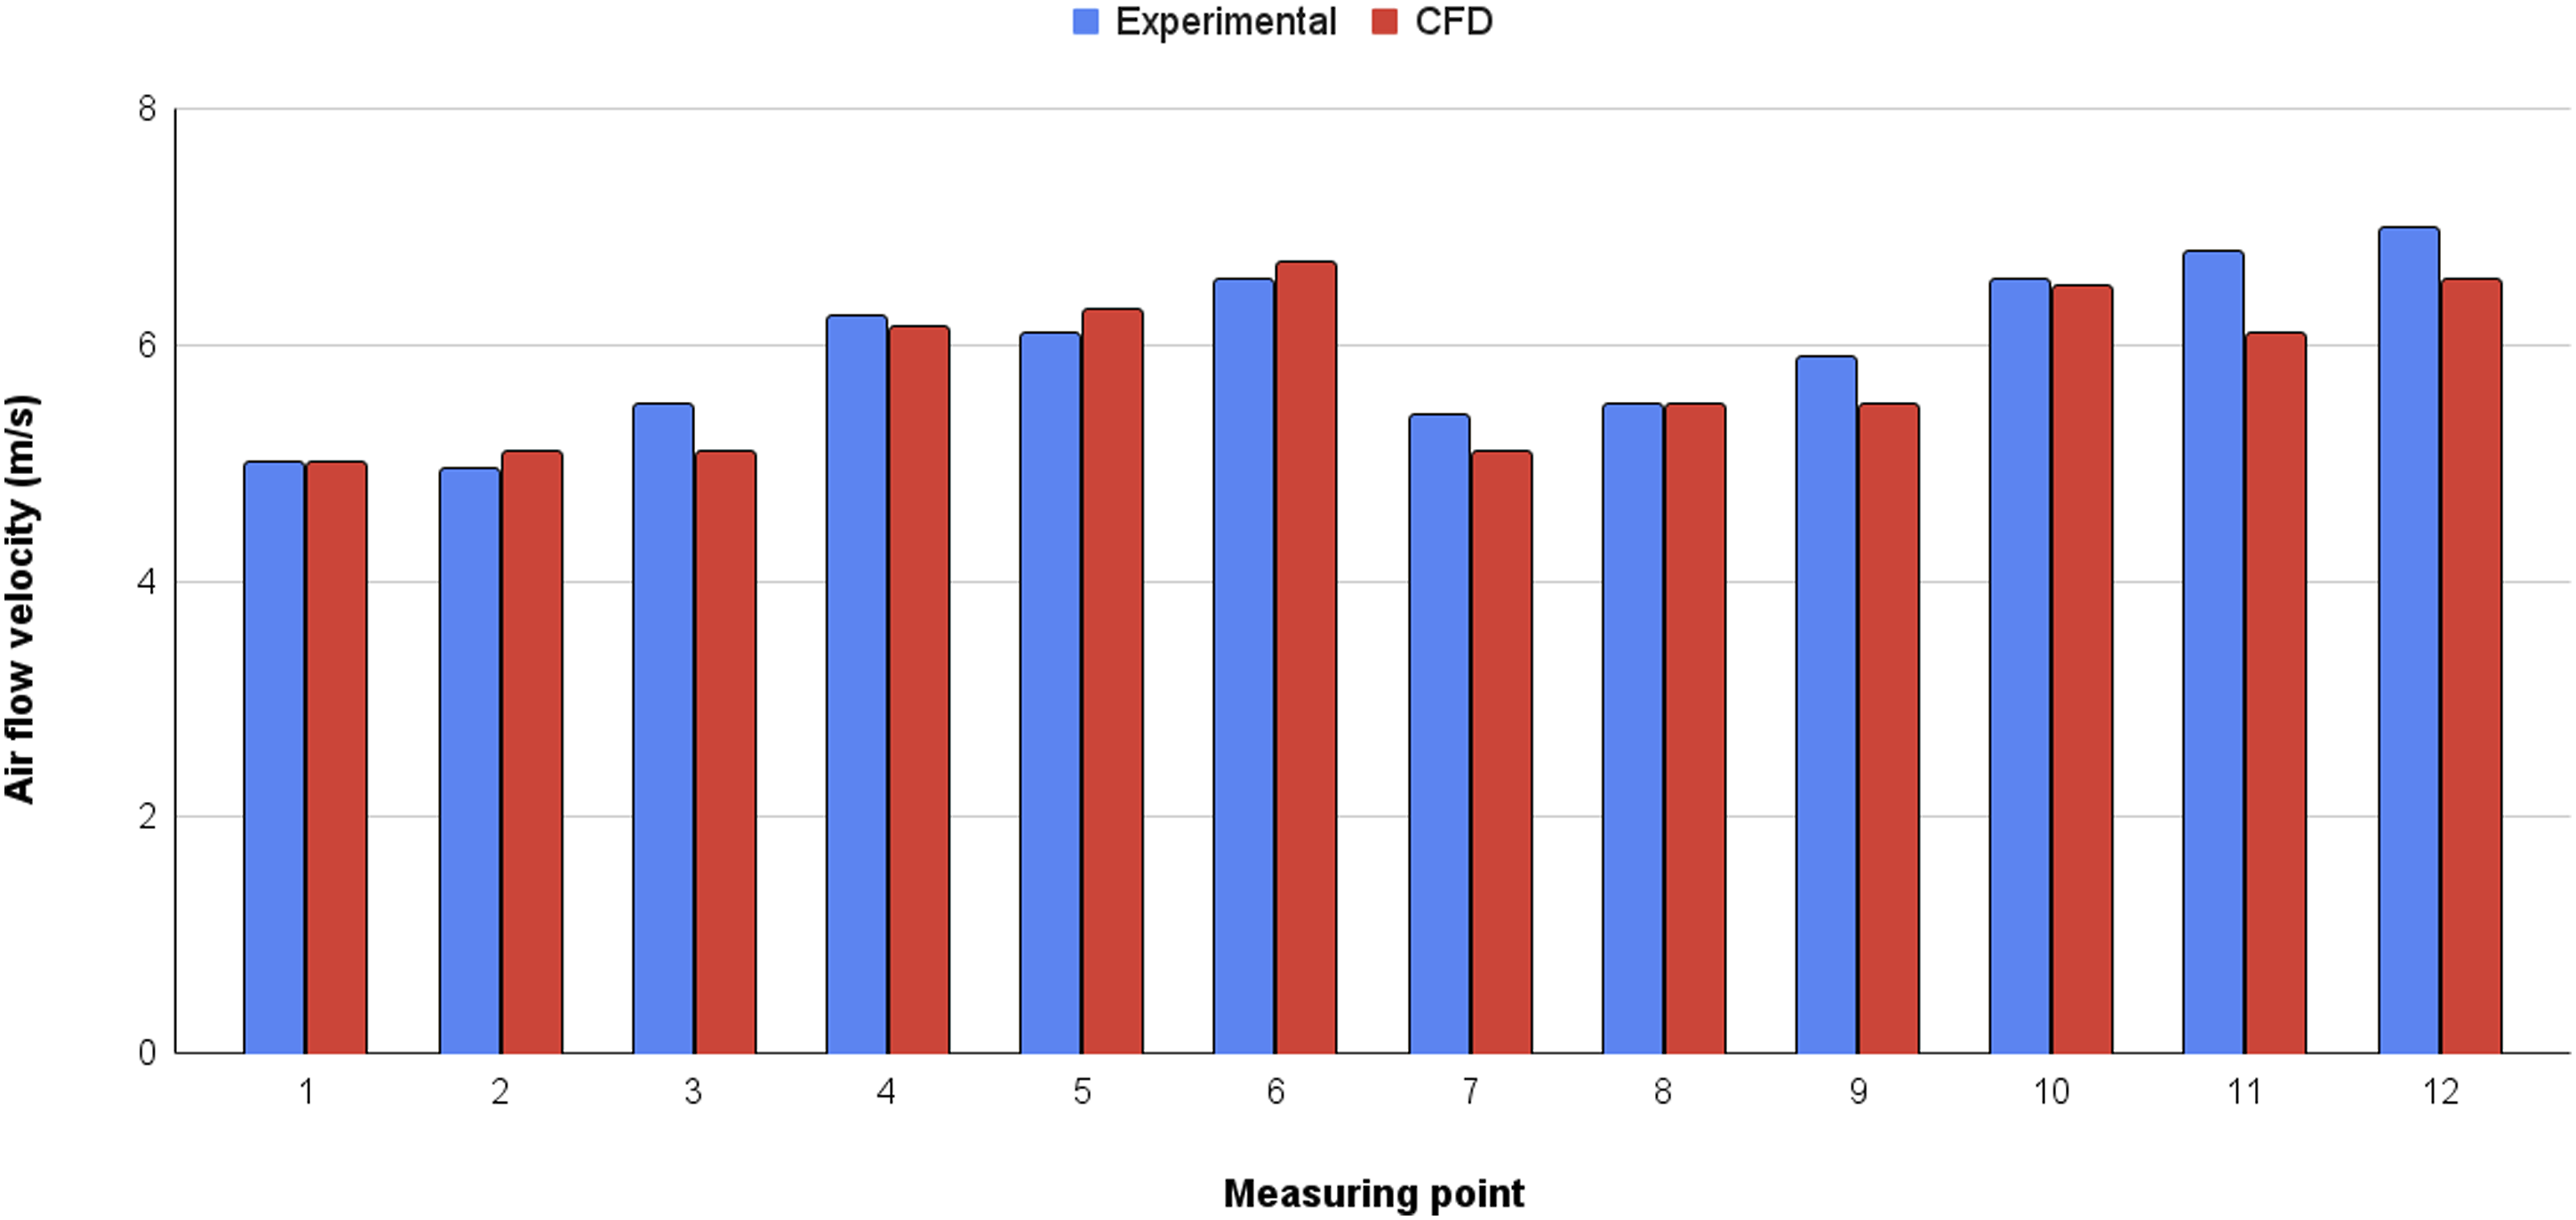
Figure 5 illustrates a double-sided windcatcher positioned on a building, featuring an input and output channel measuring 1.1 m × 1.5 m x 2.3 m in size, separated by a curved internal partition with a thickness of 0.1 m. The air inlet openings are also indicated in the Figure, measuring 1 m × 1 m. When the initial air speed was set at 10 m/s, the windcatcher model produced results that were in close proximity to the experimental measurements. Figure 6 illustrates the 12 points where the velocity was measured (We used the measurement points, which consist of 6 points at the inlet of the collector and 6 points at the outlet of the collector Figure 5), and the root-mean-square error (RMSE),
41
was calculated to be 0.305. Both the numerical modeling and the experimental study employed identical initial conditions and parameters. Despite differences in the design of the windcatchers openings, the present results indicate a strong agreement between the numerical simulations and the experimental data.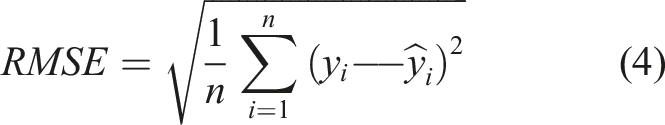
Dimensions of the windcatcher model integrated into the roof of the building. Comparison between CFD and experimental measurement of the airflow velocity inside the windcatcher opening validation of the airflow velocity inside the building.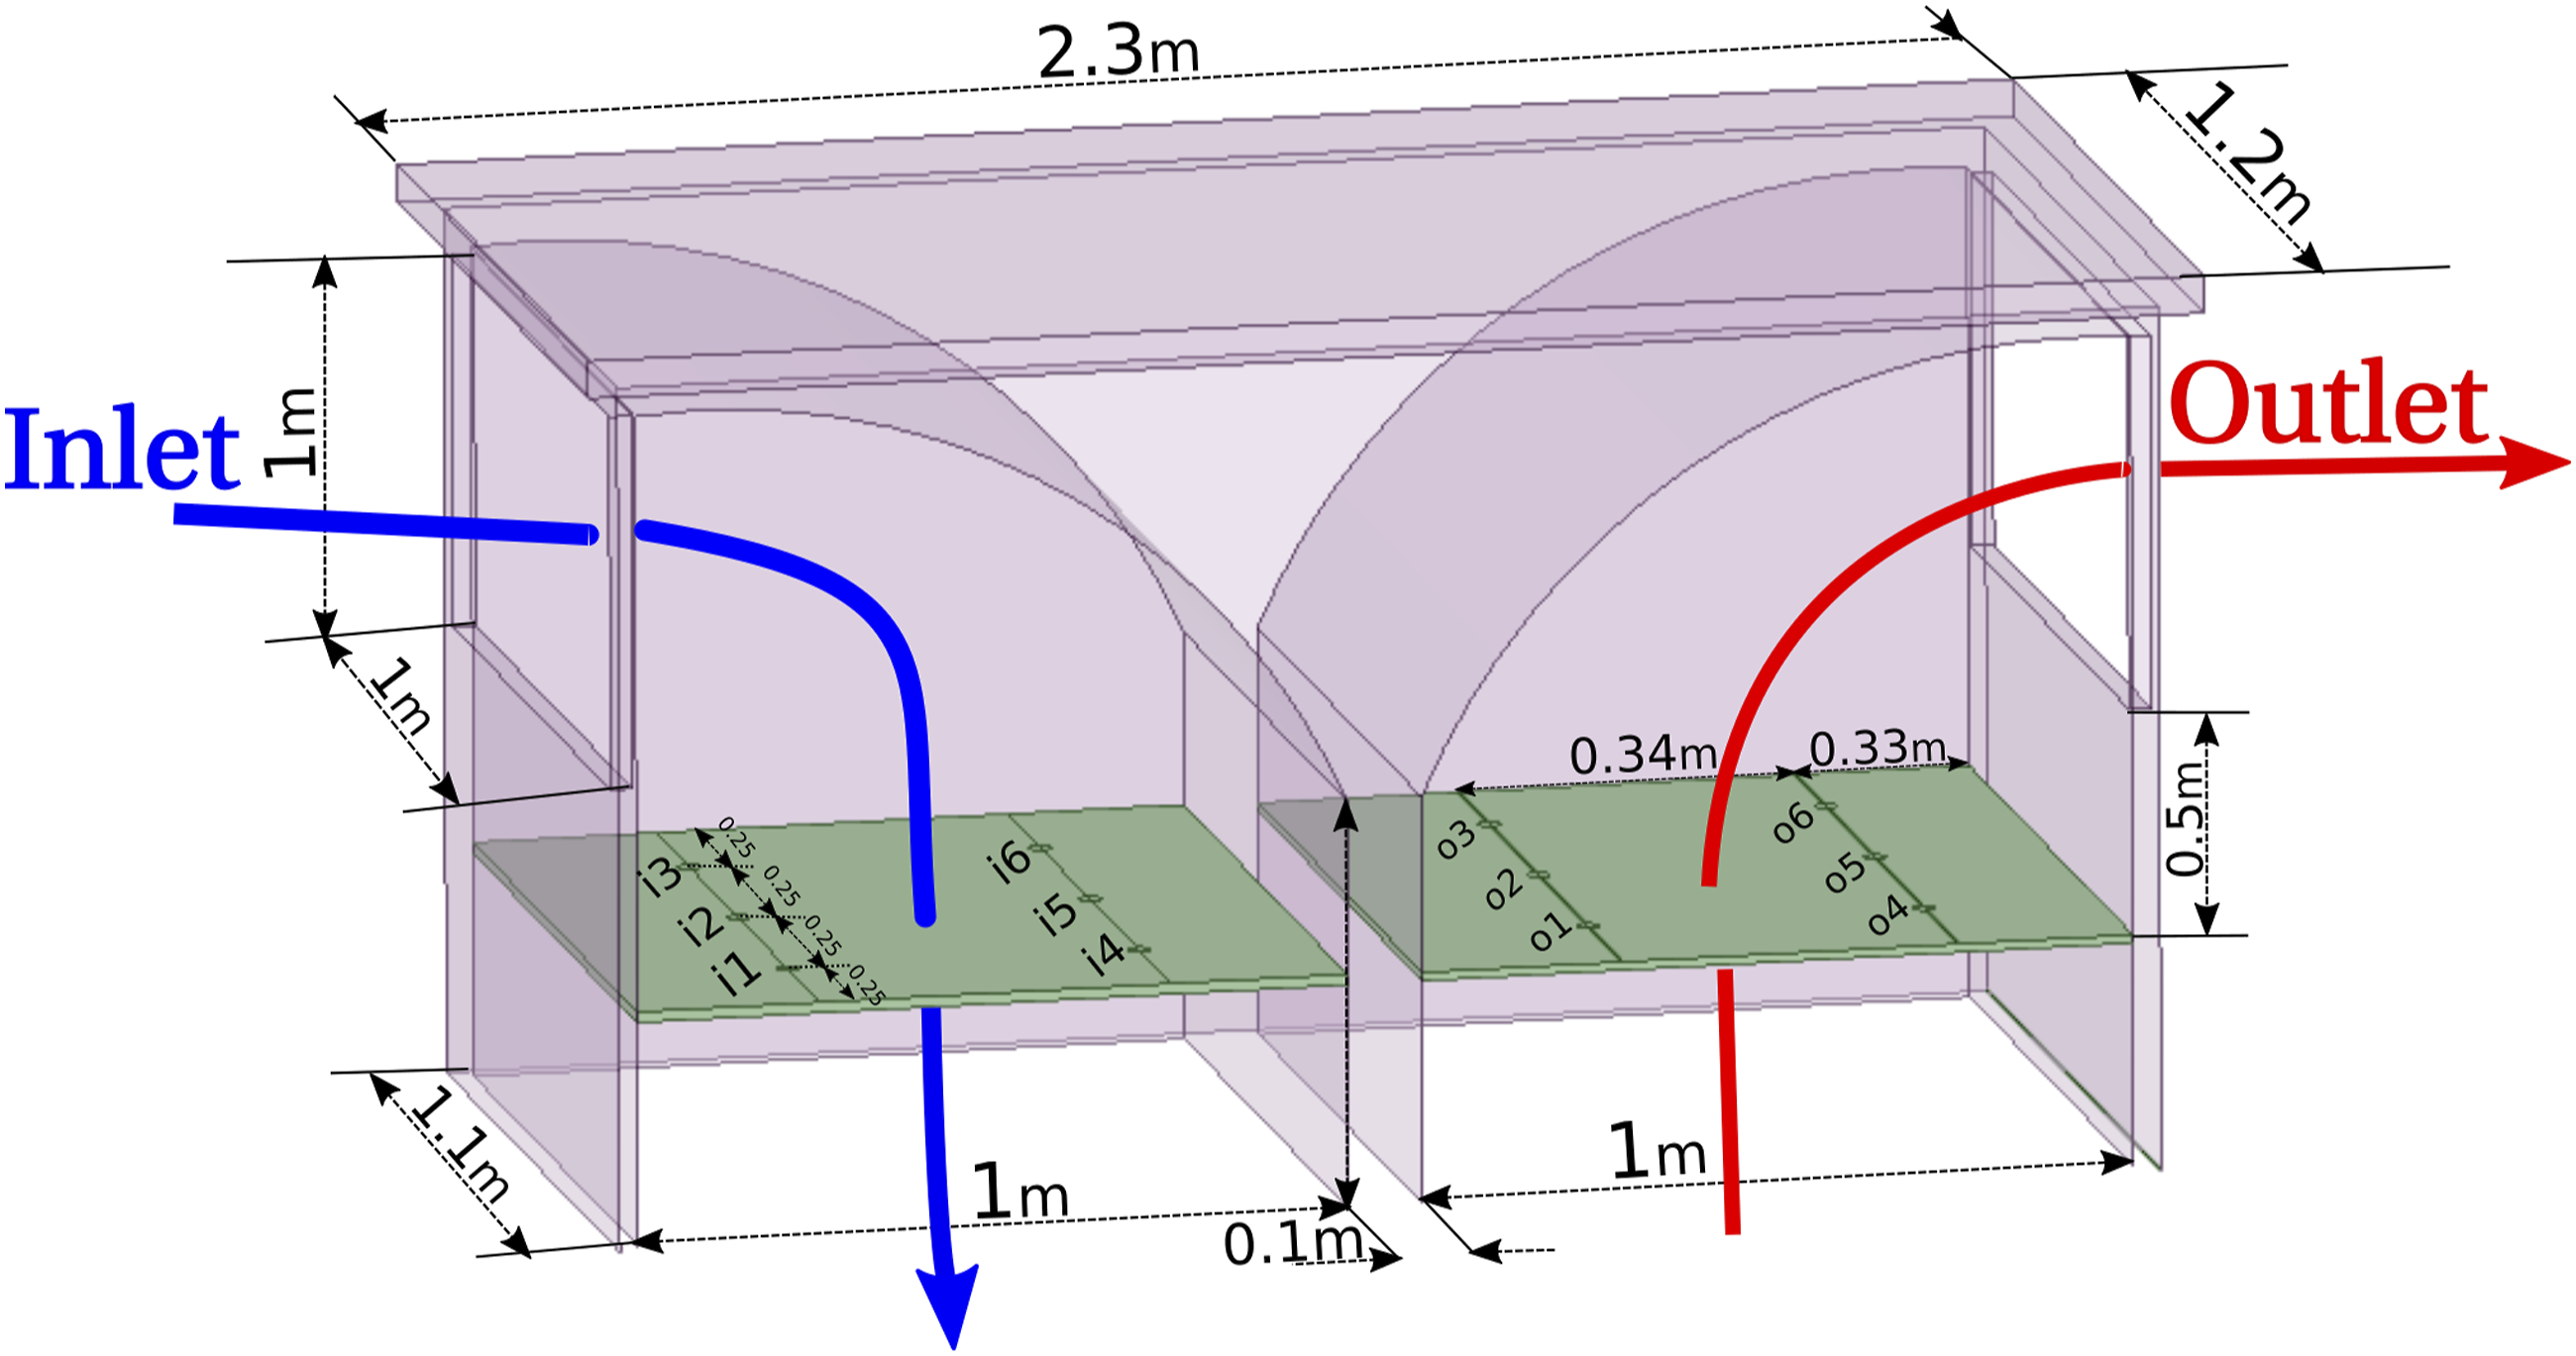
In the present study, a comparative analysis of the CFD section is conducted under the same conditions and sizing as that published in the literature.
24
The resulting air velocity contours in a vertical section plane throughout the computational domain were found to be similar (Figure 7), indicating the reliability of our findings. (a) Airflow contour in a building for the windcatcher model of the present study at a wind speed of 2.5 m/s, (b) Airflow contour in a building for the windcatcher model of Nejat et al
32
at a wind speed of 2.5 m/s. Validation of the airflow contour in a building for the windcatcher model of the present study with the published work
32
at a wind speed of 2.5 m/s.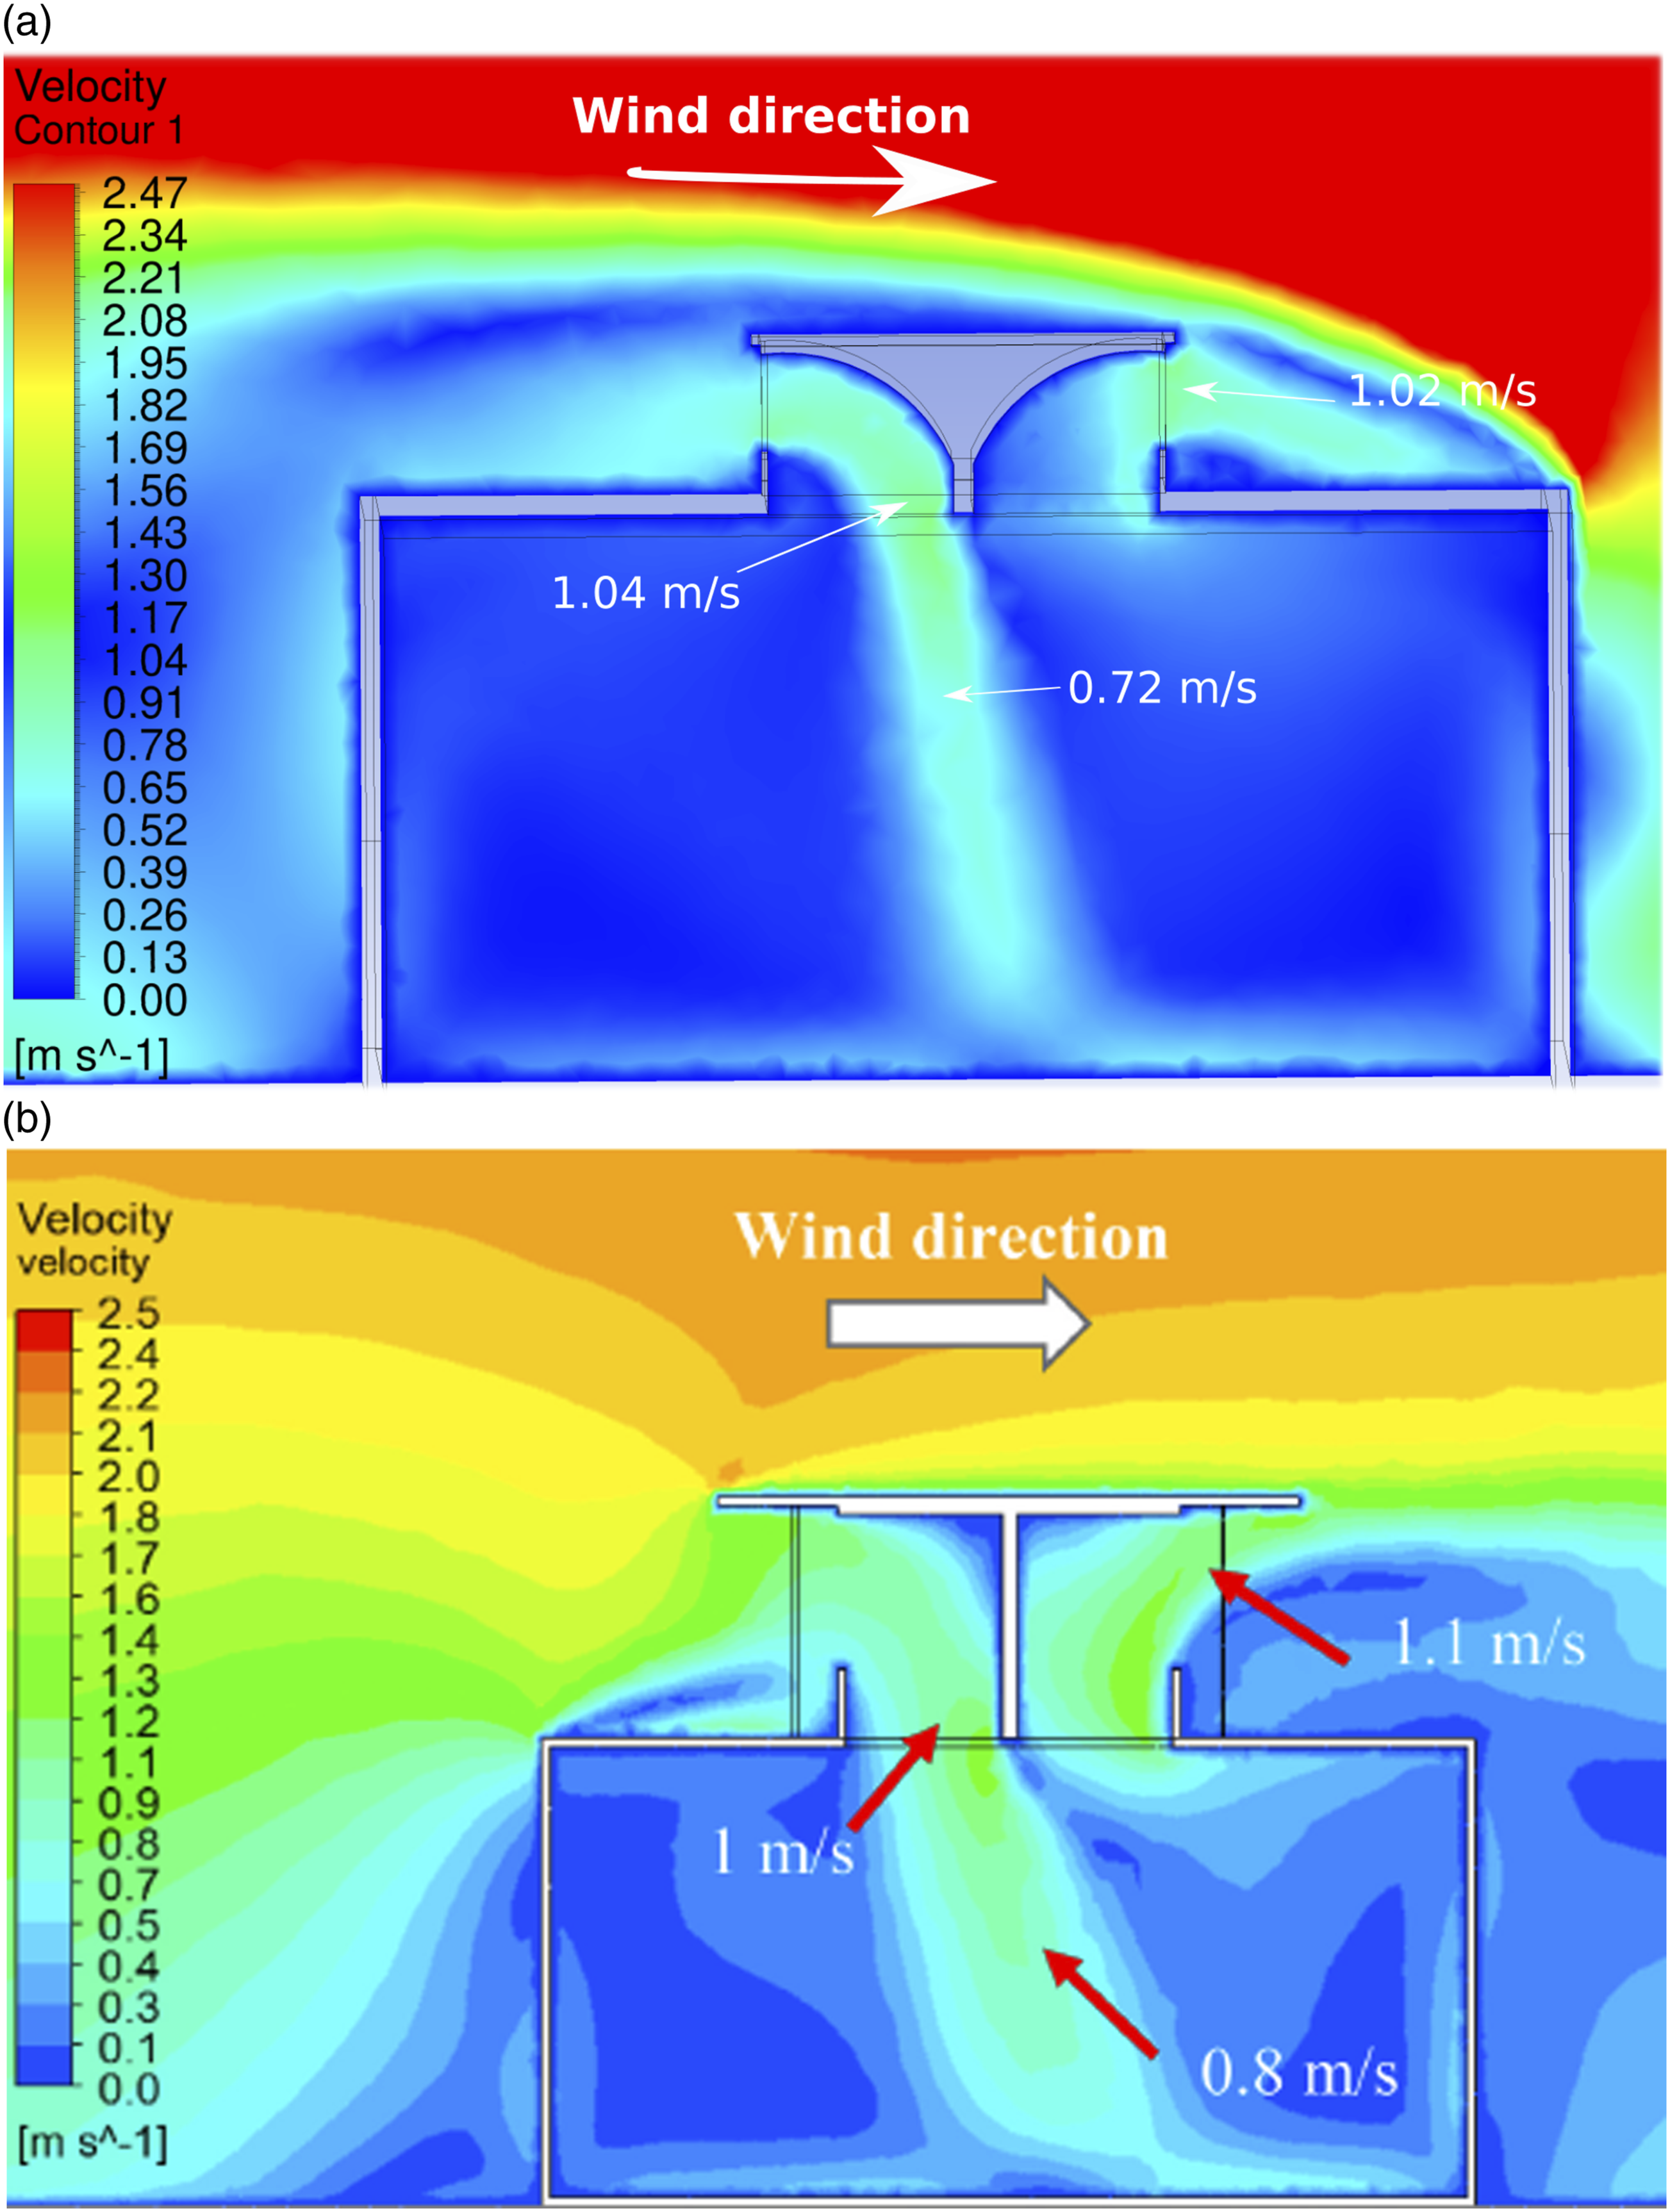
The presence of a boundary layer caused by ground surface friction led to a gradual reduction in the wind profile towards the ground, as depicted in Figure 8. In contrast to published results,
32
the present model indicated that the airflow rate at the wind collector entrance was around 1.0 m/s, while it was approximately 1 m/s in their study. The air that entered the room was directed towards the floor and dispersed in all directions. When comparing the air speed inside the space below the collector, the present model produced values of 0.7 m/s, which was very close to the 0.8 m/s previously predicted by published literature.
32
Both models identified a zone of turbulence with relatively low air speed on either side under the wind collector, resulting in an air extraction rate of 1.02 m/s. (a)The airflow in a building for the wind sensor model of the study by Nejat et al
32
at a wind speed of 2.5 m/s, (b) The airflow in a building for the windcatcher model of the present study at a wind speed of 2.5 m/s. Validation of the airflow in a building for the windcatcher model of the present study with the published results in literature
32
at a wind speed of 2.5 m/s.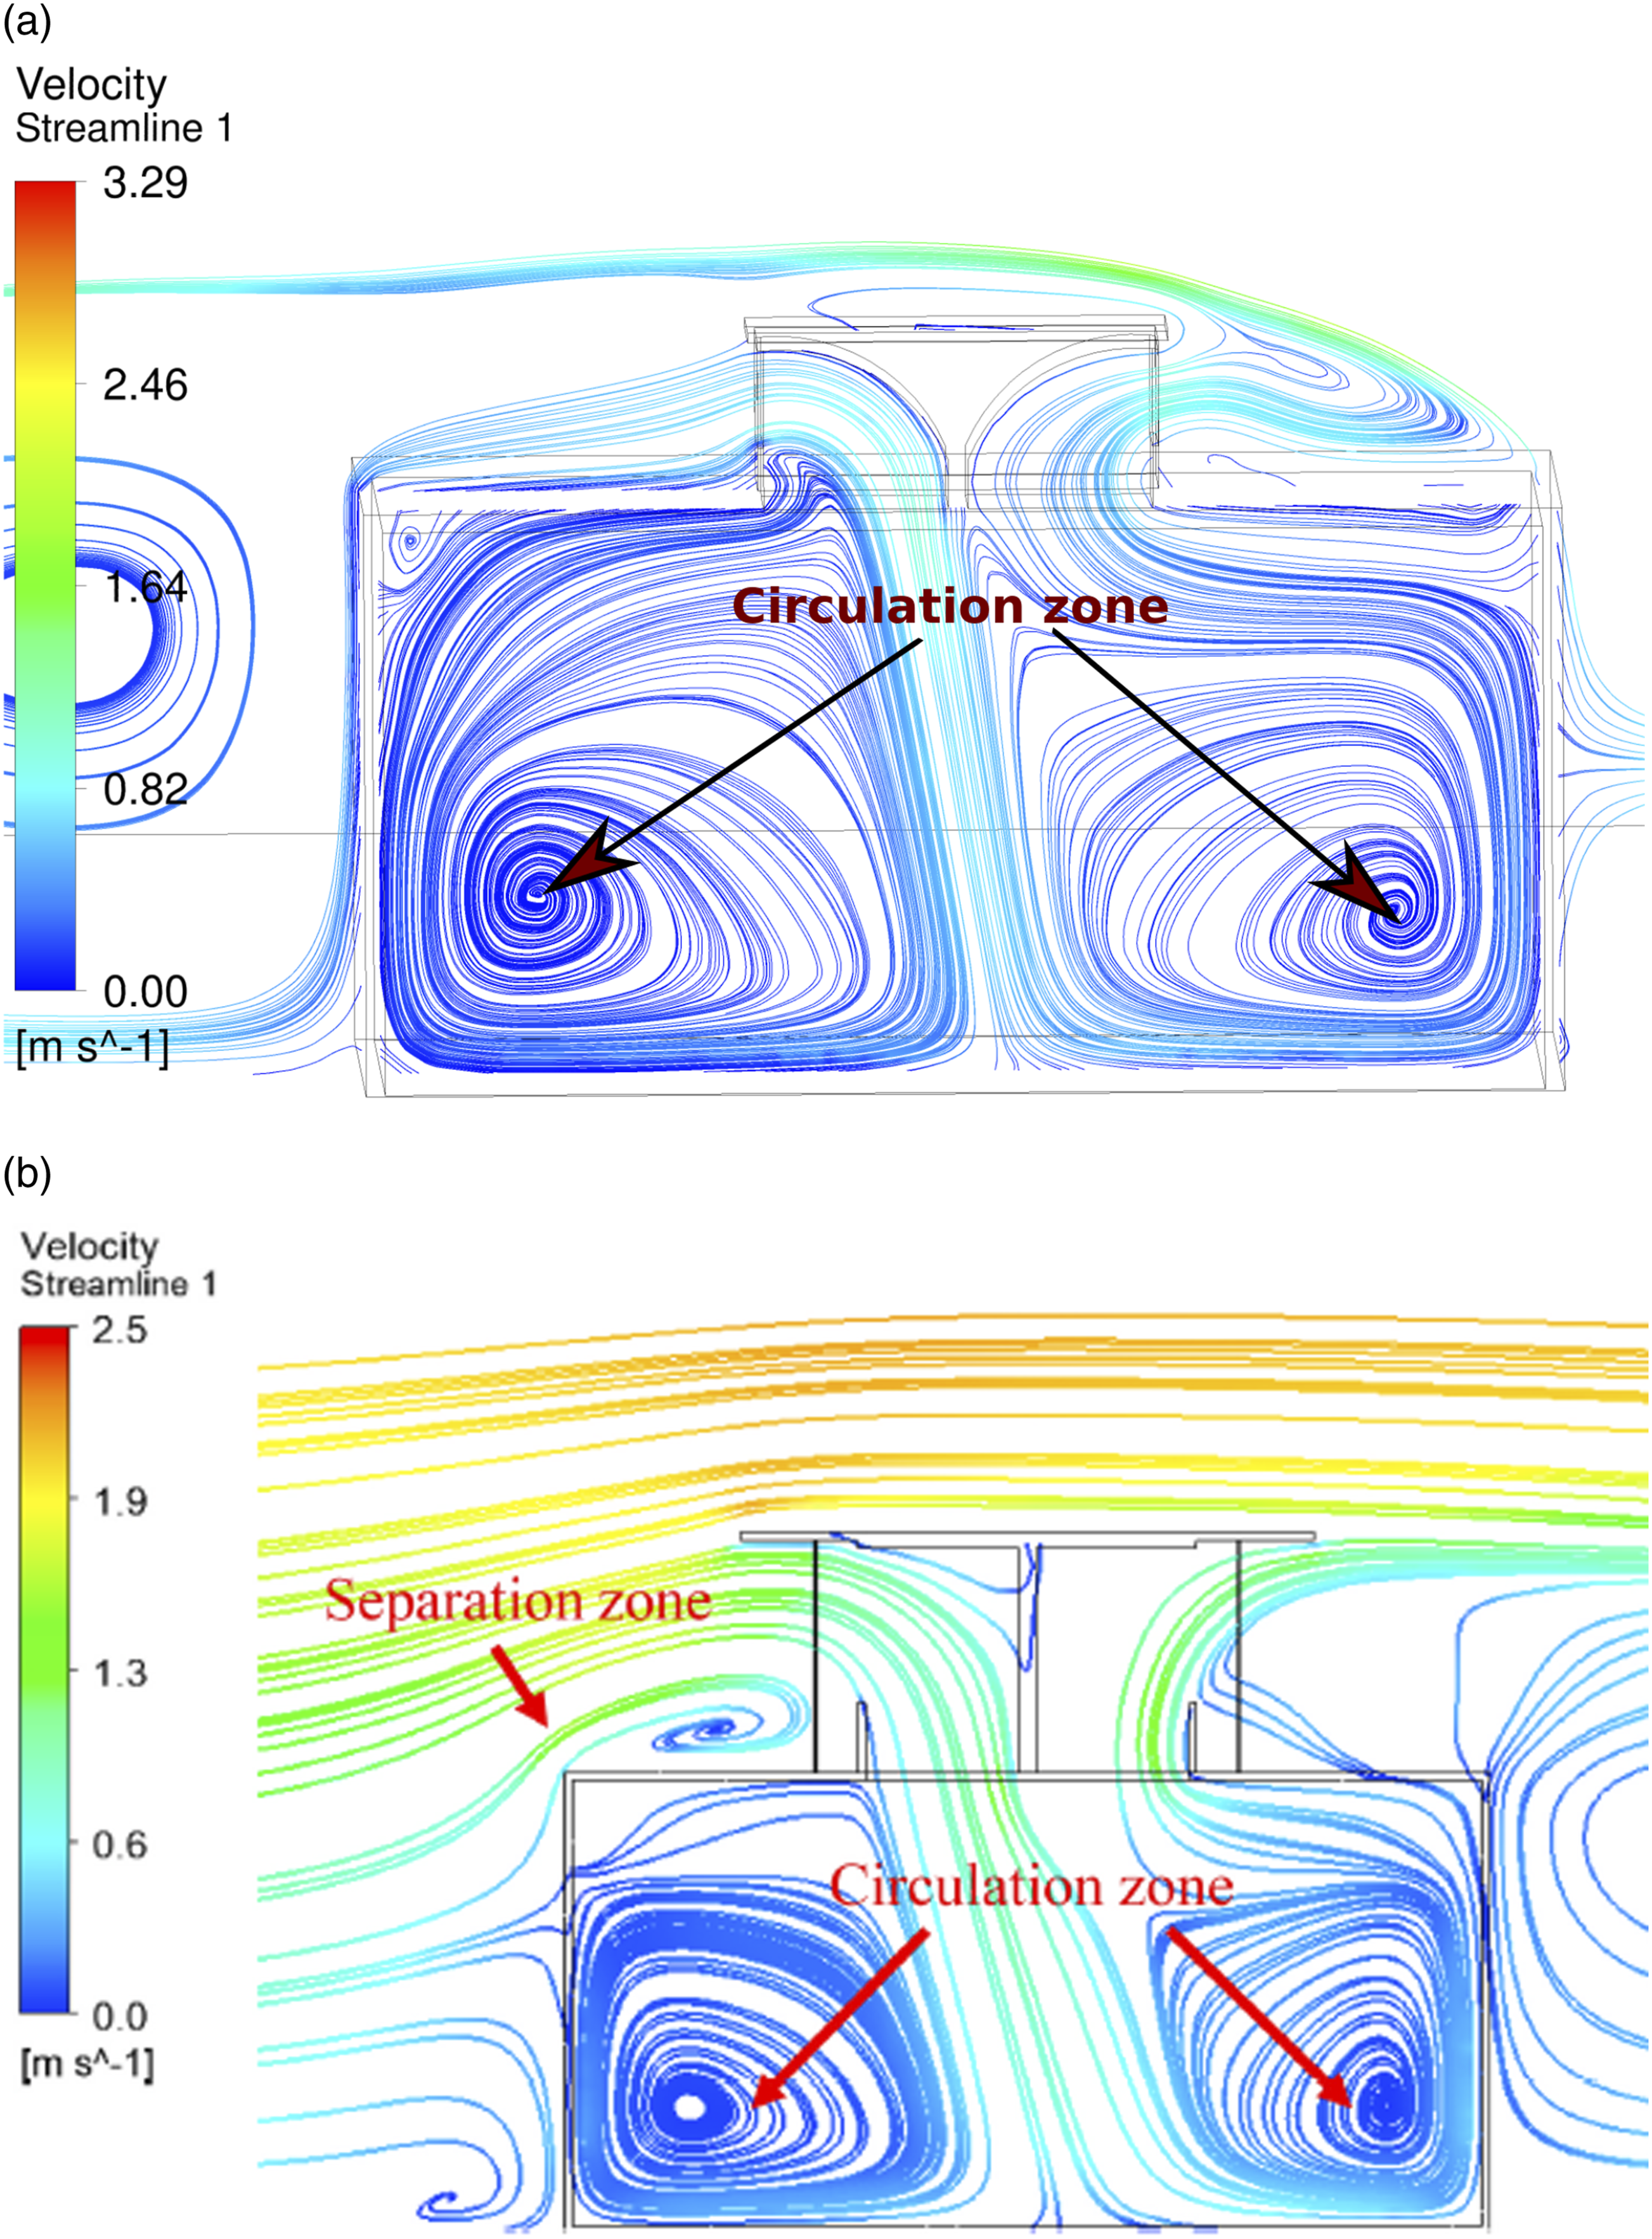
The air velocity in the building
Figure 9 demonstrates a distribution of collectors, resulting in a uniform airflow throughout the building with minimal turbulence (ranging from 0 m/s to 0.8 m/s) in the area occupied by the animals. A comparison between two different inlet air velocities reveals variations in the airflow within the barn. Effect of turbulence inside poultry cages for an air flow of 2 m/s.
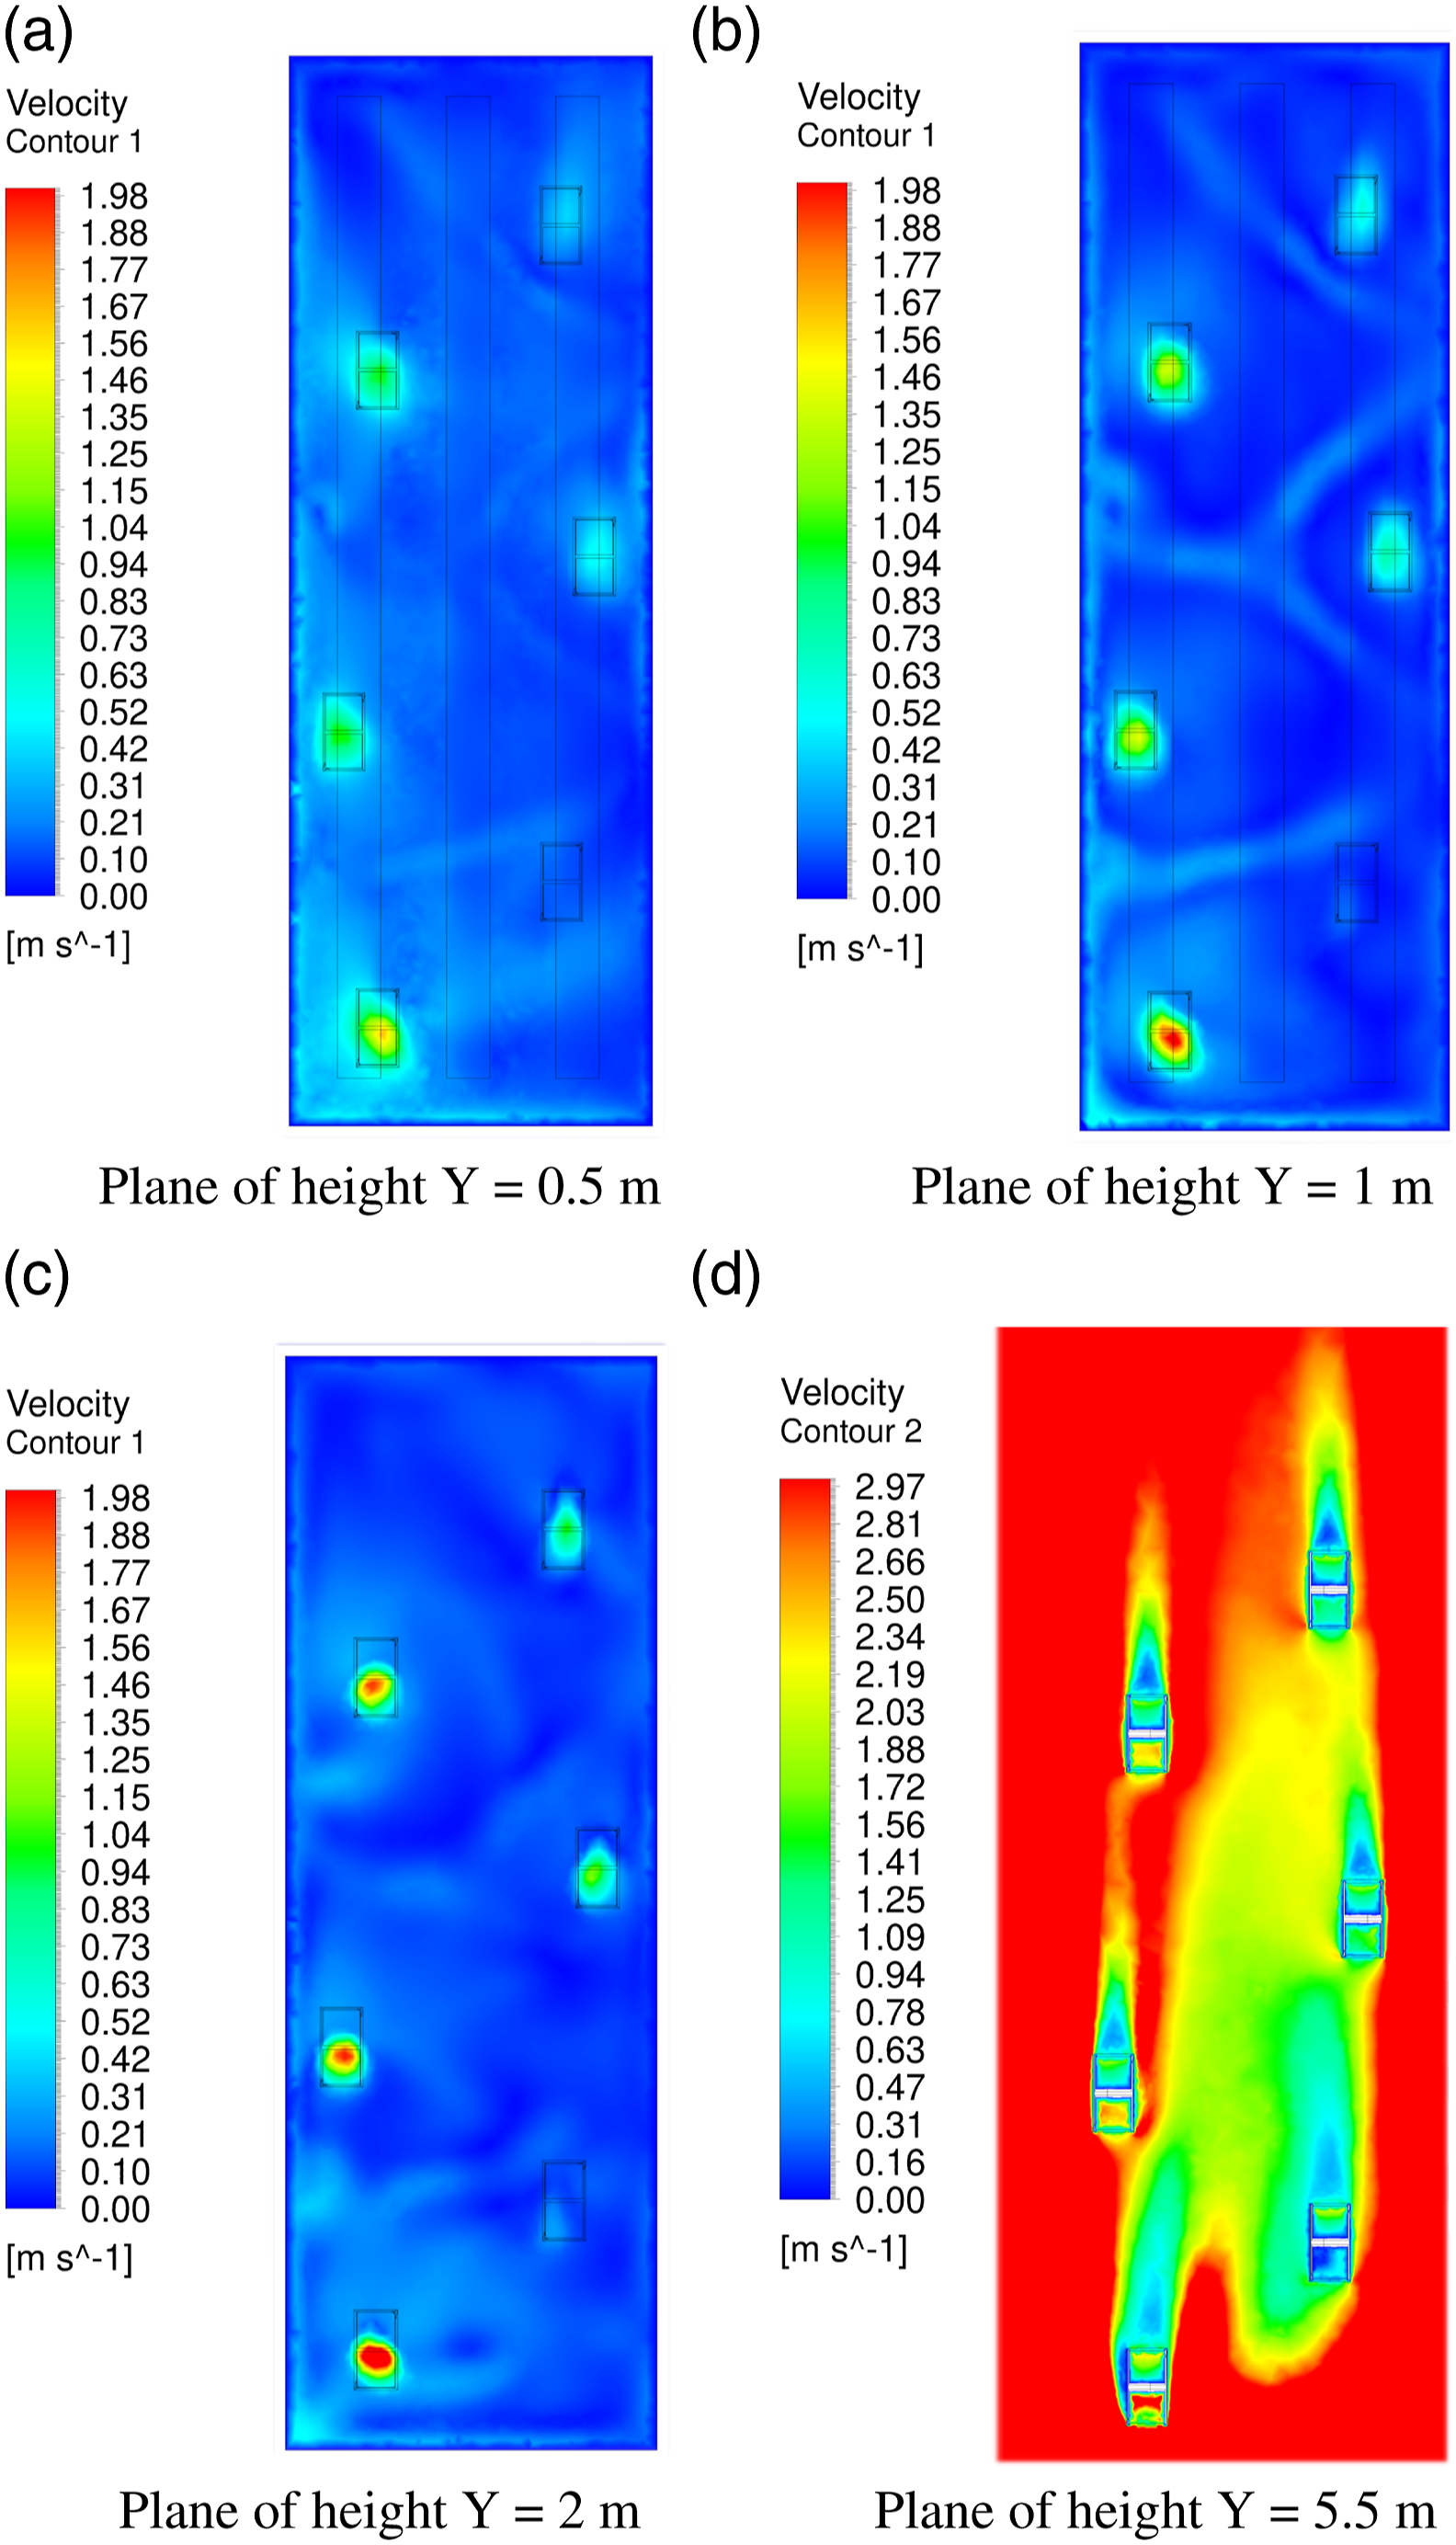
With an entry air speed of 2 m/s (7.2 km/h), as shown in Figure 10, the internal air speed ranges from 0.04 m/s to 0.7 m/s, while an outside speed of 5 m/s (18 km/h), as shown in Figure 11, results in an internal speed varying from 0.10 m/s to 1.98 m/s. Figure 10 depicts the air speed variations at different heights of the building. At the level of the cages (Y axis, y = 0.5), a consistent airflow homogeneity is observed, ranging from 0 m/s to 0.59 m/s, ensuring efficient ventilation (adequate airflow and favorable temperature for poultry). As the height increases to 2 m, the air speed varies from 0 m/s to 0.70 m/s. This study confirms that the ventilation remains consistent throughout the building’s height, with stable wind speeds recorded at different altitudes (0.5 m, 1 m, and 1.5 m), averaging between 0.11 m/s and 0.15 m/s. Beneath the collector, the air speed is higher, while the rest of the surface exhibits less uniformity compared to the 0.5 m altitude. Outside the building at an altitude of 5.5 m, the air speed varies from 0 m/s up to 2 m/s. Air velocity in a poultry house at different height (0.5 m, 1 m, 2 m, 5.5 m) for an entry speed of 2 m/s. Air velocity in a poultry house at different heights (0.5 m, 1 m, 2 m, 5.5 m) for an entry speed of 5 m/s.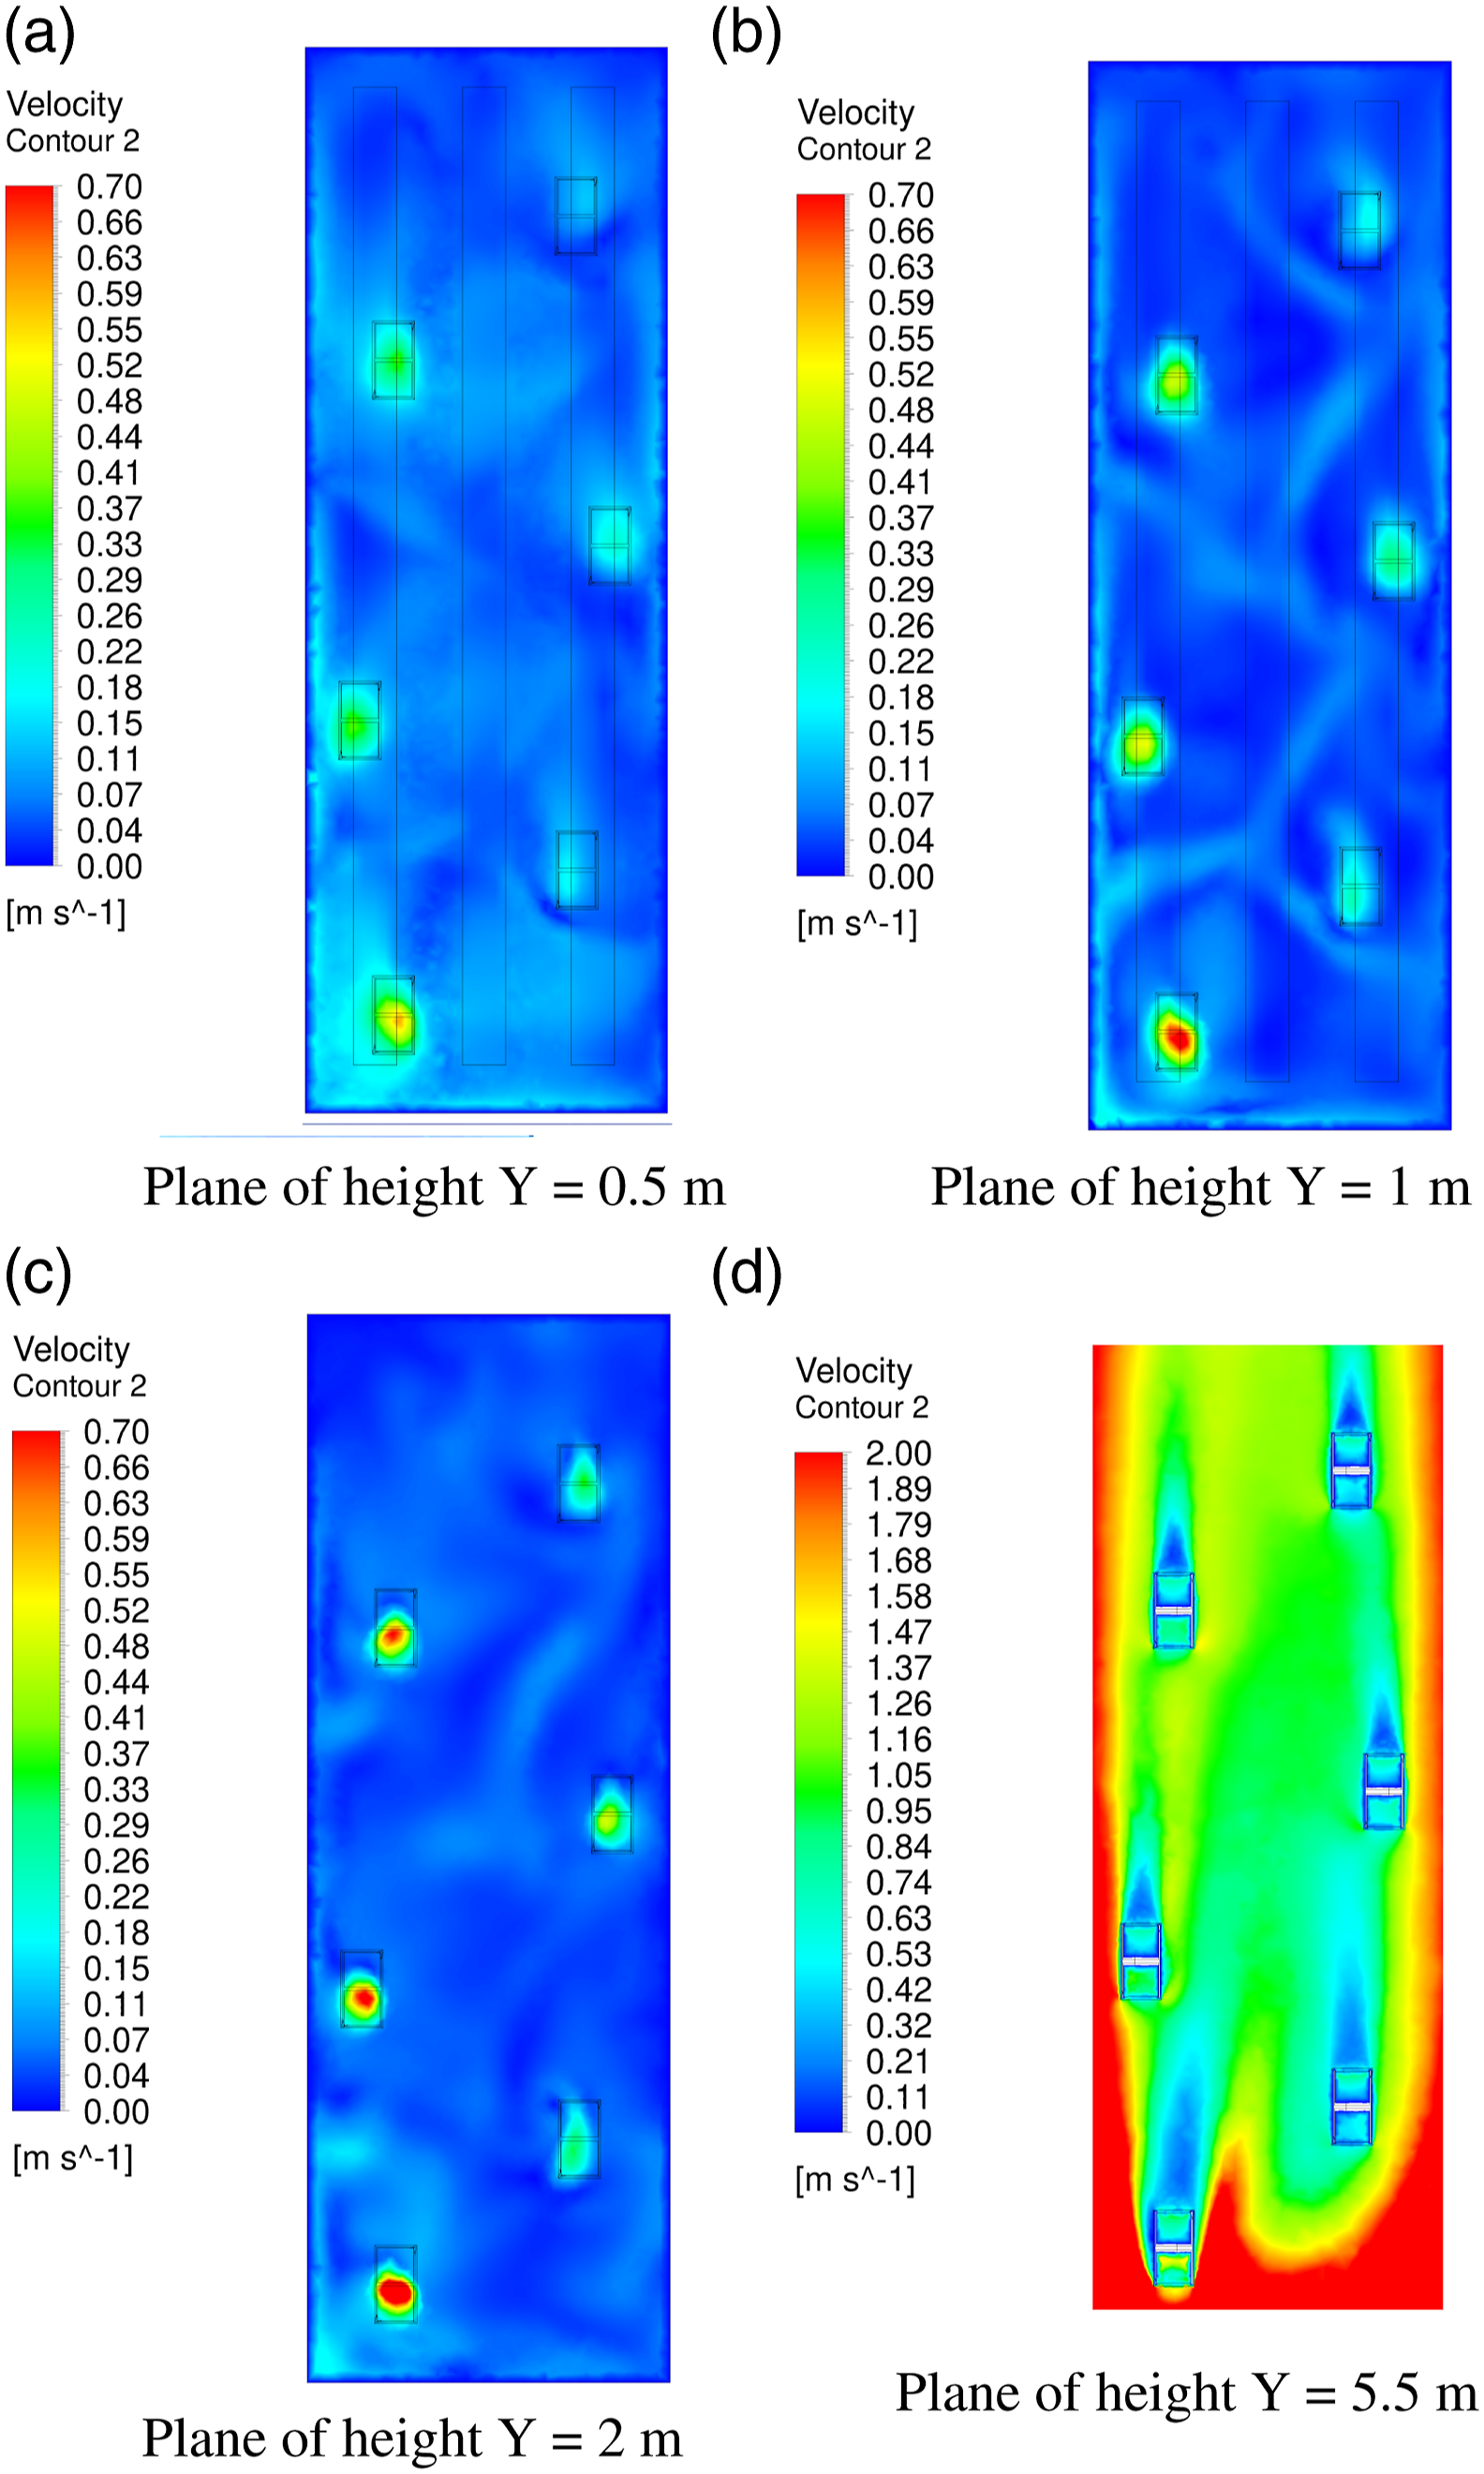
The temperature in the building
Figure 12 illustrates the temperature distribution in the cages and the floor of the building, showcasing a well-distributed temperature range between 19.85°C and 21.85°C. These temperature levels fall within the comfort range (20°C to 27°C) for poultry. This uniform temperature distribution can be attributed to the effective ventilation provided by the collectors positioned throughout the building, facilitating better air circulation. These findings confirm that the ventilation design, utilizing wind collectors with the specified geometric characteristics as described in the modeling section, creates favorable ventilation conditions and contributes to maintaining a stable temperature inside the building. This result will be further analyzed and compared with other ventilation models in the subsequent section. Contour distribution of the temperature at the cages in the building.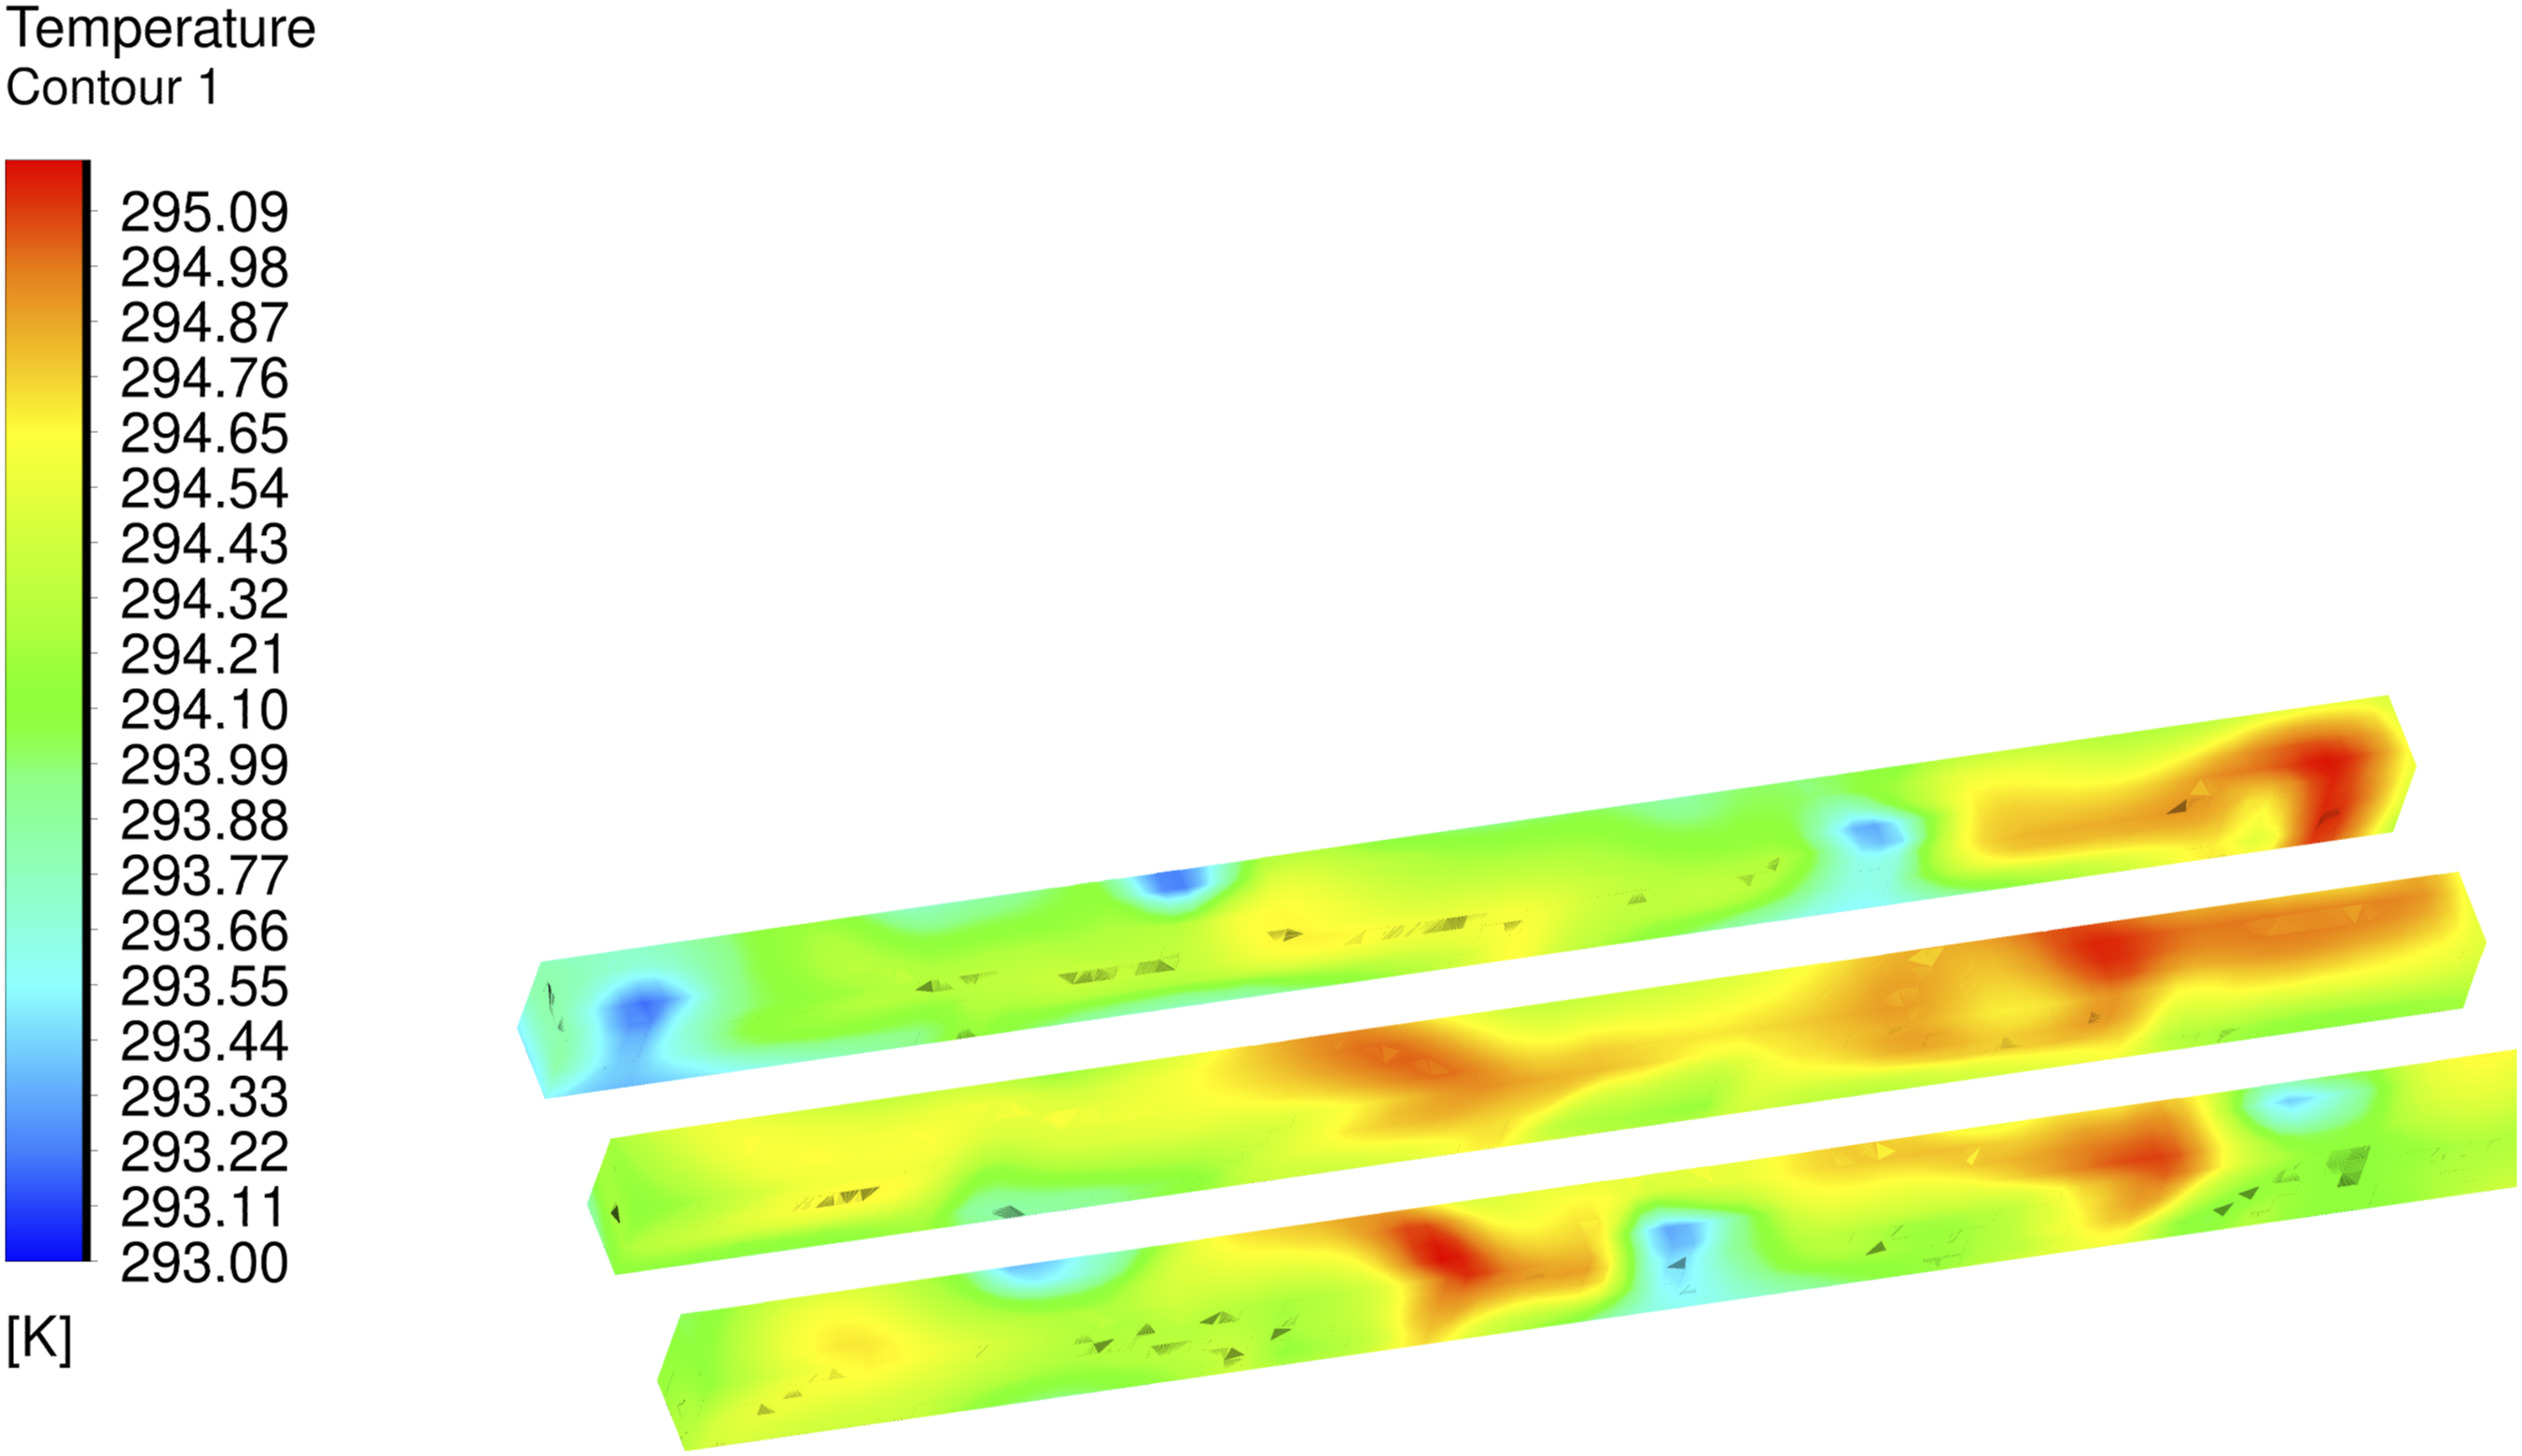
Higher than desired peaks in RH were observed in the simulation and this may require interventions to improve local air circulation and reduce RH peaks to within a more acceptable comfort range (Figure 13). Our primary aim in this investigation was to investigate air velocity distribution and overall effectiveness of top-down natural ventilation. Optimisation of RH levels may require some trade-off in the form of elevated velocity levels, additional window-based ventilation,
42
or possibly attention to stocking levels and cage layout. Contour distribution of the relative humidity at the cages in the building.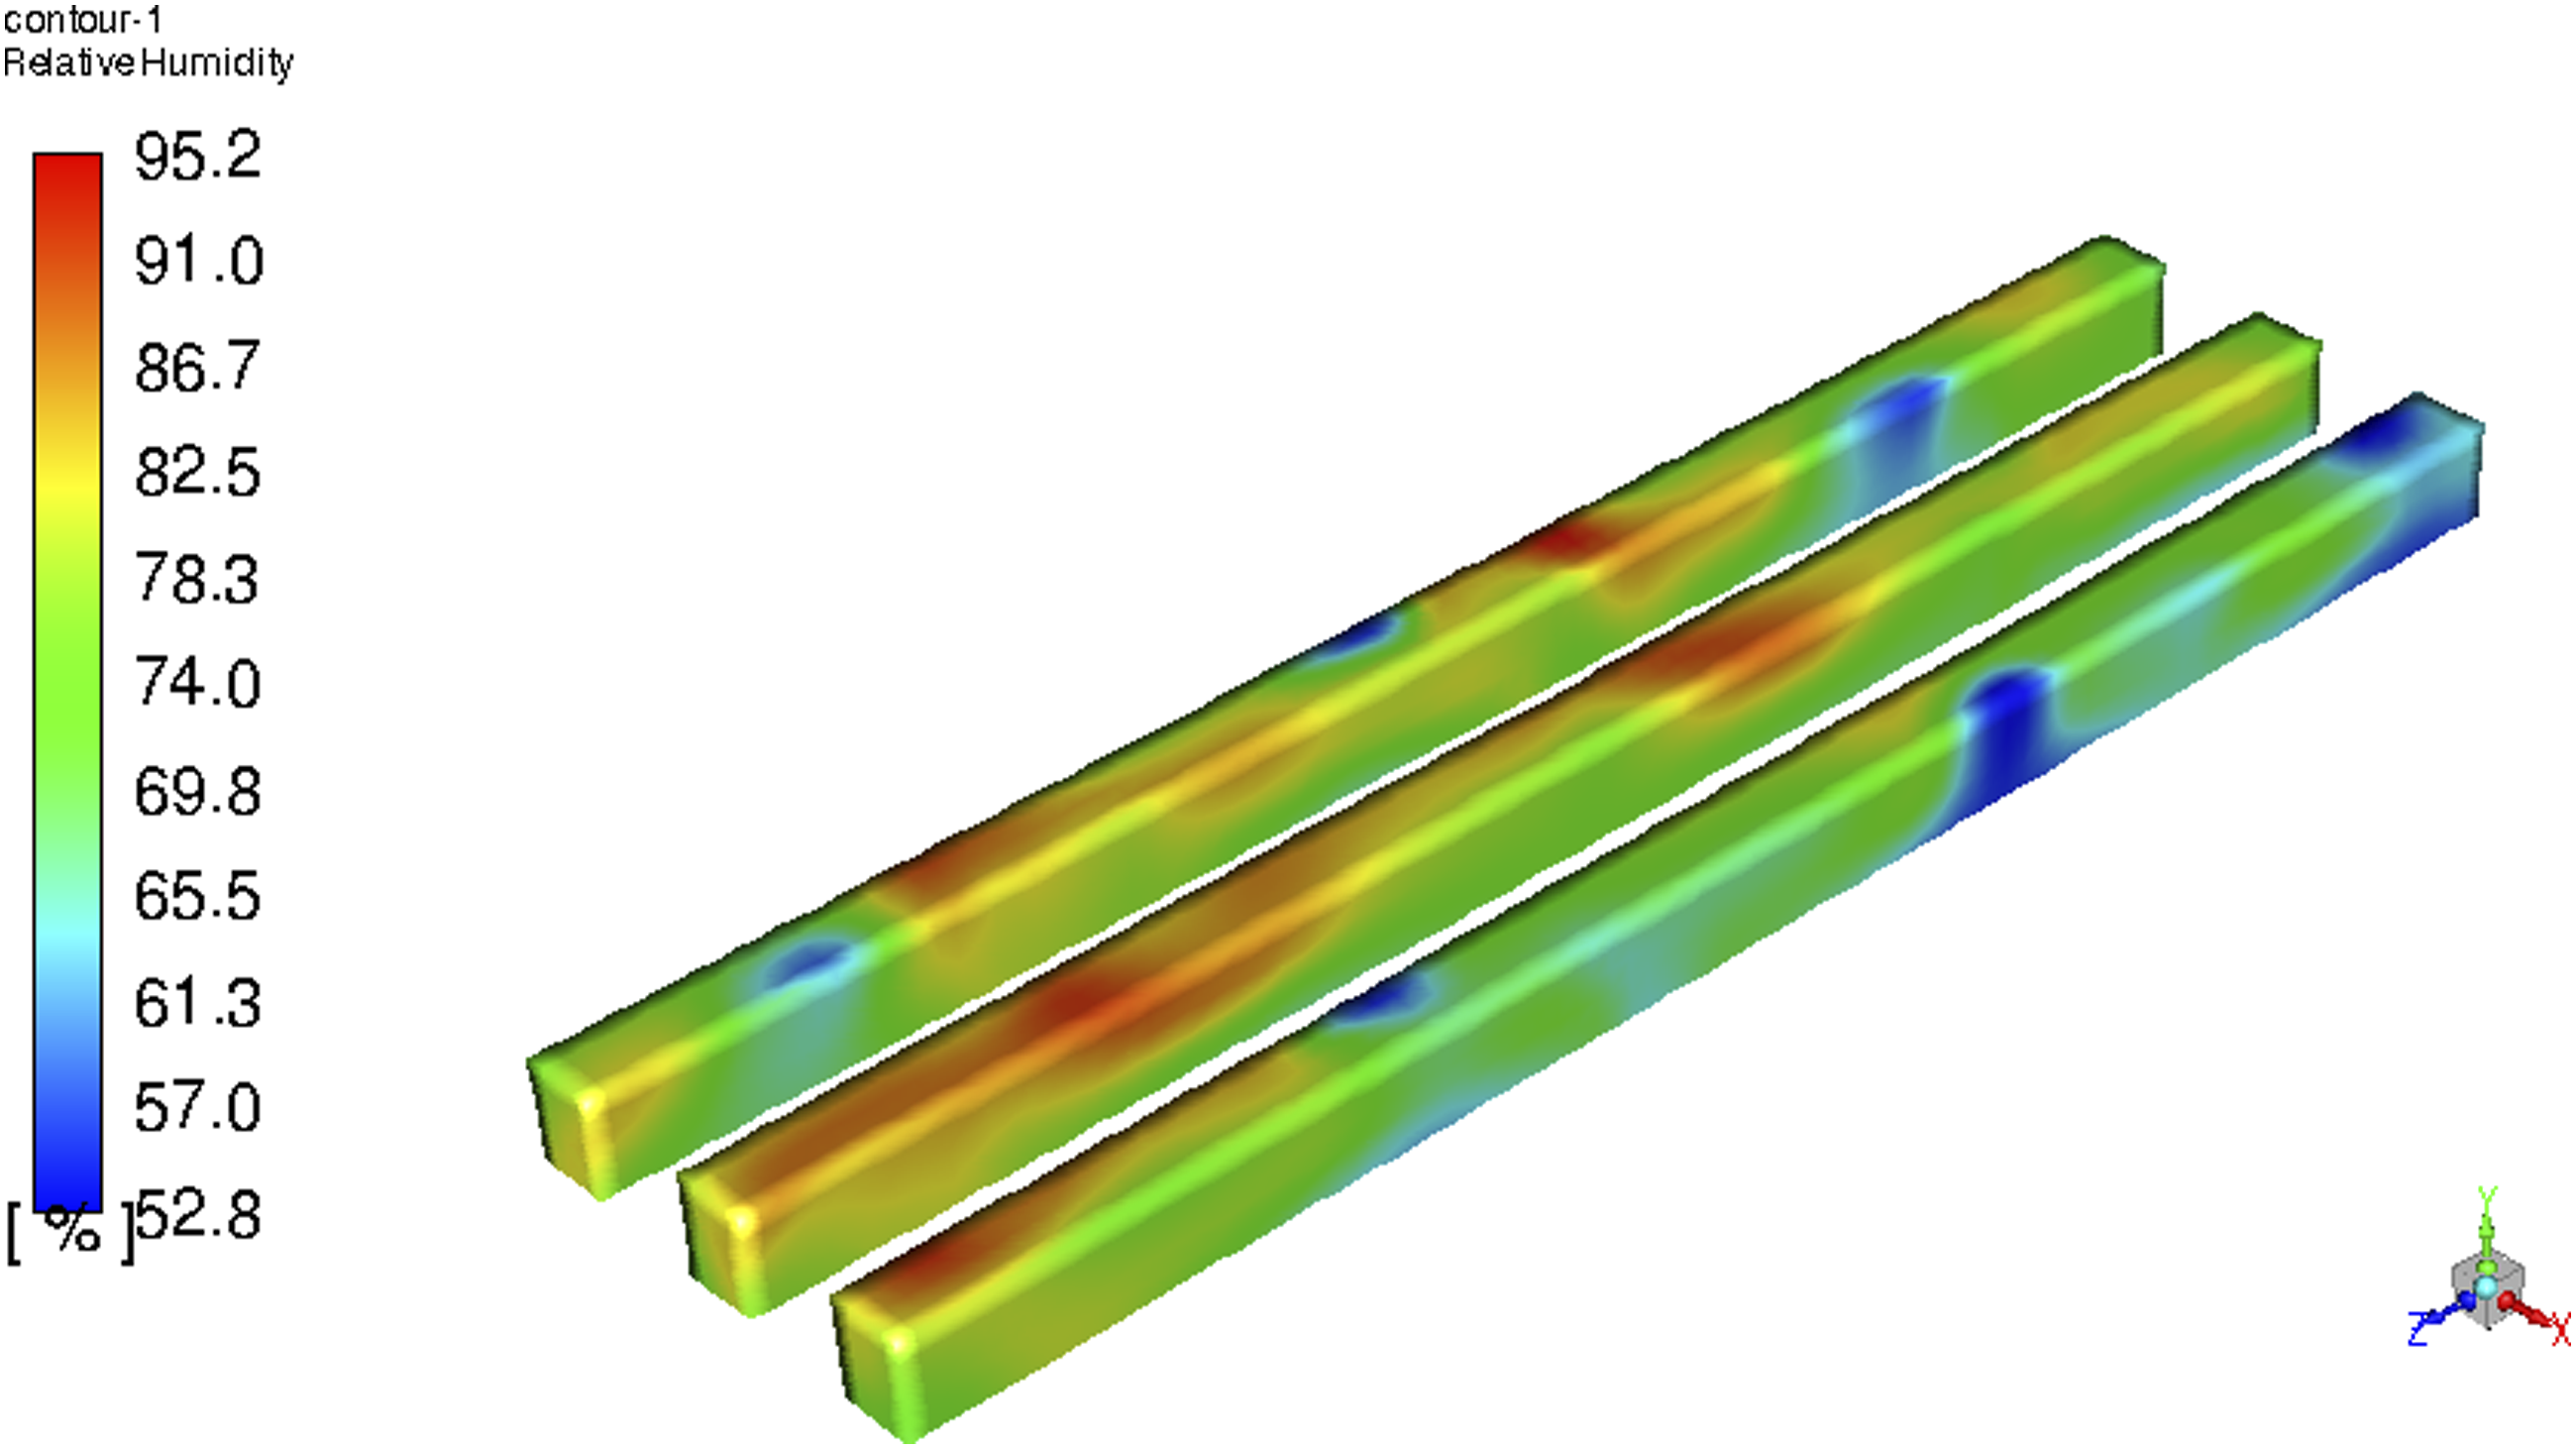
Comparison of the various dimensions of the air collectors
Comparing the results of numerical modeling with different collector dimensions reveals important information about system performance.
In the Figure 14, it can be seen that there is a relatively small temperature variation at an opening of these collectors (0.5 m) but this does not mean that the temperature distribution is uniform in all the cages. This thermal heterogeneity can be attributed to local variations in air flows and complex interactions between air currents and house structures. (a) The temperature at cage level for an opening of 0.5 m in the air collectors. (b) The temperature at cage level for an opening of 1.5 m in the air collectors.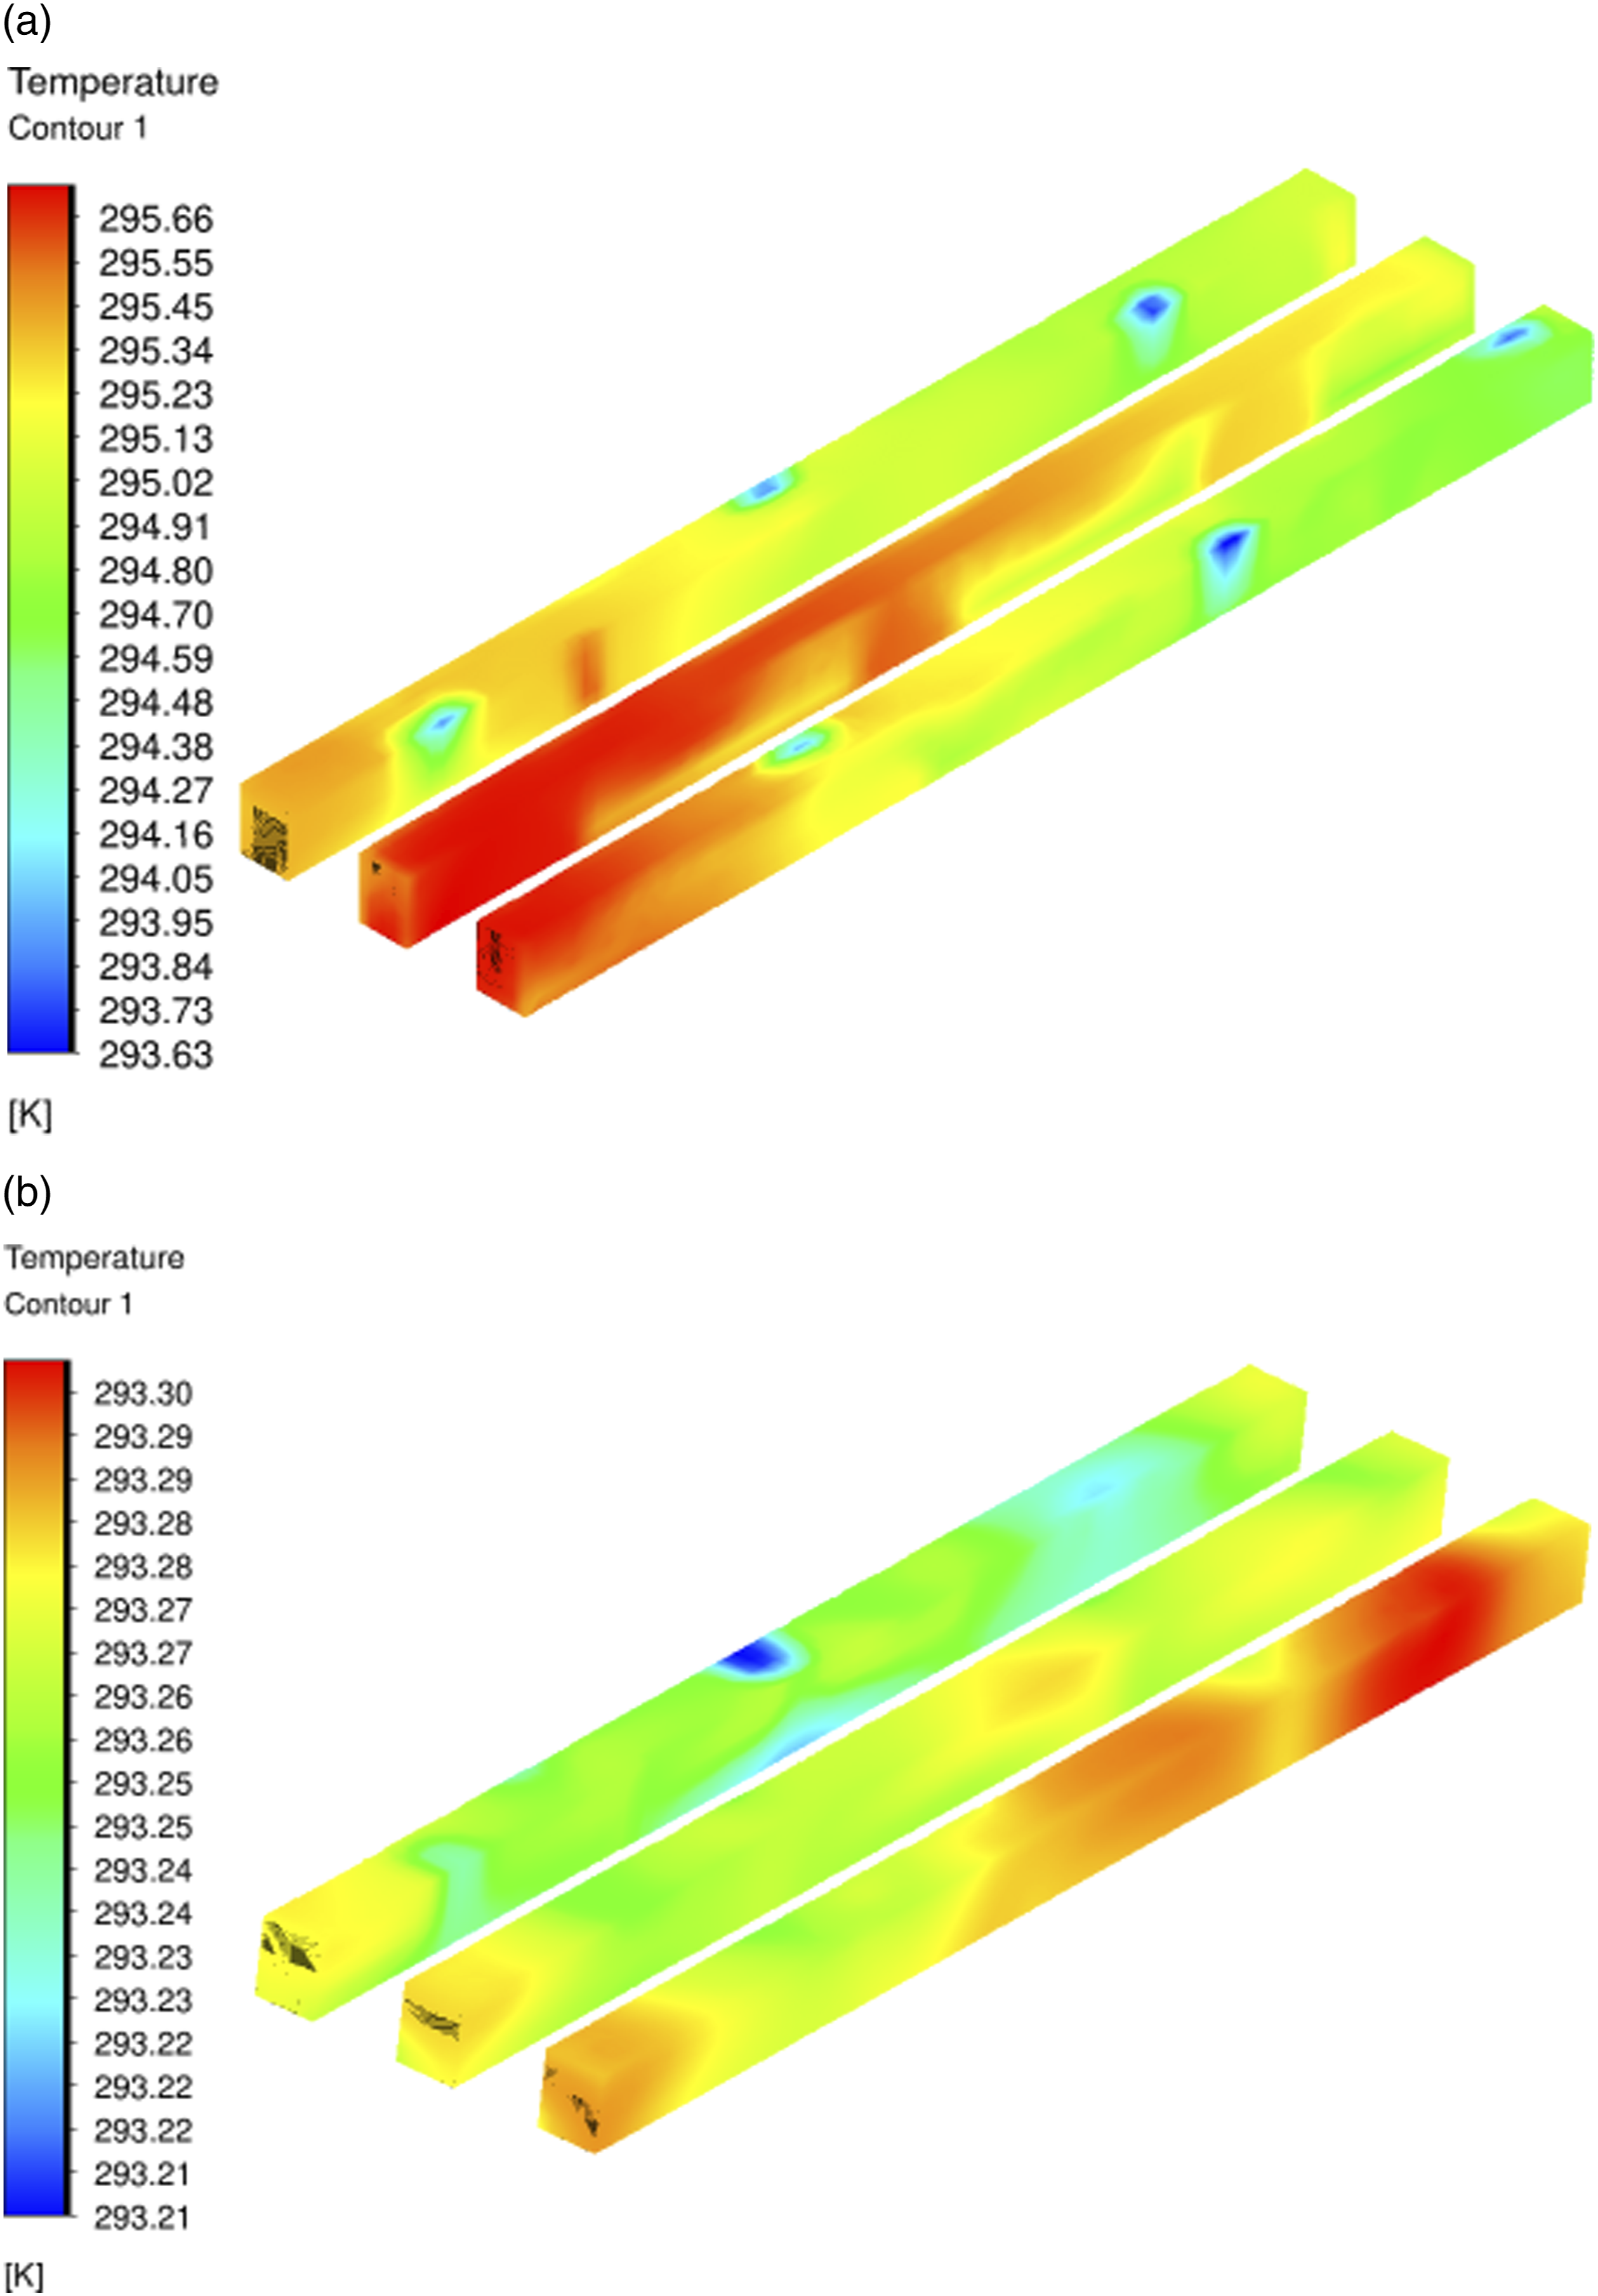
The temperature range of the second Figure 14 is narrower when the sensors are open up to 1.5 m, with variations between 293 K and 293.36 K. The wide opening of the manifolds may result in greater thermal stability, but it may result in turbulence at the level of the building.
The air velocities at the cages for an opening of 0.5 m are shown in the third Figure 15. The speed may be between 0 m/s and 0.7 m/s. However, it should be noted that these air velocity levels are within the comfort limits which do not exceed 2.5 m/s. (a) The air velocity at cage level for an opening of 0.5 m in the air collectors. (b) The air velocity at cage level for an opening of 1.5 m in the air collectors.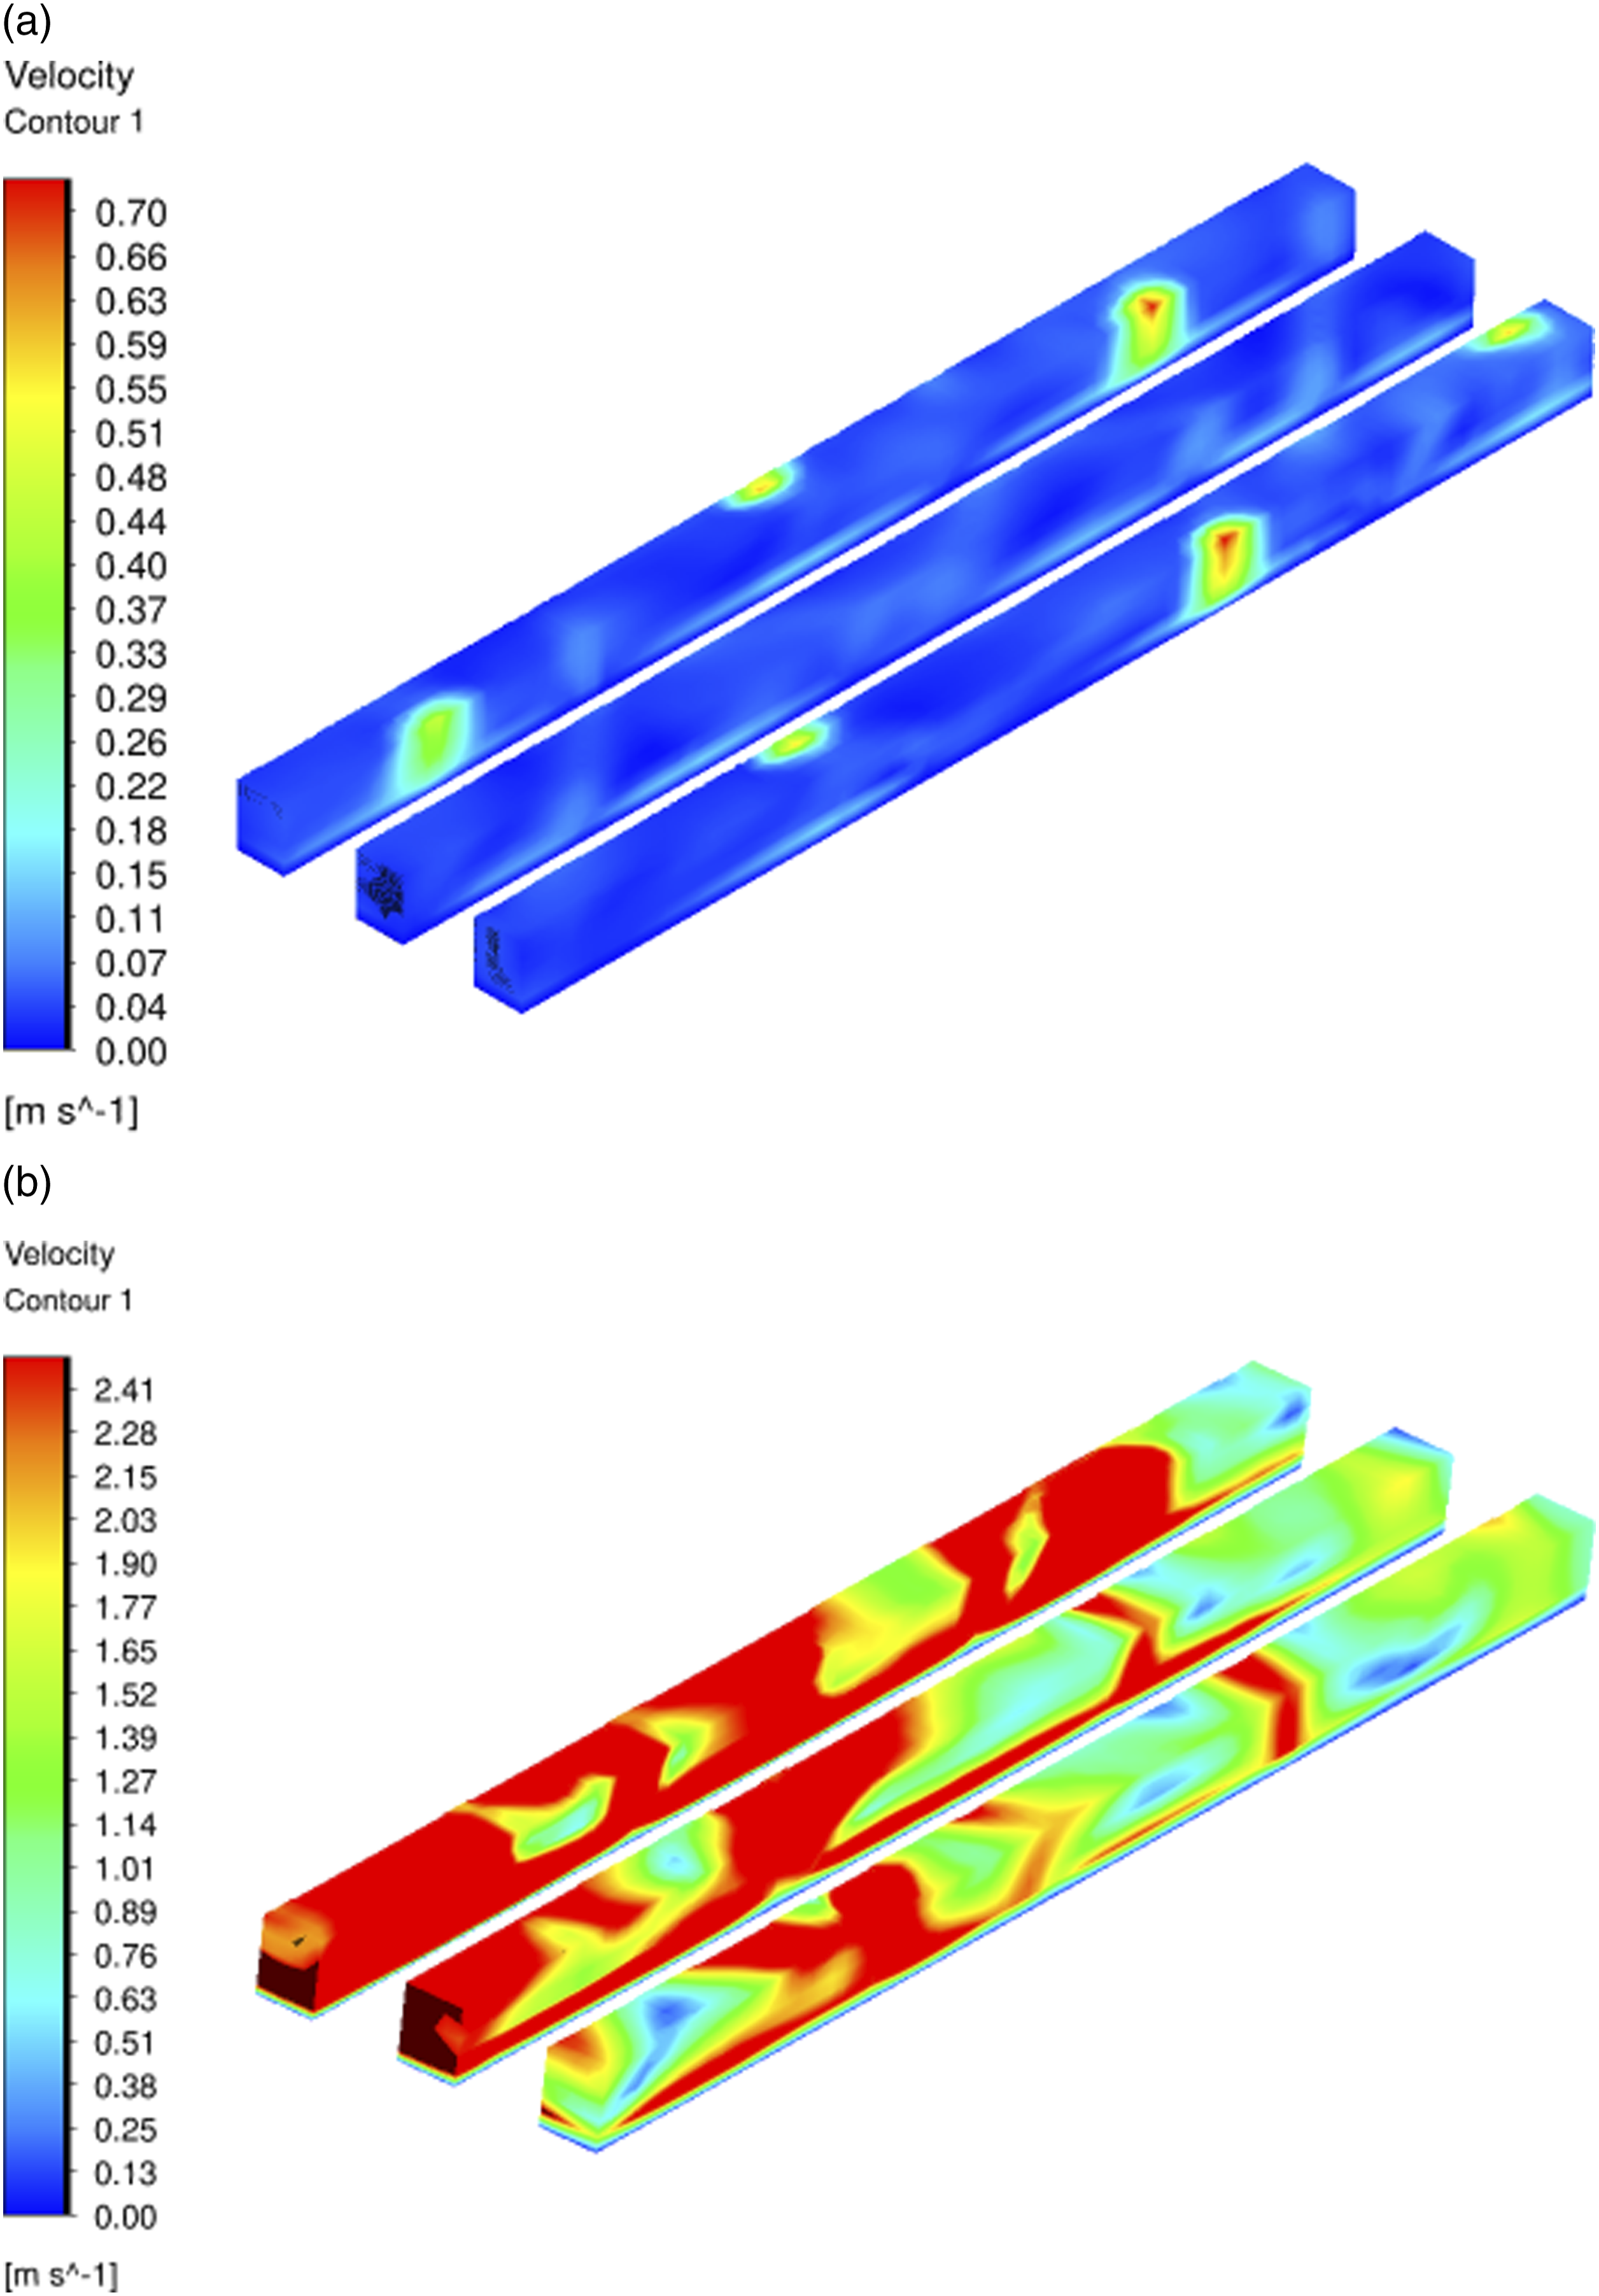
In comparison, the fourth Figure 15 depicts the air velocities at the cages for an opening of 1.5 m, with values oscillating between 0 m/s and 9.36 m/s. The air velocity reaches levels higher than the comfort threshold, signaling a potentially uncomfortable environment for the animals.
Then the impact of the dimensions of the air collectors on the temperature and the air velocity within the henhouse is significant. An opening of 0.5 m has a certain thermal non-uniformity, but the air velocities remain compatible with the comfort of the animals. On the other hand, an opening of 1.5 m guarantees a more stable temperature, but excessive air speeds could have negative effects on animal welfare. Thus, the choice of the dimensions of the collectors must take account of a balance between thermal regulation and aerological comfort in order to ensure an optimal environment for the animals of the henhouse. This equilibrium was provided when the collector opening size is 1 m.
Results analysis
In this section, we conducted a comparative study between the present windcatcher-based model and the model proposed in the literature,
40
which utilizes windows with mechanical ventilation. (Figure 16). Diagram of measuring points in the chicken coop.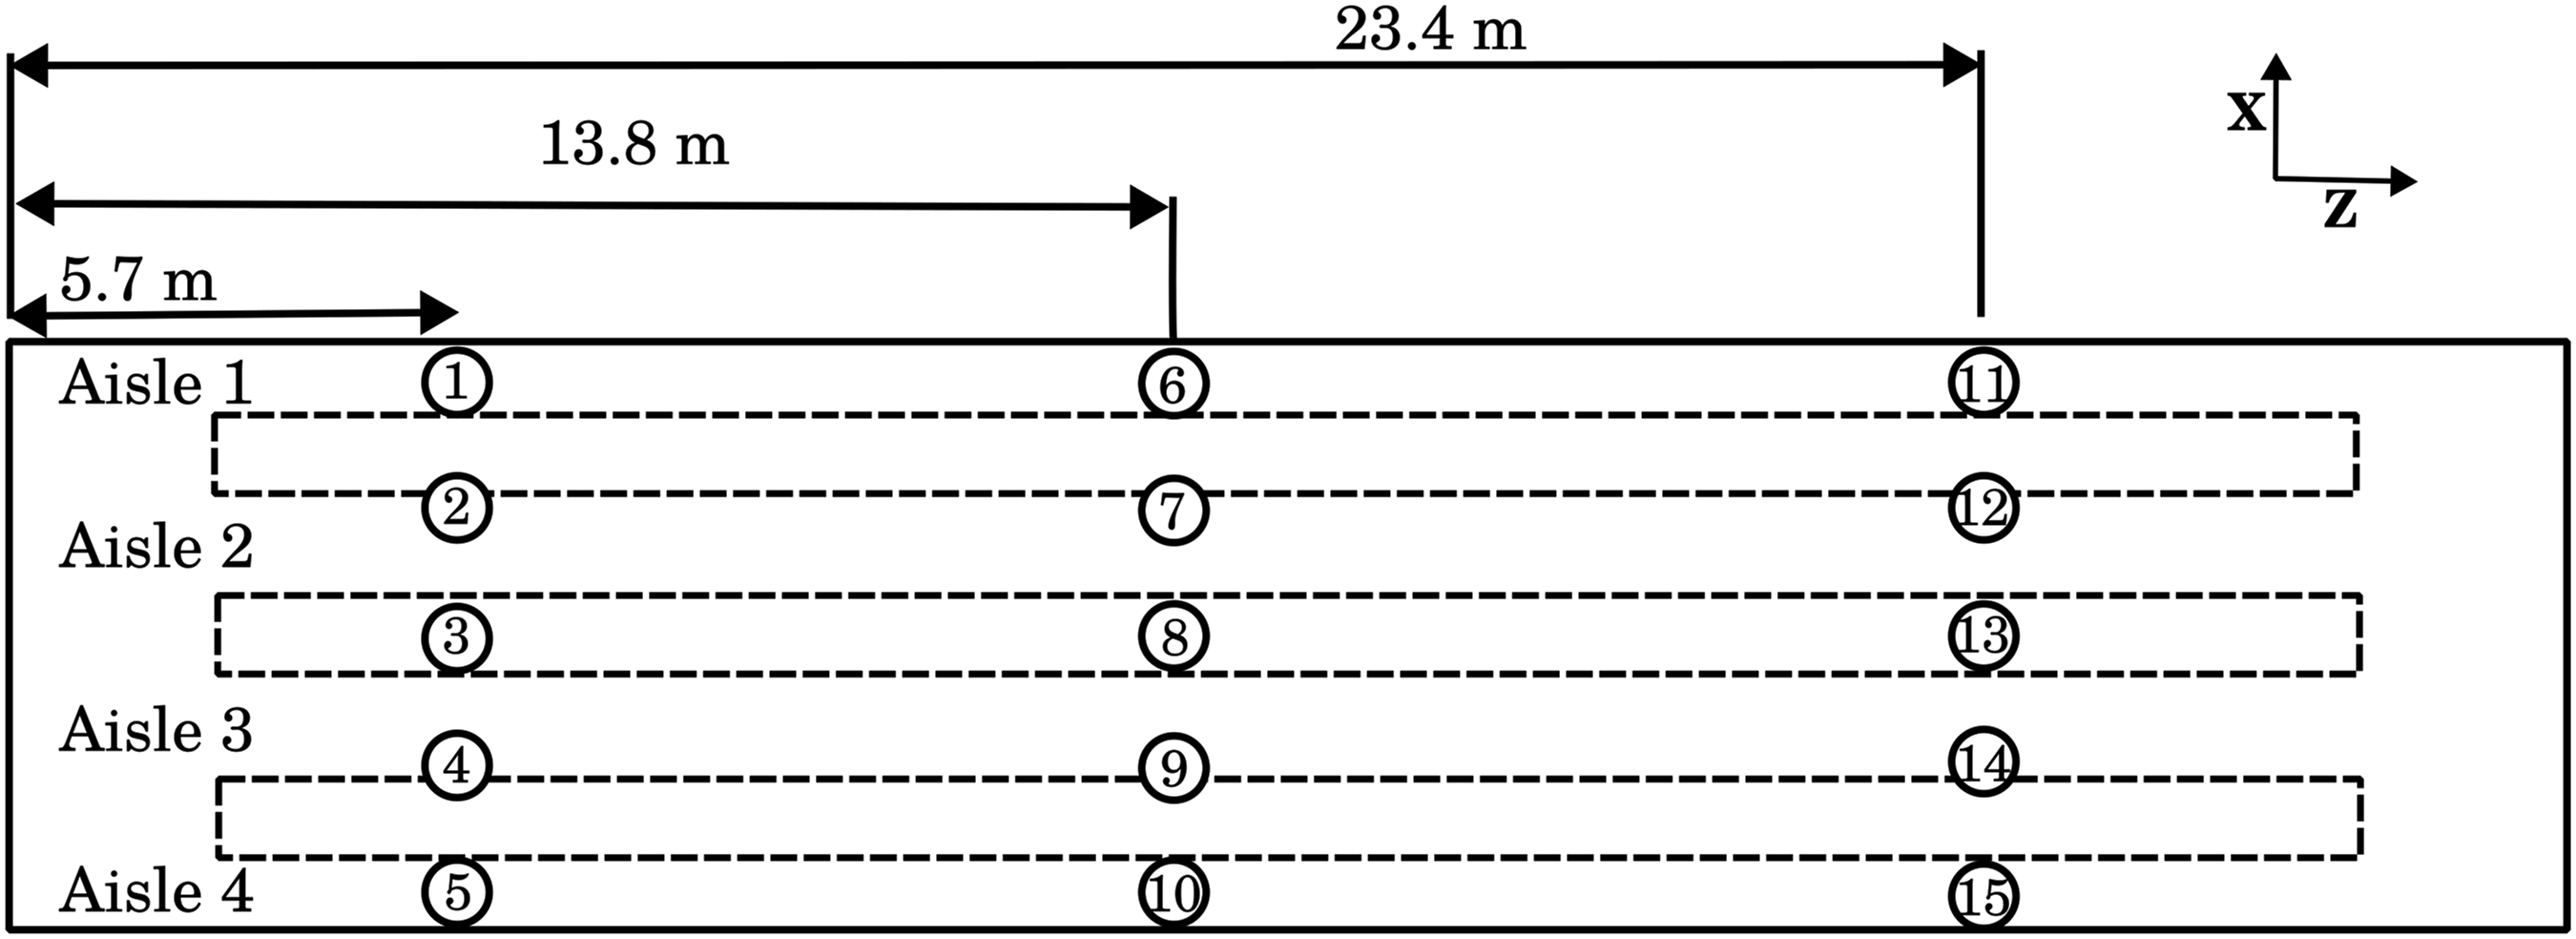
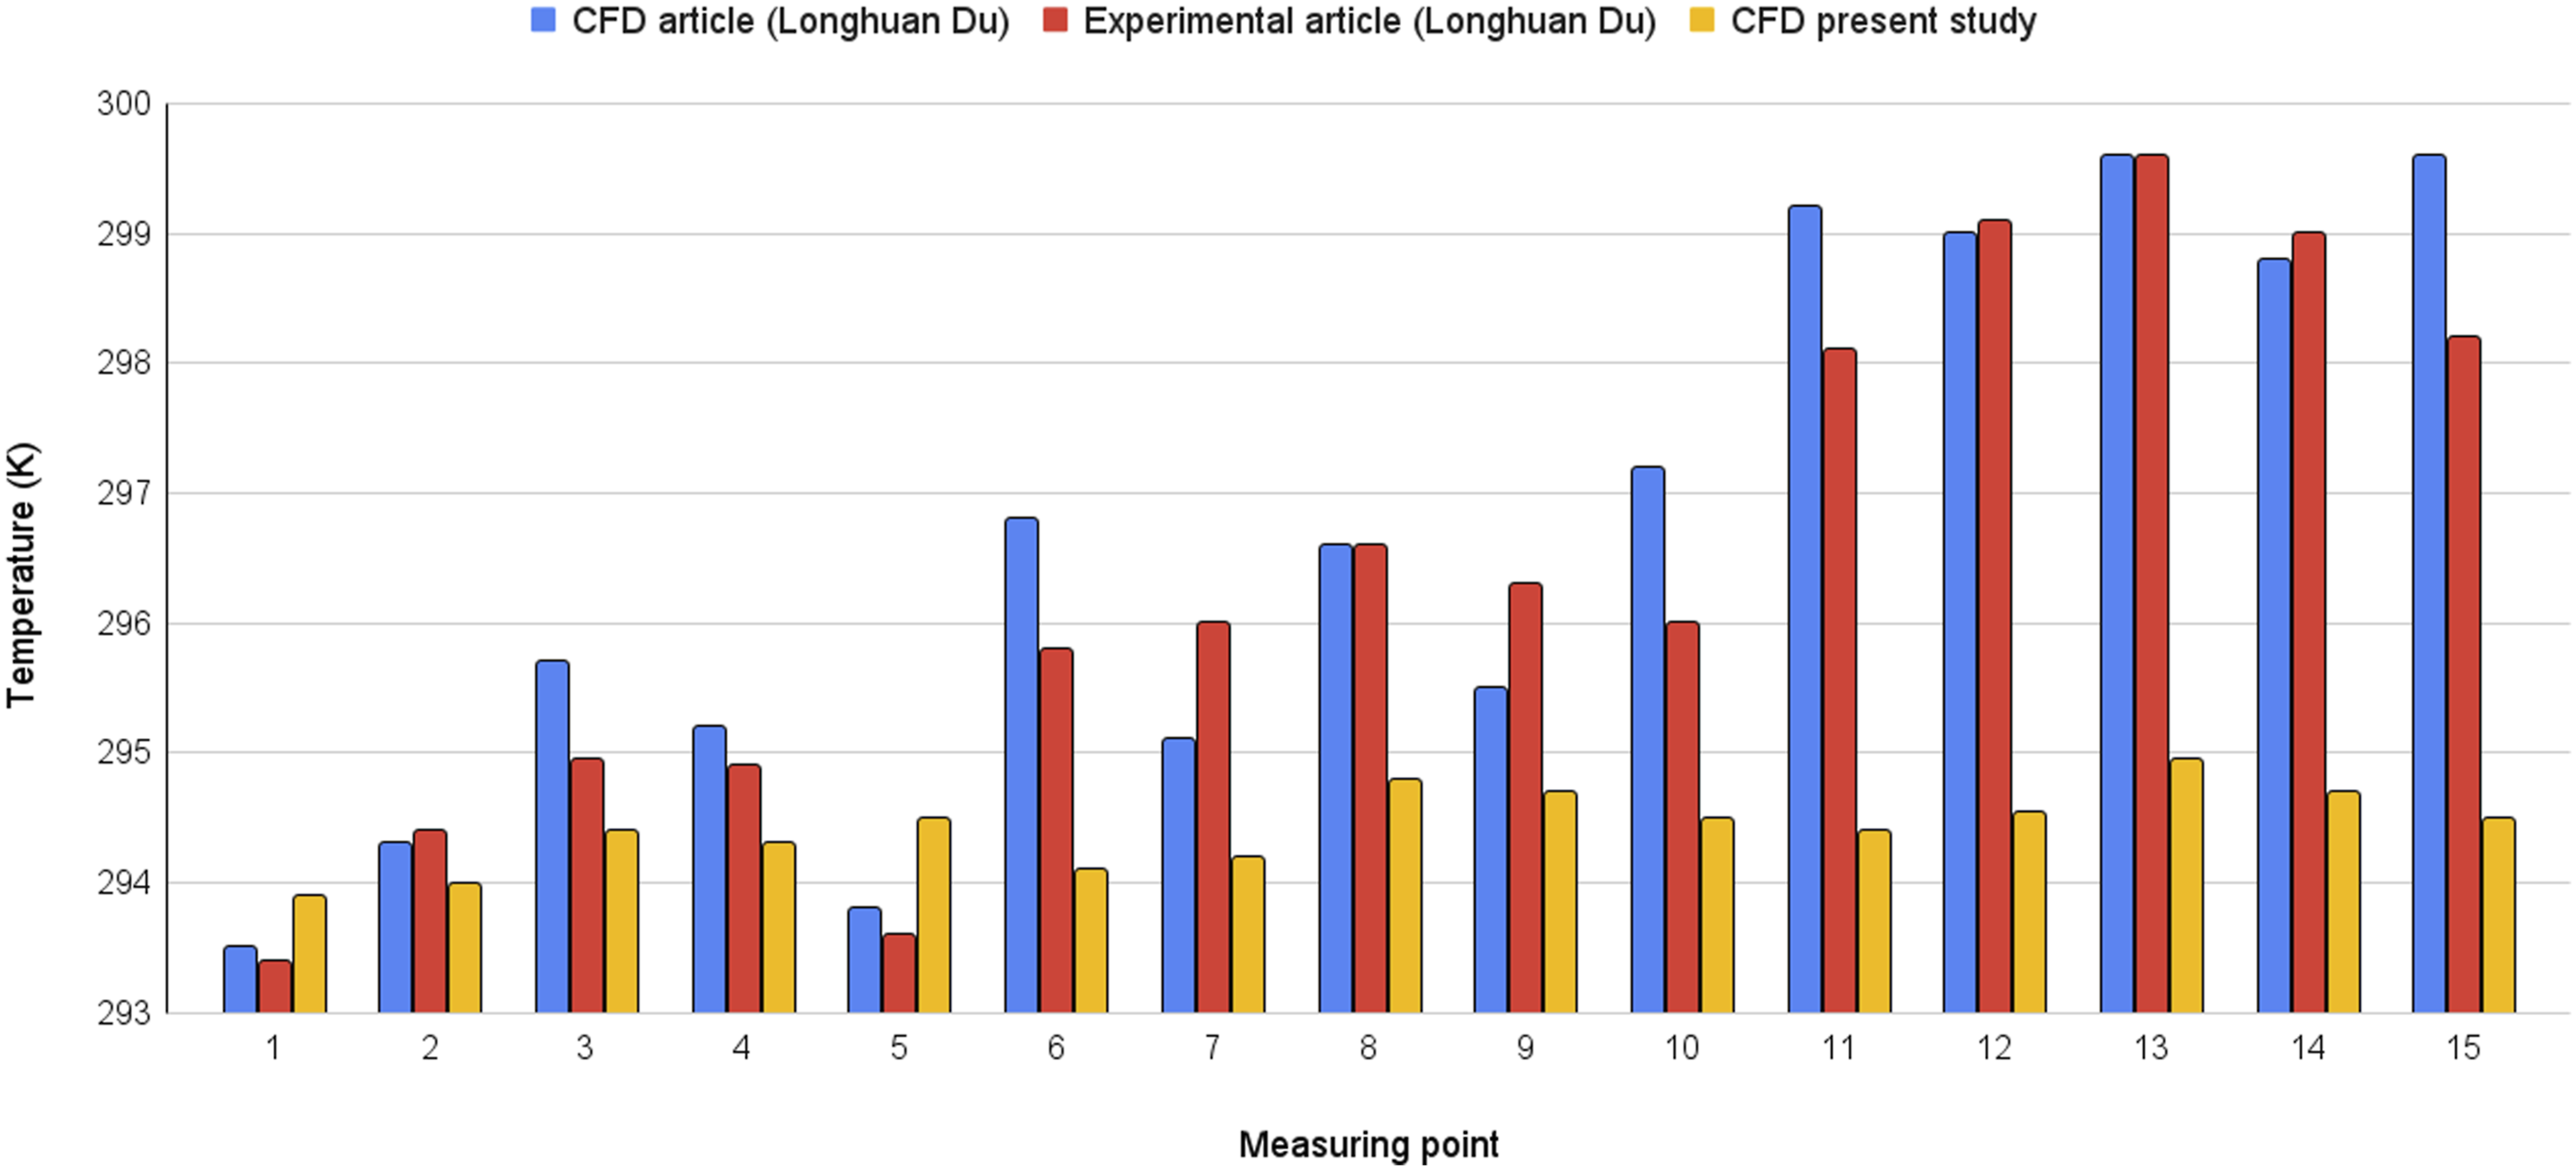
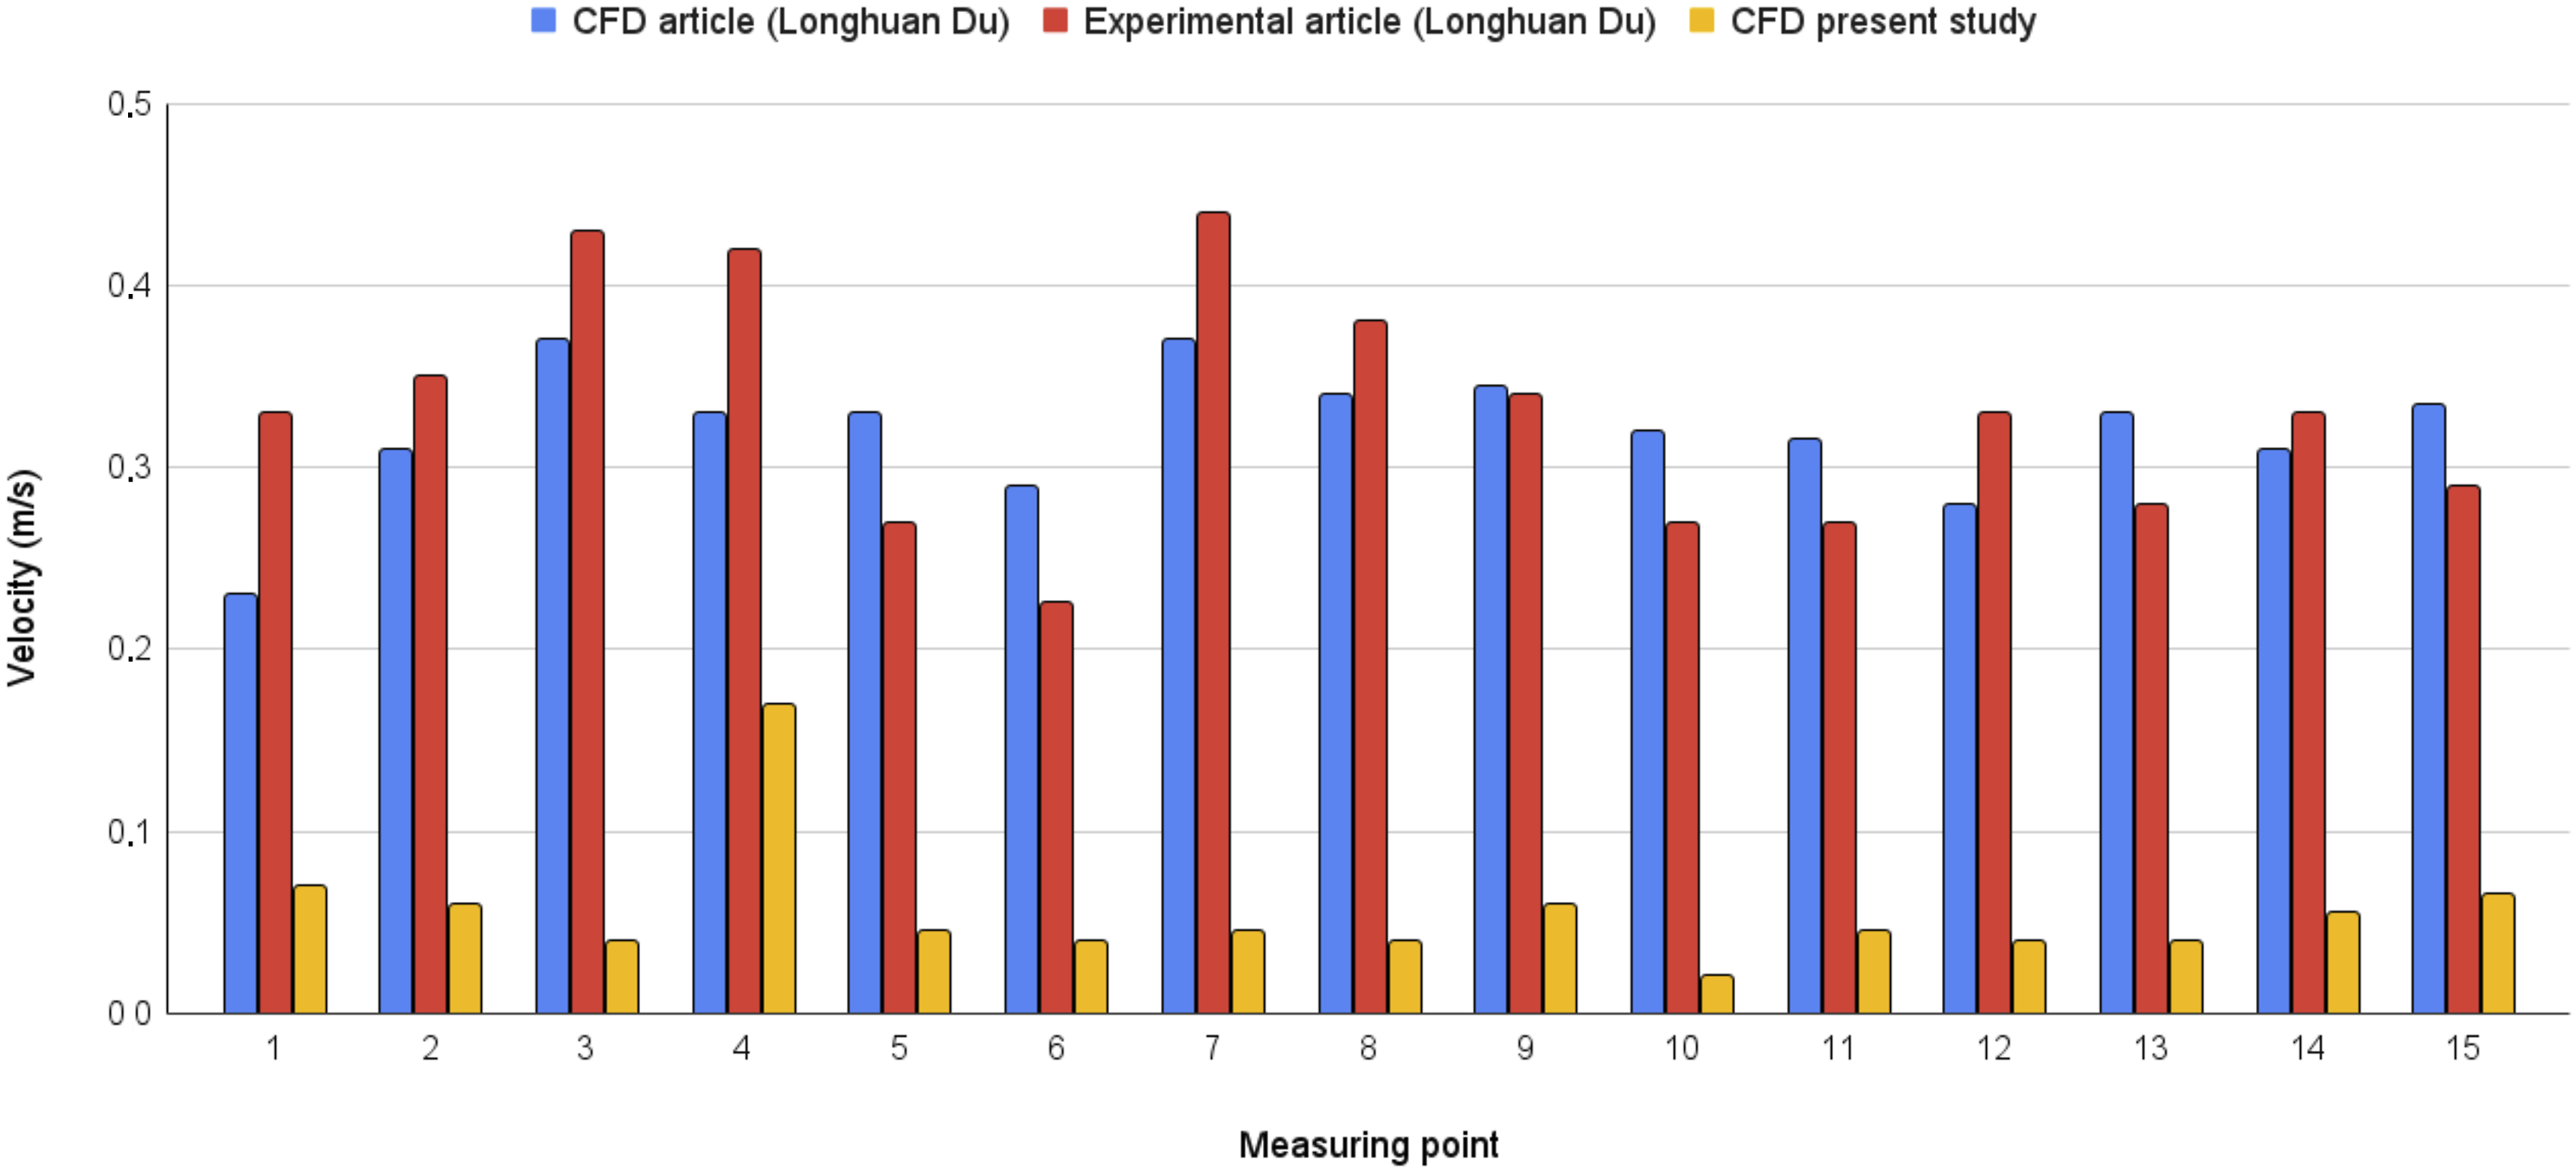
To ensure a fair comparison of the results, it is essential to maintain the same boundary conditions for both models 16, including temperature, air flow, air velocity, and relative humidity. The analysis of temperature distribution and air velocity in the building indicates that the windcatcher-based model exhibits greater reliability (a homogeneous distribution of the temperature which varies between 294 K and 295K on the other hand in the other study the temperature varies from 293.4 K to 299.7 K and is concentrated towards the end of building). This can be attributed to the enhanced temperature homogeneity within the building, as clearly depicted in Figure 17. Similarly, the internal velocity of the building, as shown in Figure 18, also demonstrates favorable results when utilizing the windcatcher model. Comparison between the temperature distribution of the present study and the published results.
40
Comparison between the velocity distribution of the present study and the published results.
40
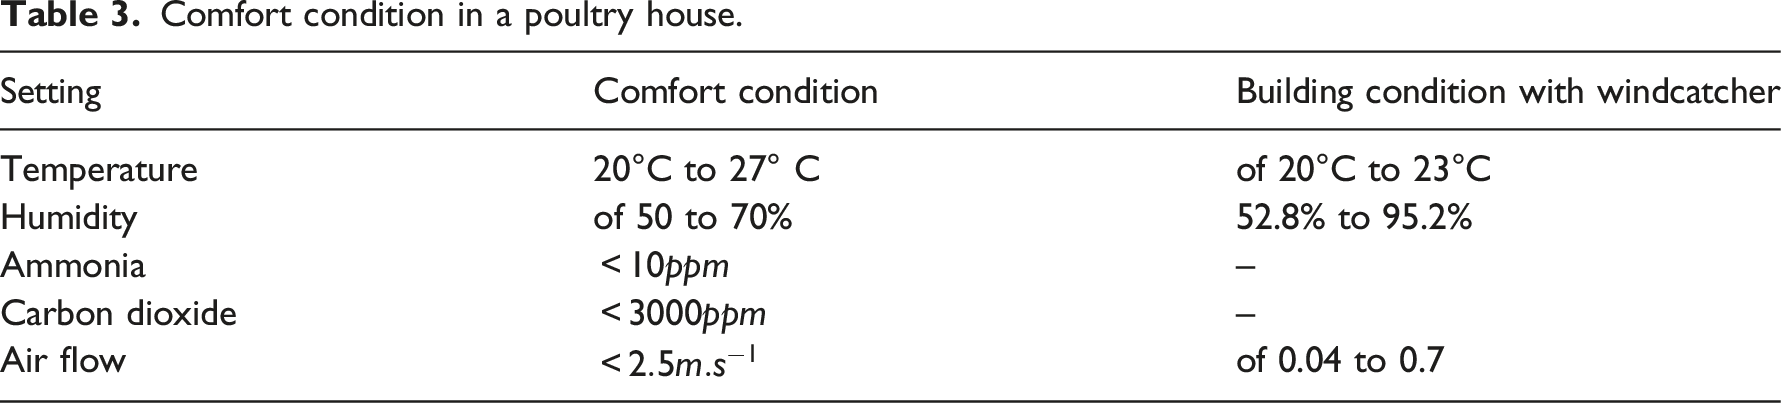
Comfort condition in a poultry house.
Conclusion
In this work, ANSYS Fluent v19.2 was used to precisely create a computational fluid dynamics (CFD) model to examine airflow and thermal conditions within a laying poultry house using a natural ventilation system with windcatchers. To realistically represent the physical environment, the CFD model was constructed using actual measurements from the poultry house. The predicted air speed at the windcatcher entrance was compared with experimental measurements from published studies to confirm the accuracy of the CFD model. The results demonstrated an excellent degree of consistency between the simulated and experimental data, validating the CFD model.
The dimensions of the windcatchers, external wind speed, and ambient temperature were crucial factors considered during the modeling process, impacting the effectiveness of the ventilation system. By accounting for these variables, the CFD model successfully predicted how the windcatchers would affect the indoor temperature of the poultry house. Notably, the average indoor temperature dramatically dropped from 29°C to a more bearable 19.85°C with an initial internal air speed of 2 m/s and an external temperature of 20°C. This result demonstrates the system’s efficiency, especially at lower air speeds and when the outside temperature remains lower than the inside temperature of the poultry house.
According to the study’s conclusions, future research could focus on modeling an evaporative cooling system for poultry houses to enhance performance and ensure efficient cooling, particularly in conditions where the outside temperature exceeds 30°C. Maintaining confortable environmental conditions is essential for the welfare and production of poultry. The confort temperature range is between 20 and 27 degrees Celsius, while the confort humidity range is between 50% and 70%.
The investigation into temperature distribution and air velocity within the poultry house demonstrates that, compared to other ventilation systems, the windcatcher-based model exhibits superior reliability. The windcatcher system significantly contributes to the temperature uniformity within the building, suggesting increased thermal comfort for laying hens. Additionally, it was discovered that using the windcatcher model yielded good results in terms of the building’s inertial velocity. This research showcases the efficiency of the windcatcher-based natural ventilation system in maintaining a comfortable indoor environment for chickens.
Footnotes
Acknowledgments
We would like to express our sincere gratitude to the Managers of the Mechanical Production Workshop, Mr. Farhat GHANEM and Mr. Bechir Bouzakher, for granting me online access to the workstation. Their collaboration and availability have greatly contributed to the completion of this research. The resources provided by the Laboratory of Mechanics, Materials, and Processes at ENSIT have significantly enriched our research. The cooperation of Mr. Farhat GHANEM and Mr. Bechir Bouzakher has been essential to the success of our study.
Declaration of conflicting interests
The author(s) declared no potential conflicts of interest with respect to the research, authorship, and/or publication of this article.
Funding
The author(s) received no financial support for the research, authorship, and/or publication of this article.