
Abstract
There is an imbalance between supply and demand in the power system. Implementing demand response control strategies for air-conditioning systems is beneficial to optimize the allocation of power resources. Here, we use two single strategies and a combination strategy for the radiant roof cooling system: passive energy storage, global temperature reset, and the passive energy storage-global temperature reset combination strategy to implement demand response control, all of which achieve peak load reduction or shifting by changing the indoor controlled parameters. Based on the thermal inertia of the building envelope, we utilize a TRNSYS model to analyze the performance of three demand response strategies of radiant roof cooling systems in terms of thermal comfort, energy consumption, operating costs, and peak load shifting rates. The findings reveal that implementing demand response strategies can reduce the operating energy consumption of radiant roof cooling systems and facilitate peak load shifting. Among them, the combined response strategy shows the best peak load transfer effect, with a transfer rate of 19.84% and a better operating economy. Meanwhile, we find that the outdoor temperature affects the implementation of demand response strategies for the radiant roof cooling system based on the thermal inertia of the building envelope.
Practical application
The study has significant application value in the following aspects: Implementing a demand response strategy for the radiant roof cooling system, based on the thermal inertia of the building envelope, can reduce operational energy consumption and achieve peak load shifting. This approach effectively addresses the issue of supply-demand imbalance in the power system. The application of the work could facilitate improved operational energy efficiency, contributing to emissions reduction goals and optimizing the use of intermittent renewable energy systems in power grids.
Introduction
As society’s demand for electricity continues to grow, power systems face tremendous pressure. 1 Traditionally, power systems have primarily focused on controlling the supply side by expanding installed capacity or constructing peak-shaving power plants to address the power supply-demand imbalance issues. However, they do not effectively address the fluctuation in grid loads between peak and off-peak periods.2,3 In view of this situation, demand response has gained significant attention. 4 It offers a solution by allowing users to participate in the operation of the power system. Users can respond to changes in power prices by adjusting their consumption patterns, thereby achieving optimal allocation of power resources.5,6
Buildings are the primary consumers of urban electricity and have great potential to benefit from peak regulation.7,8 Air-conditioning systems account for 40%–60% of the total energy consumption in commercial buildings. 9 At the same time, most air-conditioning systems rely on electricity as their primary power source. The electricity consumption pattern of air-conditioning systems directly influences the distribution of loads on the grid. Moreover, air-conditioning loads exhibit a rapid response to short-term regulation and represent a valuable demand response resource with exceptional reliability. 8
Several demand response strategies today are commonly used in air-conditioning systems, such as global temperature reset, passive energy storage, shutting down partially operating chillers, and regulating water supply temperature. Global temperature reset10–12 involves adjusting the indoor set temperature of the entire building to optimize energy consumption. Passive energy storage11,12 is an approach that utilizes the thermal mass of the building to store excess cold or heat energy for later use. Regulating water supply temperature 13 is a strategy that focuses on controlling chilled water temperature to improve energy efficiency. When the load demand decreases, shutting down part of operating chillers14,15 can reduce energy consumption. All these strategies aim to achieve two main goals: peak load reduction16,17 and peak-to-valley load shifting.18,19 Peak load reduction refers to reducing the maximum demand on the power grid, while peak-to-valley load shifting aims to shift energy consumption from peak hours to valley hours. In a study conducted by Xu, he achieved a remarkable 80%–100% cooling load shifting effect by utilizing both passive energy storage and global temperature reset in a commercial building based on medium thermal mass walls. 11 These strategies could transfer a significant proportion of the cooling load to off-peak hours. They not only reduce the burden on the power grid during peak periods but also improve energy utilization. Additionally, leveraging the thermal inertia of the building itself can reduce the peak load of the system.13,20,21 Taking advantage of the thermal properties of the building can save energy by changing the demand response control method. Shan proposed a strategy that limited chiller direct power to adjust real-time power consumption. 22 They combined this approach with the delayed release property of the building’s thermal mass to ensure indoor air temperature fluctuations remained within 3°C while cutting the peak load by 7.8%. At the same time, Foteinaki evaluated the energy flexibility of an apartment building by considering its thermal mass. 23 The results showed that energy consumption could be reduced significantly, ranging from 40% to 87%, during morning peak load hours.
As supported by previous research, radiant air-conditioning systems have gained increasing attention due to their thermal comfort and energy-saving benefits.24–26 Stetiu conducted numerical simulations to compare radiant cooling systems and all-air systems in various commercial buildings across different locations in the United States. The findings showed an average 30% reduction in energy consumption and a 27% reduction in peak power consumption with the use of radiant cooling systems. 27 However, there are few studies on the demand response control strategy for radiant roof cooling systems based on the thermal inertia of the building envelope. Most existing studies about demand response control strategies have concentrated on convective air-conditioning systems. 28 , 29 Radiant air-conditioning systems utilize building thermal inertia differently from convective air-conditioning systems. Therefore, this study aims to explore the potential of the radiant roof cooling system to participate in the demand-side response. The study investigates a representative room in a commercial office building in Nanjing. It explores the potential for radiant roof cooling systems to participate in demand-side response based on the thermal inertial of the building envelope by various response strategies, including passive energy storage and global temperature reset.
Methodology
Simulation modeling of the radiant roof cooling system
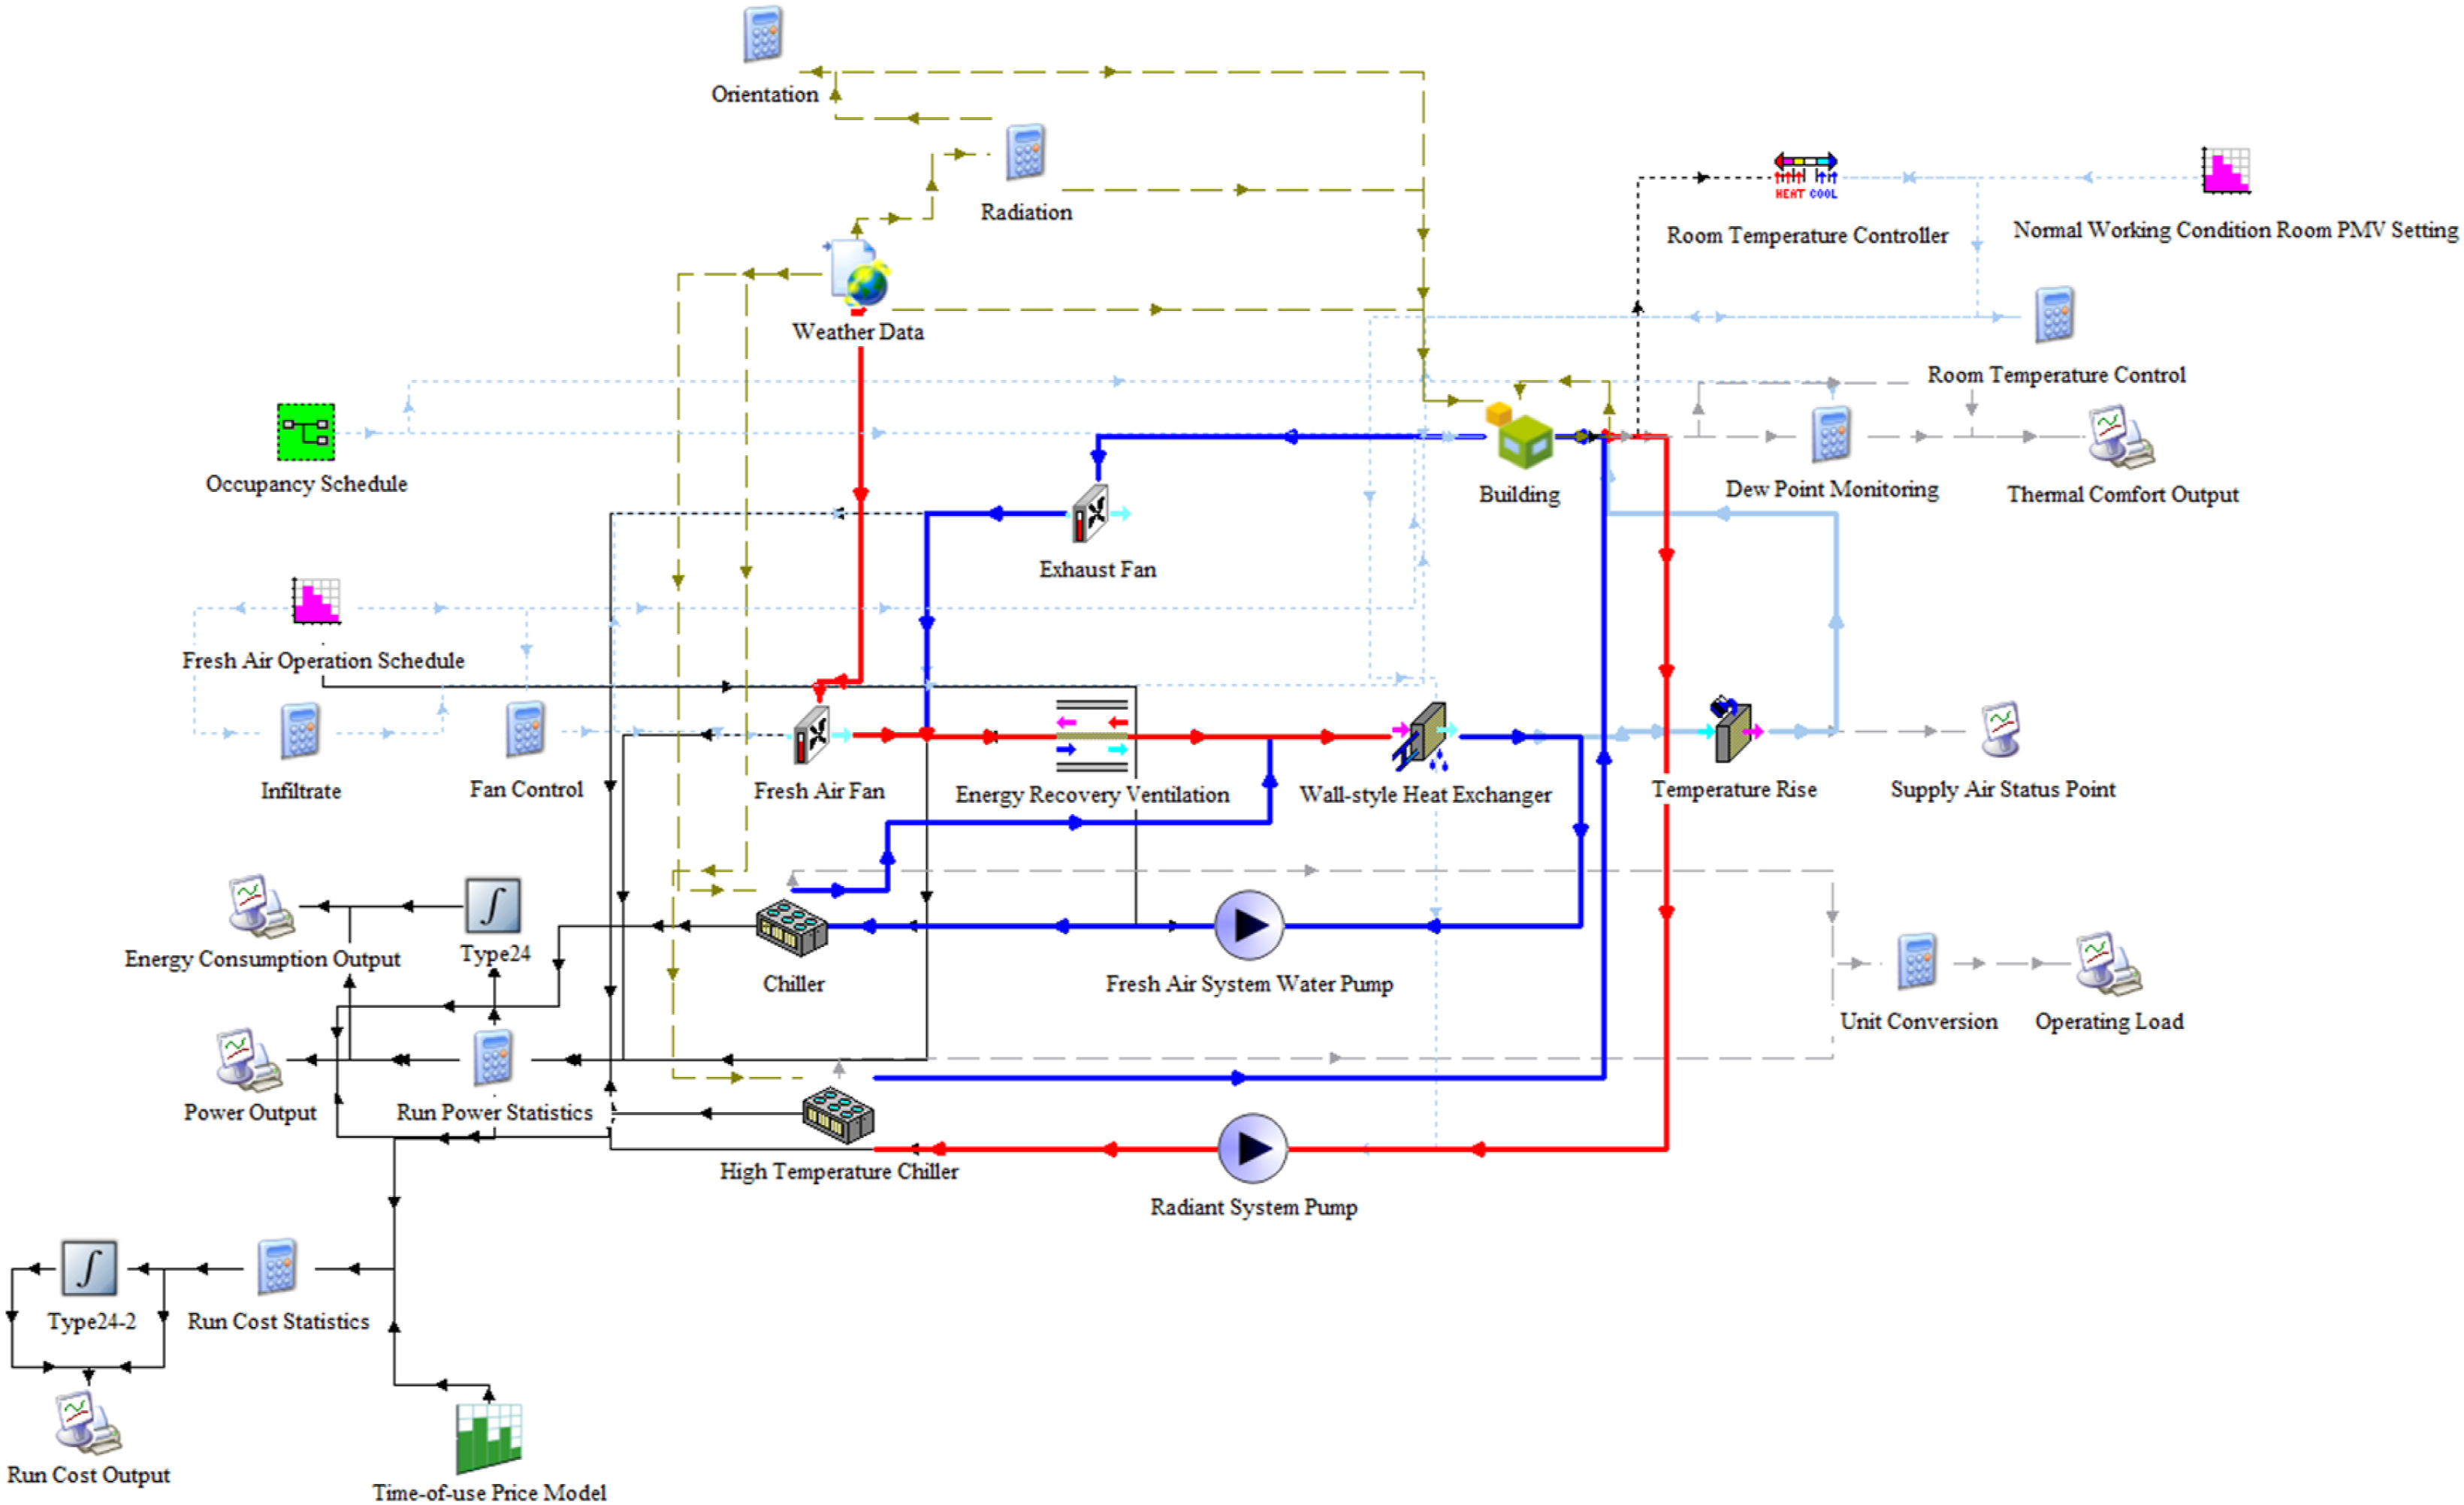
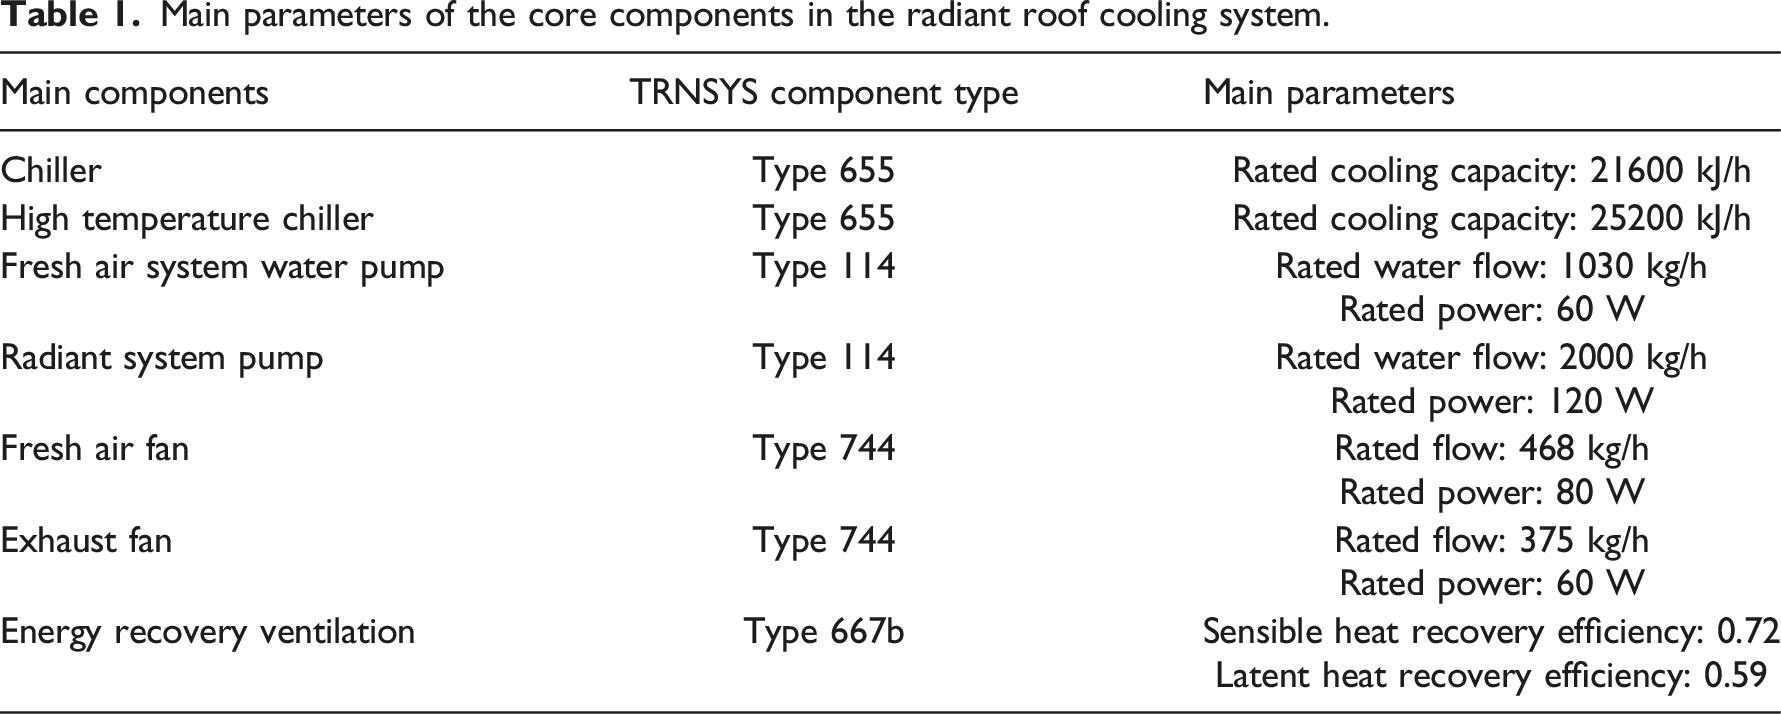
For this study, we chose a representative room (volume = 520 m3) in a commercial office building in Nanjing. The west and south walls are external, featuring two windows and a window-to-wall ratio of 0.23. The radiant roof cooling system in the room consists of a radiant system and an independent fresh air system. The conventional chiller unit supplies chilled water to the independent fresh air system, while a high-temperature chiller unit supplies chilled water to the radiant system. The summer climate in Nanjing is always high temperature, and the outdoor air humidity is generally high. Therefore, during the summer operation stage, the conventional chiller unit supplies the fresh air unit with 7°C chilled water to cool and dehumidify the fresh air. The fresh air unit continuously supplies the treated fresh air to the room during occupied hours, which absorbs the latent heat cooling loads and a portion of the sensible heat cooling loads in the room. The high-temperature chiller unit supplies 18°C high-temperature chilled water to eliminate the remaining sensible heat load in the room. We controlled the dry-bulb temperature of the room at 26 (±1)°C by starting and stopping the high-temperature chiller unit. When the dew point temperature in the room exceeded the water supply temperature, we stopped supplying water to the radiant system to avoid dew condensation on the radiant panels. Figure 1 shows the schematic diagram of the radiant roof system. TRNSYS is a transient building energy simulation software. We used TRNSYS software to establish the radiant roof cooling system model, as depicted in Figure 2. Table 1 provides the critical parameters of the core components in the system. Schematic diagram of the radiant roof cooling system. TRNSYS simulation model of the radiant roof cooling system. Main parameters of the core components in the radiant roof cooling system.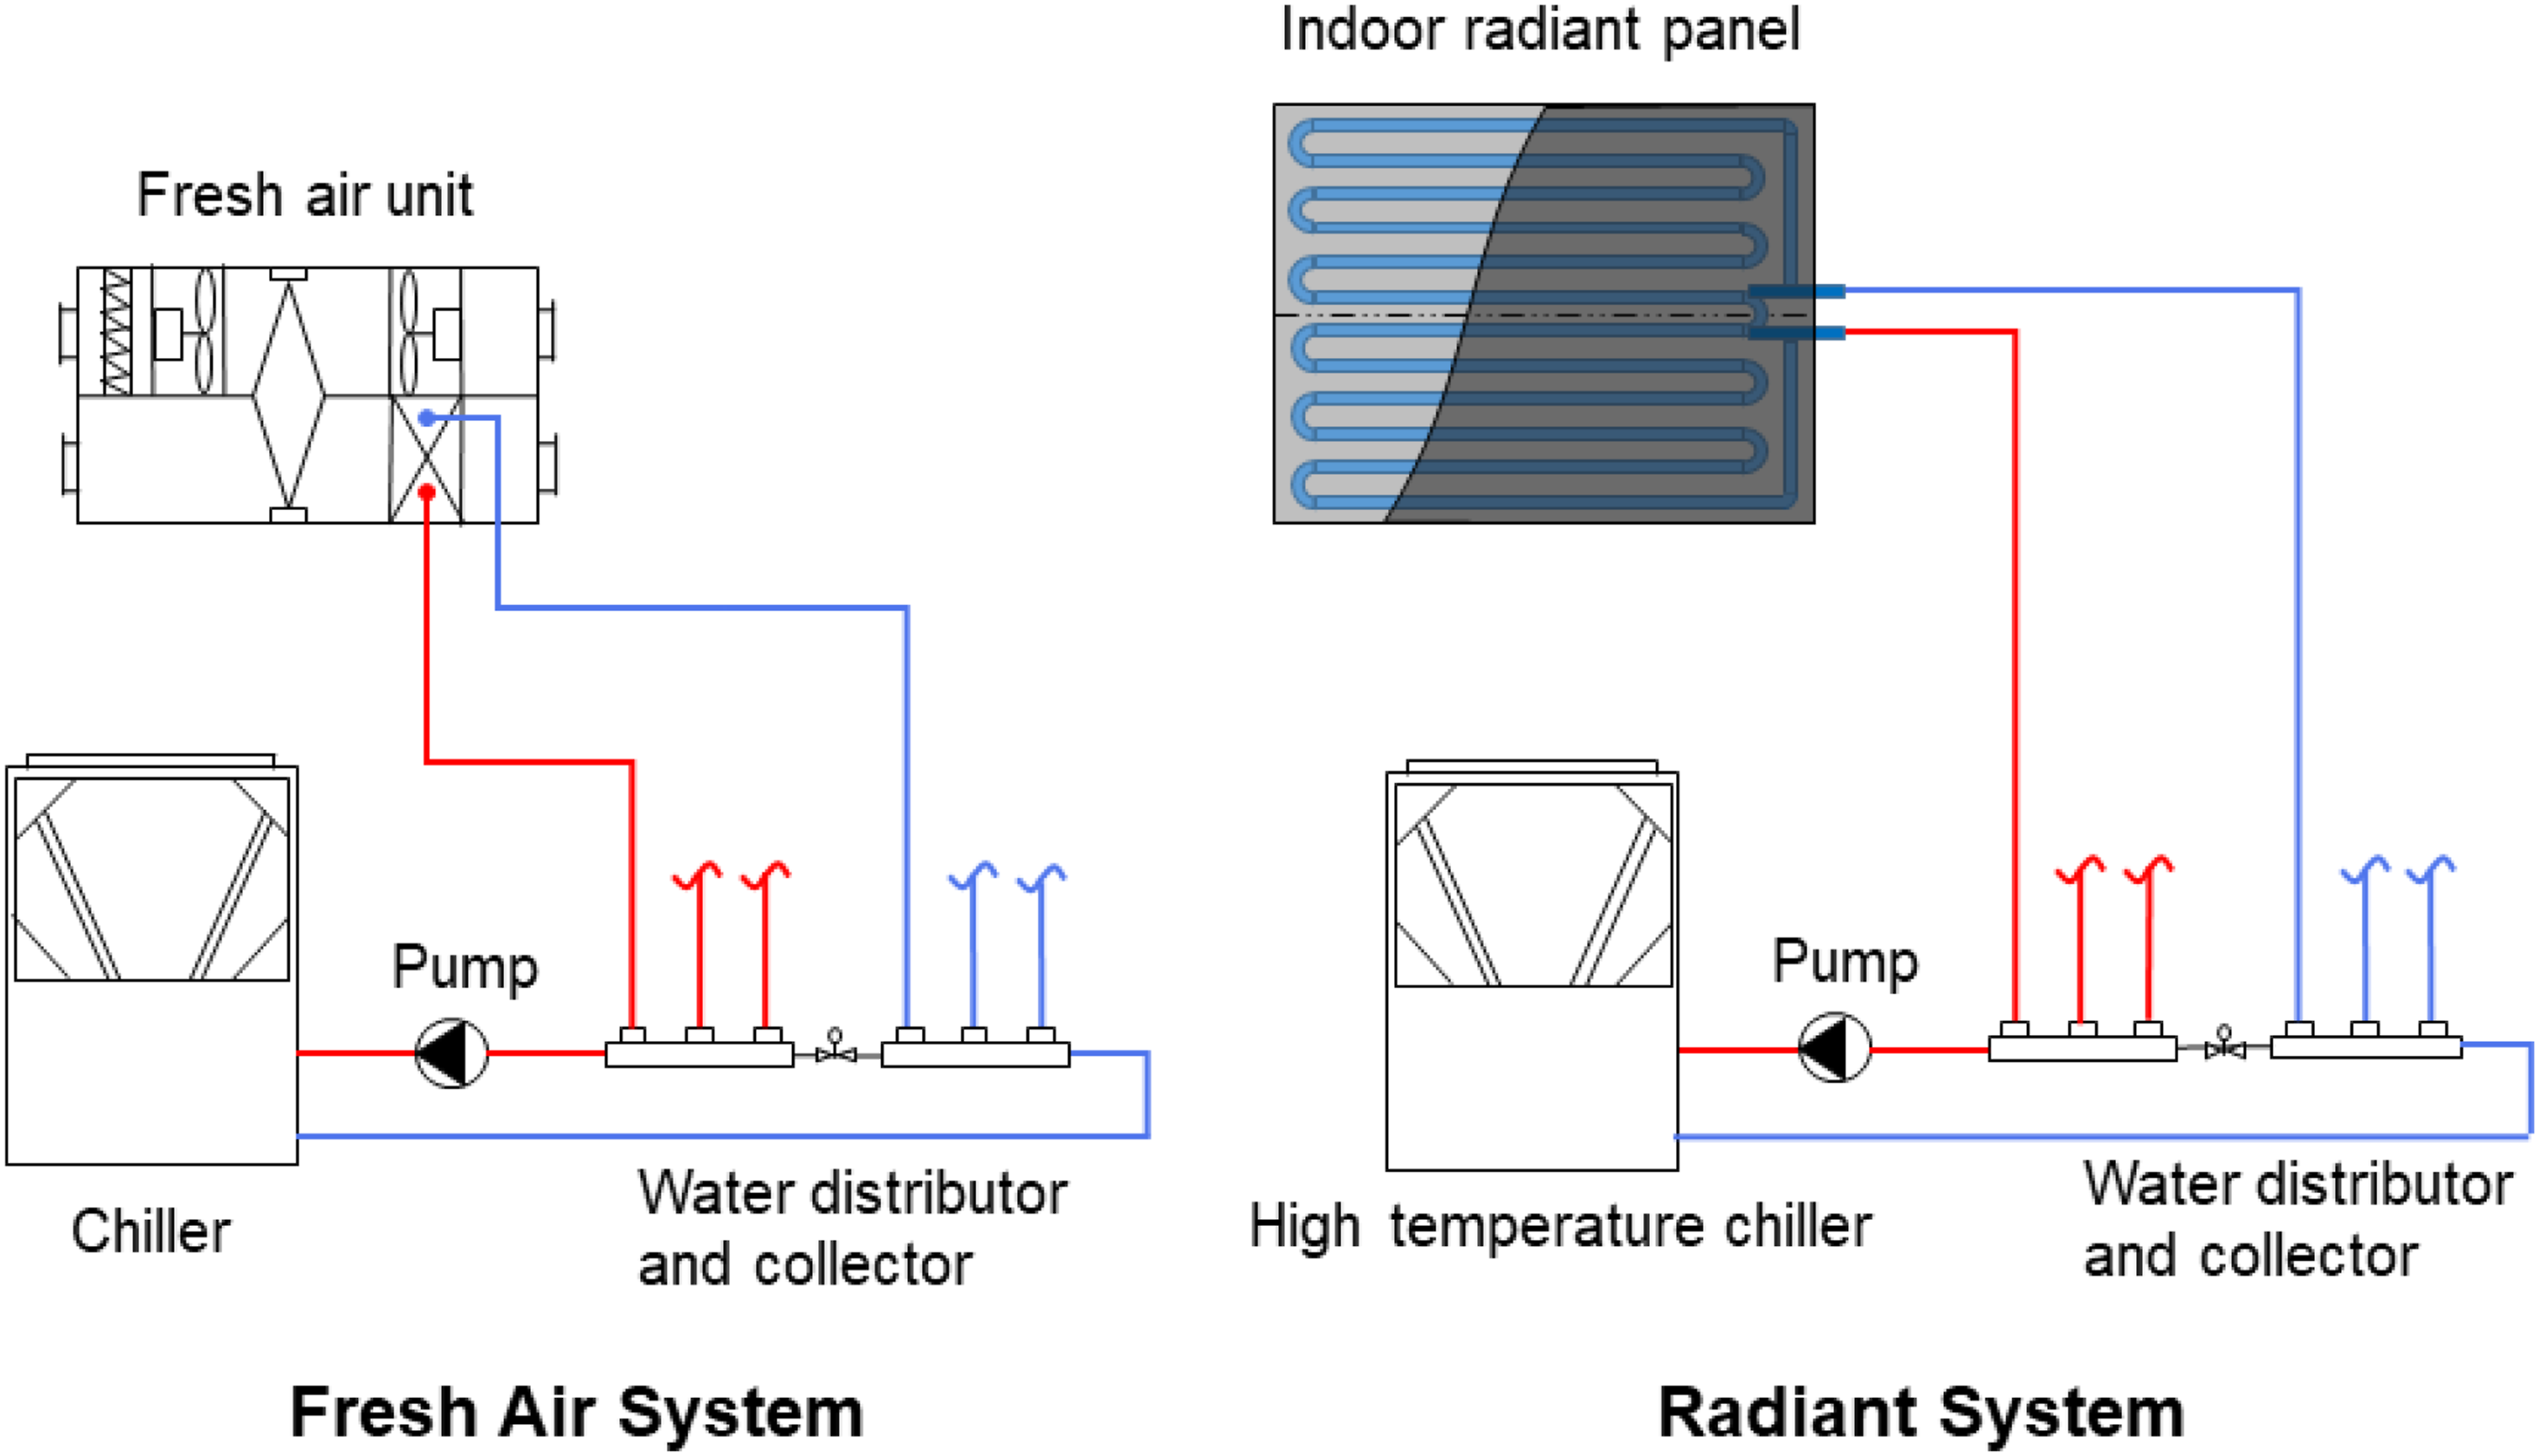
Electricity price model
Time-of-use tariff model.
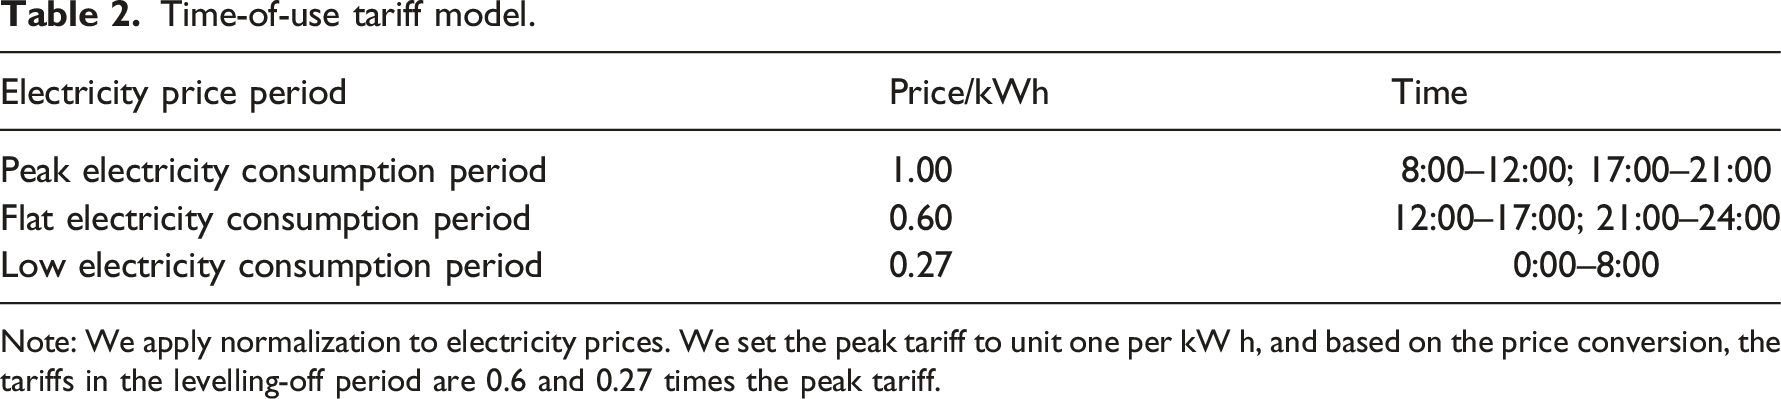
Note: We apply normalization to electricity prices. We set the peak tariff to unit one per kW h, and based on the price conversion, the tariffs in the levelling-off period are 0.6 and 0.27 times the peak tariff.
Indicators of thermal inertia
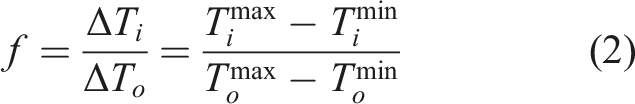
To analyse how the thermal storage of buildings responds to periodic external disturbances, researchers often rely on two indicators proposed by H. Asan: the delay time φ(h) and the attenuation coefficient ƒ.
30
These two indicators contribute to depict how the indoor temperature is delayed and attenuated by the outdoor temperature base on the thermal storage properties of the building envelope. The delay time φ(h) is defined in equation (1), while the attenuation coefficient ƒ is defined in equation (2):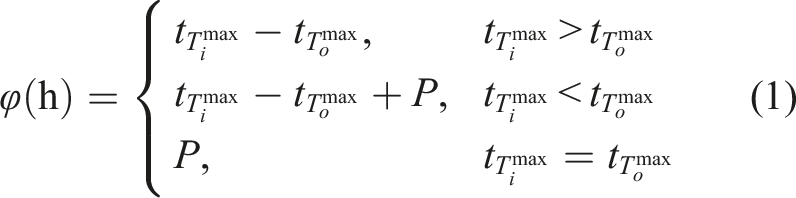
Demand response control strategies
Commonly, research uses two common demand response control strategies based on the thermal inertial of the building envelope: passive energy storage and global temperature reset. 31 These strategies involve changing the original indoor controlled parameters and adjusting them flexibly to reduce or shift load while considering the building use and type. Considering the thermal comfort advantages of radiant roof cooling systems, we utilize the PMV index as an indoor controlled parameter to manage the indoor thermal and humid environment. This study develops corresponding demand response strategies for the PMV-controlled parameter mode to study various performances of the radiant roof cooling system in terms of operational energy consumption and peak load shifting under different demand response strategies.
This study used three demand response control strategies: passive energy, global temperature reset, and passive energy storage-global temperature reset. We compared the optimized conditions with the reference condition without demand response control strategies to analyse their performances of the partial load rate, thermal environment parameters, thermal inertia index, operating economy, and load transfer rate under the PMV index mode.
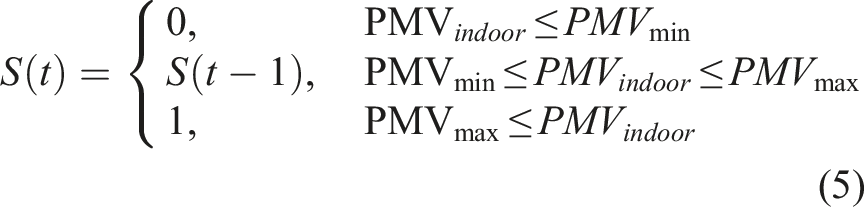
The radiation system intermittently starts and stops the high-temperature chiller to maintain the PMV value within a specific range. The TRNSYS simulation model sets the PMV threshold dynamically via the Type 14h component. Moreover, the thermostat controller Type108 component monitors the PMV feedback value and produces a control signal to manage the start and stop of the high-temperature chiller. The logic expression for this process can be observed in equations (3) -(5). Besides, during the occupied period, the fresh air system operates the traditional chiller to maintain the indoor relative humidity within the pre-set value. Table 3 shows the operating condition details.

Operating condition details.
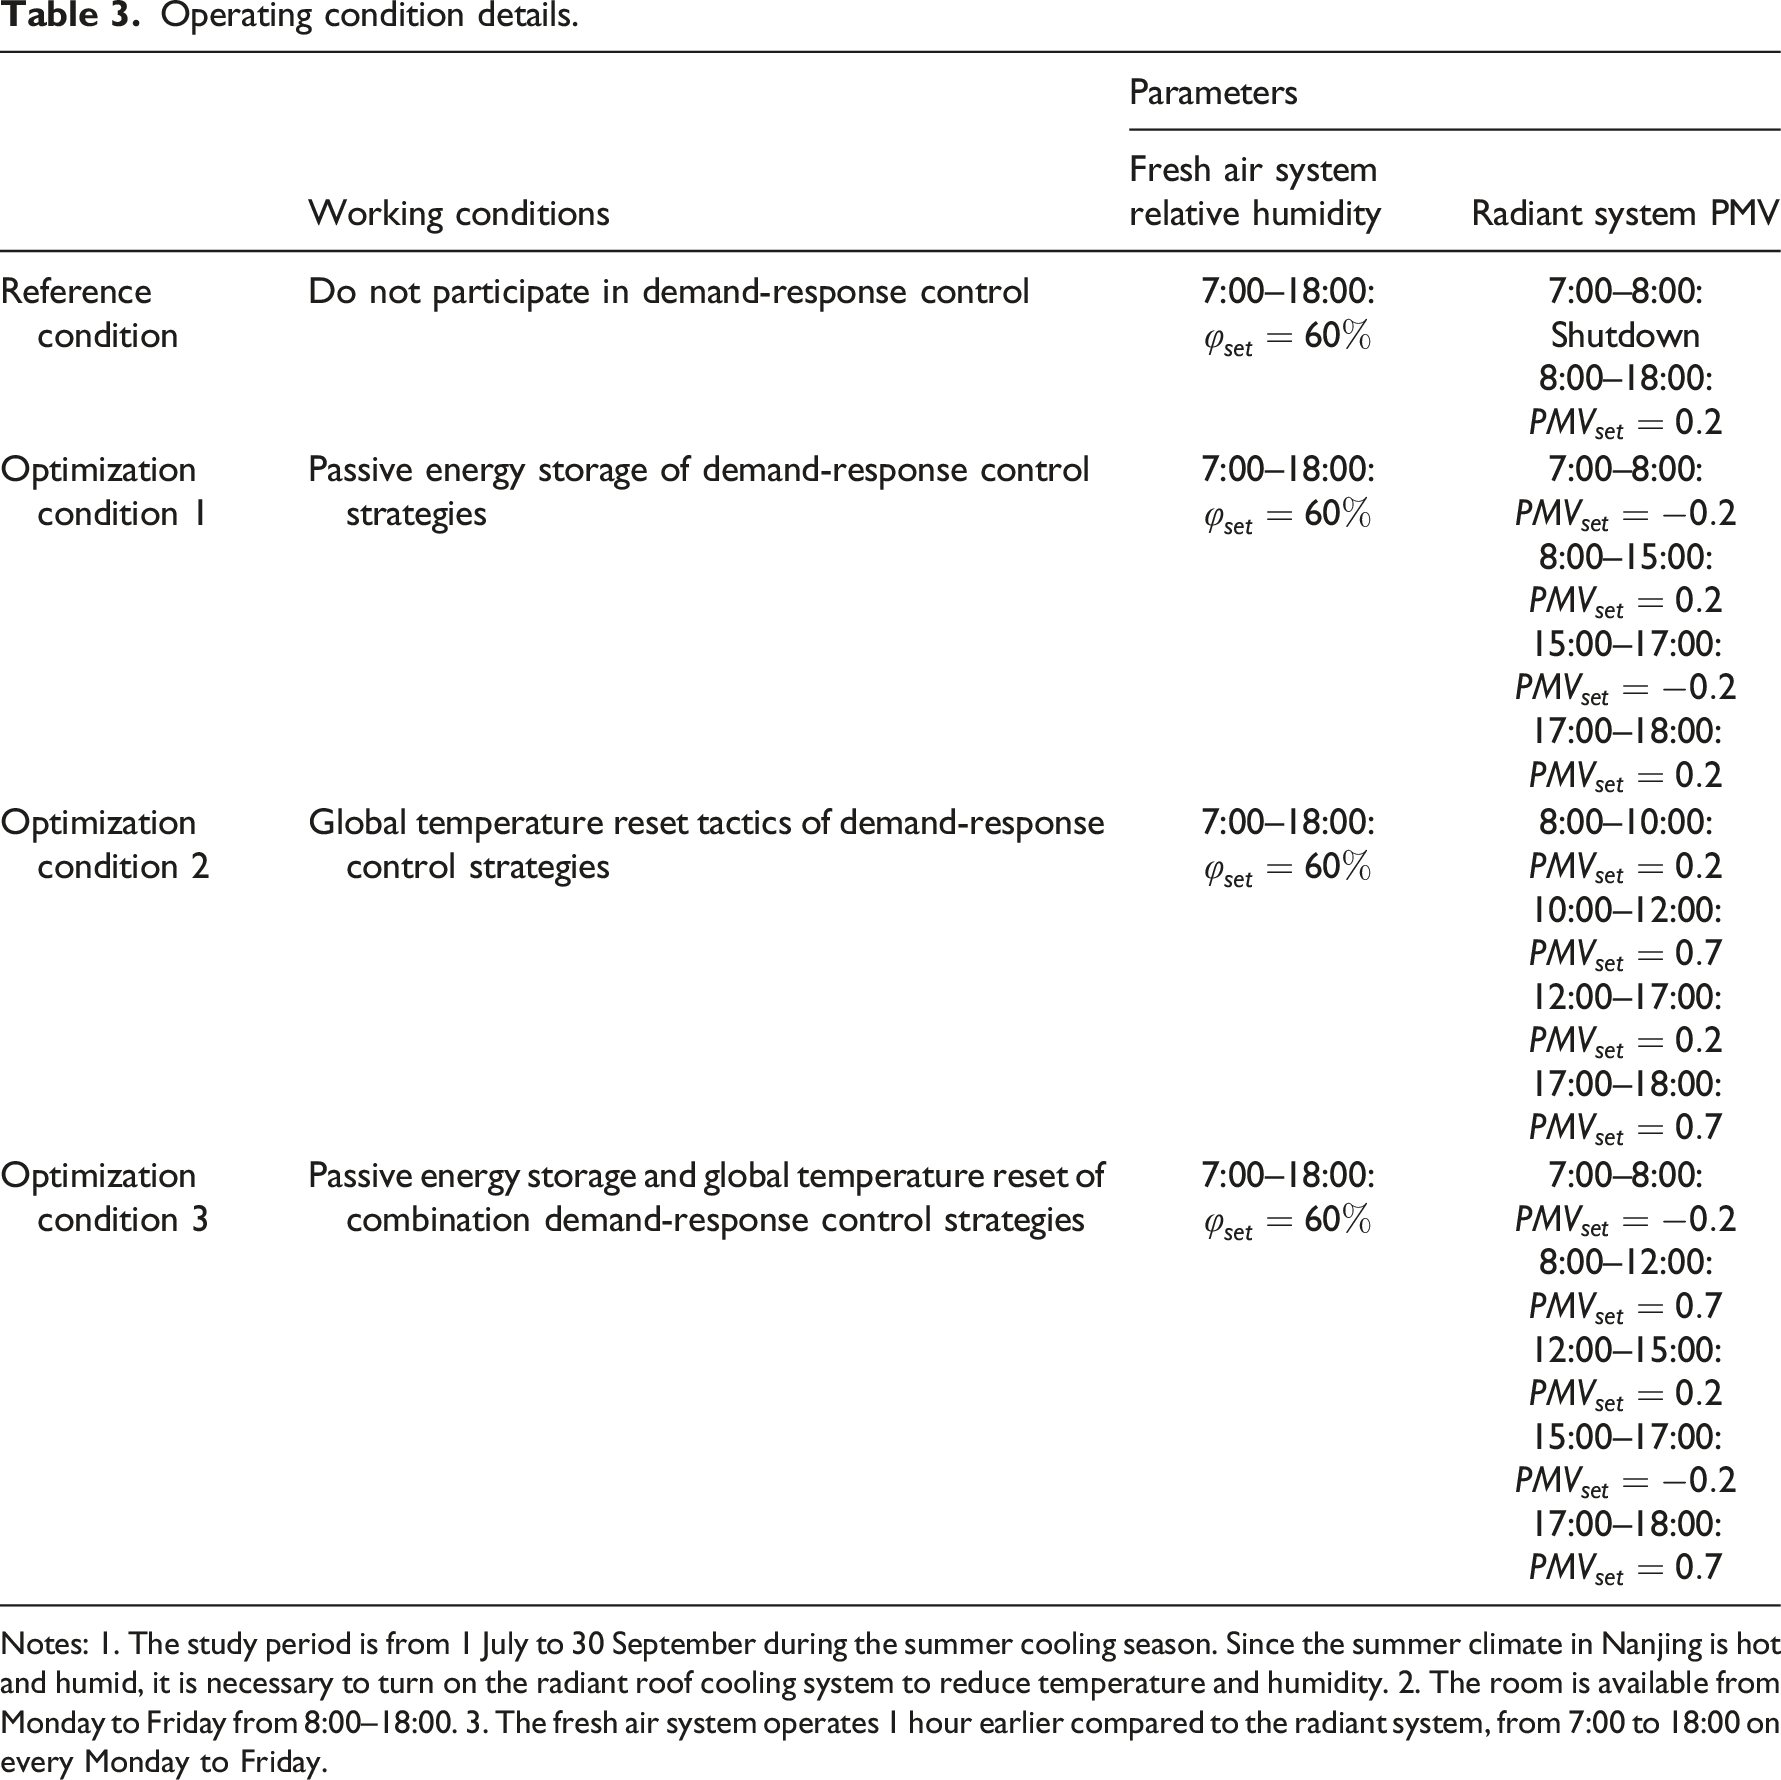
Notes: 1. The study period is from 1 July to 30 September during the summer cooling season. Since the summer climate in Nanjing is hot and humid, it is necessary to turn on the radiant roof cooling system to reduce temperature and humidity. 2. The room is available from Monday to Friday from 8:00–18:00. 3. The fresh air system operates 1 hour earlier compared to the radiant system, from 7:00 to 18:00 on every Monday to Friday.
Results and discussion
Changes in partial load factor and thermal environment parameters
During operation, initial setting values may cause deviations the initial period and the end-of-period data. We selected the middle period between August 1st and August 15th for analysis to eliminate this effect. We chose two typical days to clearly represent the differences between the optimization and reference conditions.
Based on the technical sample booklet provided by the manufacturer, it is evident that the peak cooling efficiency of the units occurred when they operated at partial load rate (PLR) within the 60%–90% range, with a maximum efficiency identified at PLR = 70%. We consider periods with a 70% and above load as high load periods to calculate the high load rate during the chiller occupancy period to evaluate the impact of demand-side response on the system.
By comparing the PLR of the high-temperature cooler for the four operating conditions during the study period, we find that Optimization Condition 1 has the most significant percentage increase in high load rate from 64.5% to 71%, as illustrated in Figure 3. Conversely, the high load rate period for Optimization Condition 3 decreases dramatically to only 51%, attributed to implementing the passive energy storage - global temperature reset combination demand response control strategy. During the implementation of the combination demand response strategy, the high-temperature chiller is shut down at a particular time, with a partial load rate of zero, which somewhat reduces the operation hours of the high-temperature chiller in the occupied period. Therefore, the high-temperature chiller unit can operate more efficiently by implementing demand response control strategies for radiant roof cooling systems based on the thermal inertia of the building envelope. Diagram of PLR changes under different working conditions: (a) Reference Condition, (b) Optimization Condition 1, (c) Optimization Condition 2, (d) Optimization Condition 3.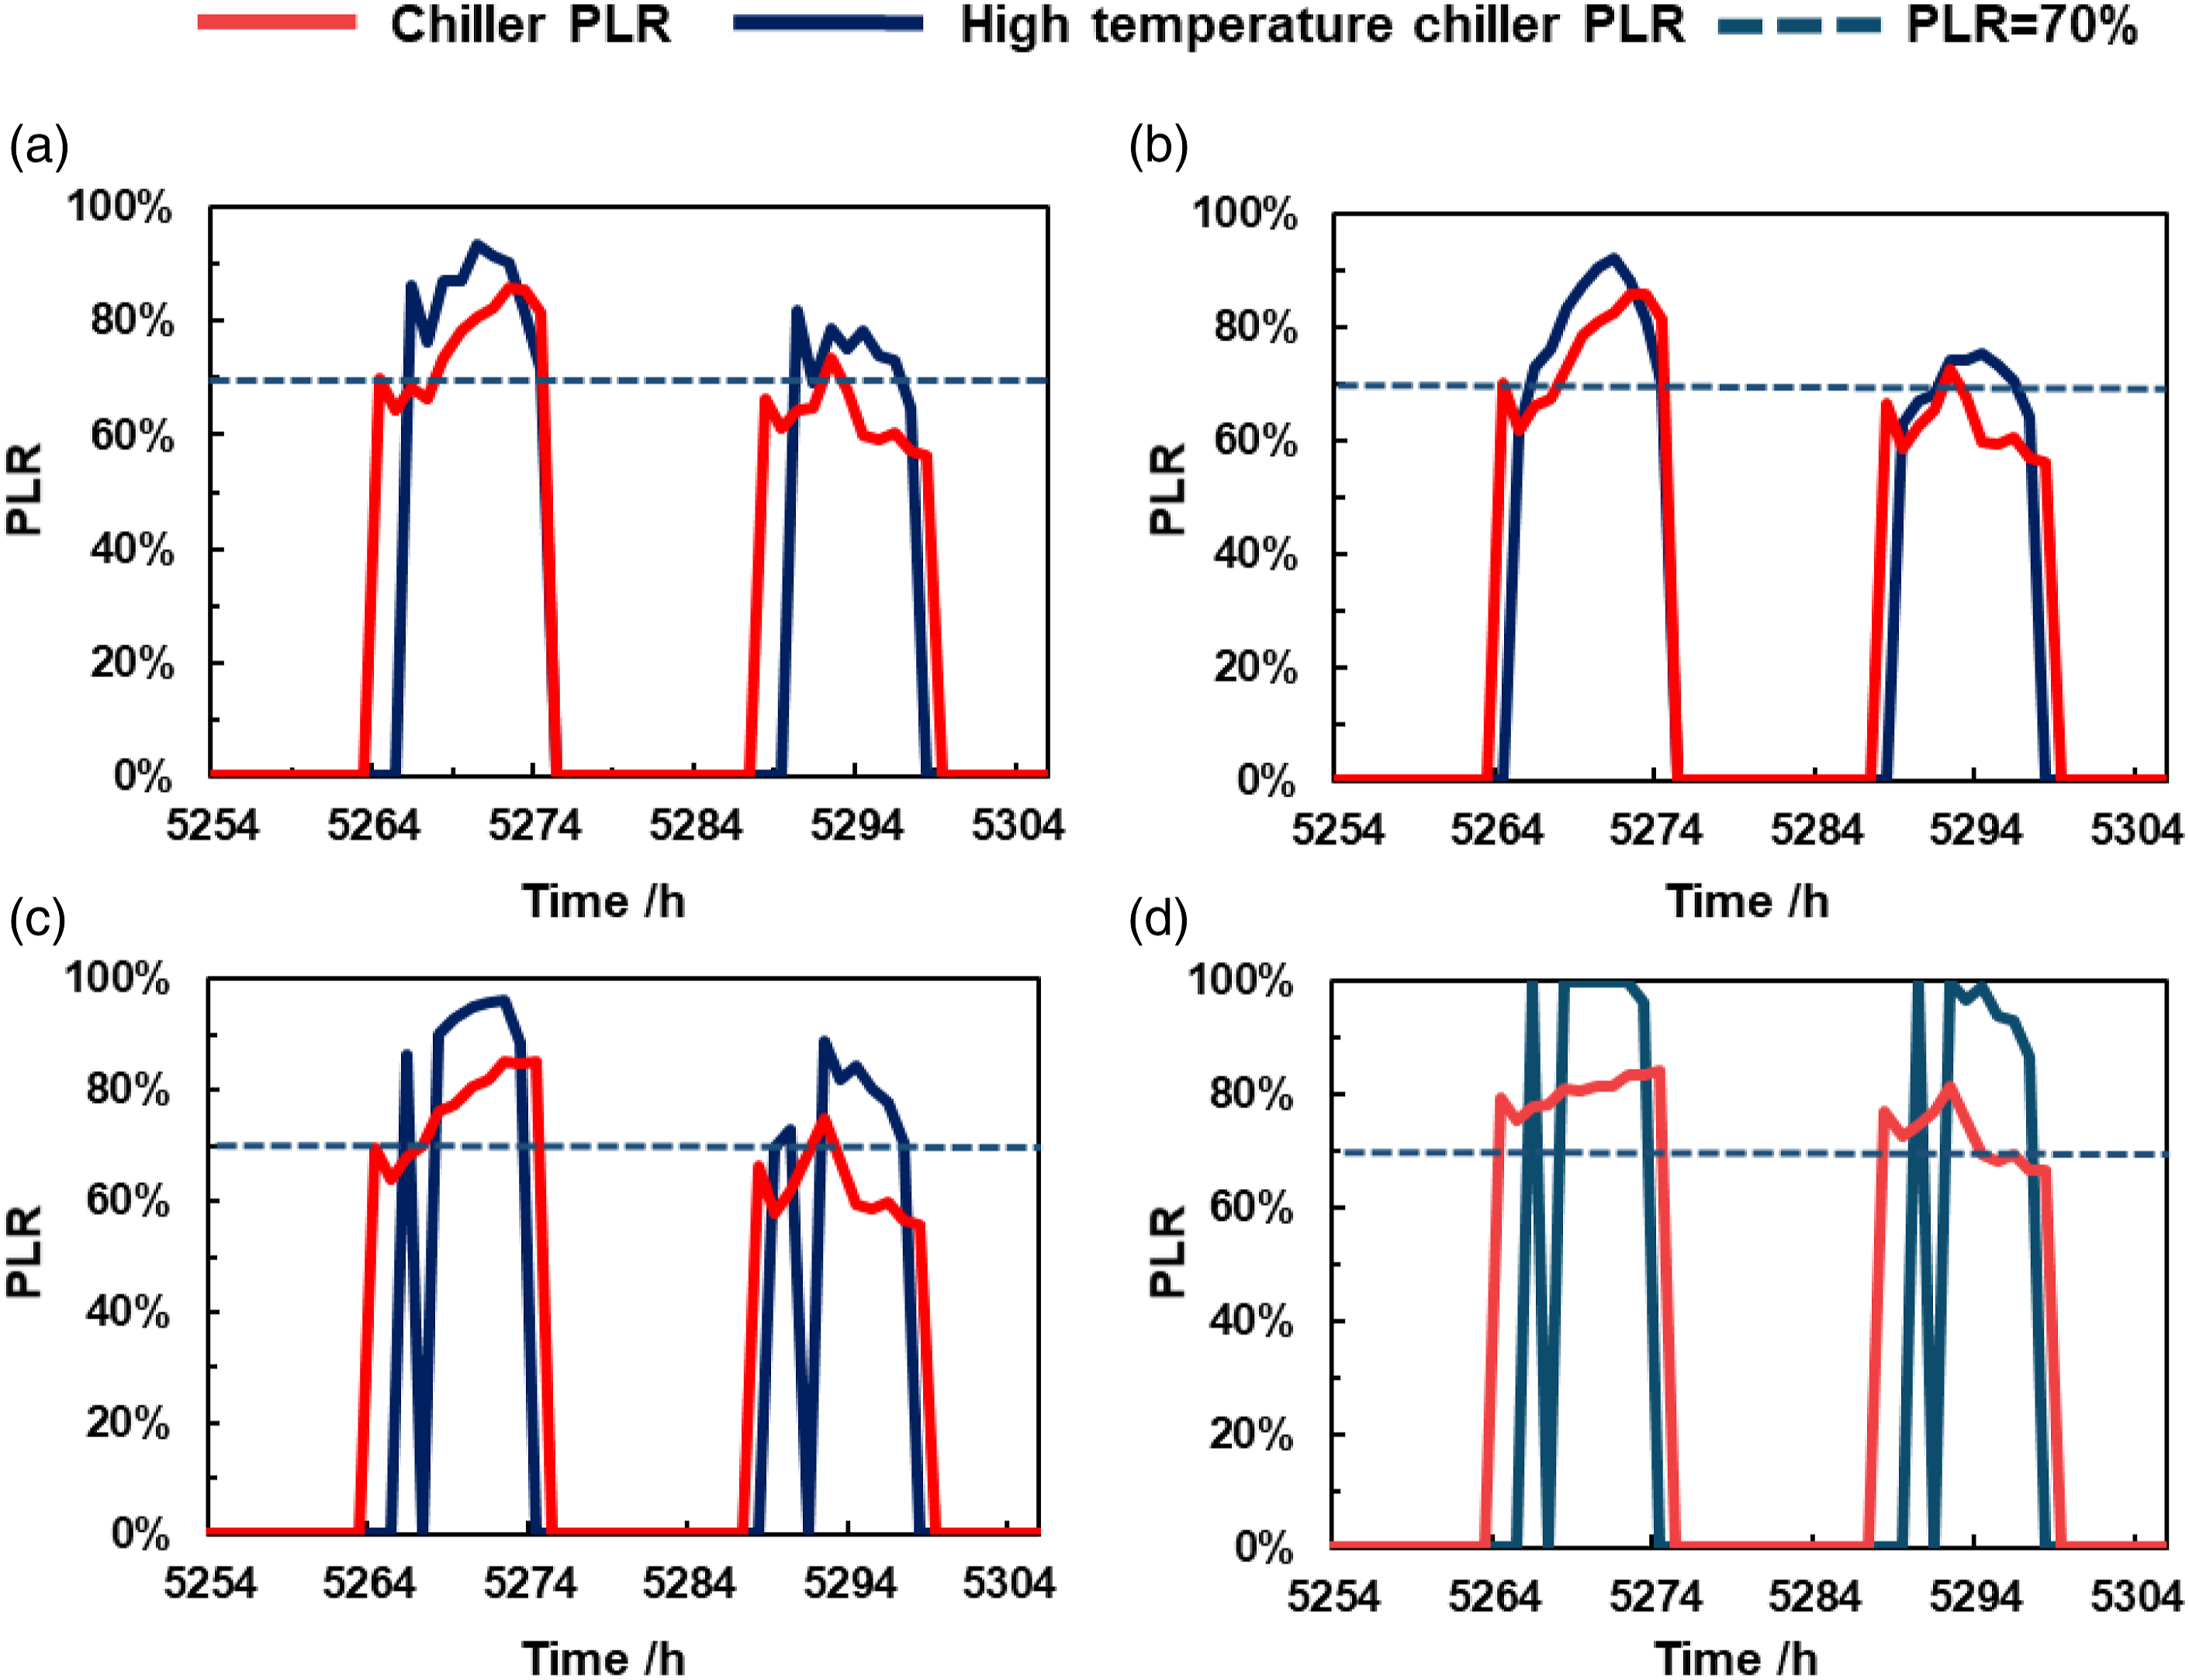
Figure 4 displays several thermal environment parameters, including the indoor dry-bulb temperature, the dew point temperature, and the PMV indicator variation. Upon comparing the indoor dry-bulb temperature curves, it becomes evident that there is a significant drop in temperature in the first hour of the occupation period. This decrease is due to the fresh air system cooling and dehumidifying the office 1 hour ahead of schedule to ensure that the radiant roof cooling system can be switched on in time and guarantee thermal comfort during the occupancy period. In the four operating conditions, the dew point temperature curves are below the water supply temperature of 18°C, preventing condensation during operation. Looking at the PMV curves, we can observe that the fluctuation range of the PMV values for Optimization Condition two and Optimization Condition 3 are relatively large compared to the Reference Condition. Specifically, Optimization Condition two exceeds a PMV value of 1.0 for 3.63% of the time, while Optimization Condition 3 surpasses this value for 7.43% of the periods. These findings suggest that implementing the global temperature reset demand response control strategy alone or for extended periods can negatively impact the indoor thermal environment based on the thermal capacity of the envelope. Changes in thermal environment parameters under different working conditions: (a) Reference Condition, (b) Optimization Condition 1, (c) Optimization Condition 2, (d) Optimization Condition 3.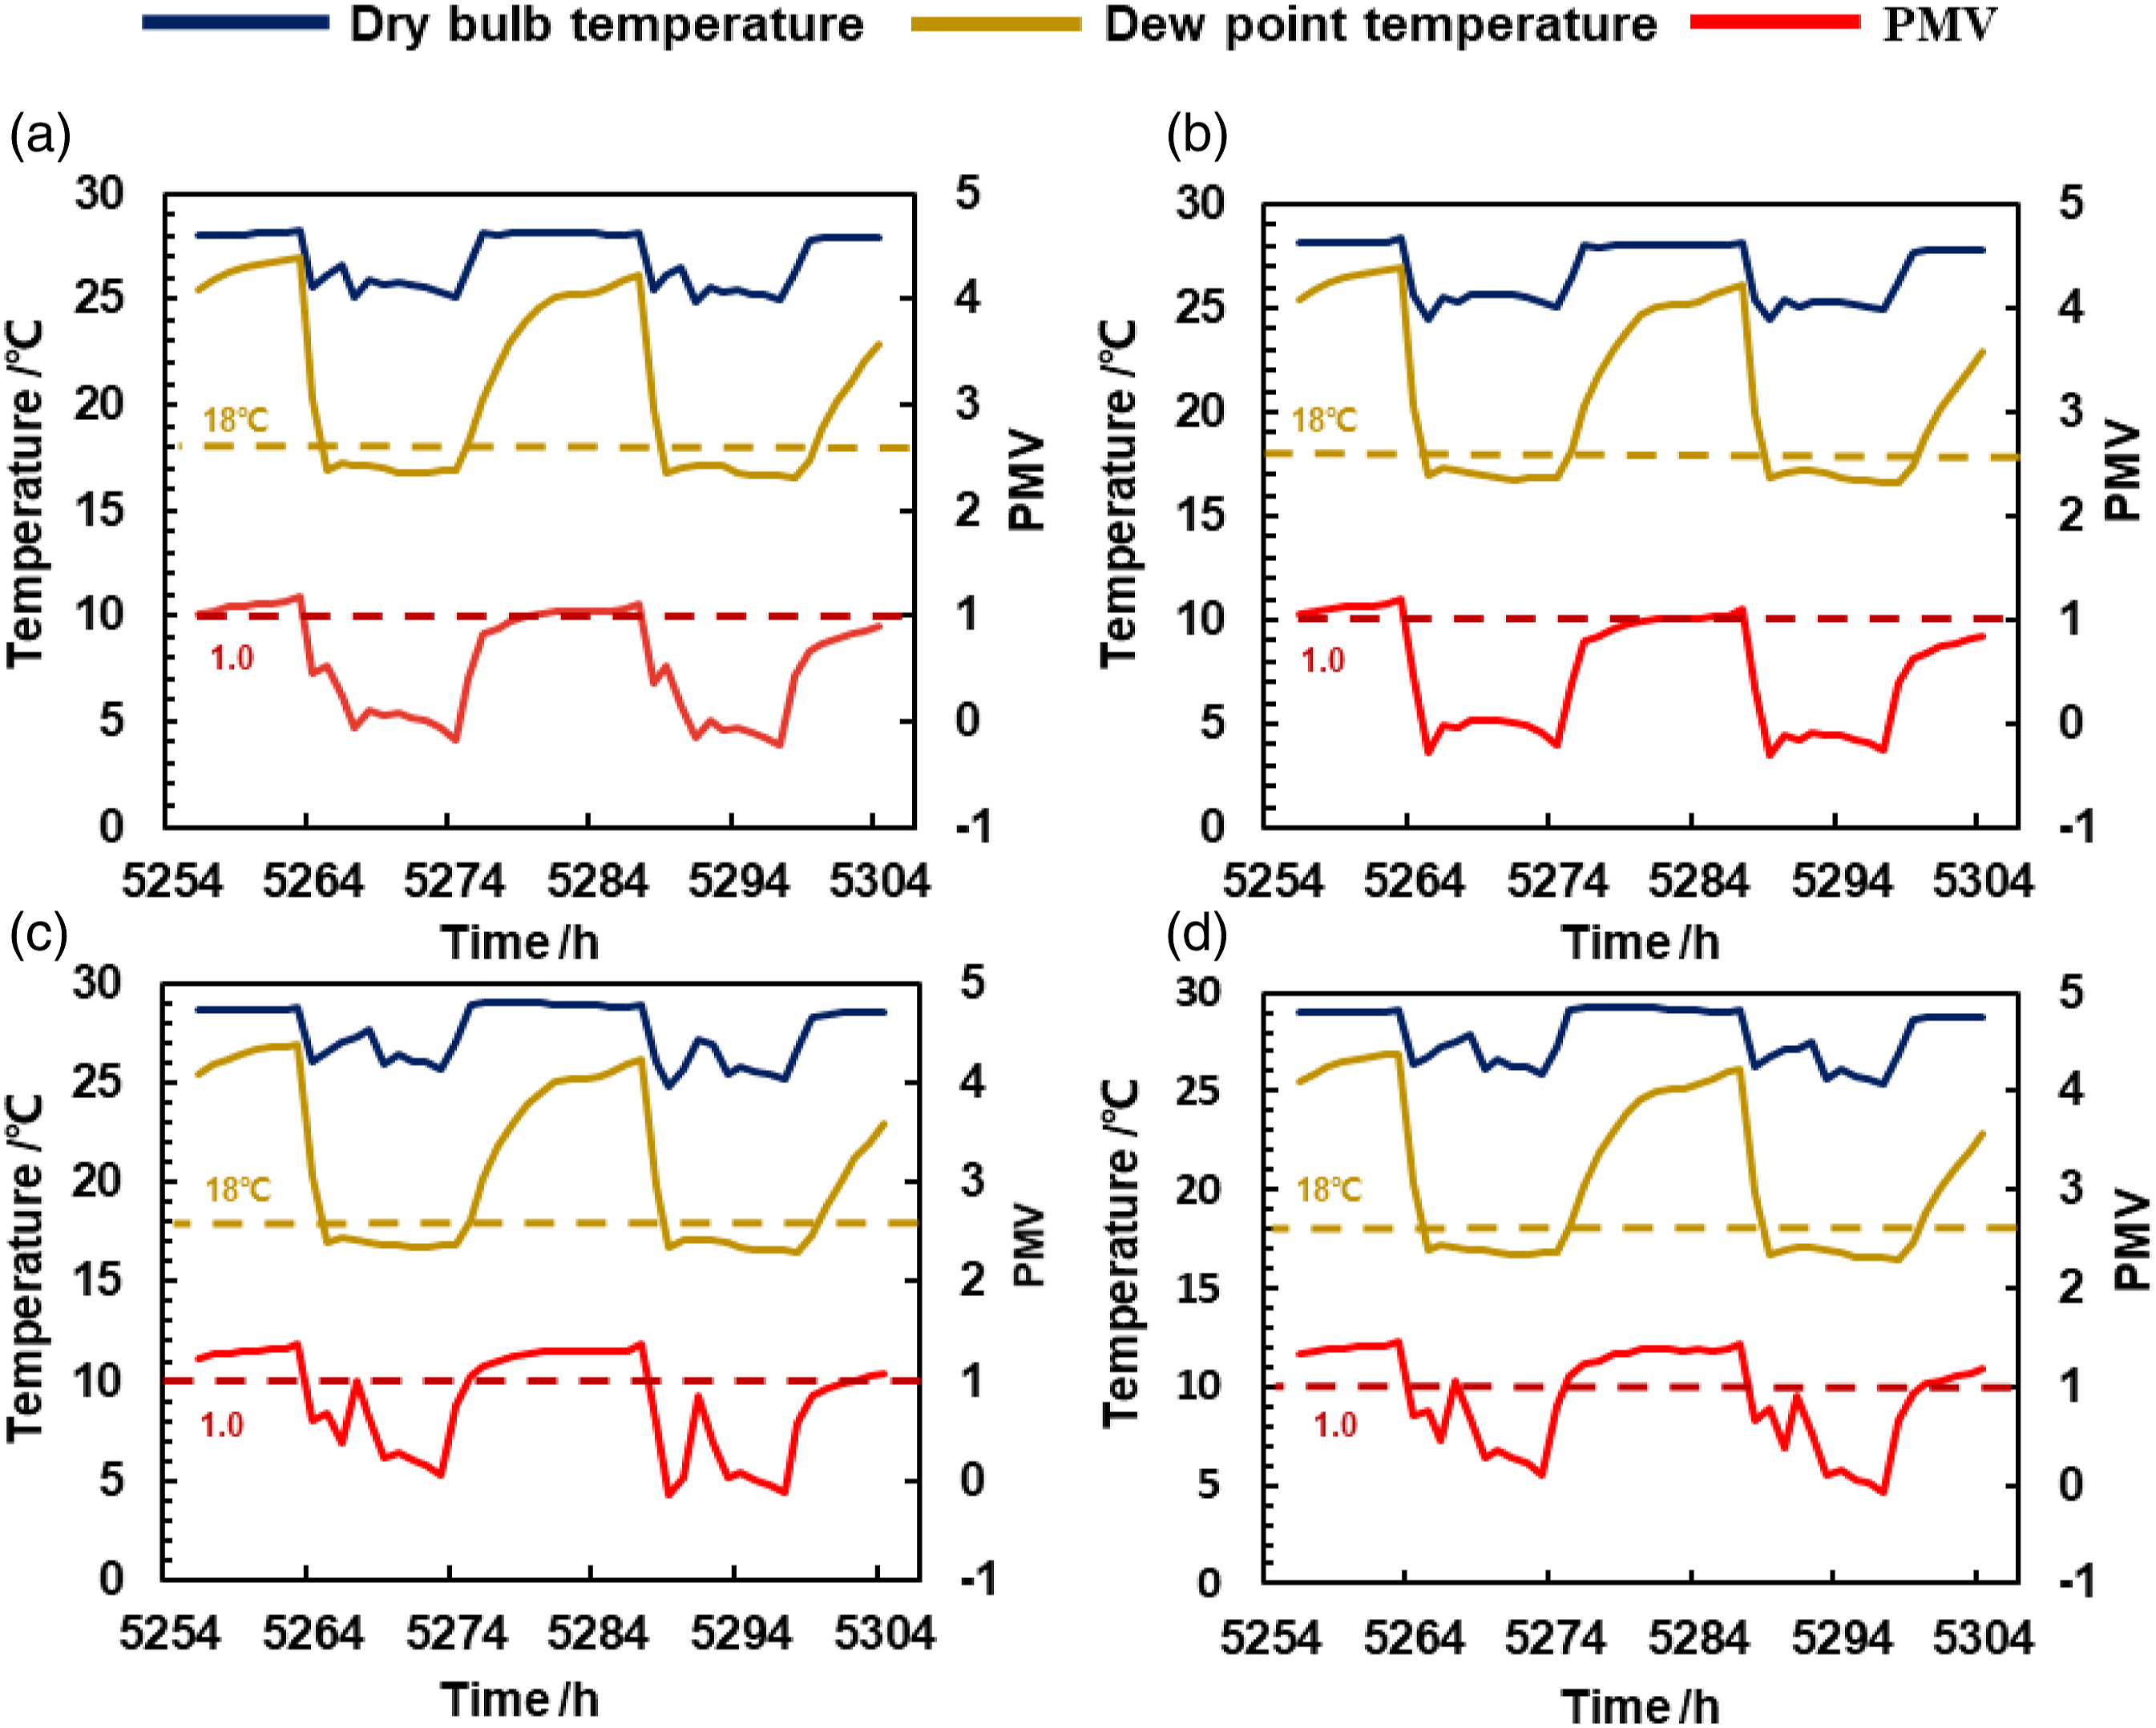
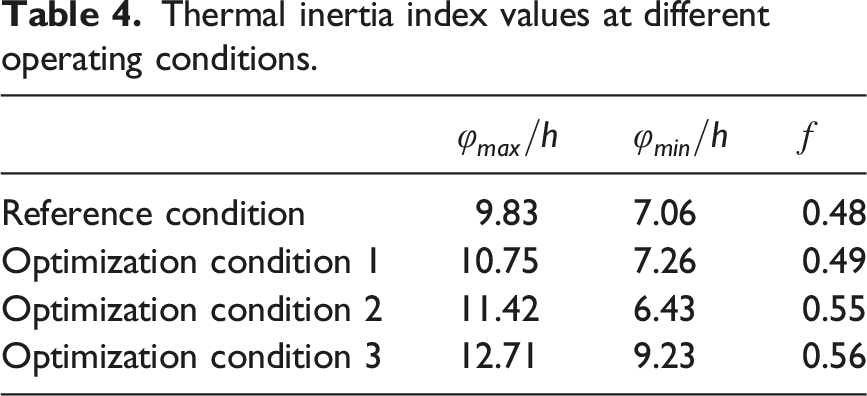
Thermal inertia index results
Thermal inertia index values at different operating conditions.
Electricity consumption and economic analysis
As shown in Figure 5, the operating costs of the optimization conditions have all been reduced to some extent. Optimization Condition 1 has a slight increase in electricity consumption but a decrease in electricity costs. The reduction in electricity costs for Optimization Condition two and Optimization Condition 3 is more significant than the reduction in electricity consumption. Both the increase in electricity consumption but the decrease in electricity costs and the decrease in electricity costs outweighing the decrease in electricity consumption can be attributed to the implementation of demand response control strategies to achieve load shifting, resulting in a reduction in electricity consumption during peak tariff hours and a shift to flat tariff hours. Distribution of energy consumption and electricity costs under different working conditions.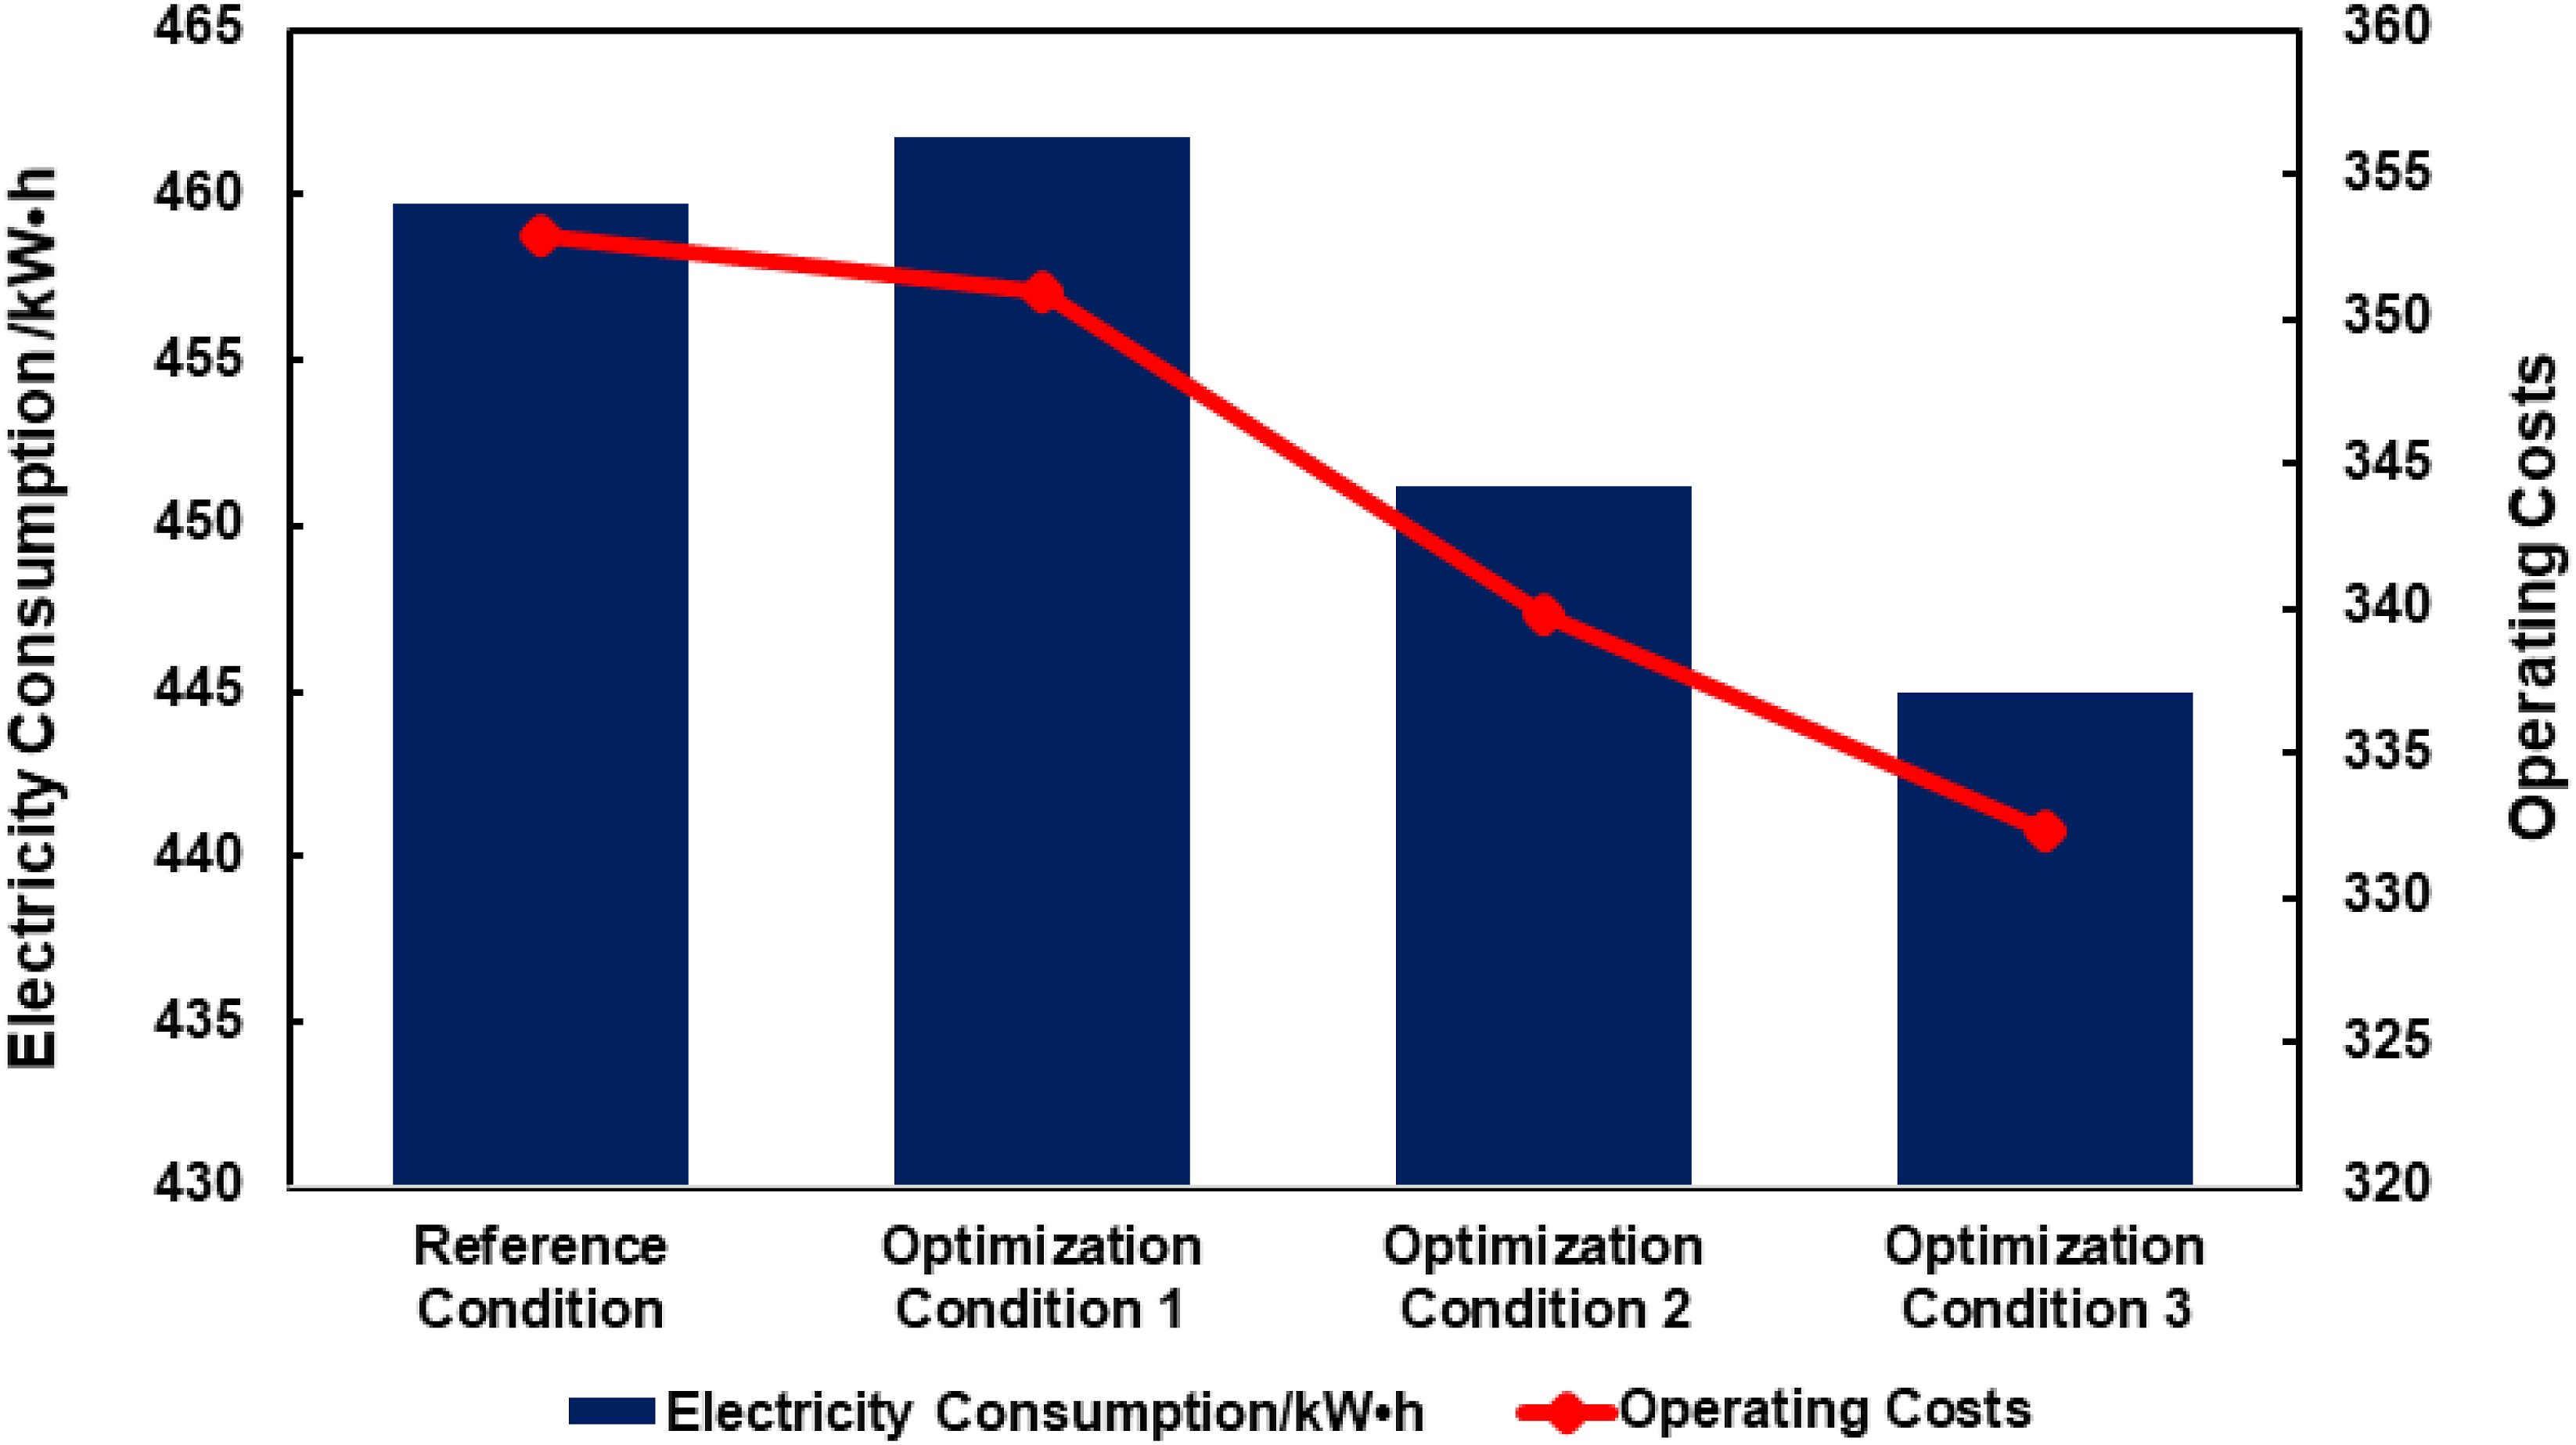
Load shift situation
To assess the impact of the demand response control strategy’s optimization conditions, we introduce the load transfer rate as a metric for energy transfer evaluation. The load transfer rate 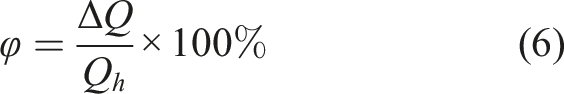
Based on the findings in Figure 6, we can observe a decrease in electricity consumption during peak hours for all optimization conditions compared to the Reference Condition. Conversely, energy consumption drastically increases during flat tariff hours. These results highlight the effectiveness of demand response control strategies in shifting energy utilization away from peak tariff hours towards flat tariff hours to improve the grid load balance between peak and non-peak periods. Among the different optimization conditions, Optimization Condition 3 stands out. Implementing the passive energy storage-global temperature reset combination demand response strategy can better achieve peak load shifting. Specifically, Optimization Condition 3 achieves a peak load shifting rate of 19.84%. Comparison of electricity consumption during peak electricity price, flat electricity price and low electricity price under different optimization conditions.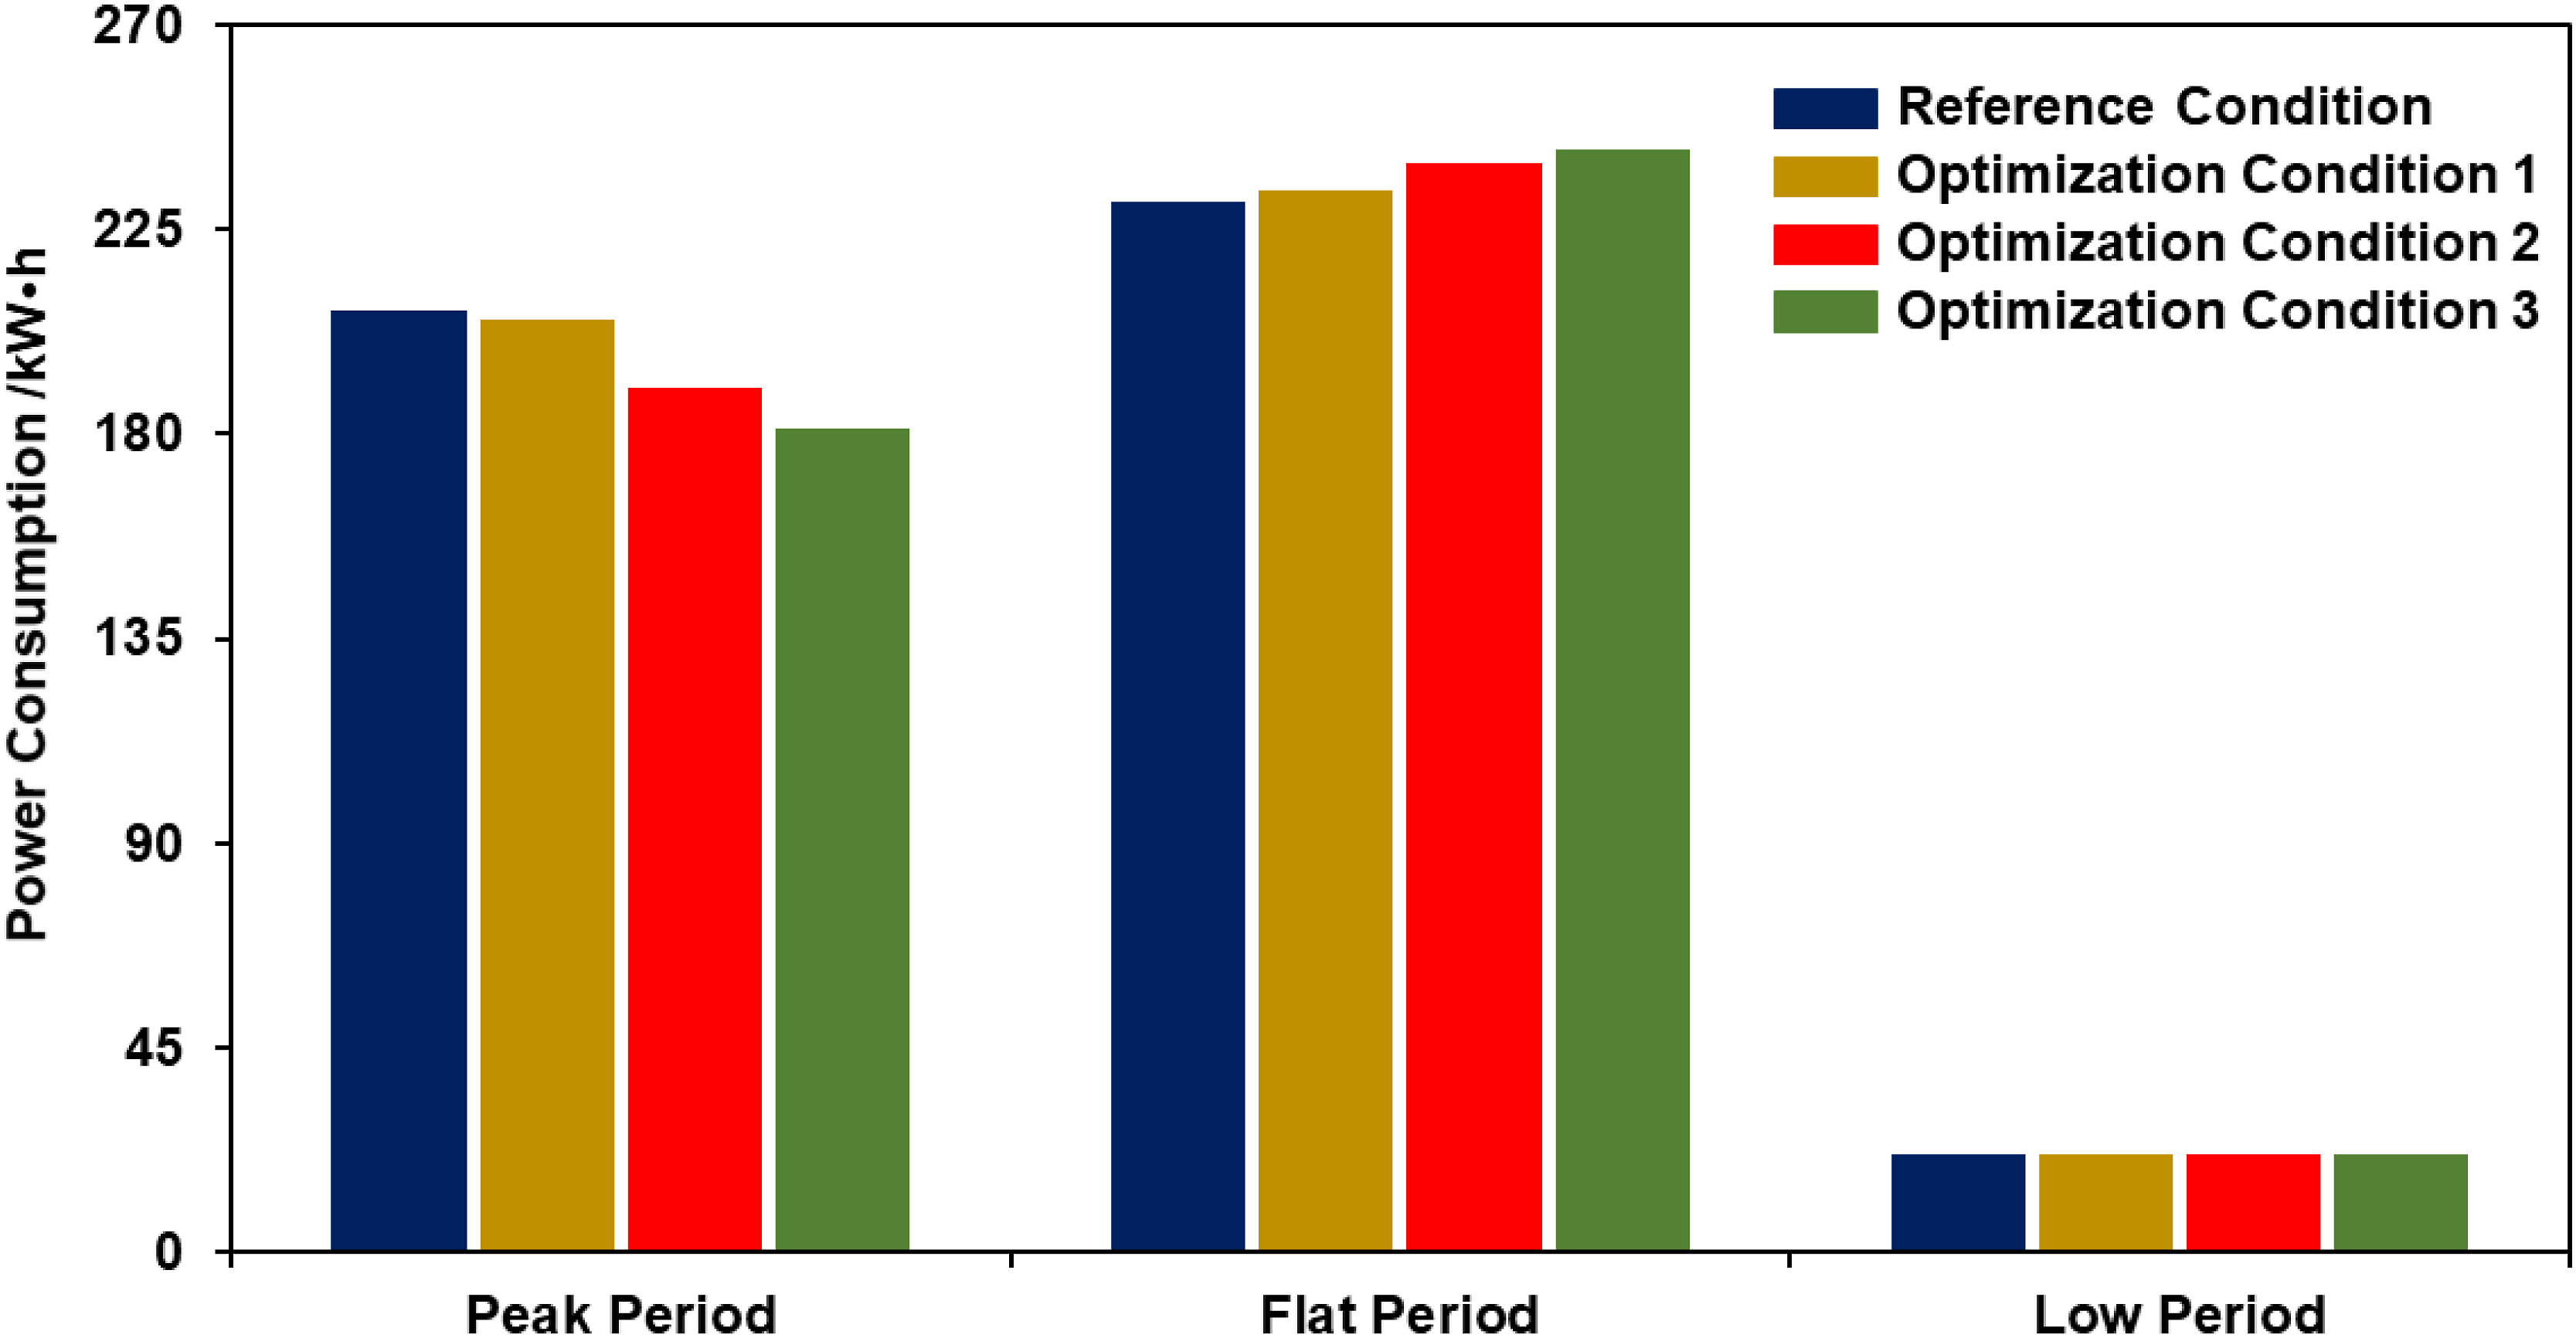
According to Figure 7, the load transfer rate is significantly higher in Optimization Condition two and Optimization Condition 3 compared to Optimization Condition 1. Utilizing the global temperature reset demand response strategy helps improve the peak load transfer rate, thereby addressing the power system’s supply-demand imbalance. In contrast, although there is a significant decrease in the outdoor dry bulb temperature on 9th August compared to 10th August, the peak load transfer rate on 9th August is the highest. This is because as the outdoor dry bulb temperature increases, the surface temperature rises of the envelope, leading to a substantial increase in radiant heat transfer between the building envelope and the radiant roof and the reduction of the building envelope’s thermal inertia, resulting in a decrease in peak load. Therefore, while the demand response control strategy based on the thermal inertia of the building envelope has limitations, it exhibits good peak load transfer capability. Peak load transfer rate change in August.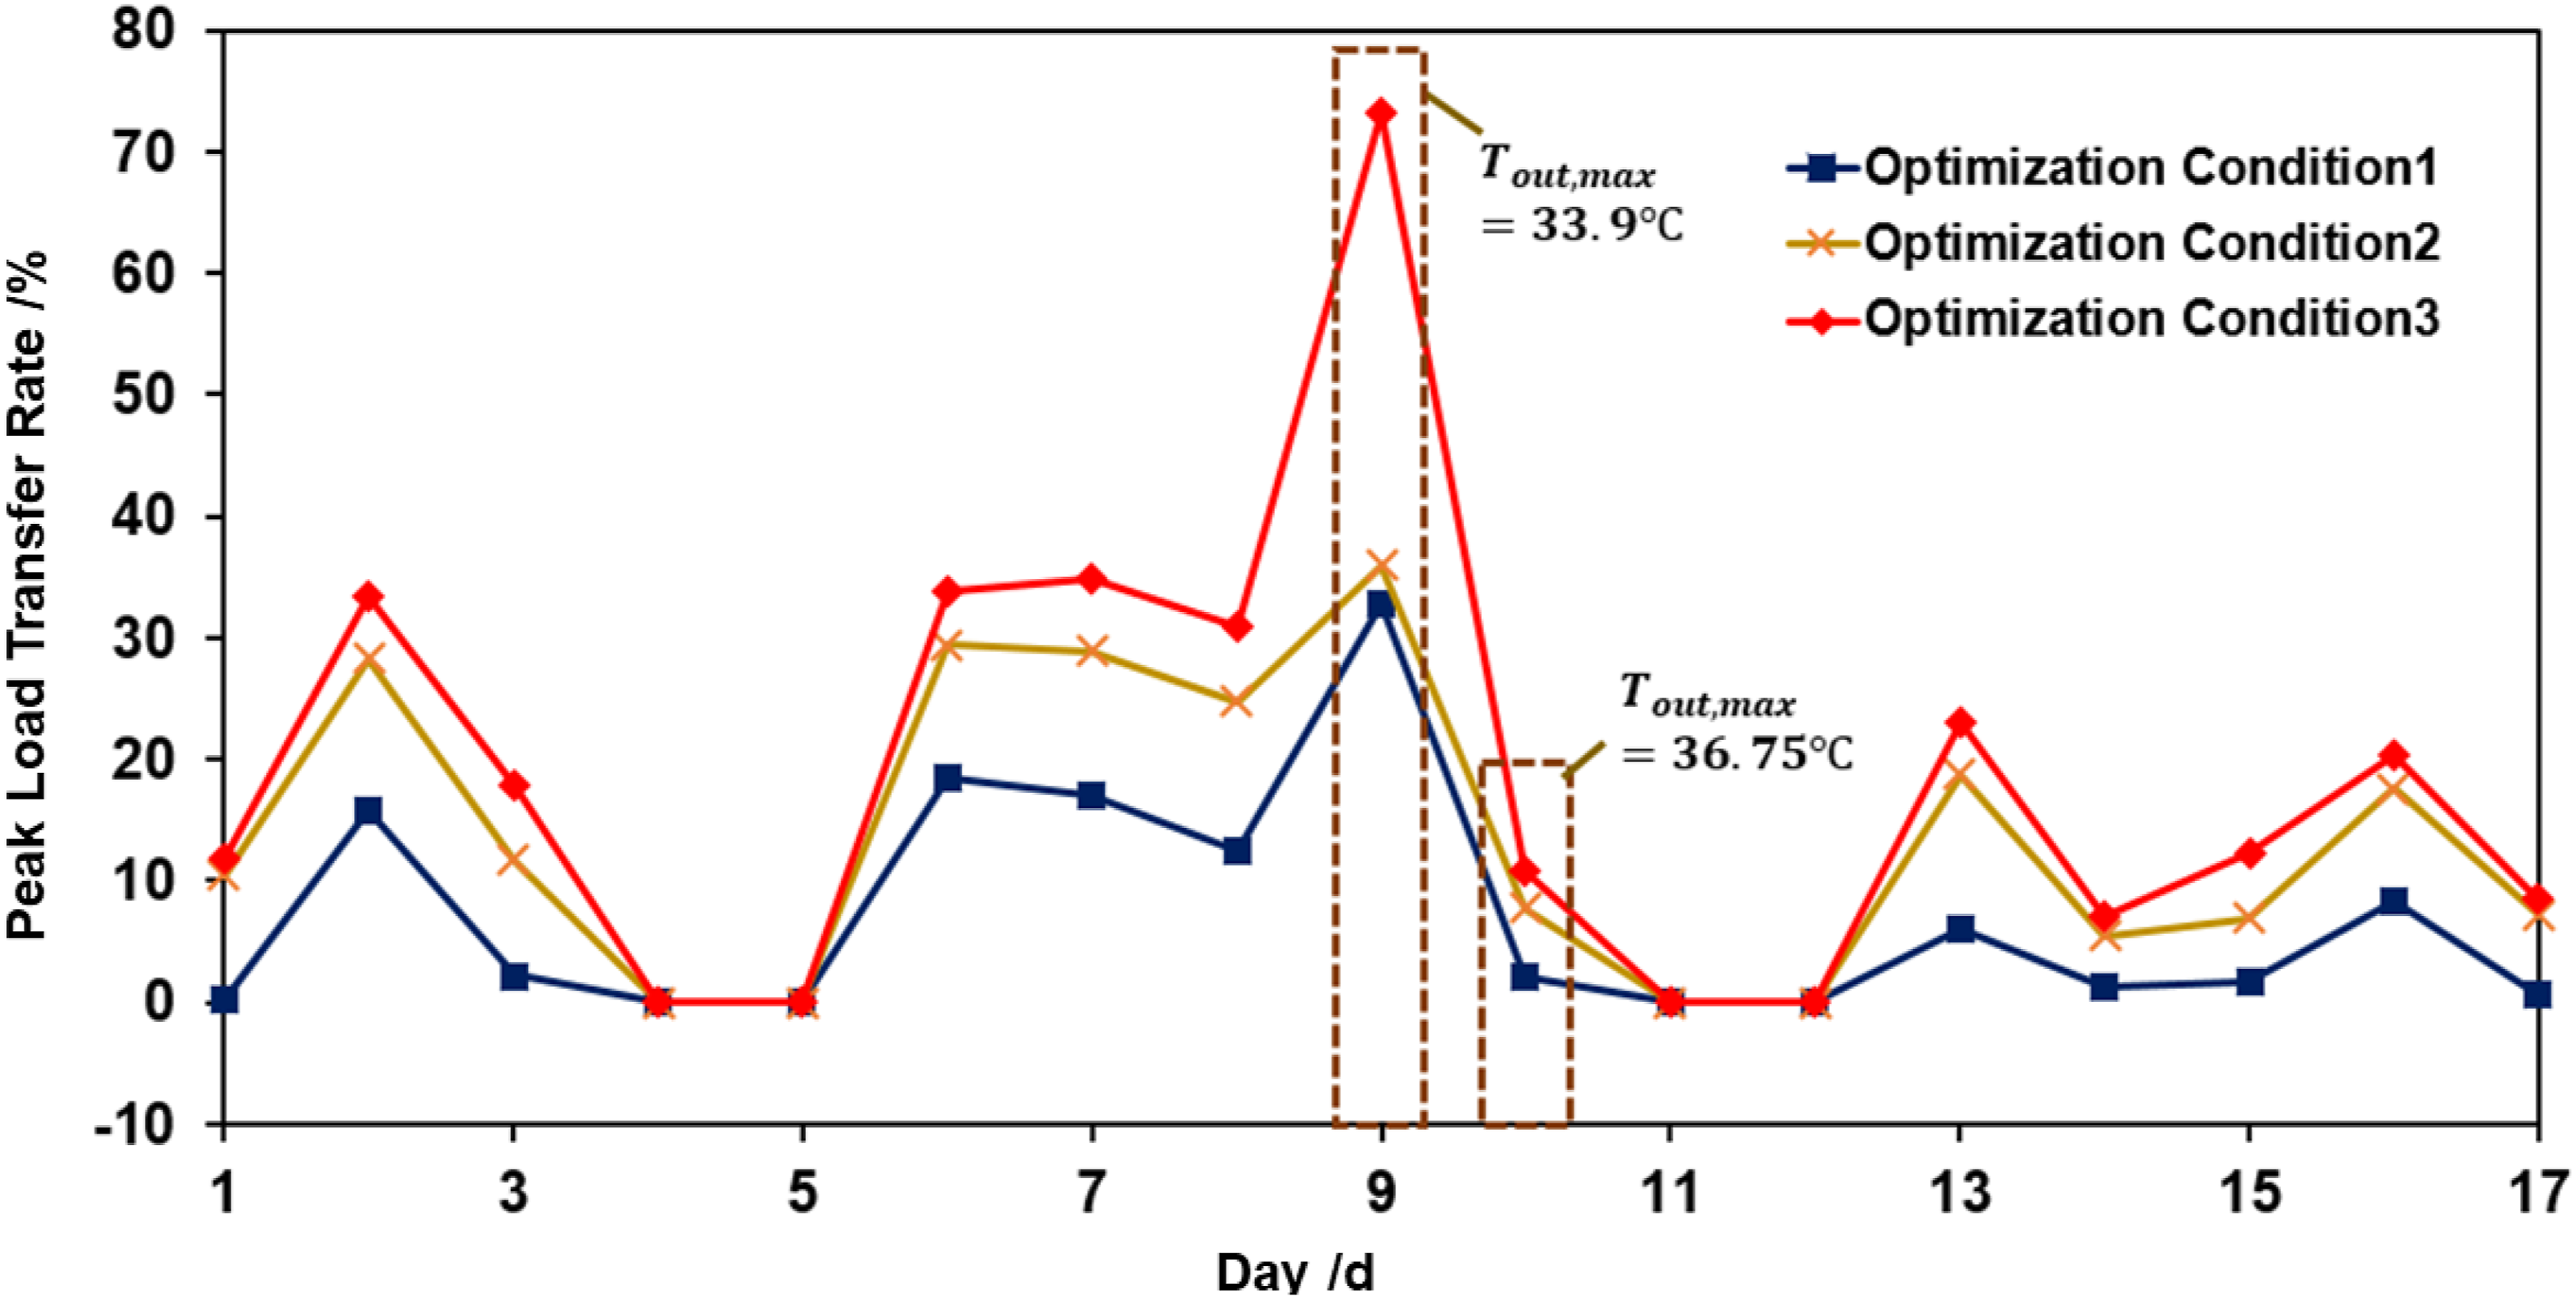
Conclusion
The study utilizes the TRNSYS model to investigate the demand response potential of a radiant roof cooling system in a commercial office building under PMV control mode. The objective of the research was to examine the feasibility of implementing a demand response control strategy for radiant roof cooling systems to participate in “peak and valley reduction” of the power system. Based on the thermal inertia of the building envelope, we analyzed the thermal comfort, energy consumption, operating costs, and peak load shifting rates during each operating period. The following conclusions were drawn: (1) Implementing all three demand response strategies can ensure efficient unit operation while shifting peak loads, thereby reducing electricity costs and alleviating the imbalance between supply and demand in the power system. (2) Implementing the passive energy storage-global temperature reset composite demand response strategy has a more effective load-shifting during peak periods, resulting in a load-shifting rate of 19.84%. Additionally, this strategy provides a better operational economy throughout the cooling season. However, prolonged use of the global temperature reset demand response control strategy may lead to a decline in the indoor thermal environment. (3) The demand response control strategy based on the thermal inertia of the building envelope is influenced by the outdoor meteorological conditions in terms of peak load shifting and has certain limitations: when the outdoor dry bulb temperature is high, the peak load rate decreases; when the outdoor dry bulb temperature is low, it can better participate in the “peak and valley reduction” of the power system.
Footnotes
Declaration of conflicting interests
The author(s) declared no potential conflicts of interest with respect to the research, authorship, and/or publication of this article.
Funding
The author(s) received no financial support for the research, authorship, and/or publication of this article.