
Abstract
As an important supplement of conventional fixed-route public transit, flexible transit services draw more attention in low-demand areas recently. Demand-responsive connector is one of those flexible transit services and has already been operated as feeder transit in some cities. This article concentrates on the vehicle routing operation of the demand-responsive connector system with on-demand stations. A two-stage routing model is proposed to minimize the system cost, considering both the service provider and riders, and two solution algorithms are proposed and compared for the routing model. A simulation experiment based on a real-life case study in Nanjing city is conducted to demonstrate the applicability of the proposed vehicle routing model. The results demonstrate that our vehicle routing modeling and optimized algorithm can confidently handle the daily operation of demand-responsive connector services with on-demand stations.
Keywords
Introduction
Continuous urban expansion and suburban sprawl lead to more sparse population density, which results in a low ridership in suburban and rural areas. To deal with these patterns of demand, flexible transit services have been already implemented in many cities all around the world to make public transit services more attractive to residents. These flexible services combine the characteristics of fixed-route public transit and demand-responsive service and are able to substitute the conventional public transit service at many conditions.
For residents living in the remote and sparse communities, transit passengers need to rely on feeder transit to transfer to arterial transit, which cannot serve for the first or last mile for these demands due to the high operating cost. Building efficient feeder transit systems would be quite helpful in increasing passenger participation in the public transit system and relieving existing traffic congestion and greenhouse gas emission in cities.
Koffman 1 once classified flexible transit services into six types, including route deviation, point deviation, demand-responsive connector, request stops, flexible route segments, and zone route. Among these, demand-responsive connector is the second most frequently used method of flexible service in practices. This kind of system suits the service area best where trip origins are ambiguous while trip destinations are specific and have already been applied in a number of areas.
Two types of demand-responsive connectors have been operated so far, one with no demand-responsive stop locations and the other has on-demand stop locations (see Figure 1). Vehicles in type A systems are scheduled and managed purely based on the demand distribution and are considered to be suitable in communities with disperse house locations. Conversely, for the other demand-responsive connector (type B), on-demand stations function only when there are boarding or alighting requests. Generally, the demand-responsive connector with on-demand stations can be managed more efficiently than the demand-responsive connector with no specific stations, in the service areas where the travel demand occurs intensively around specific locations. In this article, we intend to propose the solutions for the vehicle routing problem in demand-responsive connector systems with on-demand stations (type B). This article is organized as follows: a review of the existing research in the related fields is presented in section “Literature review.” The system structure of the demand-responsive connector is described in section “System description and dispatching system.” Section “Vehicle routing and solution algorithms” proposes a two-stage model for the vehicle routing model and the solution algorithms for daily operation. A simulation experiment study is done on the basis of a real-life case in section “Simulation experiment study and algorithm evaluation.” Finally, the conclusion and future research are discussed in section “Conclusion and future work.”

Two types of demand-responsive connector: (a) no specific stations and (b) with on-demand stations.
Literature review
Flexible transit system was first demonstrated to be better choice at low trip density areas by Daganzo. 2 Then, more researchers paid attention to flexible transit systems and some fundamental theory studies were done by Savelsbergh 3 and Langevin et al. 4 Fu 5 proposed an analytical system-optimum model to study the flex-route transit service’s planning and system’s parameters. The operating experiences were increasingly extensive and one planning and operating guide for flexible transit services was accomplished by Potts et al. 6 Nourbakhsh and Ouyang 7 compared travel cost of several trip modes and concluded that flex-route transit had advantages in low trip density areas. Qiu et al. 8 proposed a dynamic station strategy to promote the performance of flex-route systems. Then, operation choice models between fixed-route and flex-route services were developed by Qiu et al.9,10 A new category of transit policies, which have demi-flexible operating characteristic and been suitable for specific low-demand areas, were identified. 11 This category can be recognized as the policy group between flexible and fixed-route transit systems. The study on the Toronto case indicated that the flex-route transit was feasible in the case and had a better performance. 12
Demand-responsive connector has already been operated in many cities, including Denver, Raleigh, Akron, Tacoma, Sarasota, Portland, and Winnipeg. Comparisons were made between the demand-responsive connector with traditional transit services in some researches. Evaluations were made between fixed-route transit policy and demand-responsive connector policy and the latter performed better in specific service areas. 13 Quadrifoglio and Li 14 proposed a methodology to derive the demand density for feeder transit based on the system cost, which emphasized the situation of demand-responsive connector with no stop locations. Chandra and Quadrifoglio 15 presented and examined one methodology to locate the critical links for a grid street network, which can be used in the demand-responsive feeder services.
Vehicle scheduling problems of flexible transit services have been investigated in many studies. Quadrifoglio et al. 16 presented an insertion heuristic to solve the schedule problem of mobility allowance shuttle transit system. Lu et al. 17 proposed a multiple vehicle scheduling model for dynamic demand of the same transit system. Jiang et al. 18 presented a multiple vehicle scheduling model for two directions aiming at a similar situation. Quadrifoglio et al. 19 conducted a study focusing on operations of demand-responsive transit in Los Angeles Country.
In the above studies, demand-responsive connectors were mainly studied with no on-demand stations setting. So far, there are few researches related to optimizing the vehicle operation of demand-responsive connector with on-demand stations, and transit operators are still lack of theoretical operating guidance for this promising kind of feeder systems. This article intends to propose a vehicle routing model to deal with static and dynamic requests in operation, which is crucial to provide a high level of service in feeder systems with on-demand stations.
System description and dispatching system
System description
Demand-responsive connectors are generally operated within a predetermined zone according to geographic conditions or neighborhood communities, with low transit demand. On-demand stations should be set close to the demand generation locations to lower the walking time of passengers. Potential sites include the unit entrance of apartments, at the center of several residential buildings or around a crossing. Once this connector system is determined for a service area, on-demand stations should be confirmed right away based on the travel demand investigation.
The vehicle type applied in the system should be selected based on realistic demand level. The system structure of the demand-responsive connector with on-demand stations is shown below (Figure 2).

Flowchart of system structure.
Dispatching system
As a kind of feeder transit, this system needs to coordinate the schedule of the major public transport network at the transfer point. In operation, vehicles could set out minutes later than the arrival time of major transit vehicles and return to the transfer station minutes earlier than major transit departure time. A predetermined time table should be released in advance each day or each week.
A dispatch system is designed to schedule demand-responsive boarding and alighting. The bus schedule can be released in advance through the client side and passengers can sent their requests with travel information to the dispatch center. The time to request services mostly last from 3 days beforehand to 3 h earlier than departure time. In most cases, service subscriptions are preferable to reduce rejection rate of transit service.
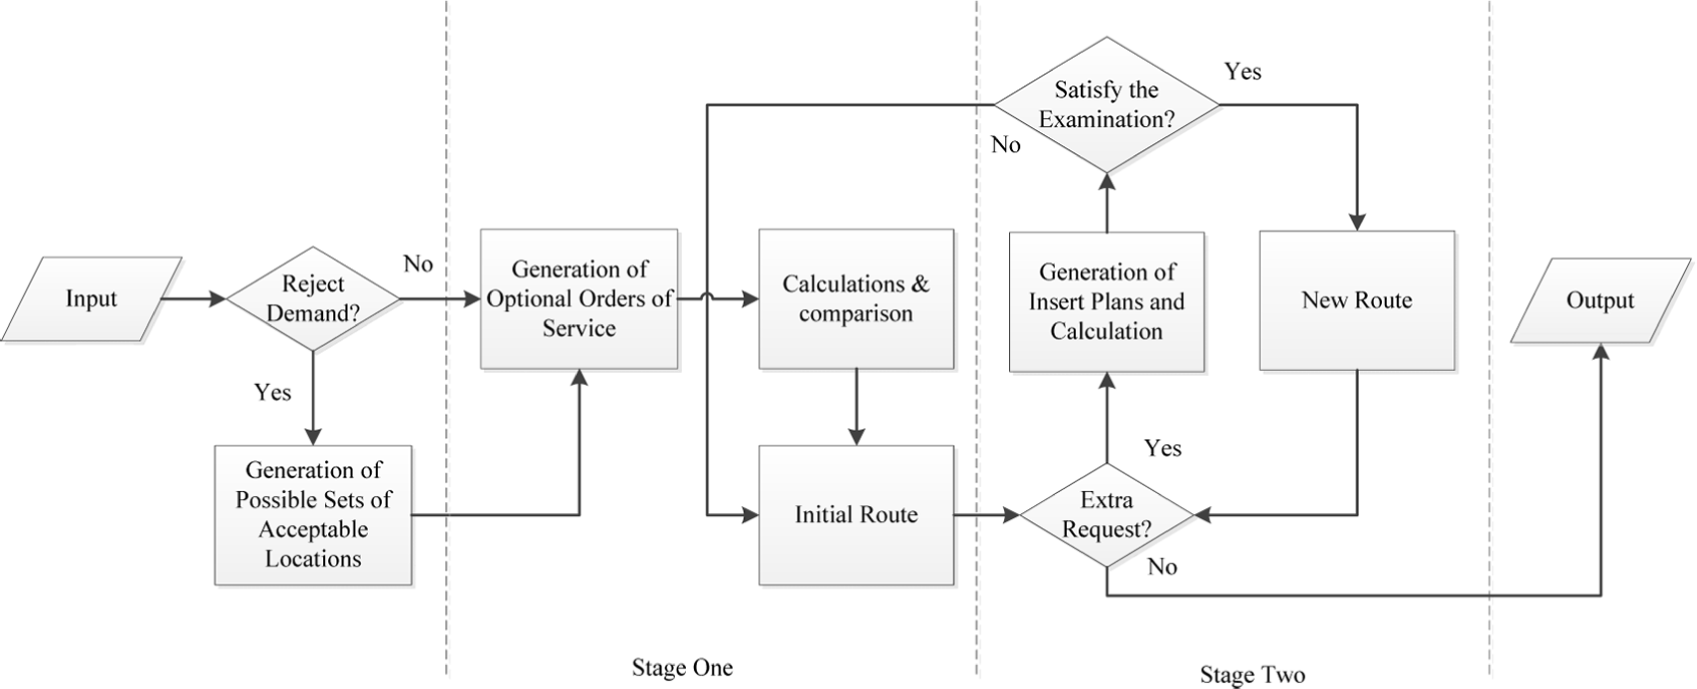
After the reservation deadline, an initial vehicle routing plan will be decided by the dispatch system. Request received after the deadline will be evaluated by the routing model whether they should be accepted or not. The final route might be different with the initial route according to the accepted extra requests (Figure 3). The details of the final routing plan and acceptation or rejection of requests will be released to every passenger in real time through the website, mobile phone clients, or even short messages.

Flowchart of vehicle route plan’s update.
Due to the limitation of a vehicle’s capacity, request rejection may happen at the condition that the demand is beyond its capacity. The dispatch system will determine the rejection of specific requests based on the route modeling results, which is similar to the operation pattern of the flex-route case in Toronto. 13
A demand feedback procedure is recommended to analyze the request data of each travel ride and make surveys on when and where passengers want to take a bus. The request data are significantly important and helpful to optimize station locations. Moreover, when demand rejections frequently occur, an adjustment of the vehicle scheduling table needs to be further checked and an increase in the number of service vehicles can be considered in specific cases. In addition, if a service maintains a relatively high level demand, evaluations should be made to determine whether this demand-responsive connector system still fit this area. If not, other flexible feeder systems or fixed-route systems should be considered.
Vehicle routing and solution algorithms
In this section a two-stage route model is proposed to serve variable passenger demand. The first-stage model aims at serving predetermined requests and the second-stage model manages extra requests received after the reservation deadline.
First-stage routing model
The first-stage route model needs to record every request and calculate an optimal route to serve the accepted passengers. Several assumptions are made during the mathematical modeling, stated as follows:
Assumption statements:
Consider the total travel time as system cost, including the serving vehicle and passengers;
The routing plan is developed based on on-demand stations;
All passengers are equally important;
The lost time (starting and decelerating) between adjacent stations remains invariant;
The boarding and alighting time for each passenger are fixed.
After service requests from on-demand stations are confirmed, all the possible route choices will be listed. Define i and j as the ID number of the stations in the service requests. Define link i as the road link with the lowest travel time that connects station
An objective function of cost to identify the best route is set up as follows

where C is the estimated cost based on the total travel time of vehicle and passengers, l is the number of stations that are chosen to serve,
Equation (1) calculates the travel time of the vehicle and the total travel time cost of riders. A weight coefficient is applied for the passengers’ cost.

where
The identification of link i and

Road links and operating speed between two stations.
Assume that the number of road links that connect station h and station k is m. Define
Second-stage routing model
Requests received after the reservation deadline are defined as extra requests, which may be accepted and served based on the decision of the second-stage route model. If the extra request is at stations that are confirmed to be served, it will be added to the route and examined by the route model. Otherwise, an extra station will need to be served. The route model will obtain a new route with lowest cost by inserting the station to the predetermined routing plan and examine whether this insertion is acceptable. Each extra request will be disposed in time order once it is received and the initial route will be updated immediately when one extra request is accepted. The mathematical model is presented below.
Define that


where
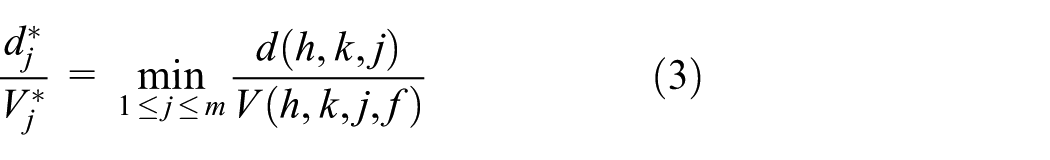
The extra requests within the stations in the initial route should be examined by equations (5) and (2), with an assumption that the extra request is at station j. If a new station needs to be served, the objective function could be written as

where assume the new station is k, and
If there is a feasible solution, this extra request is accepted and the existing route will be updated and released. Otherwise, the extra request is rejected when
Demand rejection
At the first-stage route model, rejections occur when

where P is the number of passengers that will be served, and
Demand rejections also occur when
Enumerative algorithm
The flowchart of the enumerative algorithm for one ride is shown in Figure 5.
Flowchart of enumerative algorithm.
To solve the objective function, several elements need to be identified based on realistic situation and investigations, including
The output of the program includes the exact paths, stations that will be served, and total travel cost. The estimated value of vehicle’s travel time is obtained as well.
Optimization
One optimized algorithm for first-stage routing model is proposed to simplify the route generation and calculation. The second-stage part of it remains the same with enumerative algorithm.
One specific route serving all the on-demand stations with lowest vehicle travel time can be found using the enumerative algorithm. Once the stations that will be served are selected, the sequence of serving stops will be determined. In this algorithm, the order of station i will be changed with other stations with less boarding passengers or more alighting passengers to examine if the new order has a lower cost. If a new sequence is confirmed to be better, this changing procedure will repeat with the new order, otherwise do it with the next station.
After all the stations are examined and no better order is found, output the final route choice as the initial routing plan of second-stage model. The flowchart of this algorithm in first-stage is shown here (Figure 6).

Flowchart of optimized algorithm in stage one.
Simulation experiment study and algorithm evaluation
A simulation experiment based on a real-life case in Nanjing city has been done in this section to evaluate the proposed routing model and the solution algorithms.
Application simulation
Zhengfangzhonglu station is located in Jiangning District of Nanjing, China, which is a rapidly developing suburban district with an area more than 1558 km2 and a population of around 1 million. The travel density in Jiangning district is relatively low, which fits the implementation condition of connector systems with on-demand stations.
The service area of Zhengfangzhonglu station contains several factories located to the east of the station, with a distance about 1.77 km2 (Figure 7) and 11 on-demand stations are set up to serve the passengers. Assume that there is only one serving vehicle in this connector system, which has 36 seats and can take approximately 60 people at most. It is also recorded that the lost time of this vehicle in one ride is about 27.3 s and the overall average operation speed in this area is 29.2 km/h during the evening peak. Thus, the value of

Satellite map of service area and on-demand stations.
The array of
Distance between each on-demand stations (kilometers).

Station 0 is the transfer point.
Demand processing
Based on a survey done at Zhengfangzhonglu station on 7 July 2014, a demand table is acquired (Table 2).
Passengers’ request for boarding time and place.

Departure simulation
Based on the demand table, one departure at 5:25 pm is determined. Assume that all those 15 passengers choosing 4:50–5:30 pm will take that bus. Two Visual Basic programs are accomplished, one based on enumerative algorithm and the other based on optimized algorithm. Using the enumerative algorithm, the optimal route with lowest cost that serves all stations is confirmed, which is 0, 8, 10, 11, 9, 7, 5, 2, 4, 1, 3, 6, and 0. This order is utilized in the optimized algorithm program.
An assumption of extra requests is stated in this case. Assume that one boarding demand for station 8 and one alighting demand for station 10 appeared for the bus of 5:25. After running the enumerative algorithm program and the optimization algorithm program, one same route is obtained by both algorithms, which is 0, 10, 5, 4, 1, 3, 6, and 0 with a cost of 90.24 min and a vehicle travel time of 23.36 min. Both extra requests are accepted by both algorithms. Station 8 is inserted between station 0 and 10 and the updated vehicle travel time is 23.64 min.
Demand rejection simulation
Similarly, one departure at 6:05 pm is confirmed. Still assume that all those 26 passenger requests will take the bus. Other input data remain the same. For both algorithms, the routing model rejects some requests during stage one as the vehicle travel time is longer than 24 min. The enumerative algorithm rejects the requests of stations 3 and 9. The final route is 0, 4, 1, 2, 5, 7, 11, 8, and 0 with a total cost of 161.00 min and a vehicle travel time of 23.88 min. The optimized algorithm rejects the request of station 11. The final route is 0, 9, 7, 5, 4, 2, 1, 3, 8, and 0 with a total cost of 161.11 min and a vehicle travel time of 23.62 min.
Discussion
According to the simulation experiment, it can be confirmed that this connector system with on-demand stations is applicable in this service area and the proposed optimization algorithm for first-stage route modeling is reliable and efficient.
Furthermore, several tests have been finished based on the experiment defining the number of stations with demand as variant in the first stage. All the requests for both algorithms are the same. The running time and total travel time cost of both programs are recorded in Table 3.
Comparison of enumerative algorithm and optimized algorithm.
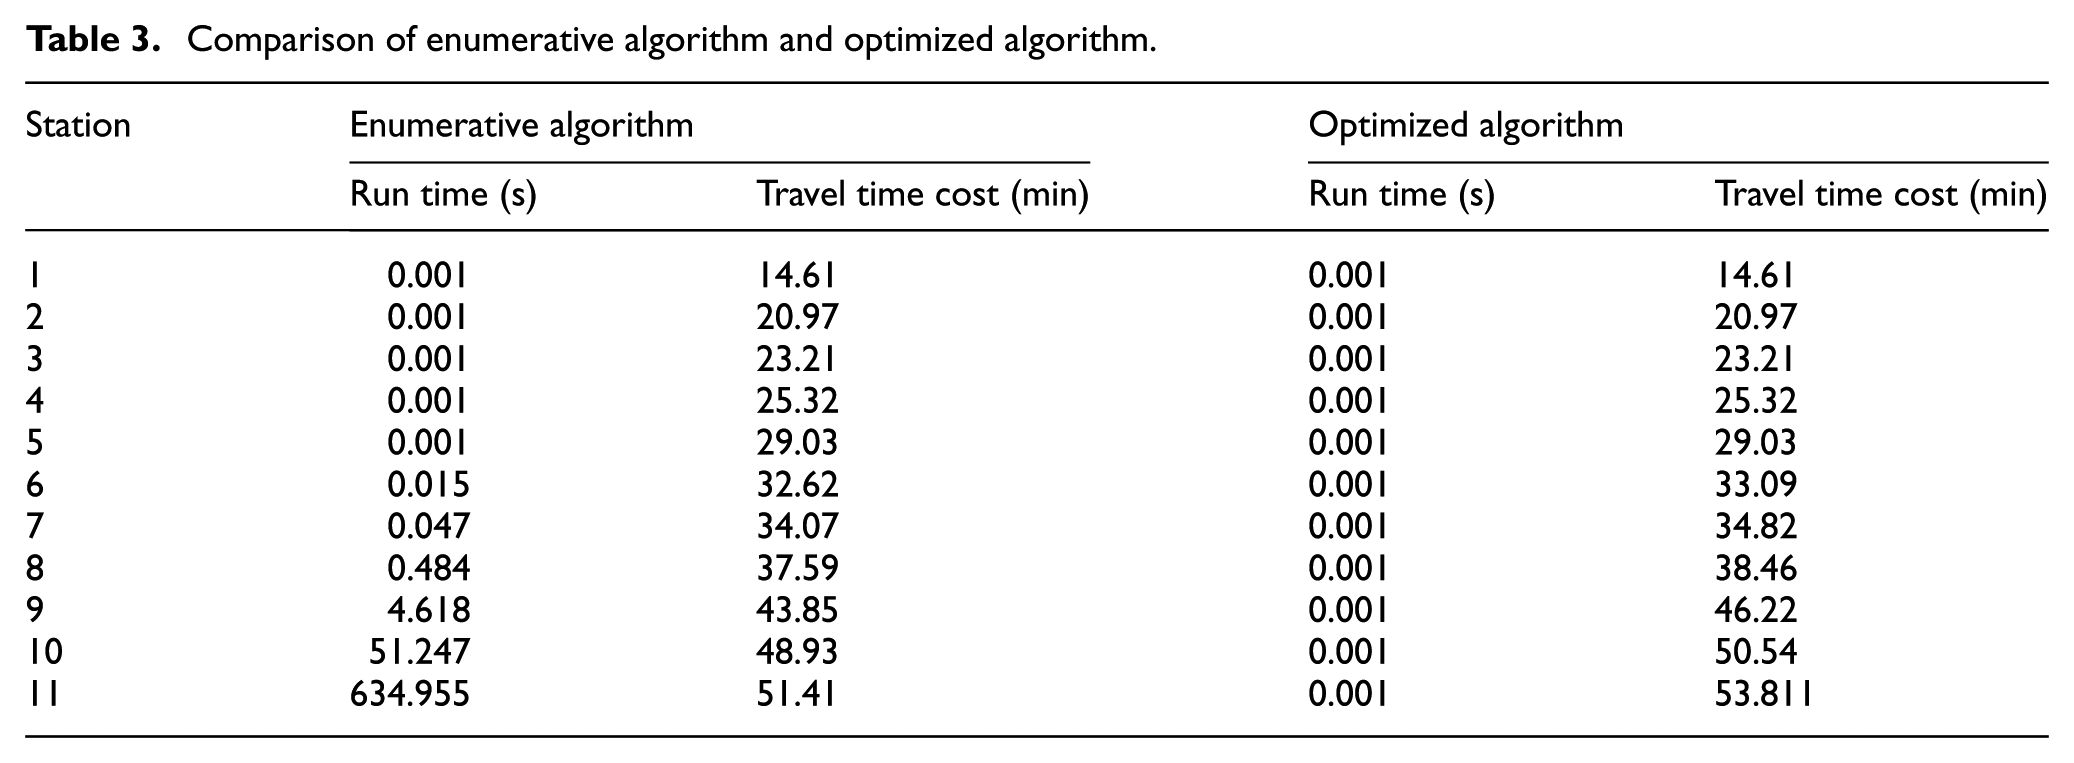
The testing results show that when the number of stations that need service is less than 6, it will cost no more than 0.001 s for the calculation using the enumerative algorithm. However, the time cost for the 11 stations scenario seems much greater, which is approximately 10.6 min on the testing computer.
As for the optimized algorithm, the time cost for every test is no more than 0.001 s. Their routing plans are not the optimal ones compared with enumerative algorithm, but the differences are small and insignificant. The computing time of the enumerative algorithm increases dramatically with the increase in on-demand stations. Furthermore, the demand rejection probably makes the enumerative algorithm complex or even unable to solve. In contrast, the optimized algorithm may not provide the best solution, but it can offer a faster and acceptable option, especially with a large number of on-demand stations.
Conclusion and future work
This article has presented a brief system description for demand-responsive connector with on-demand stations for boarding and alighting. One two-stage vehicle routing model is proposed with the objective function to minimize the total system cost. A simulating demonstration experiment based on a realistic case in Nanjing city is done to evaluate the applicability of this kind of connector systems in mid-sized suburban or rural areas. Comparisons of the enumerative algorithm and proposed optimized algorithm have also been displayed.
The results indicate that the demand-responsive connector with on-demand stations can suit the specific situations for trips generated around the transfer points. It can serve medium-sized areas with low trip density toward major transit systems. Our two-stage routing model and developed algorithms are functional to implement the demand-responsive connector system. Meanwhile, the optimized algorithm seems to be a more efficient option than enumerative algorithm for its great time consuming with a large number of on-demand stations.
So far, there have been a limited number of practical applications of demand-responsive connector with on-demand stations. As one of the promising flexible transit systems, this innovative feeder system can provide excellent travel services in low trip density areas around arterial public transit network to cover the first and last one mile of trip. Thus, the achievements of this article can be recognized as a useful tool to make the demand-responsive connector with on-demand stations more feasible and reliable.
More related researches can be done in this topic. The implementation of this system needs to consider more constraints, for example, the best suit size of service area, number of service vehicles, and the identification of on-demand stations’ locations. In addition, details of system’s operation can be emphasized as well, such as the operating cost, fare, and the evaluation of system’s operation. For the vehicle route modeling, future studies could focus on the sensitivity analysis of operating factors in the models and the proposed two-stage routing model can be verified with more real-life operating data.
Footnotes
Academic Editor: Hai Xiang Lin
Declaration of conflicting interests
The author(s) declared no potential conflicts of interest with respect to the research, authorship, and/or publication of this article.
Funding
The author(s) disclosed receipt of the following financial support for the research, authorship, and/or publication of this article: This research was supported by the Fundamental Research Funds for the Central Universities of China (grant nos 2016B01014 and 2015B01114), National Natural Science Foundation of China (grant nos 51508161 and 71501061), Natural Science Foundation of Jiangsu Province (grant nos BK 20140851 and BK20150821), and Science and Technology Plan of Hubei Provincial Transportation Department (grant no. 2016-13-1-3).