
Abstract
Indoor exposure to PM2.5 (particulate matter with aerodynamic diameter less than 2.5 μm) has a substantial negative impact on people’s health. However, indoor PM2.5 can be controlled through effective ventilation and filtration. This study aimed to develop a smart control framework that (1) combines a portable home air purifier (HAP) and window control system to reduce indoor PM2.5 concentrations whilst maintaining thermal comfort; (2) evaluates the associated health impacts and additional energy use. The proposed framework was demonstrated through a simulation-based case study of a low-energy apartment. The simulation results showed that joint control of HAP and window openings has great potential to not only maintain thermal comfort but also achieve effective PM2.5 removal which, consequently, can lead to considerable health benefits at a low additional energy cost. Compared to similar previous studies, the strength of the proposed control framework lies in combining window operations and HAPs in the same system and including both thermal comfort and indoor PM2.5 as the control targets. This work also introduces a novel concept of linking a building control system with a health impact assessment, an important and innovative step in the creation of holistic and responsive building controls.
Keywords
Introduction
Considerable research efforts have been made in recent decades to improve indoor air quality (IAQ) to provide healthy indoor environments for occupants. Currently, carbon dioxide (CO2) sensors are commonly used in building control systems, 1 but CO2 is not representative of all indoor air pollutants including particulate matter (PM). PM refers to a mixture of airborne liquid droplets and solid particles and is categorised as PM1 (≤1 μm), PM2.5 (≤2.5 μm) and PM10 (≤10 μm) based on aerodynamic diameter. PM2.5 is of particular concern because it can infiltrate deeply into the respiratory system, causing severe health problems including cardiovascular diseases and asthma.2,3 A link has been established between exposure to PM2.5 and an increase in all-cause mortality. 2 Thus, reductions in PM2.5 are estimated to have major health benefits. 4
Due to the important role window opening plays in shaping the indoor environment, implementing automatic window control systems has been deemed a promising building control strategy. Several papers reported the findings of deploying automated window systems to facilitate ventilative cooling,5–7 or minimise the amount of time with high indoor CO2 concentration. 8 In comparison, very limited studies of window control systems considered indoor PM2.5. As one rare example, An et al. 9 recently used the reinforcement learning approach to develop an automatic window control system to mitigate indoor PM2.5. However, when outdoor air quality is poor, this approach cannot reduce indoor PM2.5 concentrations. In this regard, it is worthwhile to consider alternative strategies such as portable home air purifiers (HAPs) that use high-efficiency particulate air (HEPA) filters. Notably, the new generation of HAPs (such as those used in a recent study 10 ) has built-in PM2.5 sensors and can be connected to the internet to realise instant remote control, showing great potential to be part of an advanced building automation system.
This paper presents a novel control framework that integrates HAPs and automatic window systems to reduce indoor PM2.5 concentrations and maintain thermal comfort. The proposed framework was demonstrated through a simulation-based case study of a modern 1-bedroom apartment in London, UK. Compared to similar previous studies, the strength of the control framework proposed lies in combining window operations and HAPs in the same system and including both thermal comfort and indoor PM2.5 as the control targets. This work also introduces a novel concept of linking a building control system with a health impact assessment, an important and innovative step in the creation of holistic and responsive building controls.
Material and methods
Description of case study
The case study residence is a 1-bedroom flat, approximately 51 m2, located on the ninth floor of a 13-storey residential building built in 2015. The building is sited in a busy urban area in London, UK, adjacent to two heavily trafficked roads. The Energy Performance Certificate (EPC) 11 for the flat is band B, with band A being the highest and band D being the average rating for dwellings in England and Wales. The monitored flat was located within a building equipped with decentralised mechanical ventilation and heat recovery (MVHR) without mechanical cooling in each dwelling. The operation of the MVHR system was, therefore, individually controlled by the occupants of each flat. The filtration of the MVHR system in the case study building was found to be minimal (ISO Coarse 45%) in a previous study. 10 There was a cooking extract hood available in the open plan kitchen-living room. During the semi-structured interviews, residents from the case study flat reported that they turned on the MVHR system only occasionally, although the design intent was to provide continuous background ventilation. In regards to cooking, they reported preparing simple and quick breakfasts without using the oven or cooktop, and cooked dinner about twice a week using the front burner of the cooktop with the extract hood turned on.
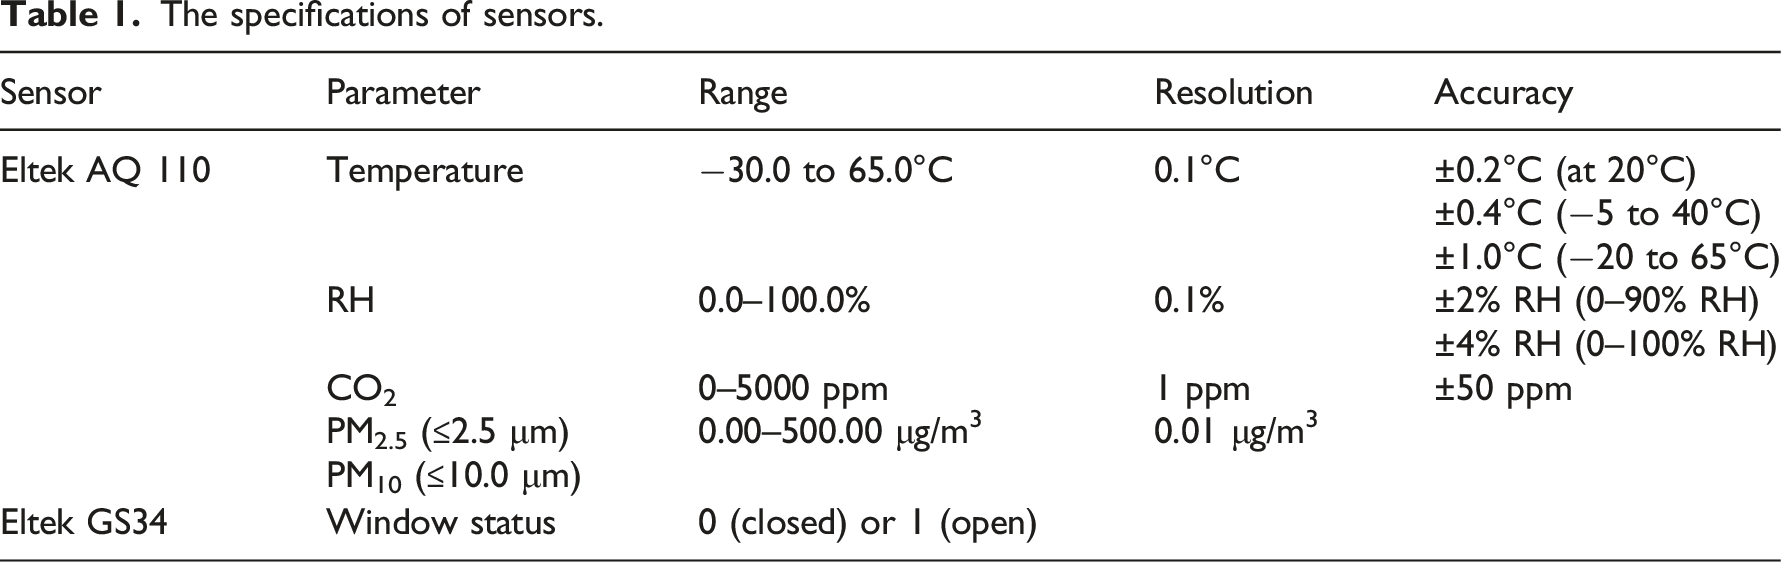
Temperature, relative humidity, CO2 and PM2.5 were measured by air quality sensors (Eltek AQ 110) in the living room of the flat and outside the building. As shown in Figure 1, the outdoor sensor was placed on the ground floor at the left façade of building A directly facing a road. The monitored flat is situated in Building B, with only the balcony side having external walls and the other boundary walls adjacent to neighbouring flats or the inner corridor. The indoor sensor was placed on an internal wall of the living room (about 1.6 m above the floor), while the status (open or closed) of the double-glazed balcony door in the living room was monitored by magnetic reed switches sensors (Eltek GS34). This balcony door is referred to as ‘window’ in the following text. The sampling frequency for all sensors was every 5 min. The equipment specifications are detailed in Table 1. More details about the environmental monitoring and participant interviews and surveys (including sleep and wellbeing surveys, IAQ opinions, and occupant behaviours) can be found in previous publications.10,12 Indoor and outdoor monitoring locations (left) and the floor plan of the case study flat (right). Note that to protect the residents’ privacy, schematic drawings were used for illustration. The specifications of sensors.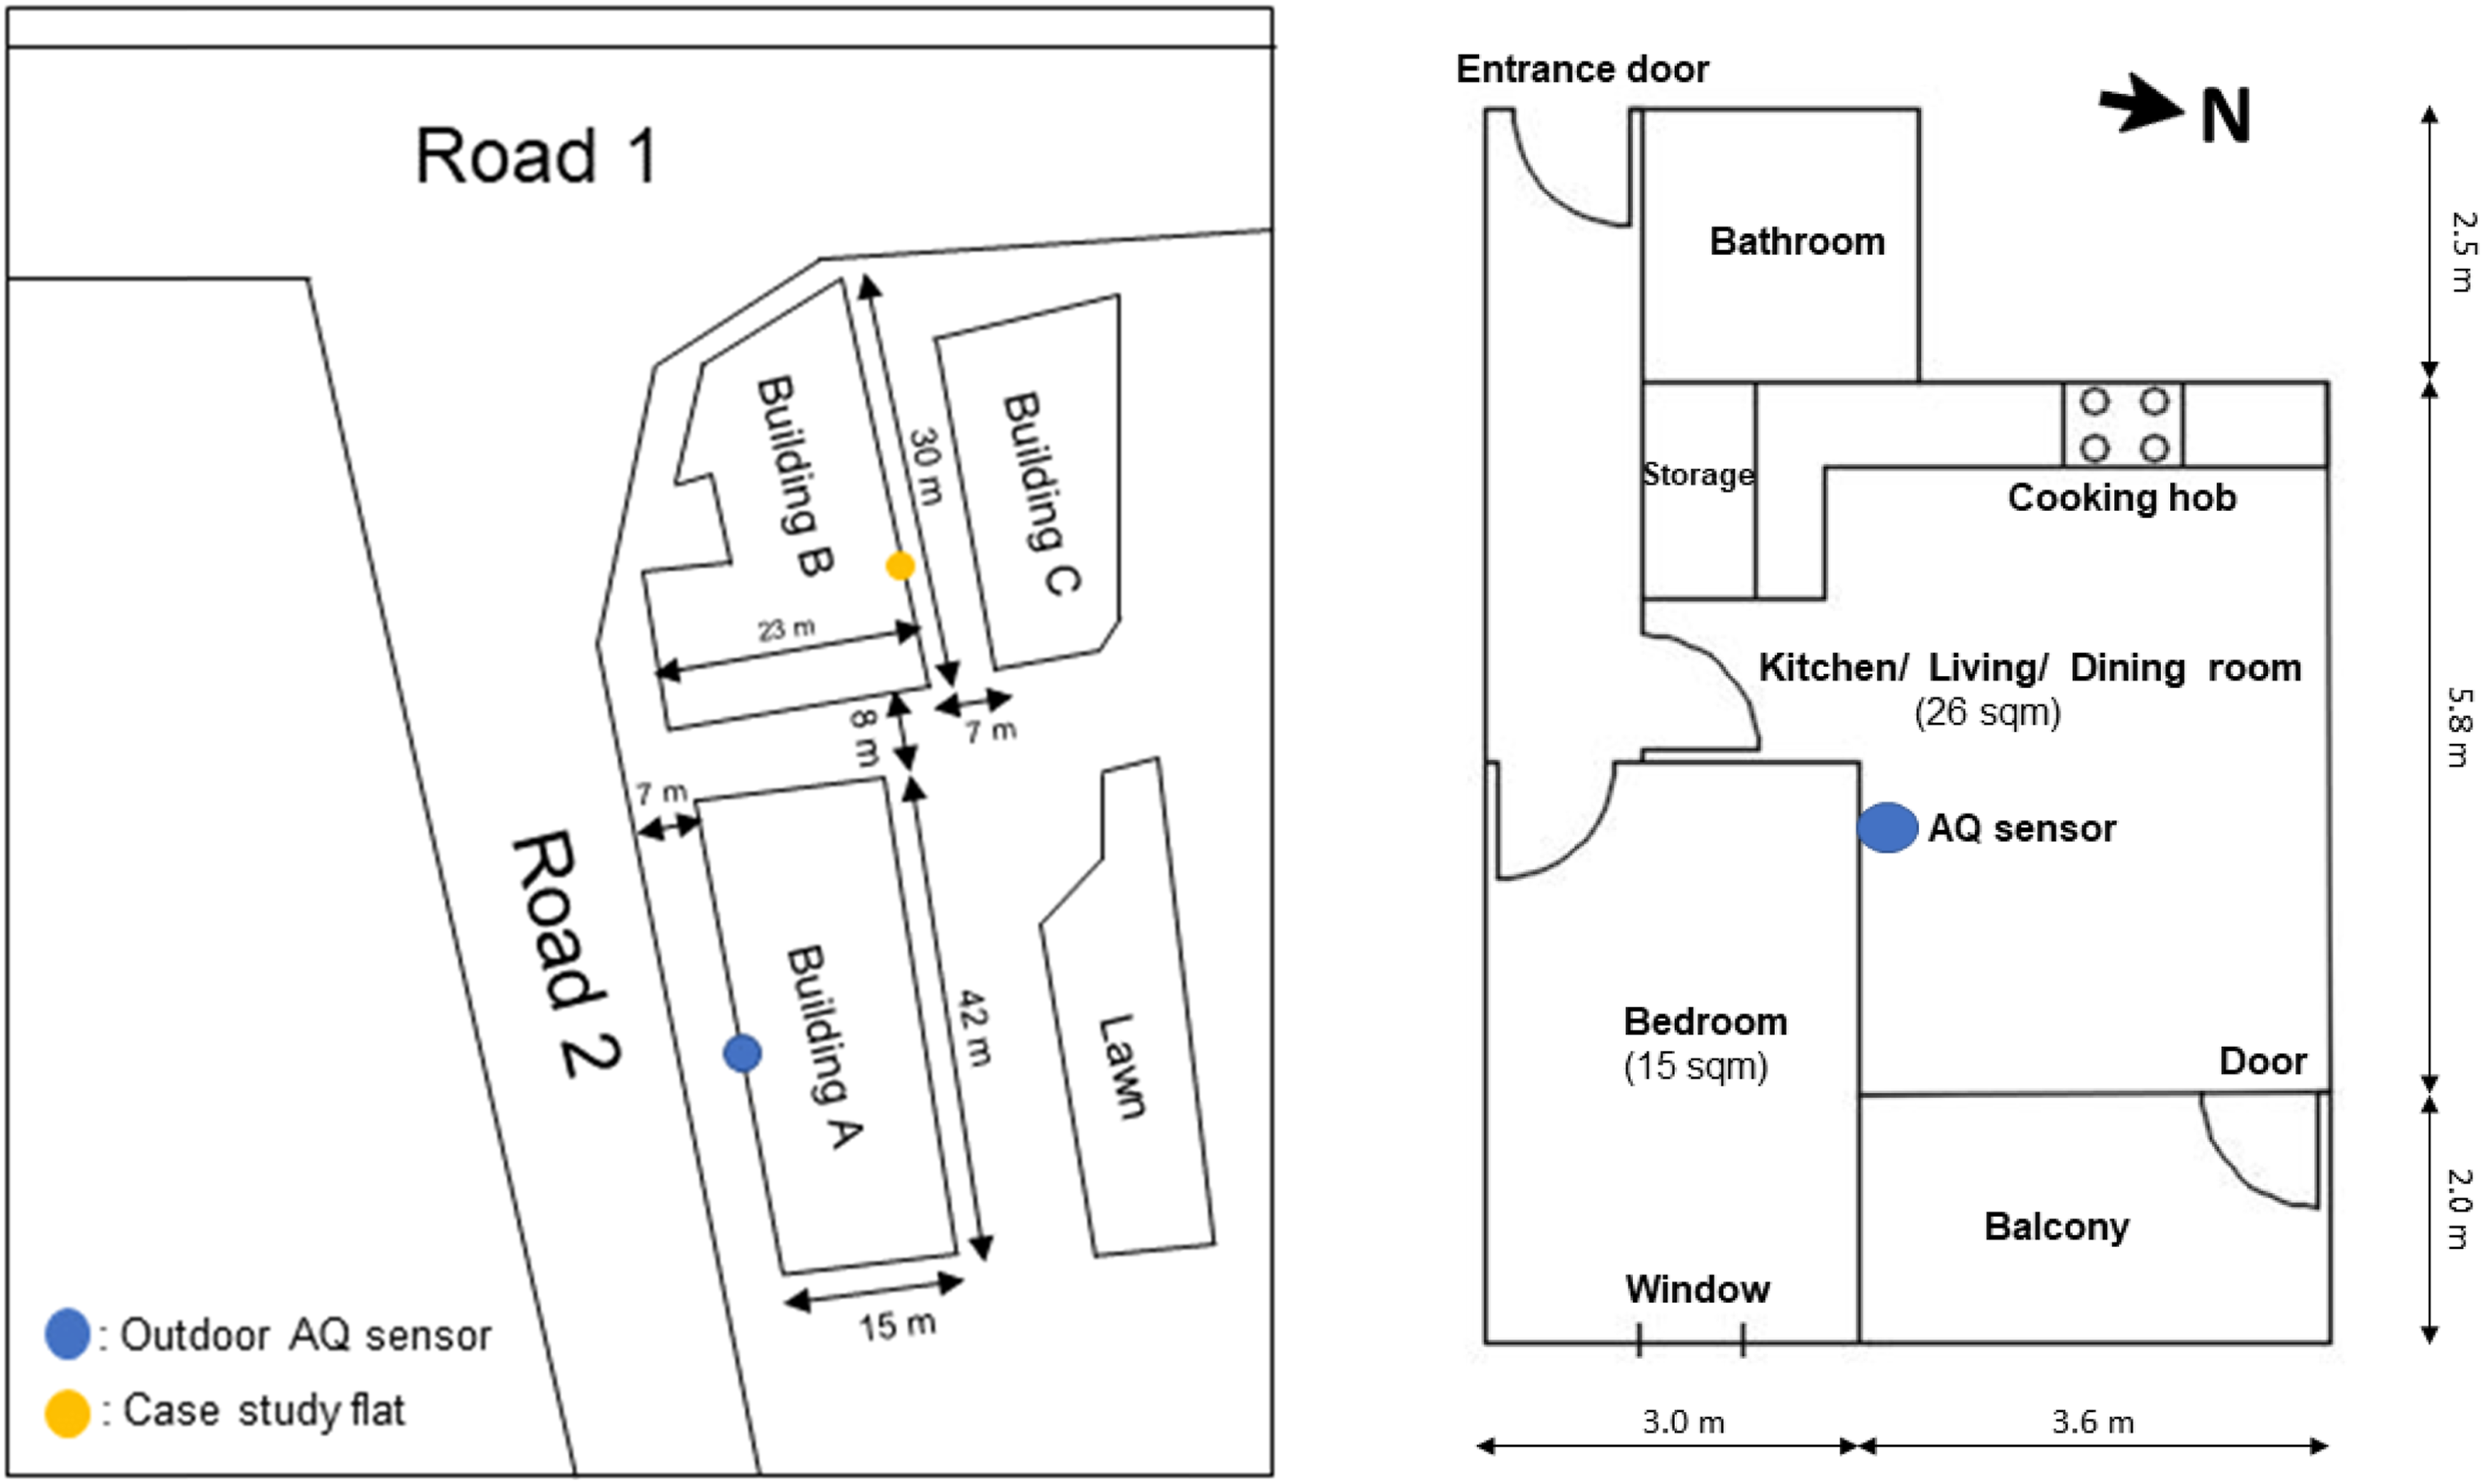
Building model development
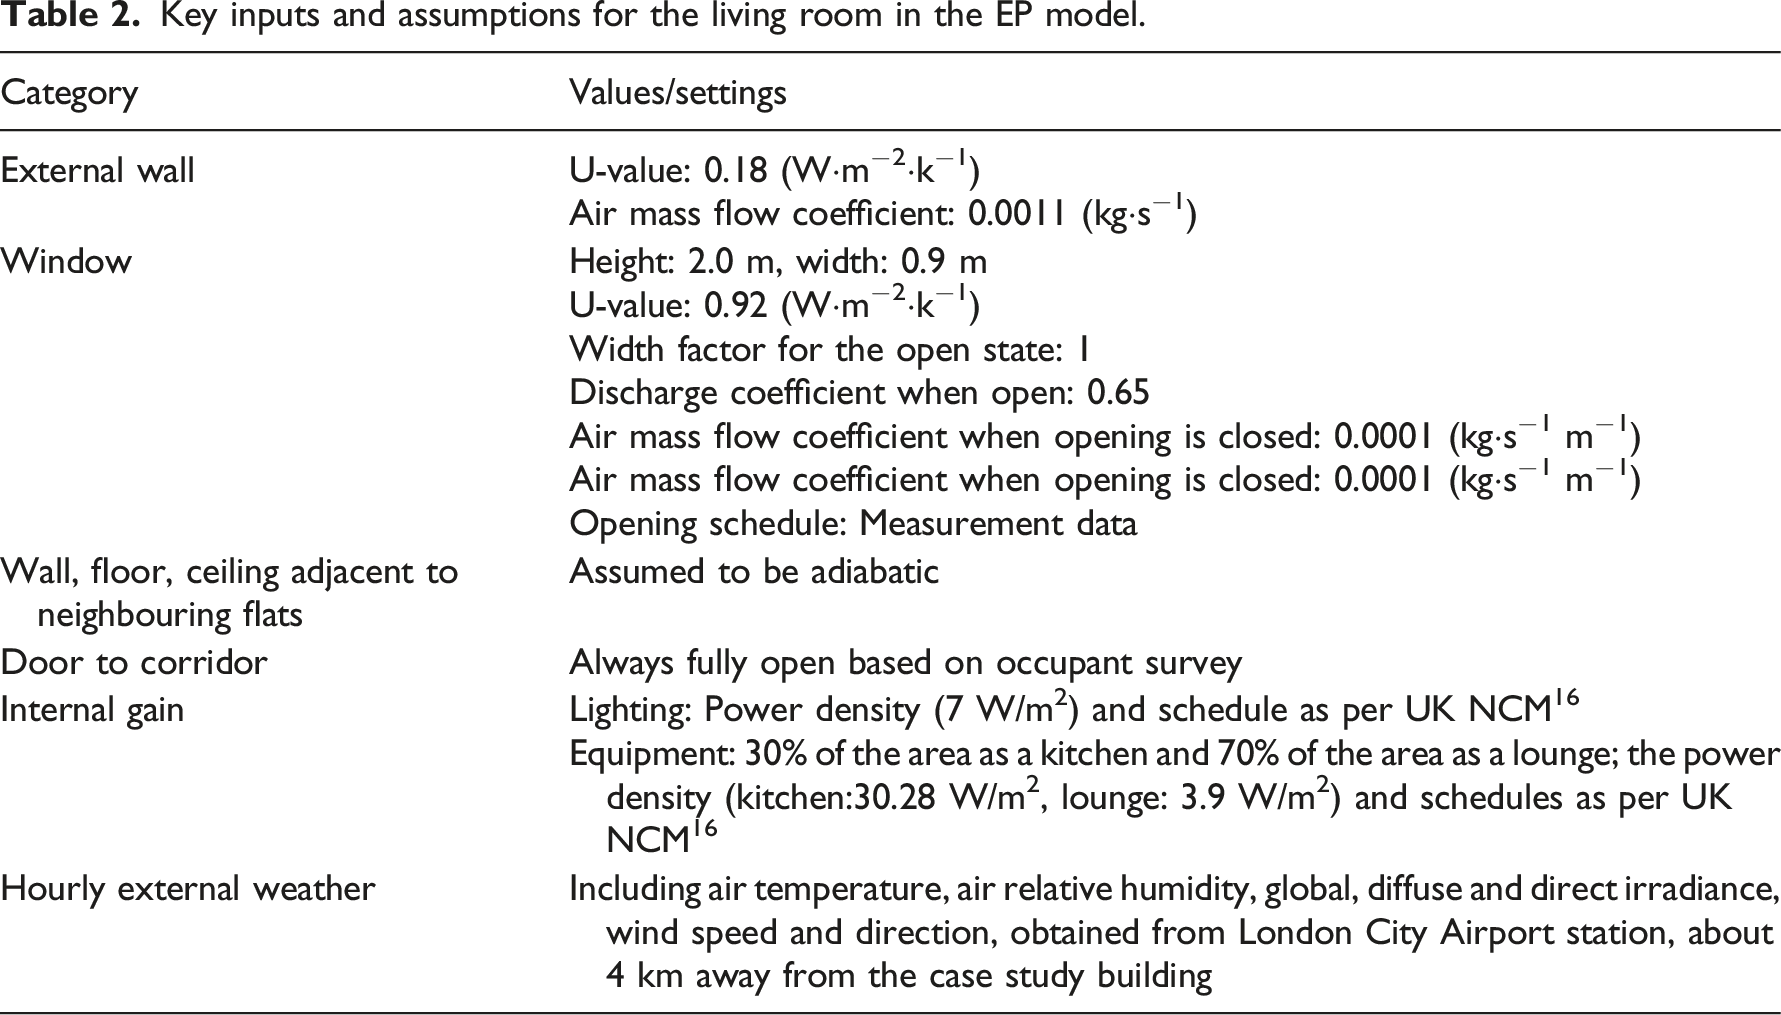
Model inputs and assumptions
Key inputs and assumptions for the living room in the EP model.
Indoor PM2.5 modelling
Cooking schedules, deposition rate and penetration factor were determined to model indoor PM2.5 concentration. The following provides a description of the process of determination for these factors.
Emission rates (E) and cooking schedules
Smoking and cooking were previously found to be the primary sources of high indoor PM2.5 concentrations.
17
Since the occupants of the case study flat were not smokers, only cooking was modelled here. Consistent with occupant survey results, preliminary observations of the measured indoor PM2.5 concentrations found that there were frequent small peaks (typically around 5 μg/m3) in the morning and occasional large peaks (usually over 50 μg/m3) in the evening. Thus, two rules were used to generate breakfast and dinner schedules for the EP model: 1) when there was a morning peak of measured PM2.5 concentrations of 5–10 μg/m3 at 6–9 am, 5 min’ use of microwave (E: 0.03 mg/min
18
) and toasting (E: 0.11 mg/min
18
) were assumed to occur during the corresponding period; 2) when there was an evening peak of PM2.5 concentrations over 50 μg/m3 at 6–9 pm, cooking (E: 1.60 mg/min
19
) was assumed to happen during the corresponding rising period, and a 20% capture efficiency (CE) of the extract hood was assumed (a midrange of the CE for the front burner that was estimated to be 4%–39%
20
).
Penetration factor (P) and deposition rate (K)
From the literature, the values of both P and K are dependent on particle size. For PM2.5, the range for the penetration factor (P) is 0.7–1.0 21 ; P is less than one when the window is closed, while it should be approximately equal to one when the window is open for naturally ventilated buildings.21,22 The measured outdoor PM2.5 data was used as the outdoor contaminant source in the EP model. The deposition rate was reported to be more varied, e.g. 0.06–0.39 h−122, 0.21–0.63 h−123, 0.30–0.69 h−1. 24 After comparing the simulated and measured indoor PM2.5 concentrations, the best-fit values of P (ranging between 0.7 and 1.0) and K (ranging between 0.06 and 0.69) were found using the assumed cooking emission rate (from above), the inferred cooking schedule, and the measured outdoor PM2.5 data.
Model tests
Comparison between simulated and measured indoor PM2.5 concentration and indoor temperature.
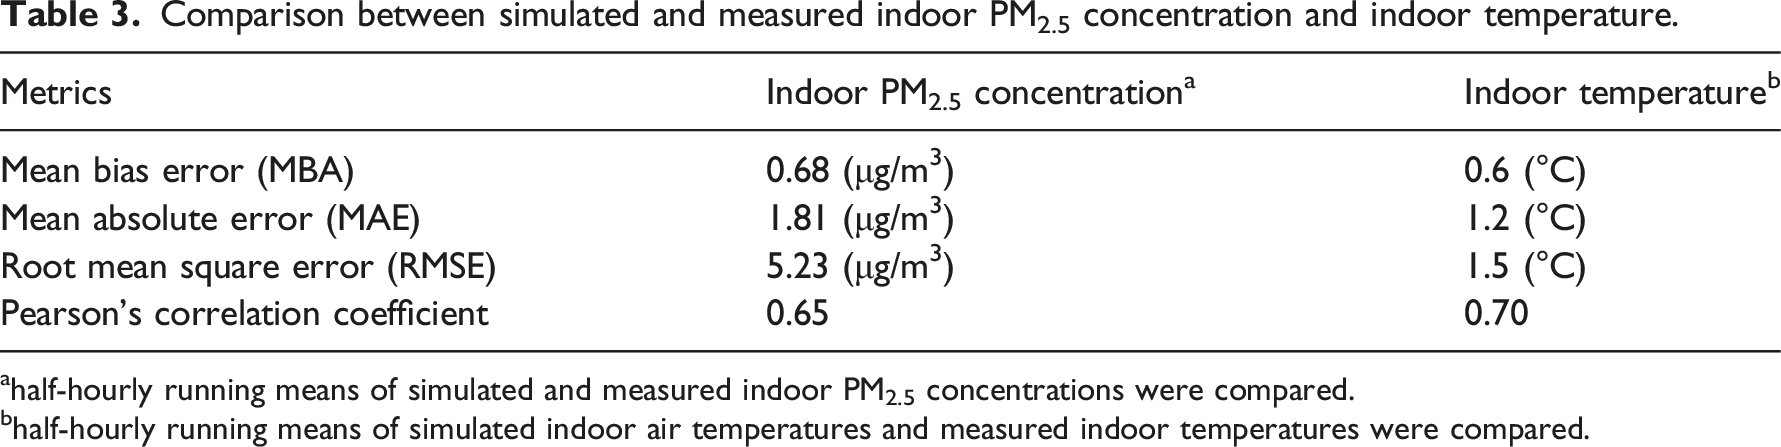
ahalf-hourly running means of simulated and measured indoor PM2.5 concentrations were compared.
bhalf-hourly running means of simulated indoor air temperatures and measured indoor temperatures were compared.
As is shown in Figure 2, the general trends of predicted indoor PM2.5 concentration and indoor temperature closely match the measured ones, and the large indoor PM2.5 peaks were well captured. However, some limitations with the model were also noted. When the window was open, the estimated indoor PM2.5 concentration could be higher than the measured indoor PM2.5 concentration, for example, 6–9 am on 4th August. This difference was likely due to the location of the outdoor sensor which was at the ground level, directly adjacent to a busy road. The measured flat, meanwhile, was located on the other side of the building on the ninth floor (as illustrated in Figure 1). Another drawback was the disparity between the large peaks in the simulation and measured values, likely a consequence of using general assumptions about cooking emission rates and cooking schedules. Generally, the PM2.5 model underestimates the emission rate, which leads to large errors (especially RMSE). Demonstration of EP model estimates compared with measurements for two weeks. Note that the half-hourly running means for both PM2.5 concentration and temperature were used to better illustrate the trend.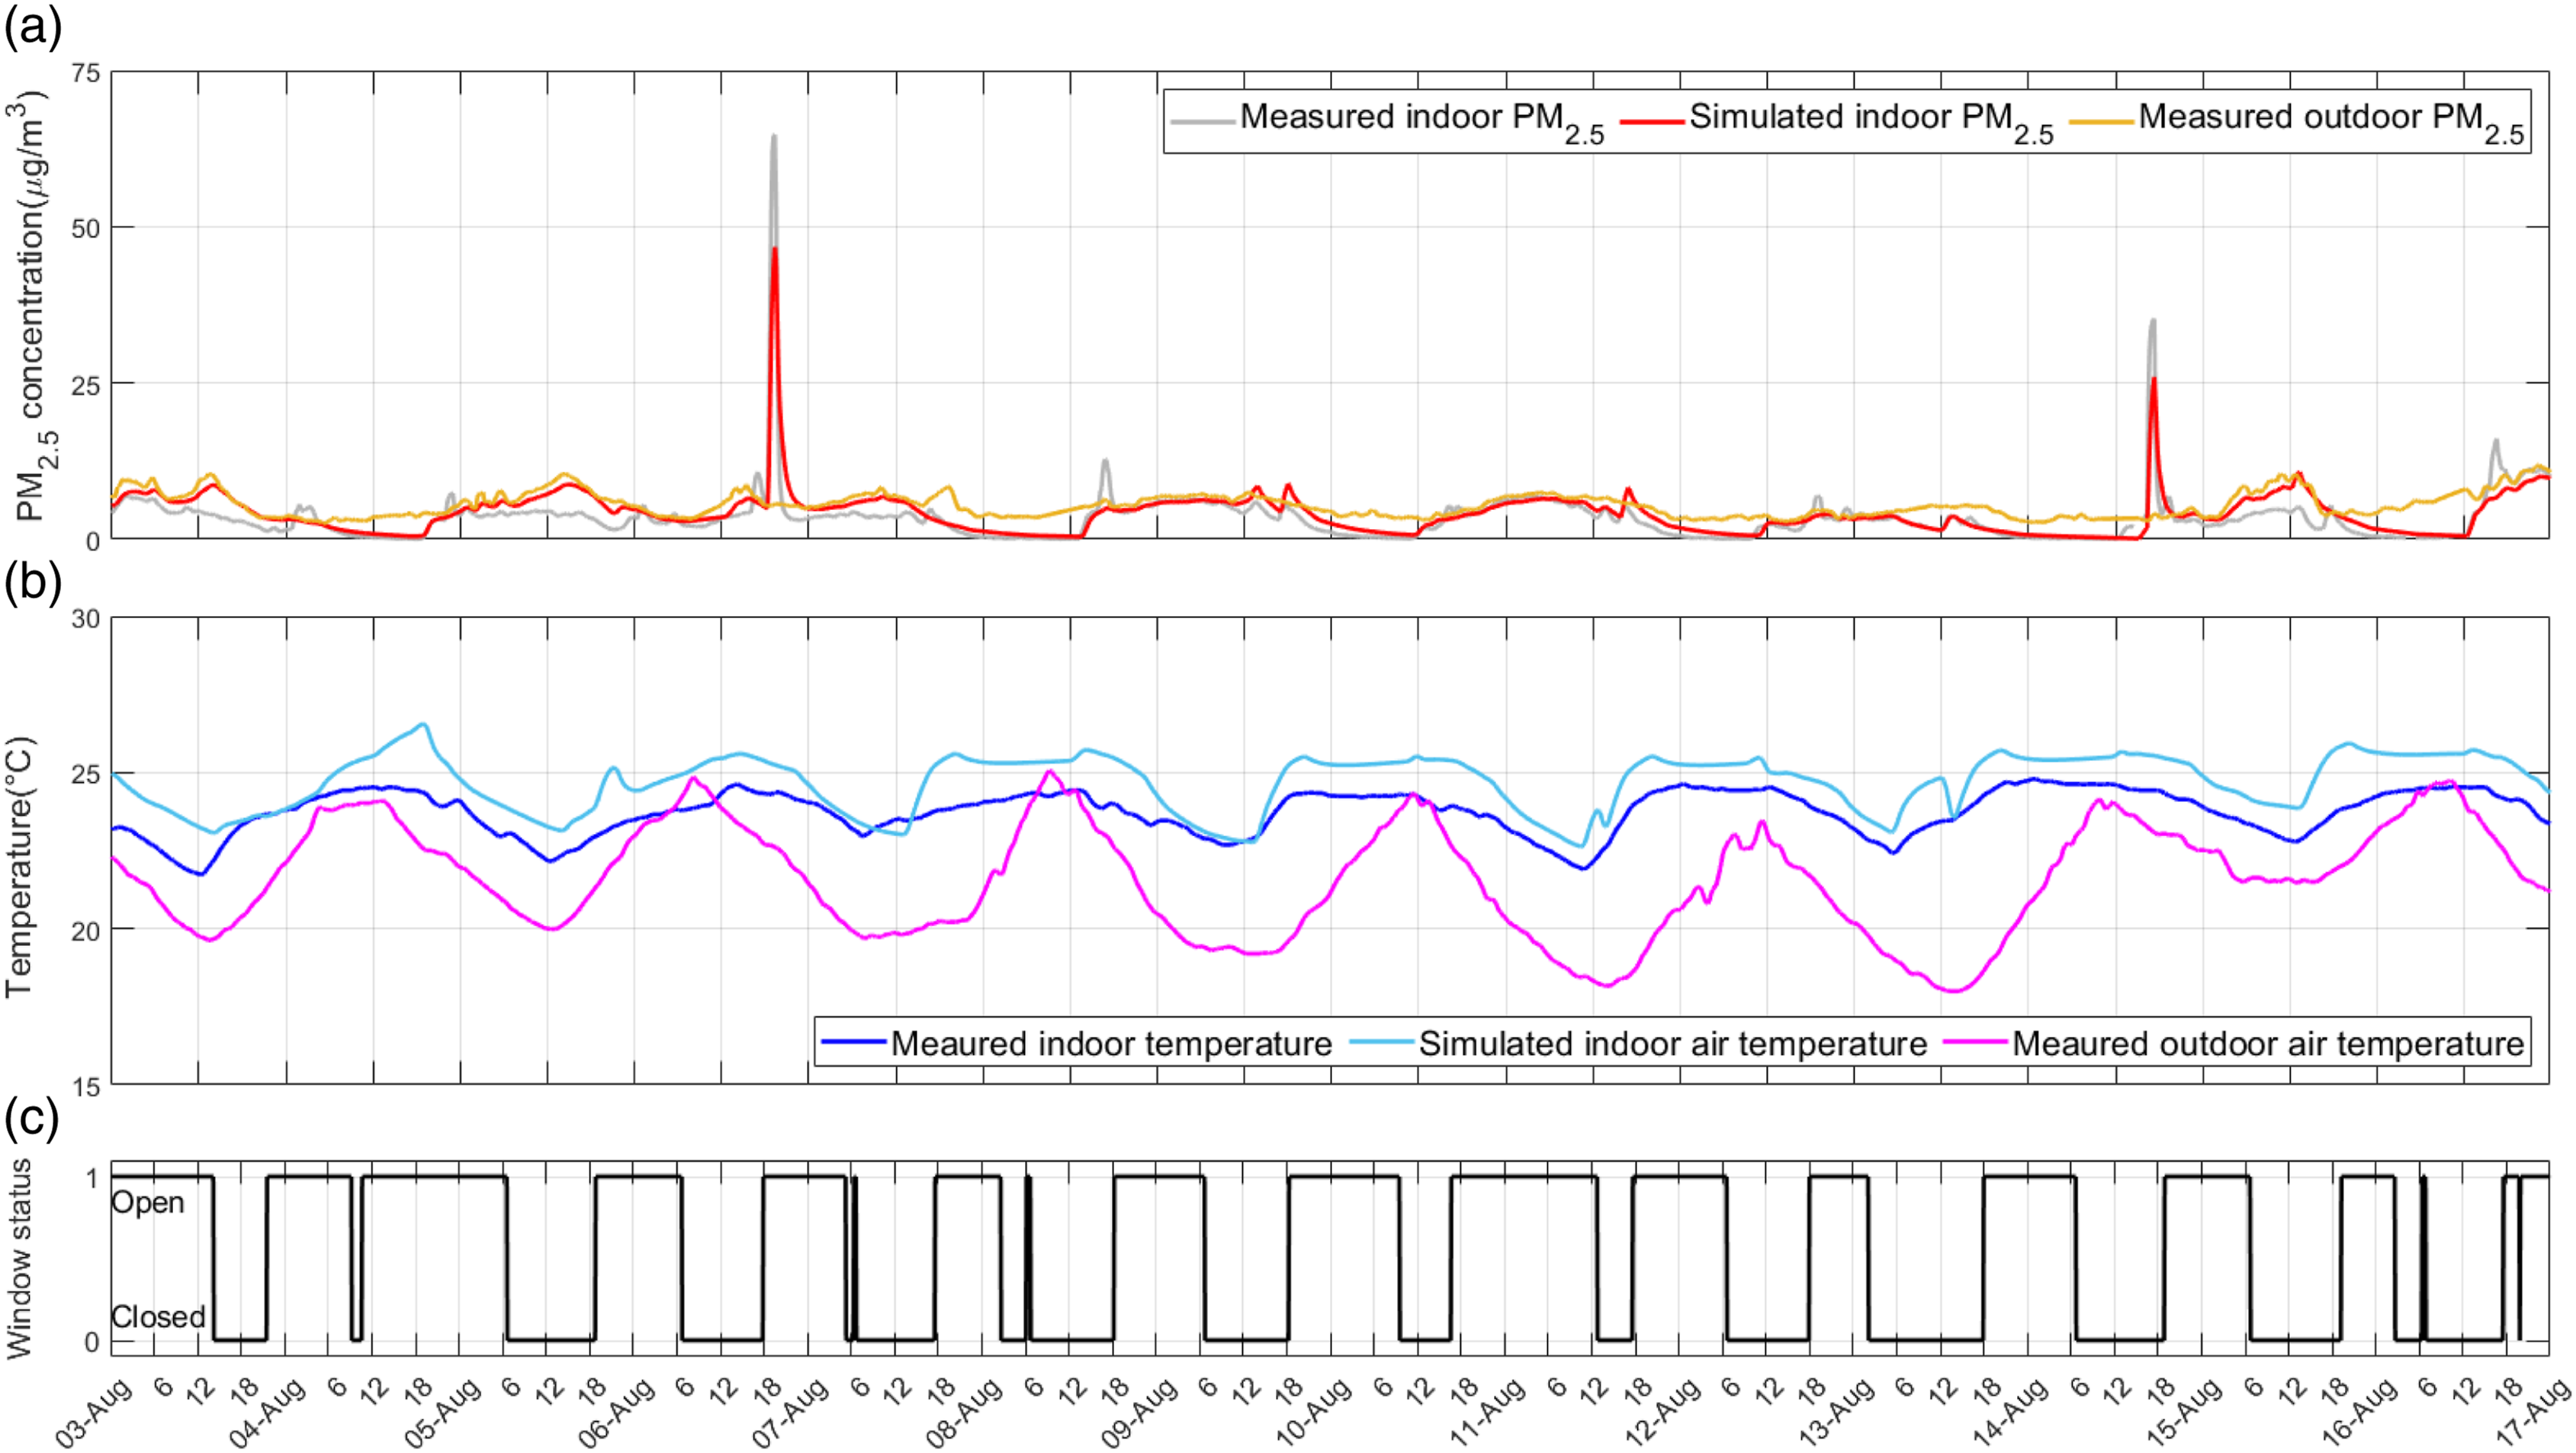
Control strategies and simulation scenarios
Simulation setting for hypothetic summer and winter week.

Controls of windows and HAPs in different scenarios.
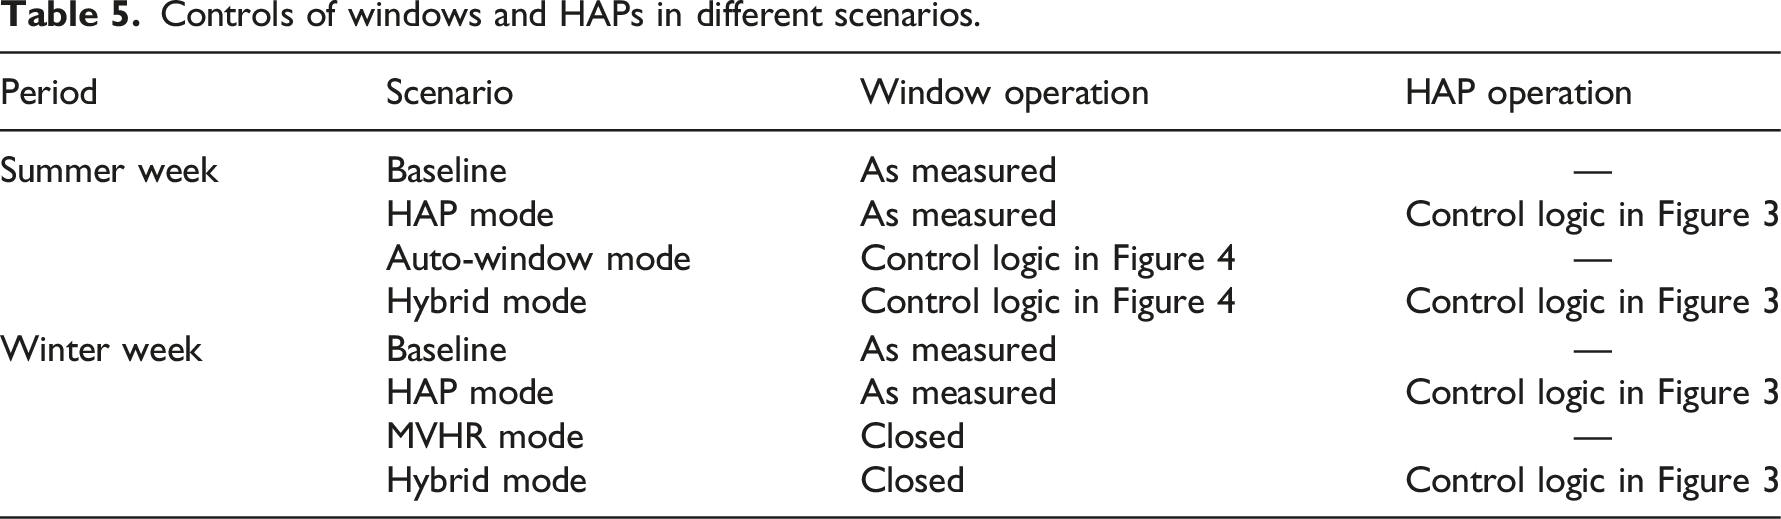
Baseline
The window is operated as measured using sensors and no HAP is used.
HAP mode
The HAP is modelled as being located in the centre of the living room, close to the occupants’ seating area. The control logic illustrated in Figure 3 operates the window as measured, while the HAP is activated once the indoor PM2.5 concentration reaches the ‘HAP-on’ threshold and stops running once the concentration falls to the ‘HAP-off’ threshold. The HAP-on threshold was set to be 15 μg/m3 (the WHO 24-h limit
26
) in both HAP and hybrid modes, as daily performance is of interest for this study. The HAP-off threshold was set to 5 μg/m3 in both the HAP and hybrid modes, as preliminary tests found higher HAP-off thresholds could result in cycling on/off too often. The clean air delivery rate (CADR) was set to 303 m3/h, corresponding to a medium fan speed of the HAP with five different operating modes used in a previous study.
10
The power of the HAP was modelled as 17 W per 100 m3/h of CADR.
27
The HAP operation was assumed to be independent of the window operations based on the findings of recent work.12,28 HAP control logic.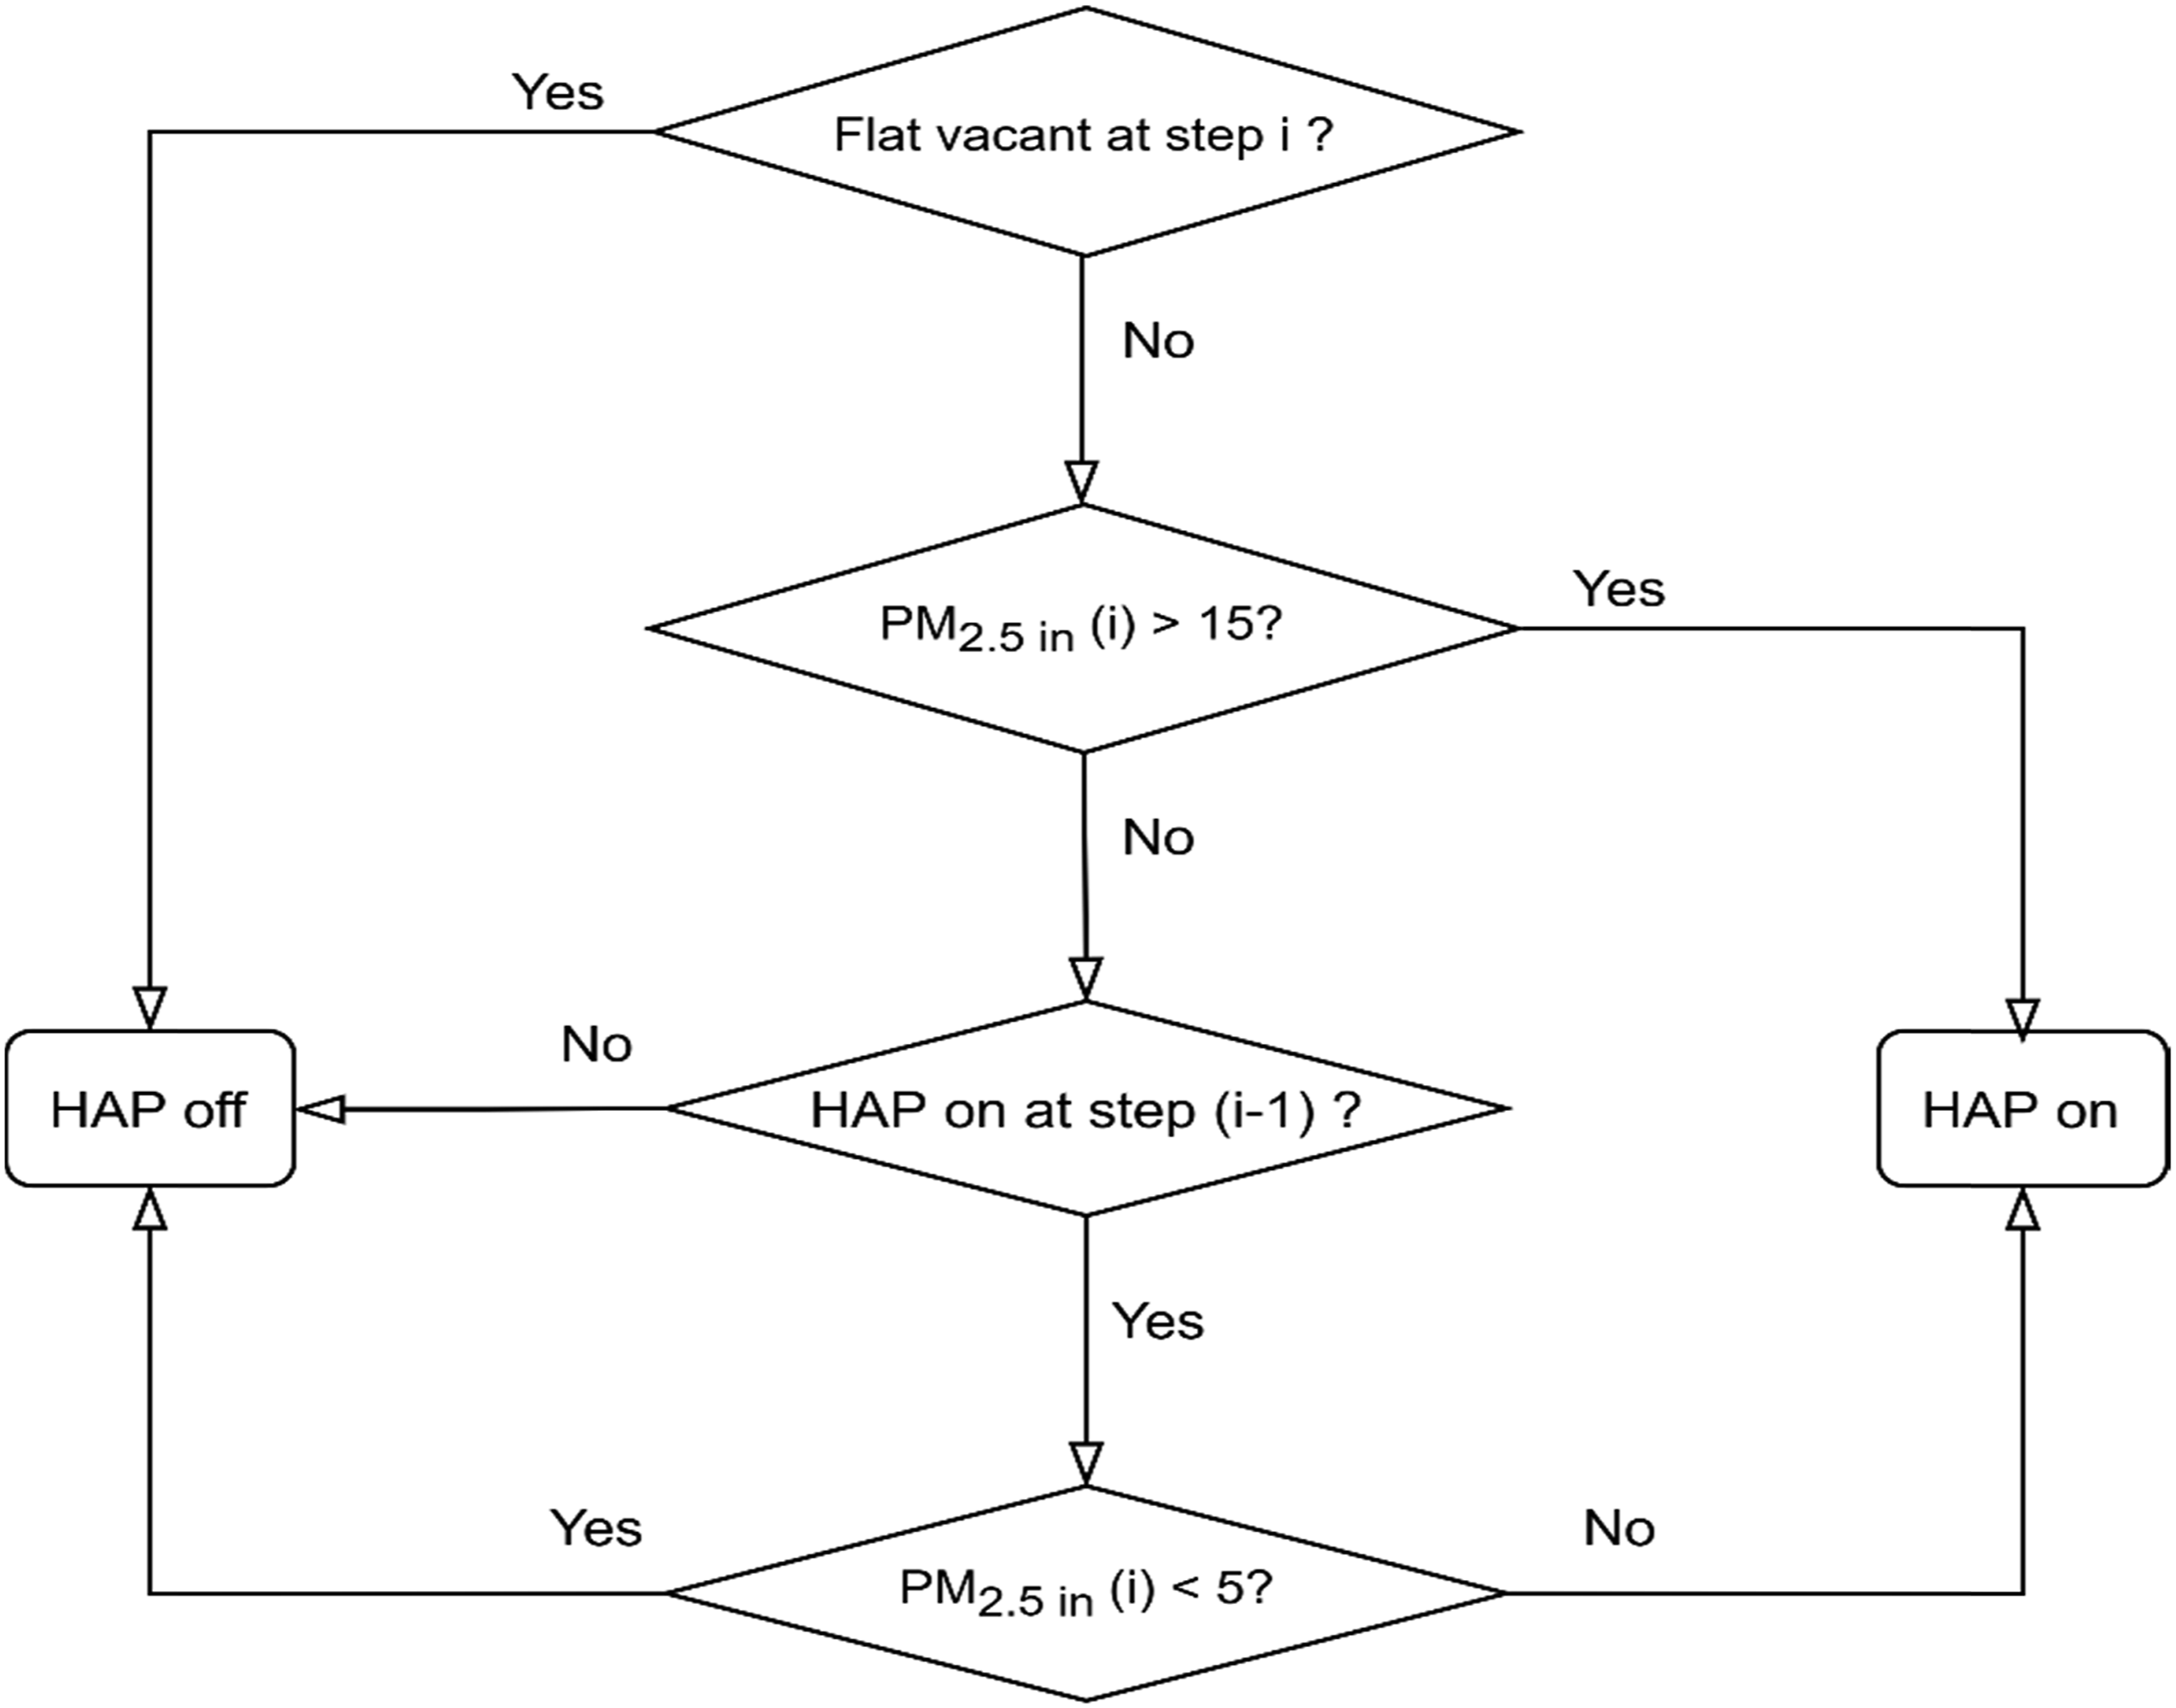
Auto-window control mode
Due to security considerations, the window is programmed to be fully closed at midnight and when people are away, and the flat-level occupancy was determined based on both passive infrared (PIR) and CO2 sensors, with details available in a previous paper.
28
In brief, this method relied upon positive values from the PIR sensors and then used the CO2 concentration to evaluate the negative detection results from the PIR sensors. At other times, the window is set to be fully open when the indoor temperature is above the upper limit or closed when below the lower limit of EN 16798-1 Category II adaptive comfort temperature.
29
In all other conditions, the default window setting is fully open. The control logic for the auto-window mode is illustrated in Figure 4. Auto-window control algorithm.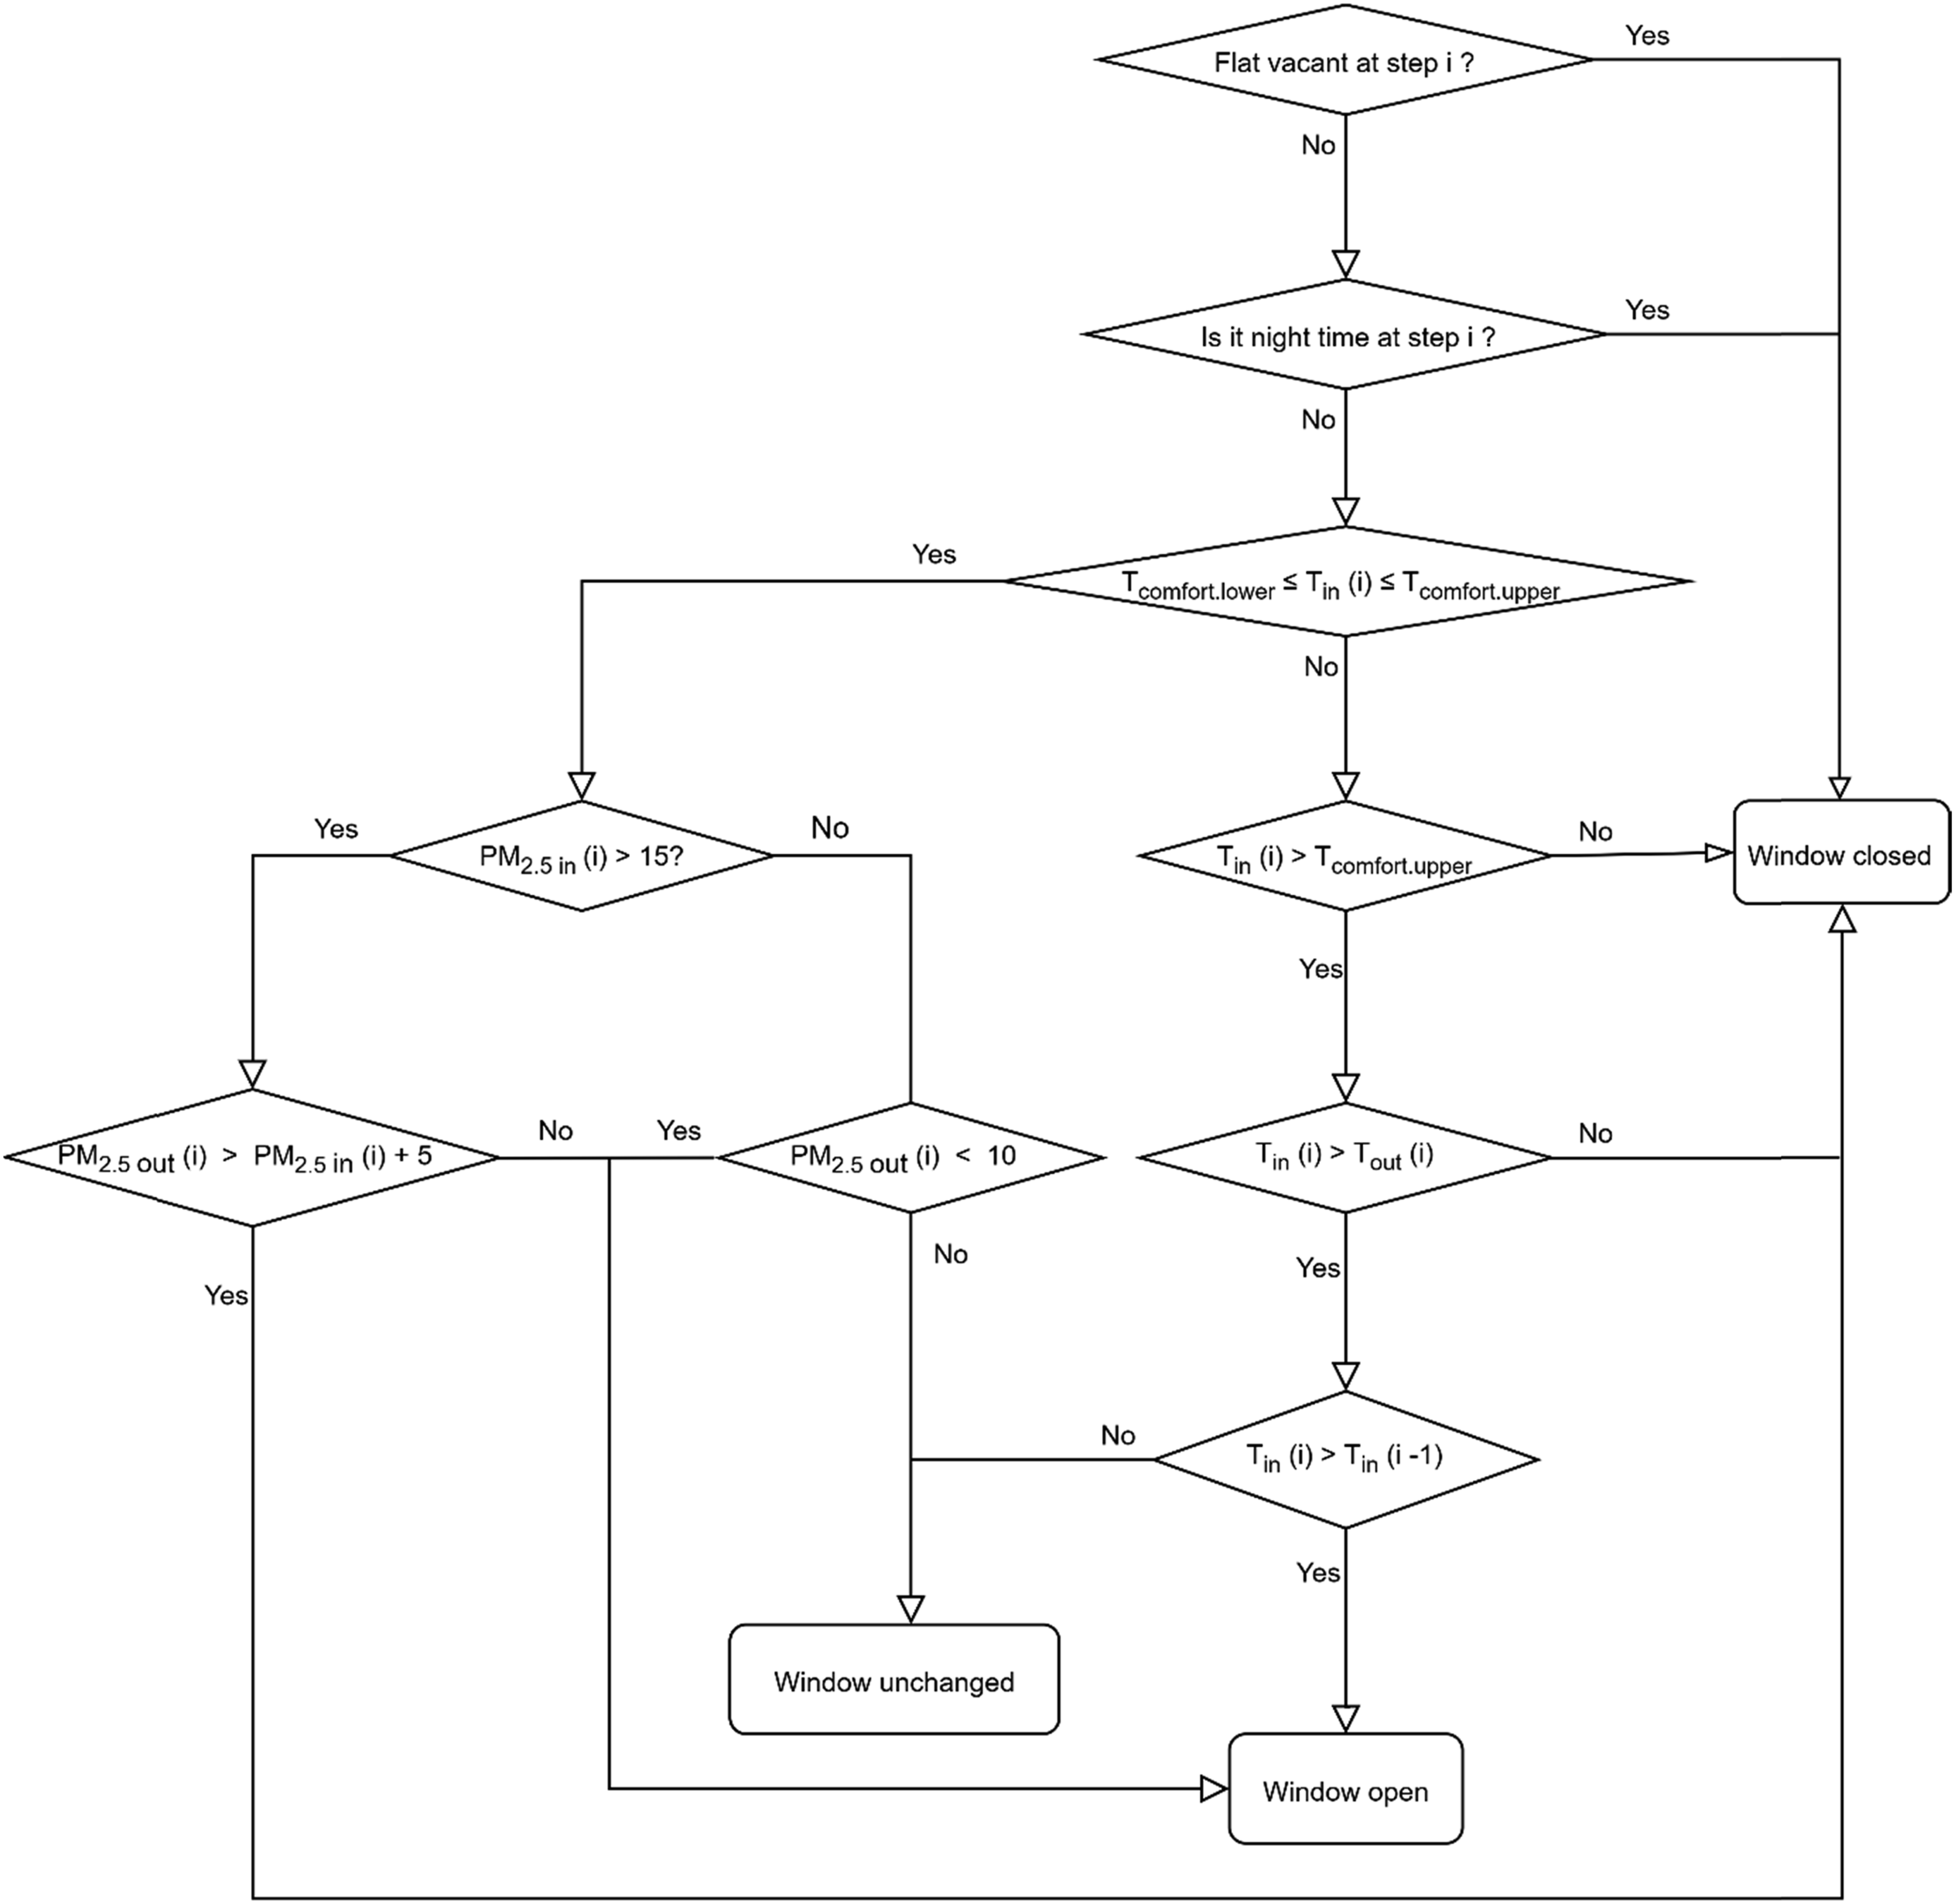
Hybrid control mode
In this mode, the HAP (control logic shown in Figure 3) and window (control logic shown in Figure 4) control functions are running in parallel. The window is operated to prioritise thermal comfort, as in the auto-window mode. However, if outdoor PM2.5 concentration is high, and indoor temperature remains within the comfort zone, the window will be closed and the HAP will be running. This strategy aids in efficient HAP operation. The HAP was located and operated as described in the HAP mode.
Another set of four scenarios was also simulated for the winter week, as detailed in Table 5. The heating system was set to work with a setpoint temperature of 21°C with schedules as found in the UK NCM database. 16 No automatic window mode was modelled in the wintertime, as opening the window to reduce PM2.5 concentration in winter would introduce a cold draught and increase the heating load. Instead, in MVHR and hybrid modes, the mechanical ventilation was simulated to provide continuous background ventilation that met the minimum requirement by the UK government (0.3 l/s/m2 based on Approved Document F Volume 1: Dwellings 2021 edition – for use in England 30 ) with the window shut to avoid heat loss. The hybrid mode for the winter week was a combination of the MVHR system and HAP. The power of the MVHR system was modelled as 42 W based on manufacturer information. No filters were modelled for the MVHR system due to the minimal filtration of the MVHR system as mentioned above.
Health impact assessment
Background and health model description
Quantitative health impact assessments are used to estimate future rates of mortality and morbidity from different interventions compared to what is predicted without such changes. These assessments were used to evaluate the impact of changes to ambient air quality at the urban and regional scales. 31 One approach to the assessment of changes in population mortality is life-table models which predict survival patterns based on changes in age-specific death rates. 32 This type of quantification of health impact has been used to assess air pollution at national scales, 33 as well as the evaluation of building-level changes in exposure.34,35
In the work presented here, life-table models were used to quantify the impacts on mortality from reductions in indoor PM2.5 concentrations. Formulae from Miller and Hurley were the basis for the calculation of changes in mortality and life expectancy.32,36 The life-table model was implemented with the open-source statistical software R.
37
A schematic diagram of the model inputs, structure and flow is presented in Figure 5. The same underlying birth and mortality rates from the starting year (2019) were assumed to apply in all future years. The conceptual framework for life-table calculations of the impact on mortality from automated control of window operations and HAP use.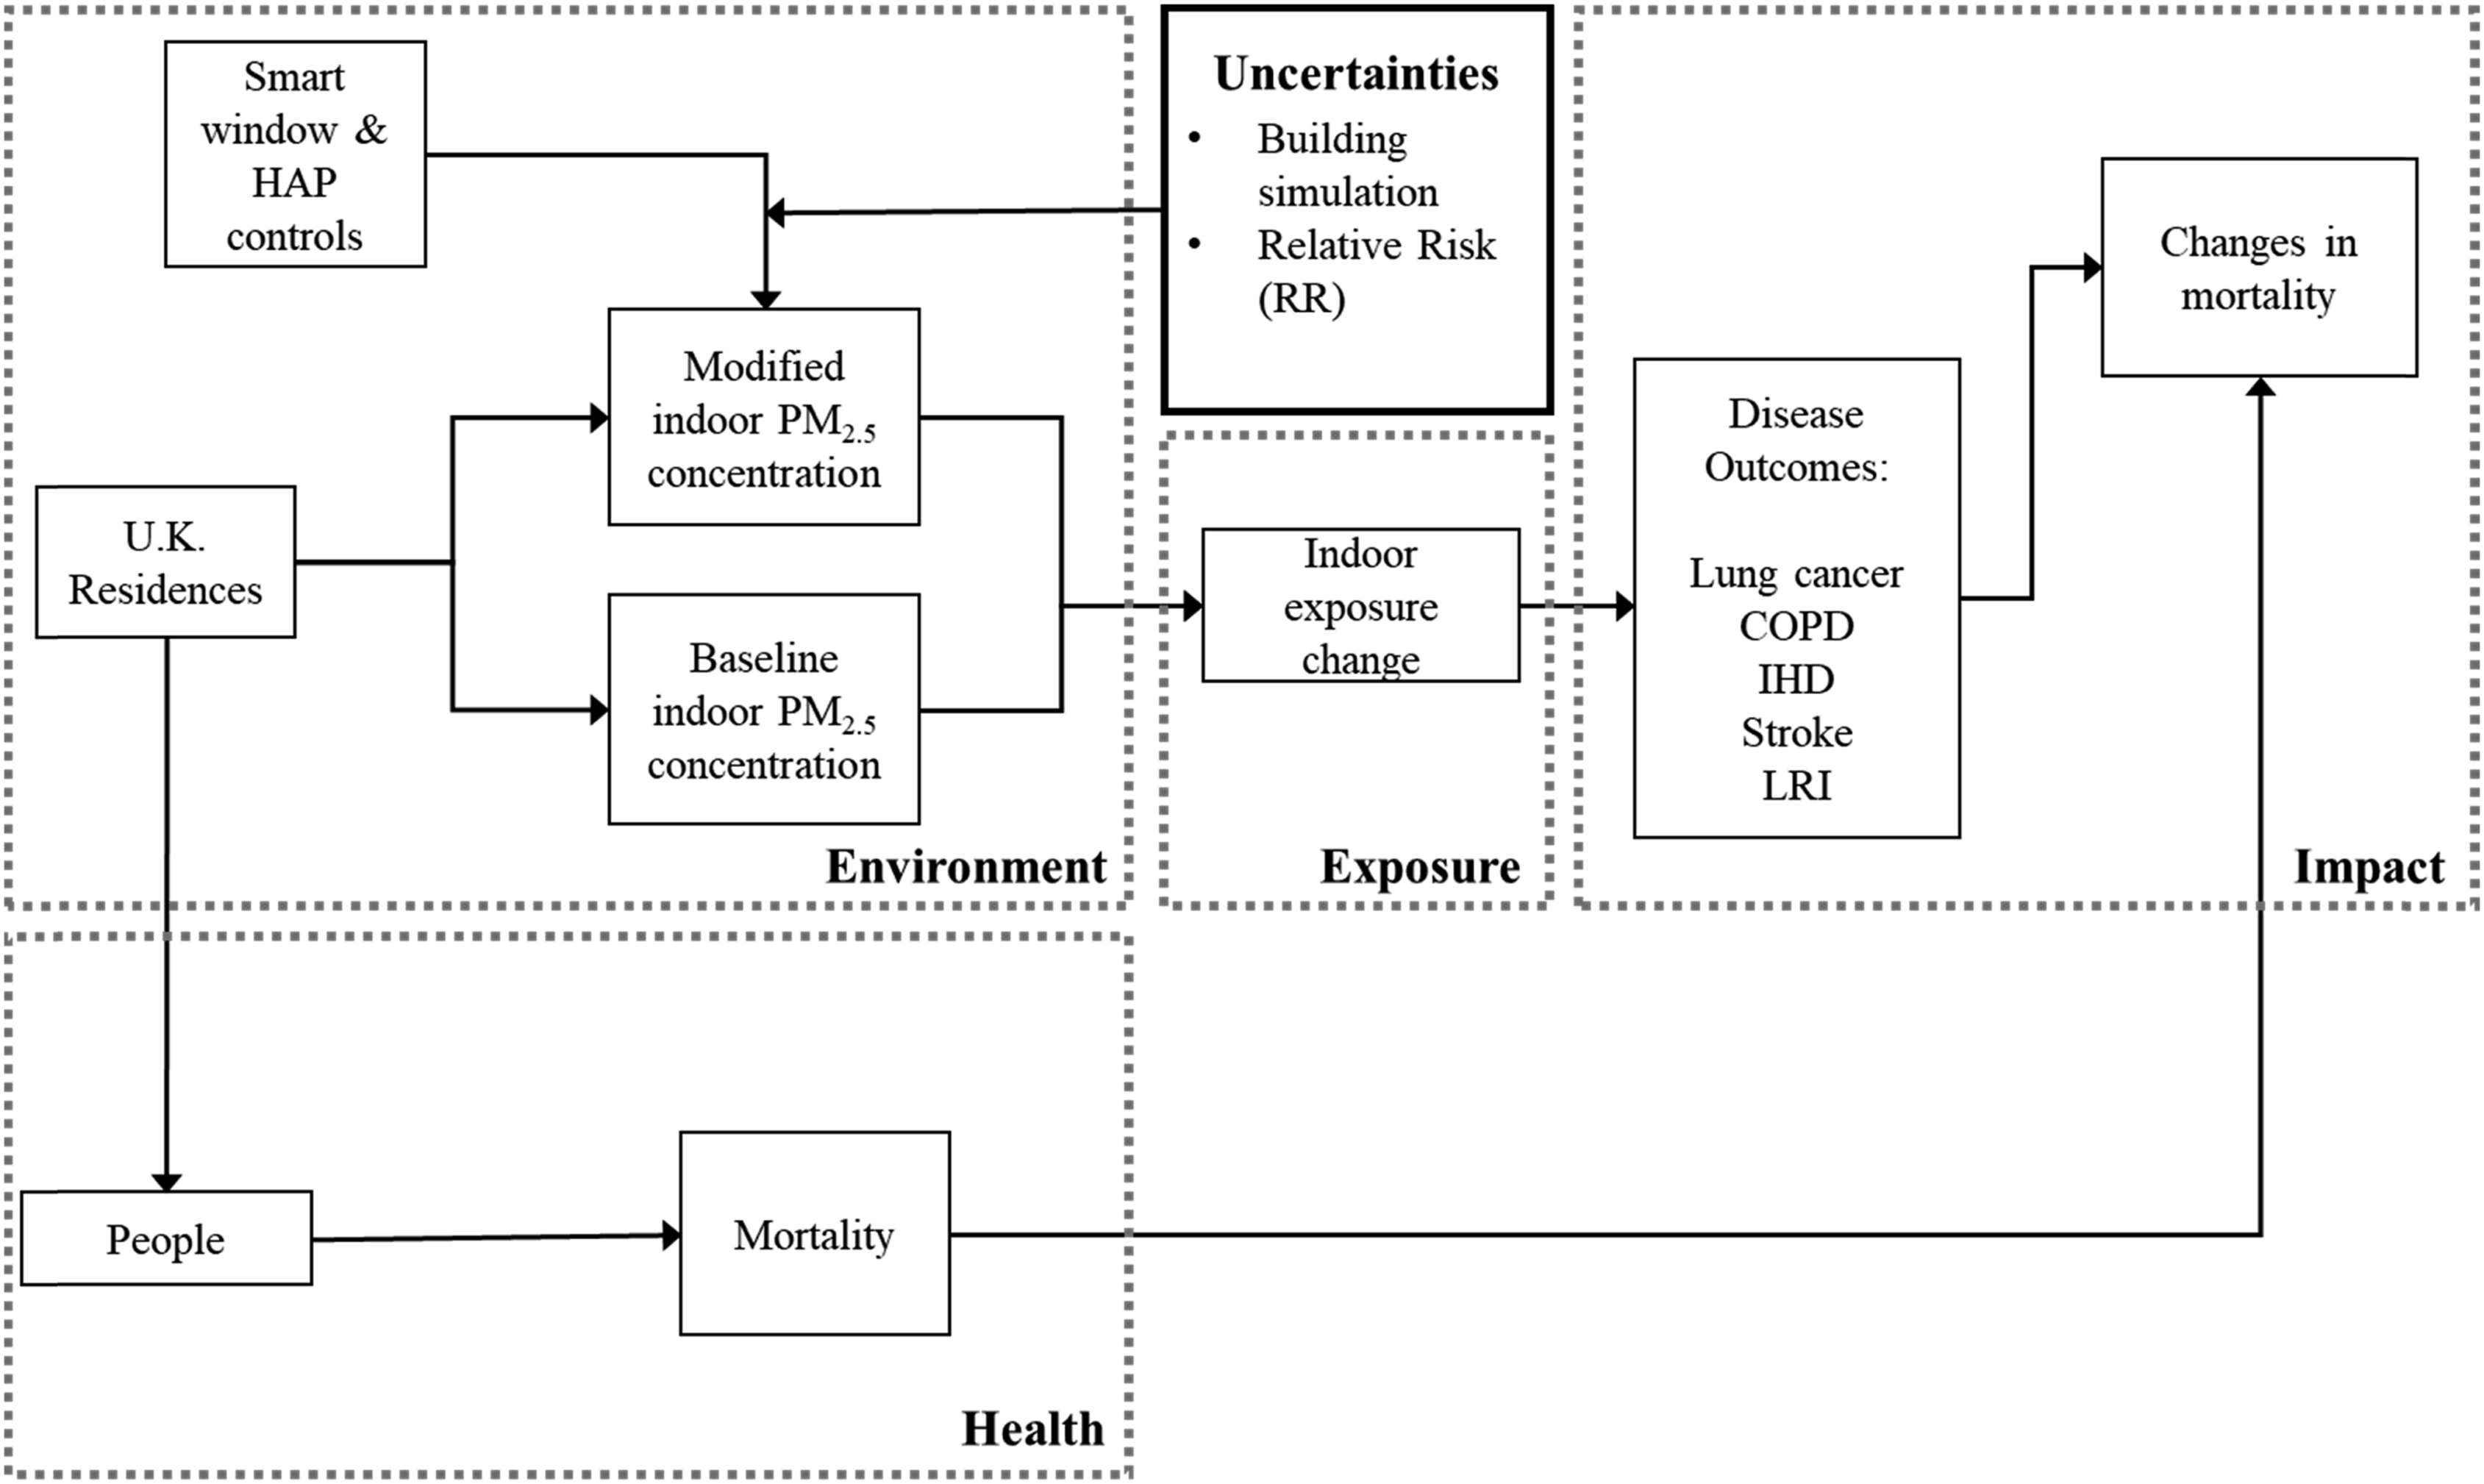
Health model parameterisation
The life-table model was used to determine the benefit from the reduction of indoor PM2.5 in residences such as the case study flat in the UK from the use of building environmental controls that automate the use of HAPs and window operations. Reductions in mean daily exposure were from the time spent in the living room where the air purifier was located and was estimated to be 7 h per day based on occupancy monitoring and other surveys. 38 The results from the modelled case study flat were used for all scenarios: the average of the modelled concentrations of the summer and winter weeks from the baseline, automated window mode in summer with MVHR system mode in winter, HAP and hybrid modes in both summer and winter.
Population and age-specific disease and mortality data for 2019 from the Office for National Statistics were used to parameterise the model. Mortality rates and relative risks (RR) for causes the Global Burden of Disease (GBD) found to be associated with PM2.5 were included in the model: all-cause, lung cancer, chronic obstructive pulmonary disease (COPD), lower respiratory infection (LRI), stroke and ischemic heart disease (IHD). Age-specific all-cause and disease-specific mortality rates were taken from the 2019 GBD study. The upper and lower limits of the 95% confidence intervals of the RRs were calculated and used to test impacts across the range of potential risks (which will be further discussed in the next section).
Previous findings from other research showed that the use of a lag between the intervention that reduces PM2.5 concentrations and changes in health outcomes (i.e. cessation lag) made relatively little difference to the life-table results over the long-term. 33 Therefore, the model used in the work described here does not include a cessation lag.
Health model uncertainty analysis
Recognising that the exposure-response function per change in PM2.5 could introduce uncertainty into the model, the effect of using the range of values within the 95% confidence intervals of the RRs derived from the 2019 Global Burden of Diseases was tested using the 95% confidence intervals. This method was in line with the recommendations for sensitivity analysis made by COMEAP. 33
Results
Summer week
Baseline scenario
As seen in Figure 6, the daily mean of PM2.5 concentration exceeds the WHO 24-h limit of 15 μg/m3 on 6 days out of the week, while the indoor temperature stayed within the comfort range the whole time. Summer week: Baseline.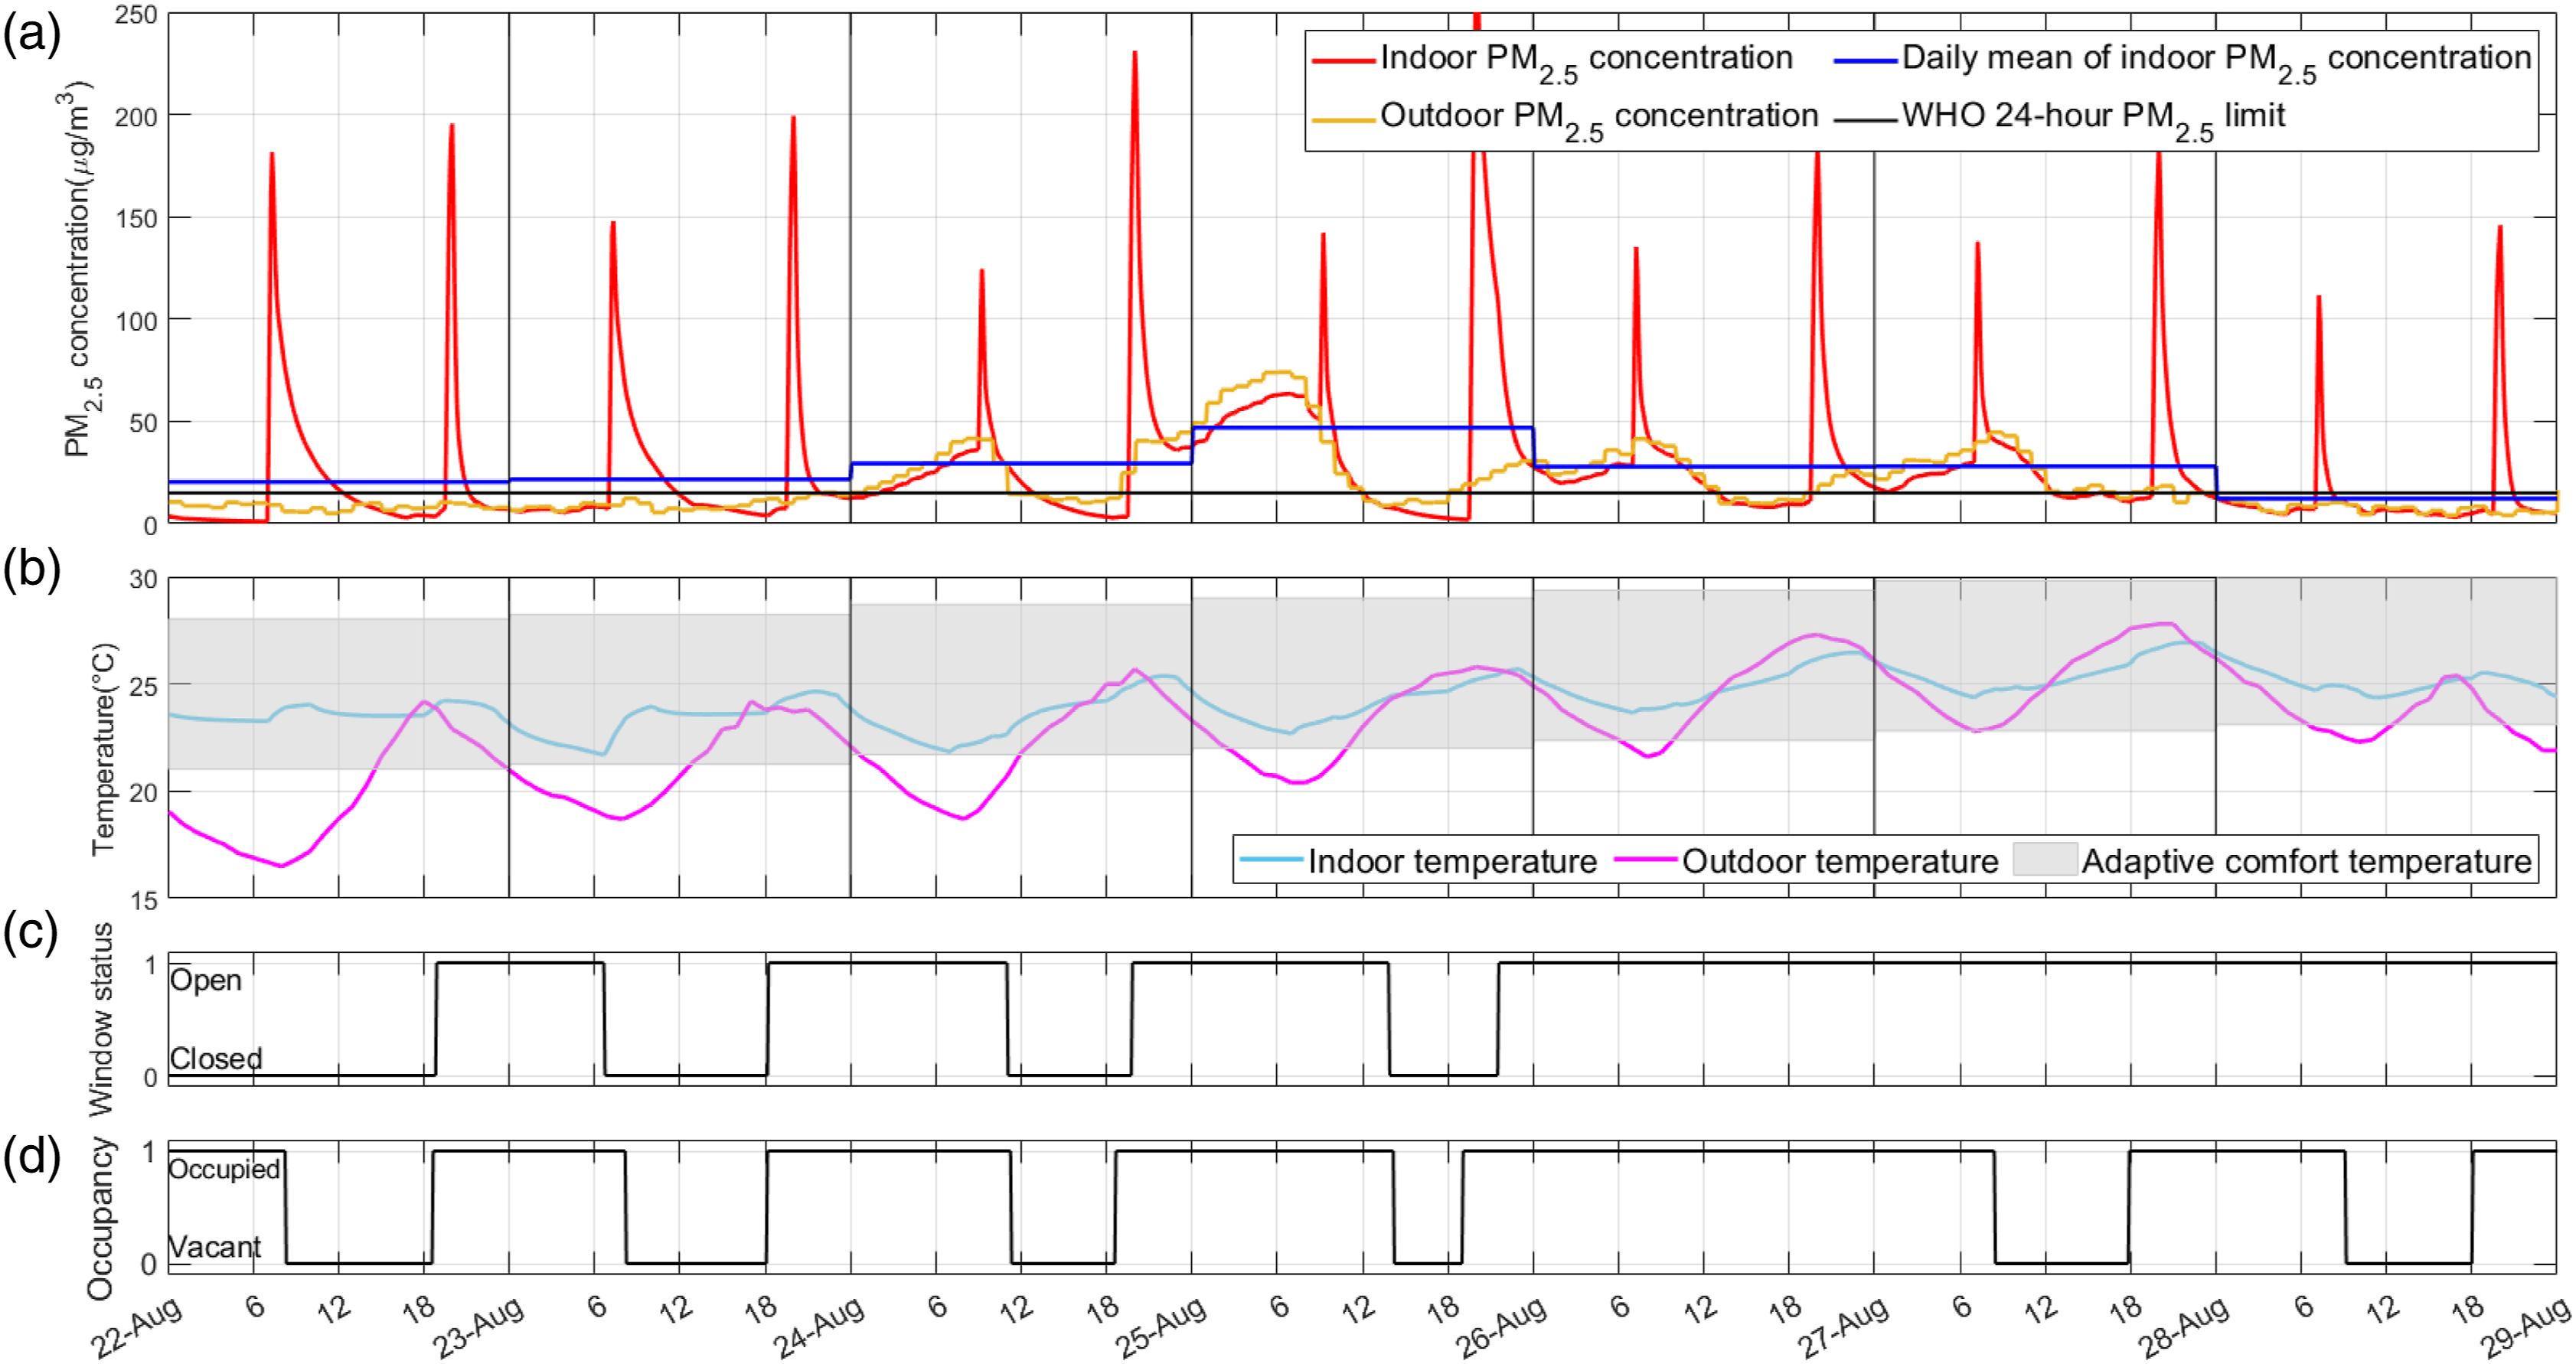
Auto-window mode
As shown in Figure 7, the automatic window system reduced the number of days when indoor PM2.5 concentration exceeded the WHO limit to 4 days (compared to 6 days in the baseline scenario), while still maintaining thermal comfort. The key action taken that reduced indoor PM2.5 was the automatic opening of the window during morning cooking on the first two days. Nevertheless, the result shows that relying solely on window controls may not be sufficient when both indoor and outdoor pollution are high. Summer week: Auto-window mode.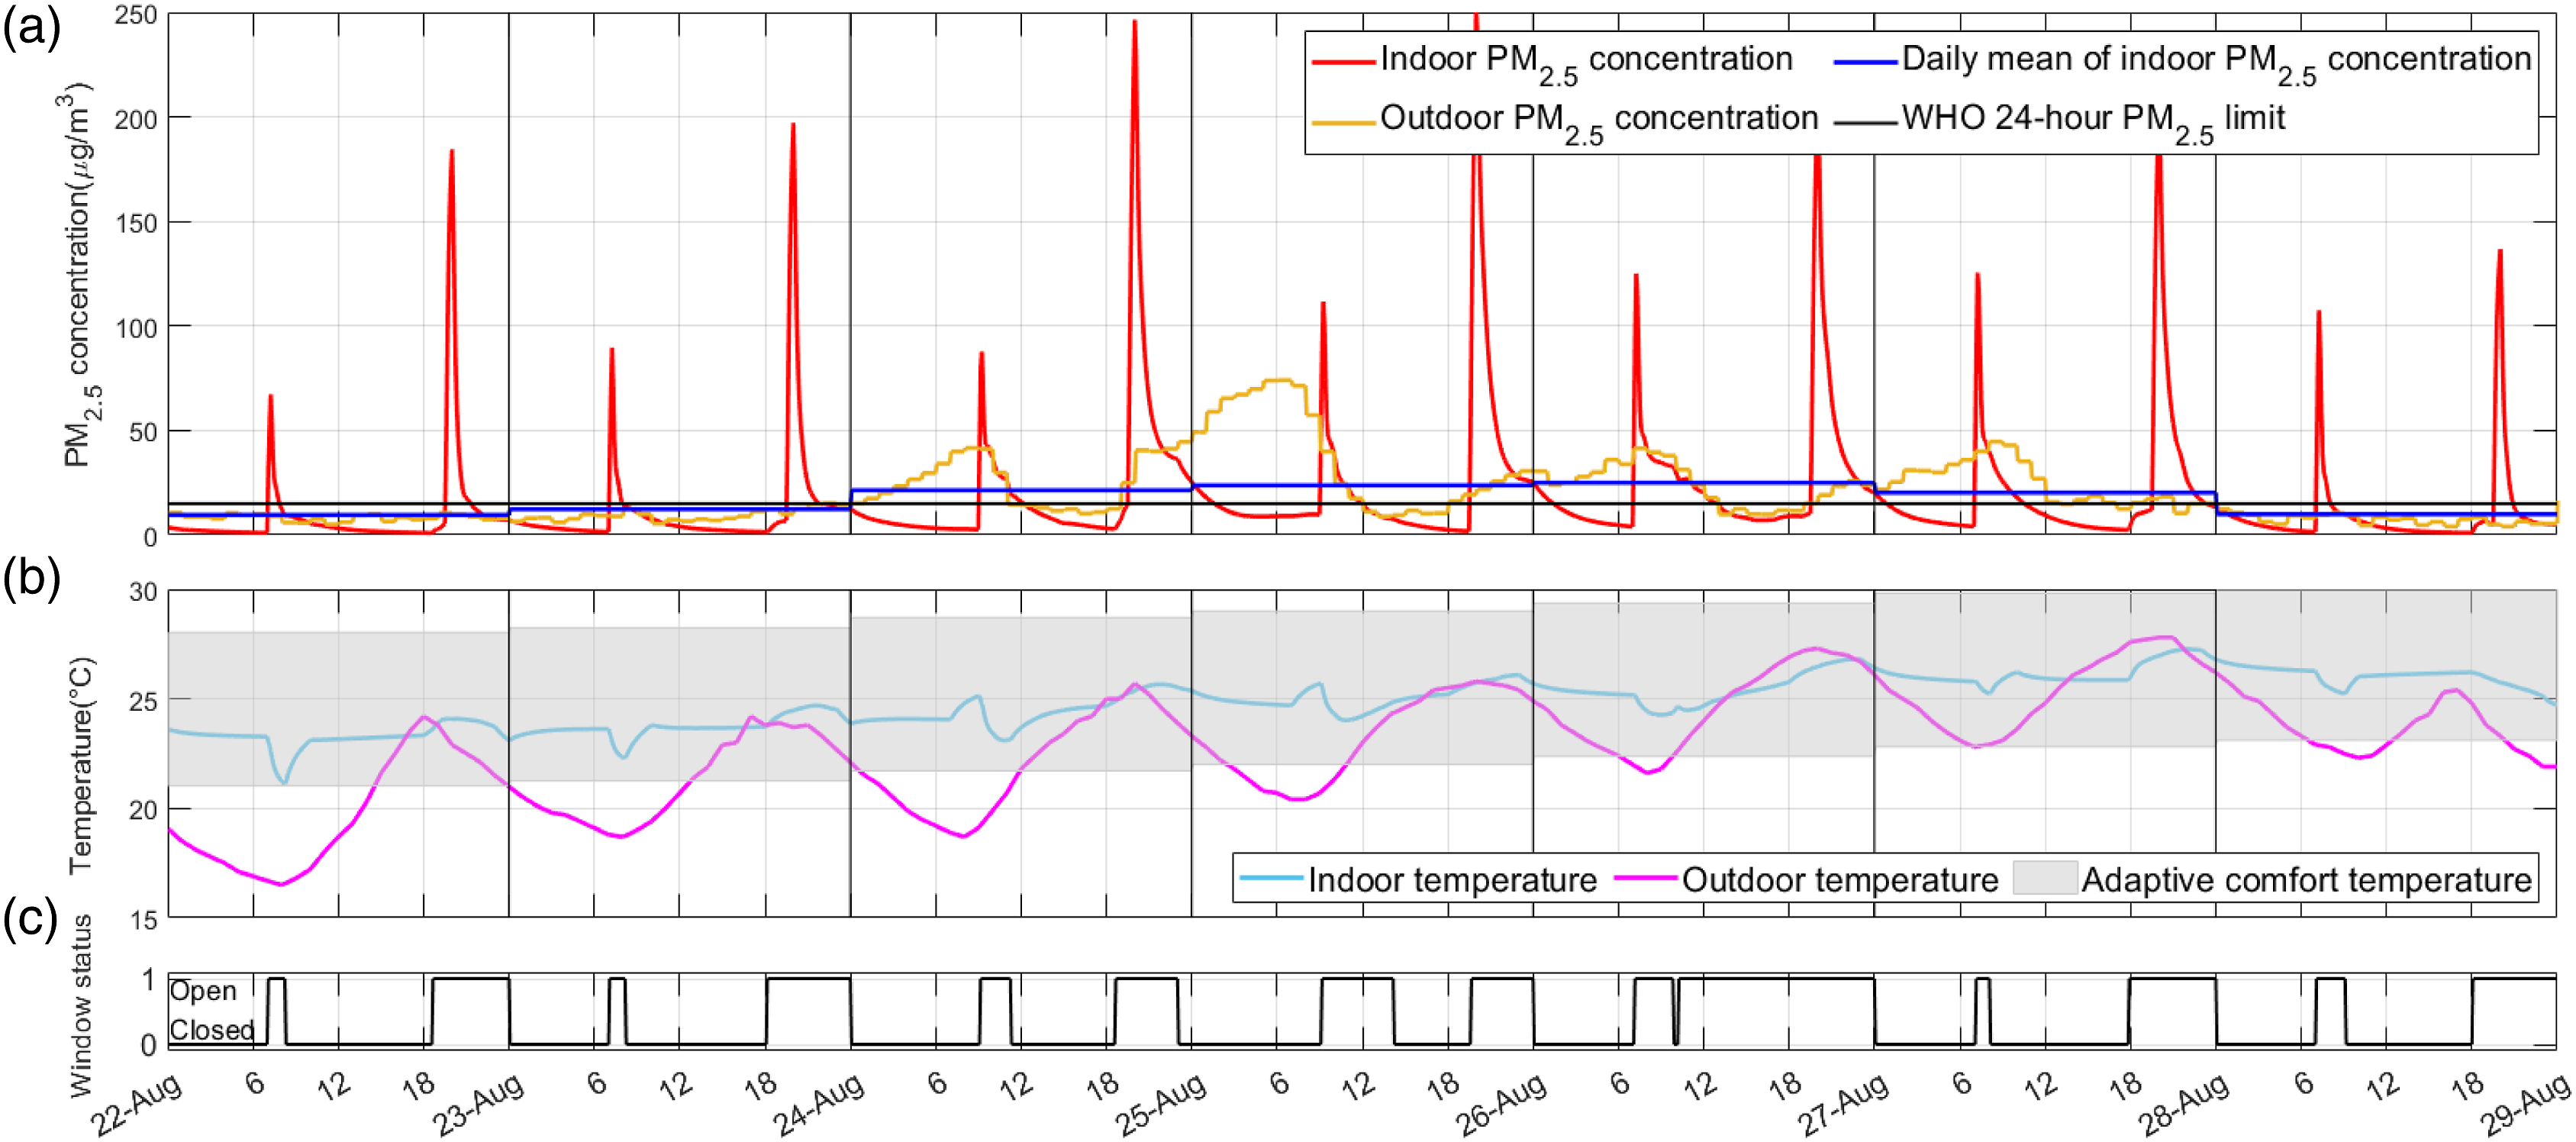
HAP mode
Note that the window opening schedule and temperature profiles for the HAP mode were the same as in the baseline scenario of the summer week. As shown in Figure 8, there were still two days (25th and 27th August) when, even with the use of HAP, the daily mean concentration of indoor PM2.5 was above the WHO limit, with another two days (24th and 26th August) approaching the limit. The primary factor was that outdoor PM2.5 levels were high on those days, therefore, leaving the window open for long periods worsened indoor conditions. Summer week: HAP mode. Note that the corresponding window status and temperature profiles were the same as the baseline and are therefore not repeated here.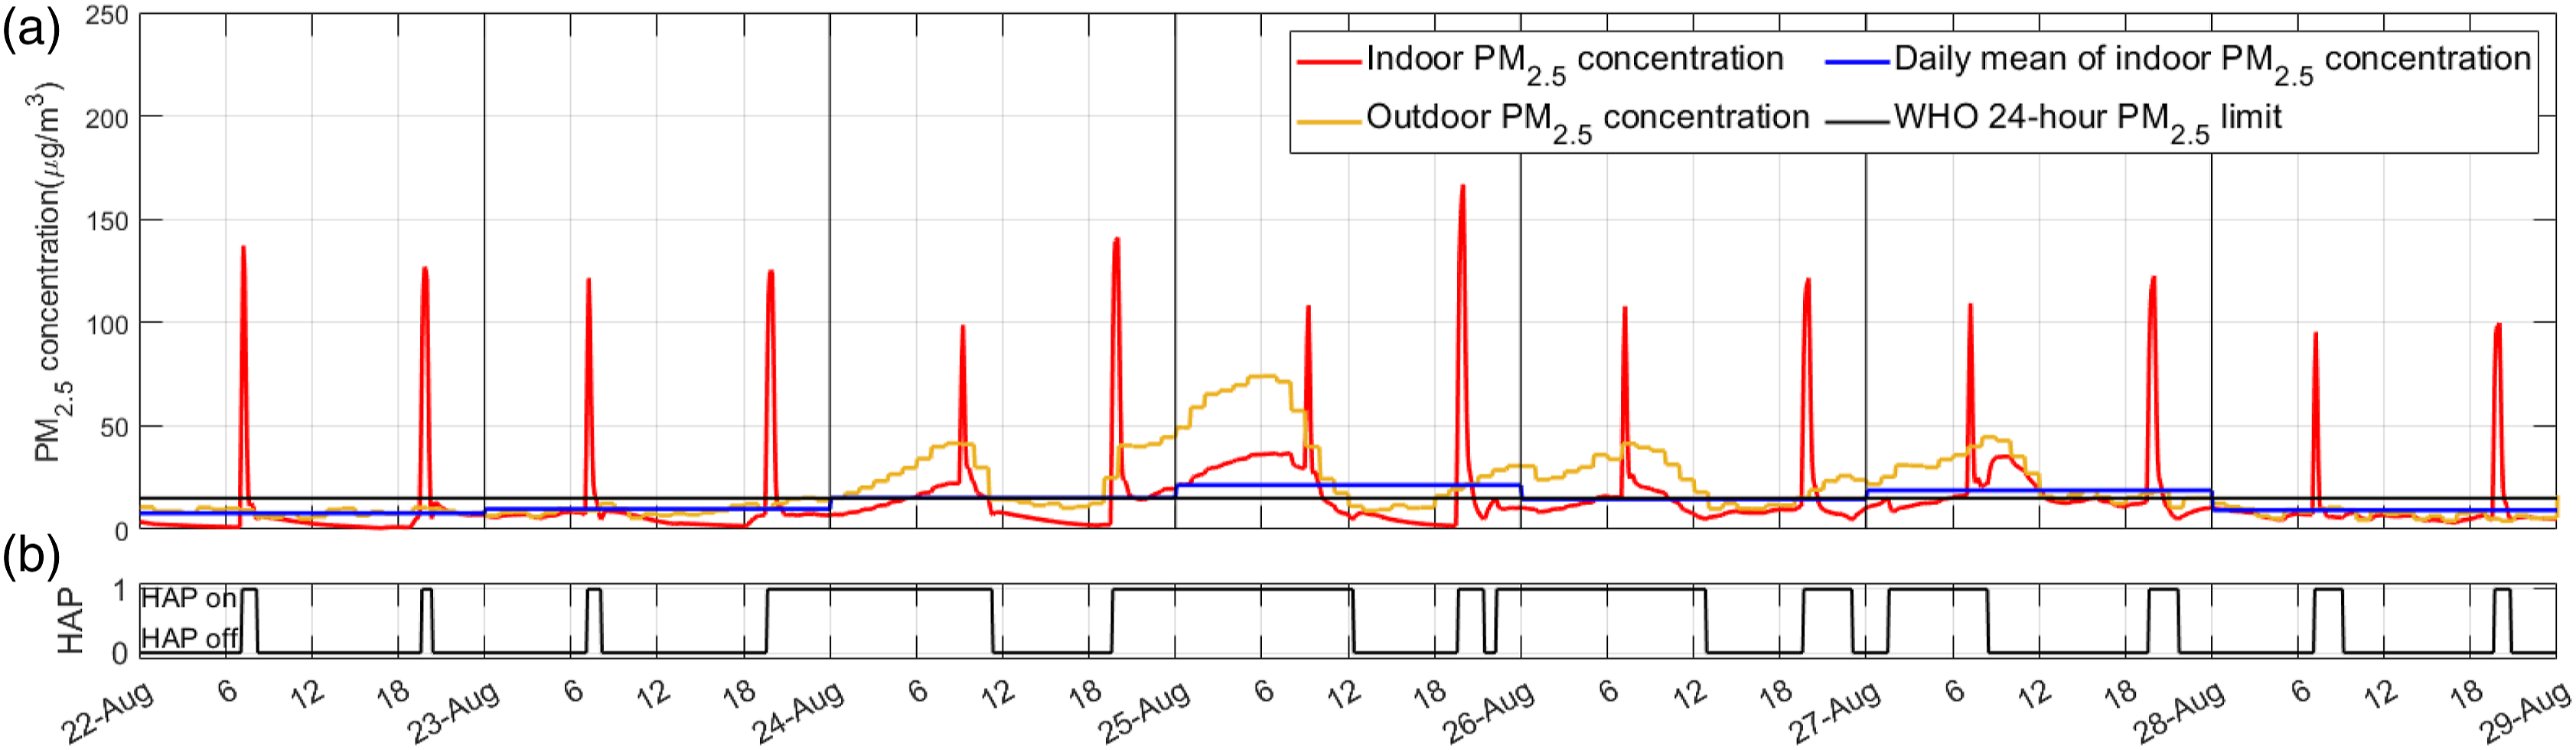
Hybrid mode
When both automatic HAP and window controls were used, the indoor PM2.5 concentration was reduced substantially with no days exceeding the WHO limit. As shown in Figure 9, the indoor temperature was not compromised and stayed within the comfort range. The main advantage of the joint control of HAP and windows was that the window was shut when outdoor pollution was high, such that not only the working burden of HAP was minimised but also the overall indoor PM2.5 concentration was lower. On the other hand, the hybrid control algorithm sought opportunities to open the window for ventilation whenever the outdoor conditions allowed. For example, on 26th August, the window was directed to be closed for most of the time, because the outdoor PM2.5 concentration was above the defined limit, but the window was still open for a short period for three times in the afternoon and evening. Summer week: Hybrid mode.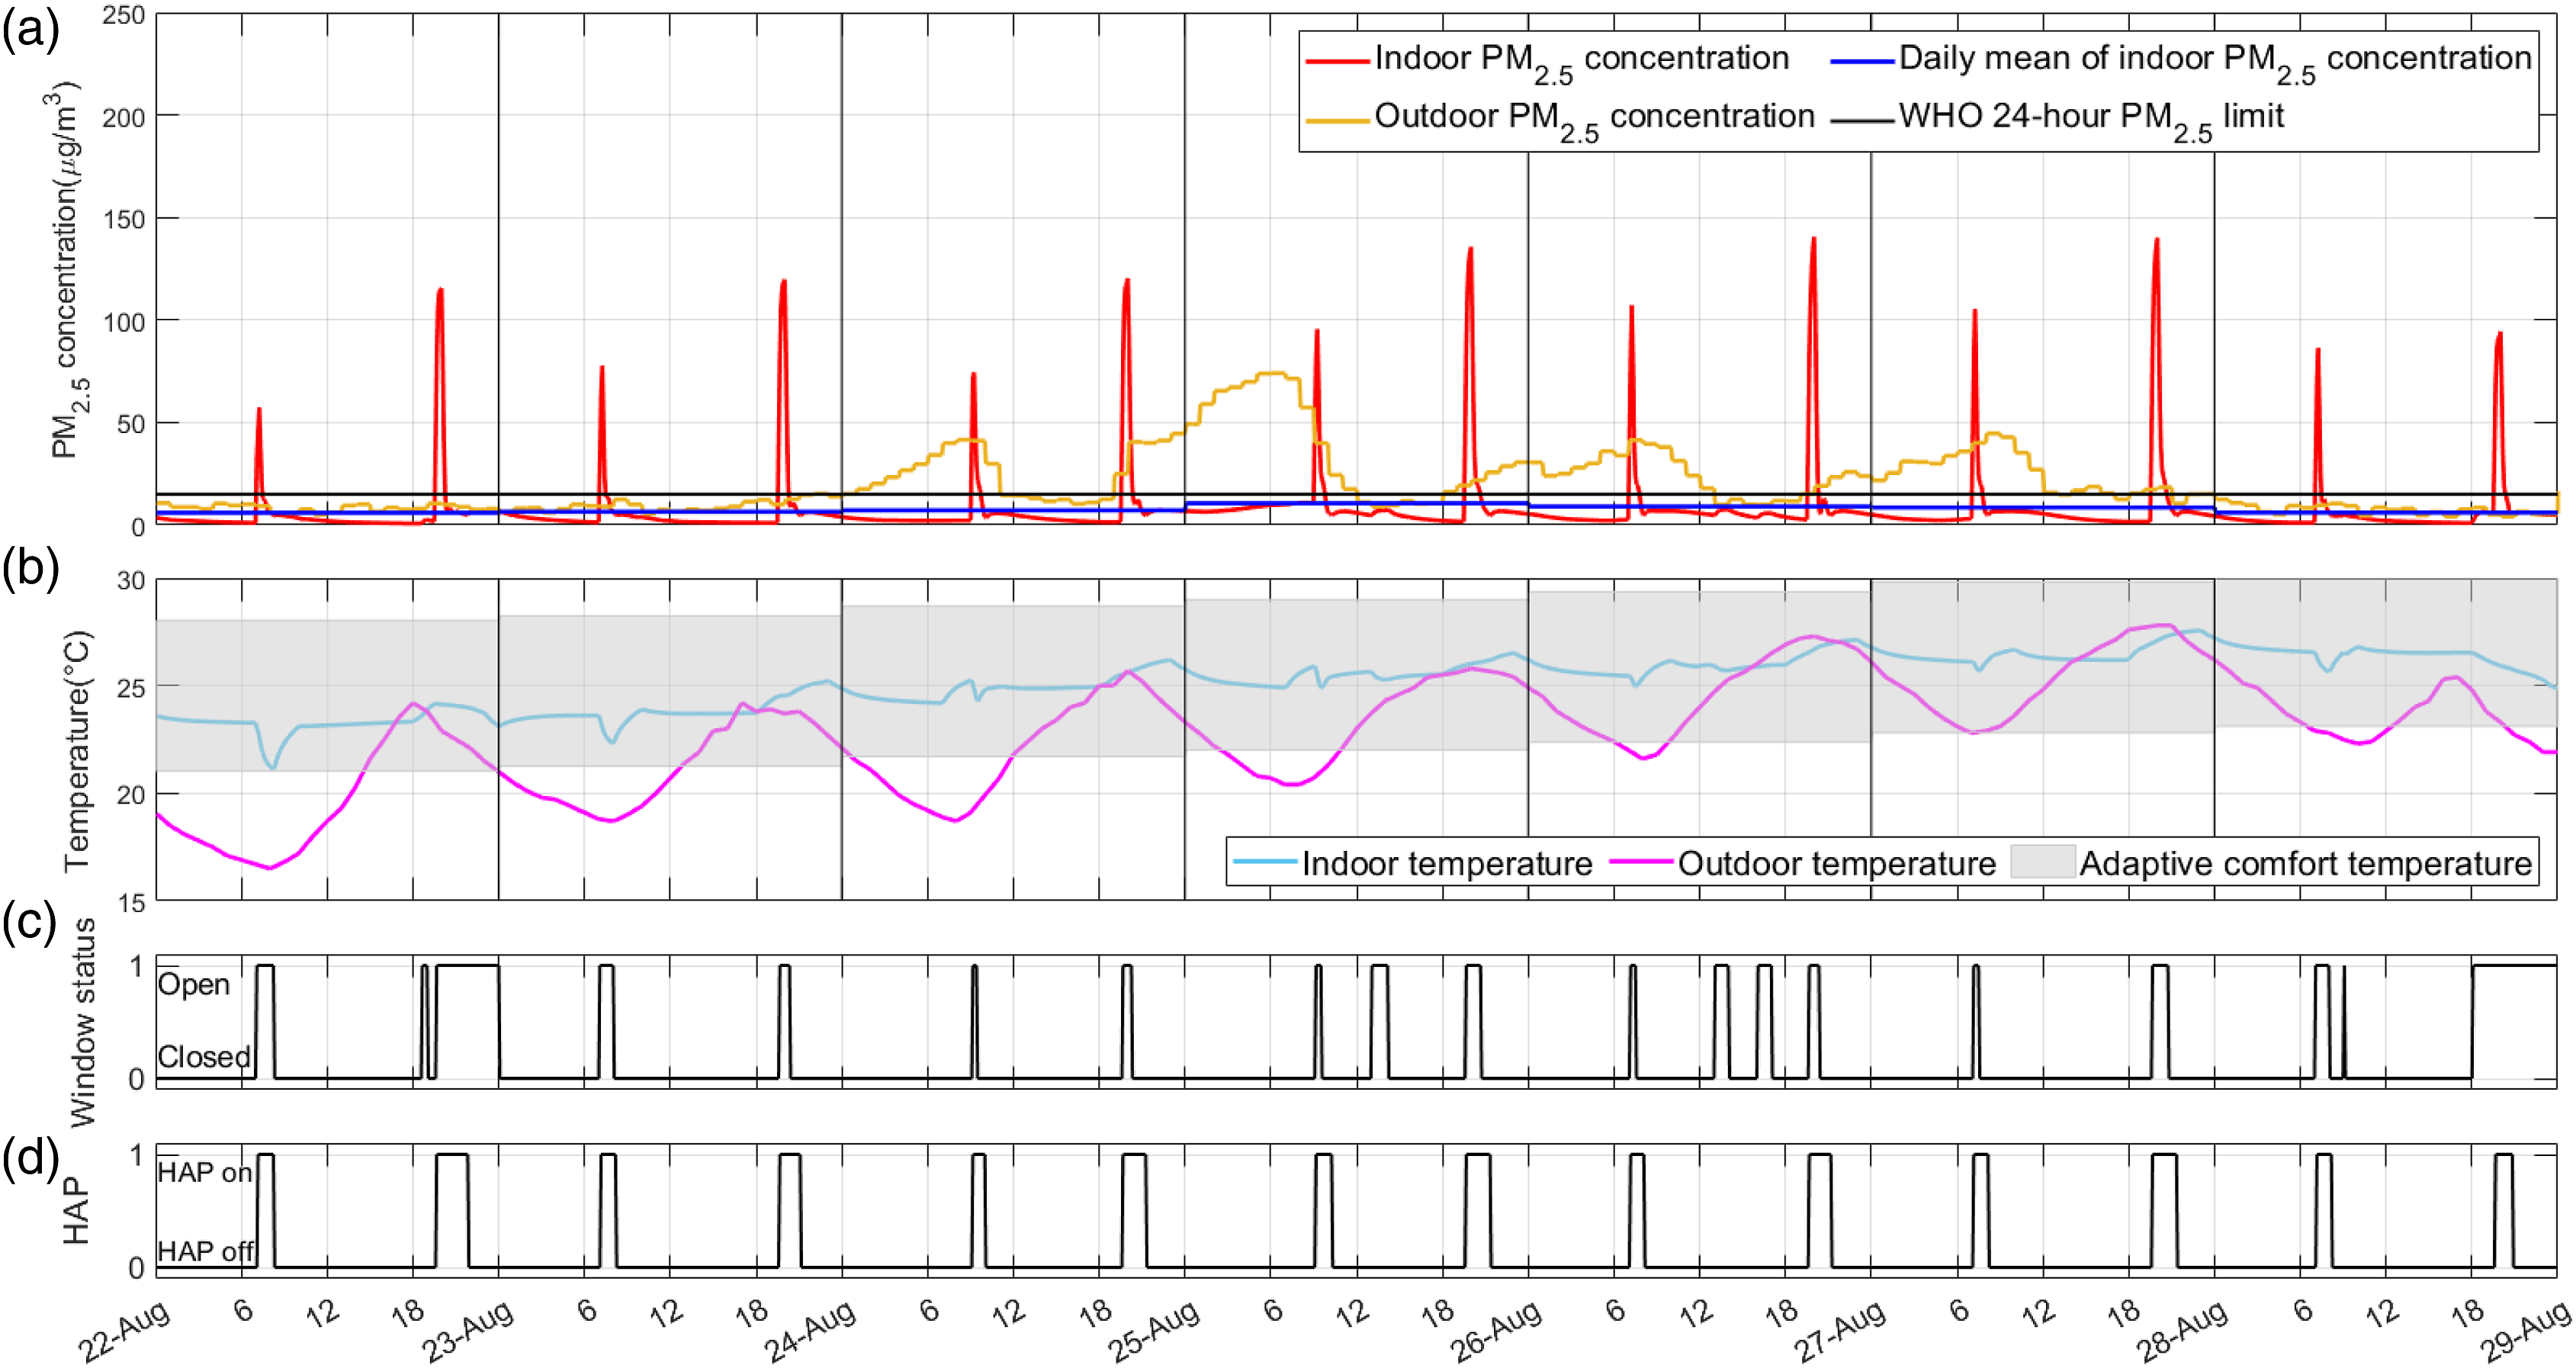
Metrics for evaluation of different control modes in the summer week.
Winter week
Baseline
As shown in Figure 10, with the window mainly staying closed and the same cooking schedule, the daily mean concentration of indoor PM2.5 was very similar across the week, almost twice as high as the WHO 24-h limit. The indoor temperature was maintained around the heating point during the scheduled hours due to fixed heating schedules. Winter week: Baseline.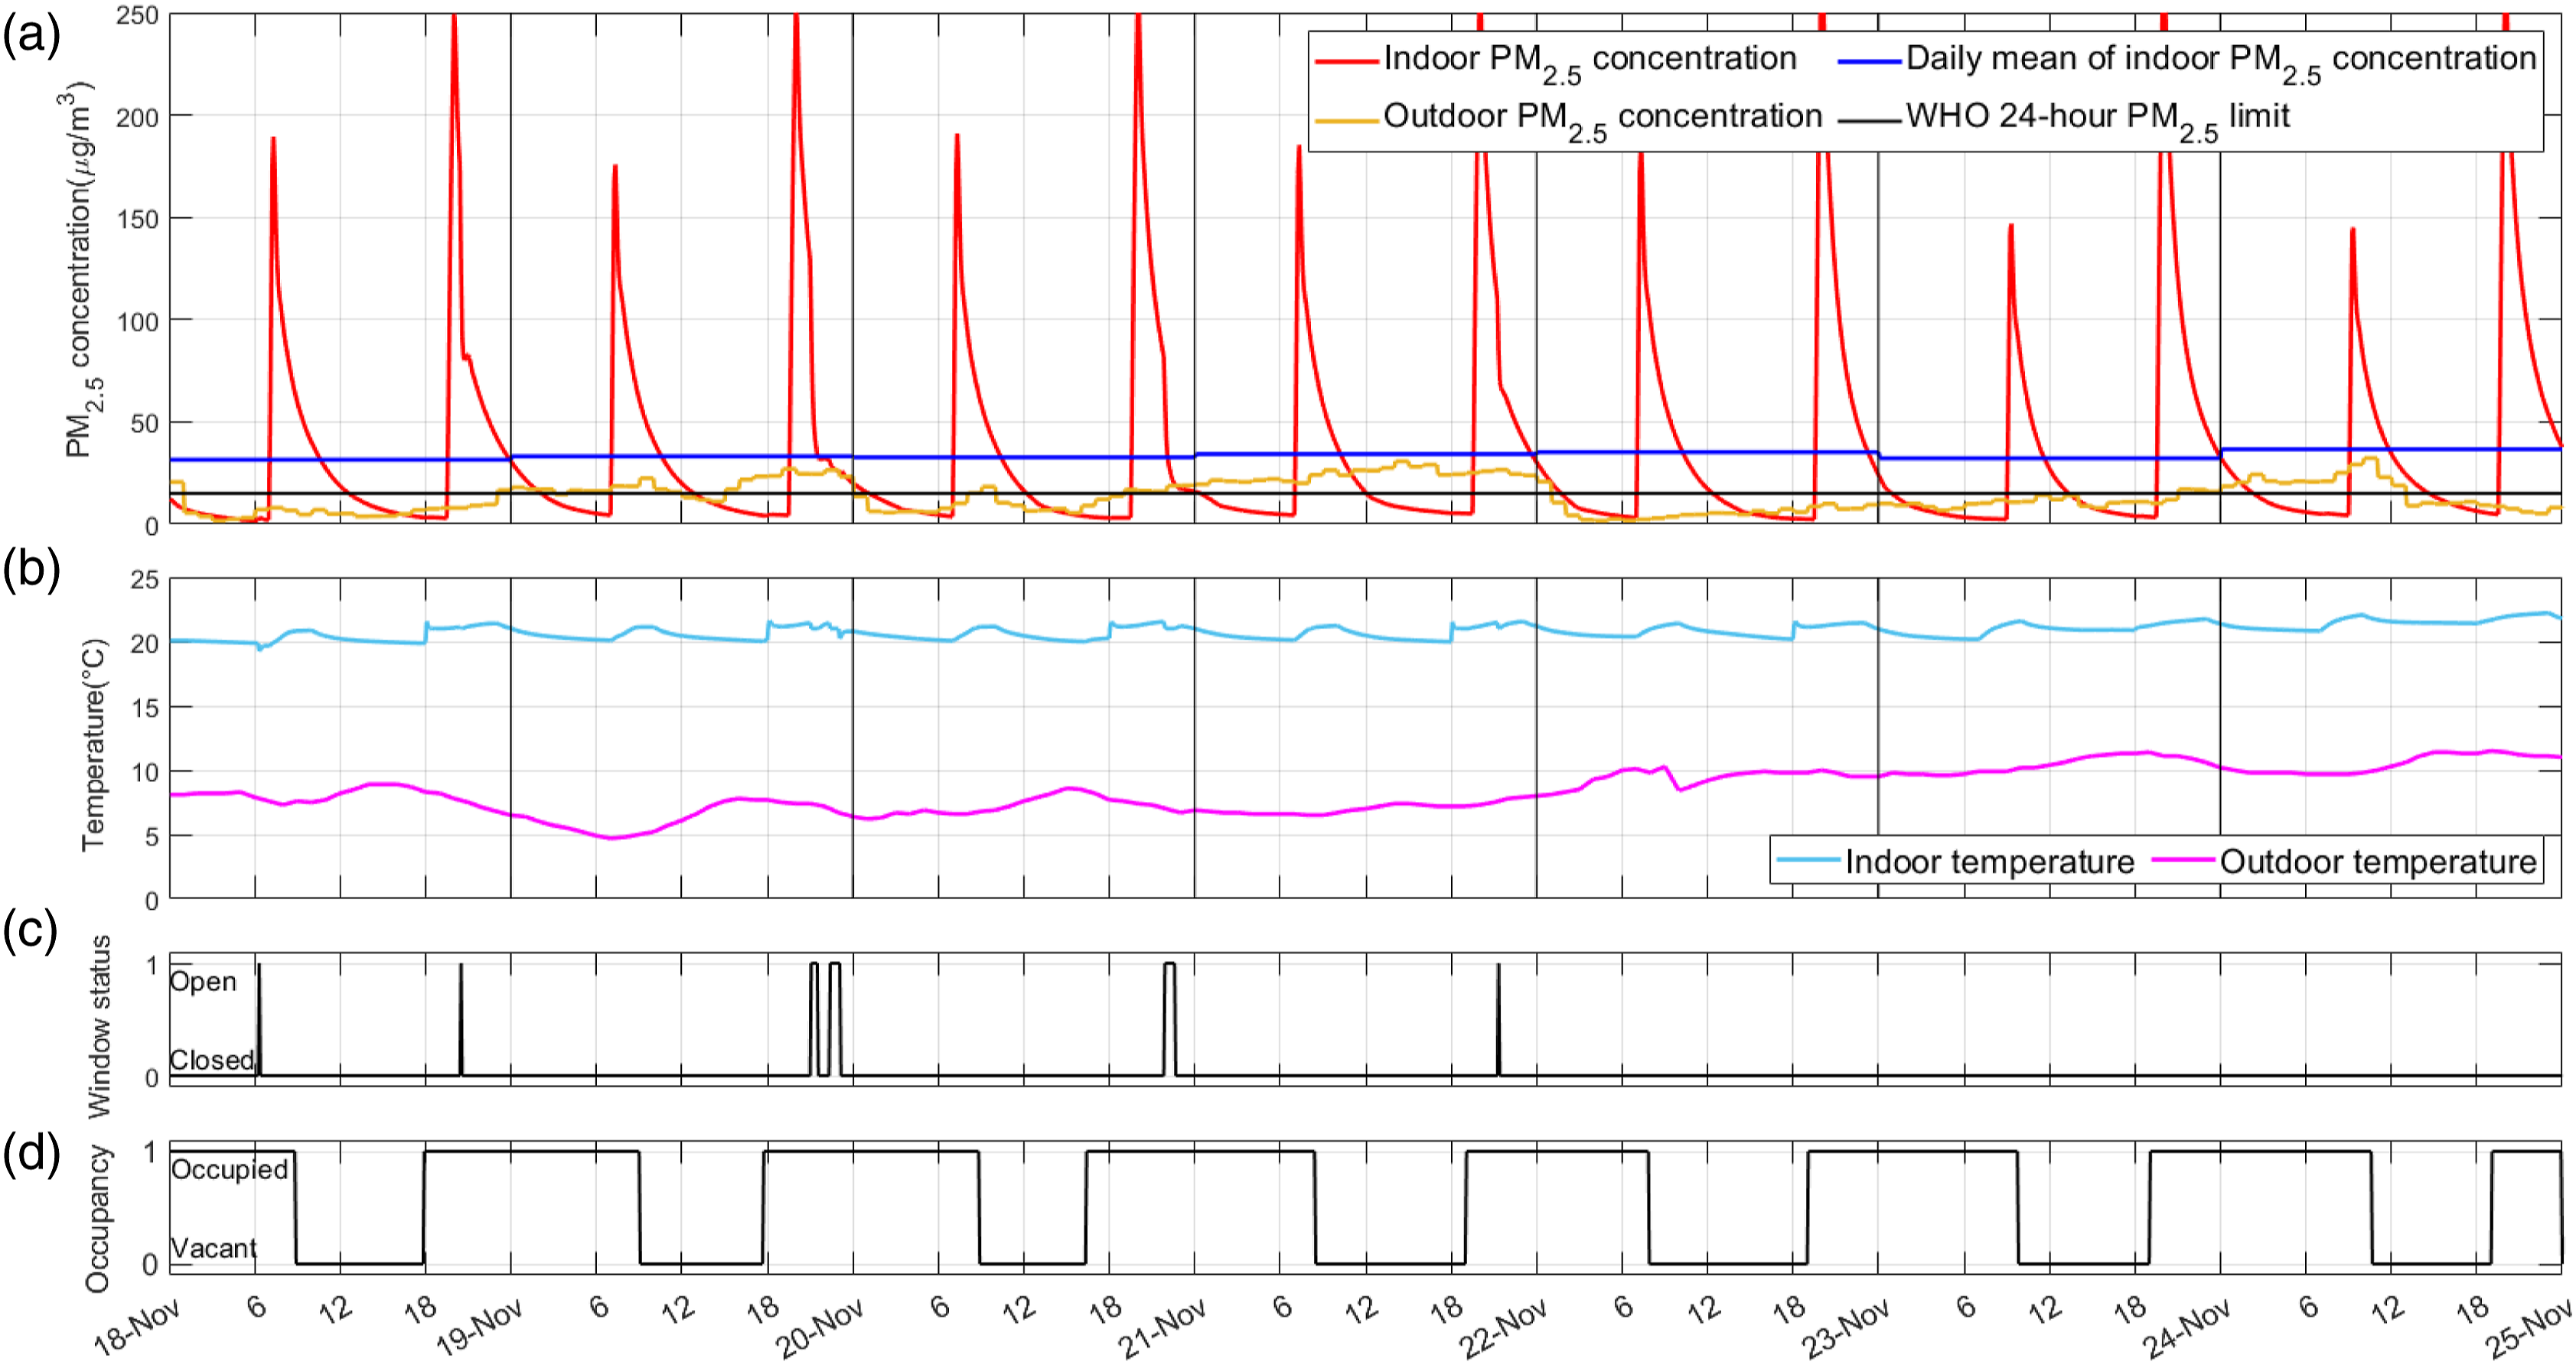
Mechanical ventilation and heat recovery mode
Metrics for evaluation of different control modes in the winter week.
HAP mode
Utilising the HAP led to a large reduction of the indoor PM2.5 concentration. As shown in Figure 11, the daily mean indoor PM2.5 concentration was estimated to be below the WHO threshold on all days. Winter week: HAP mode.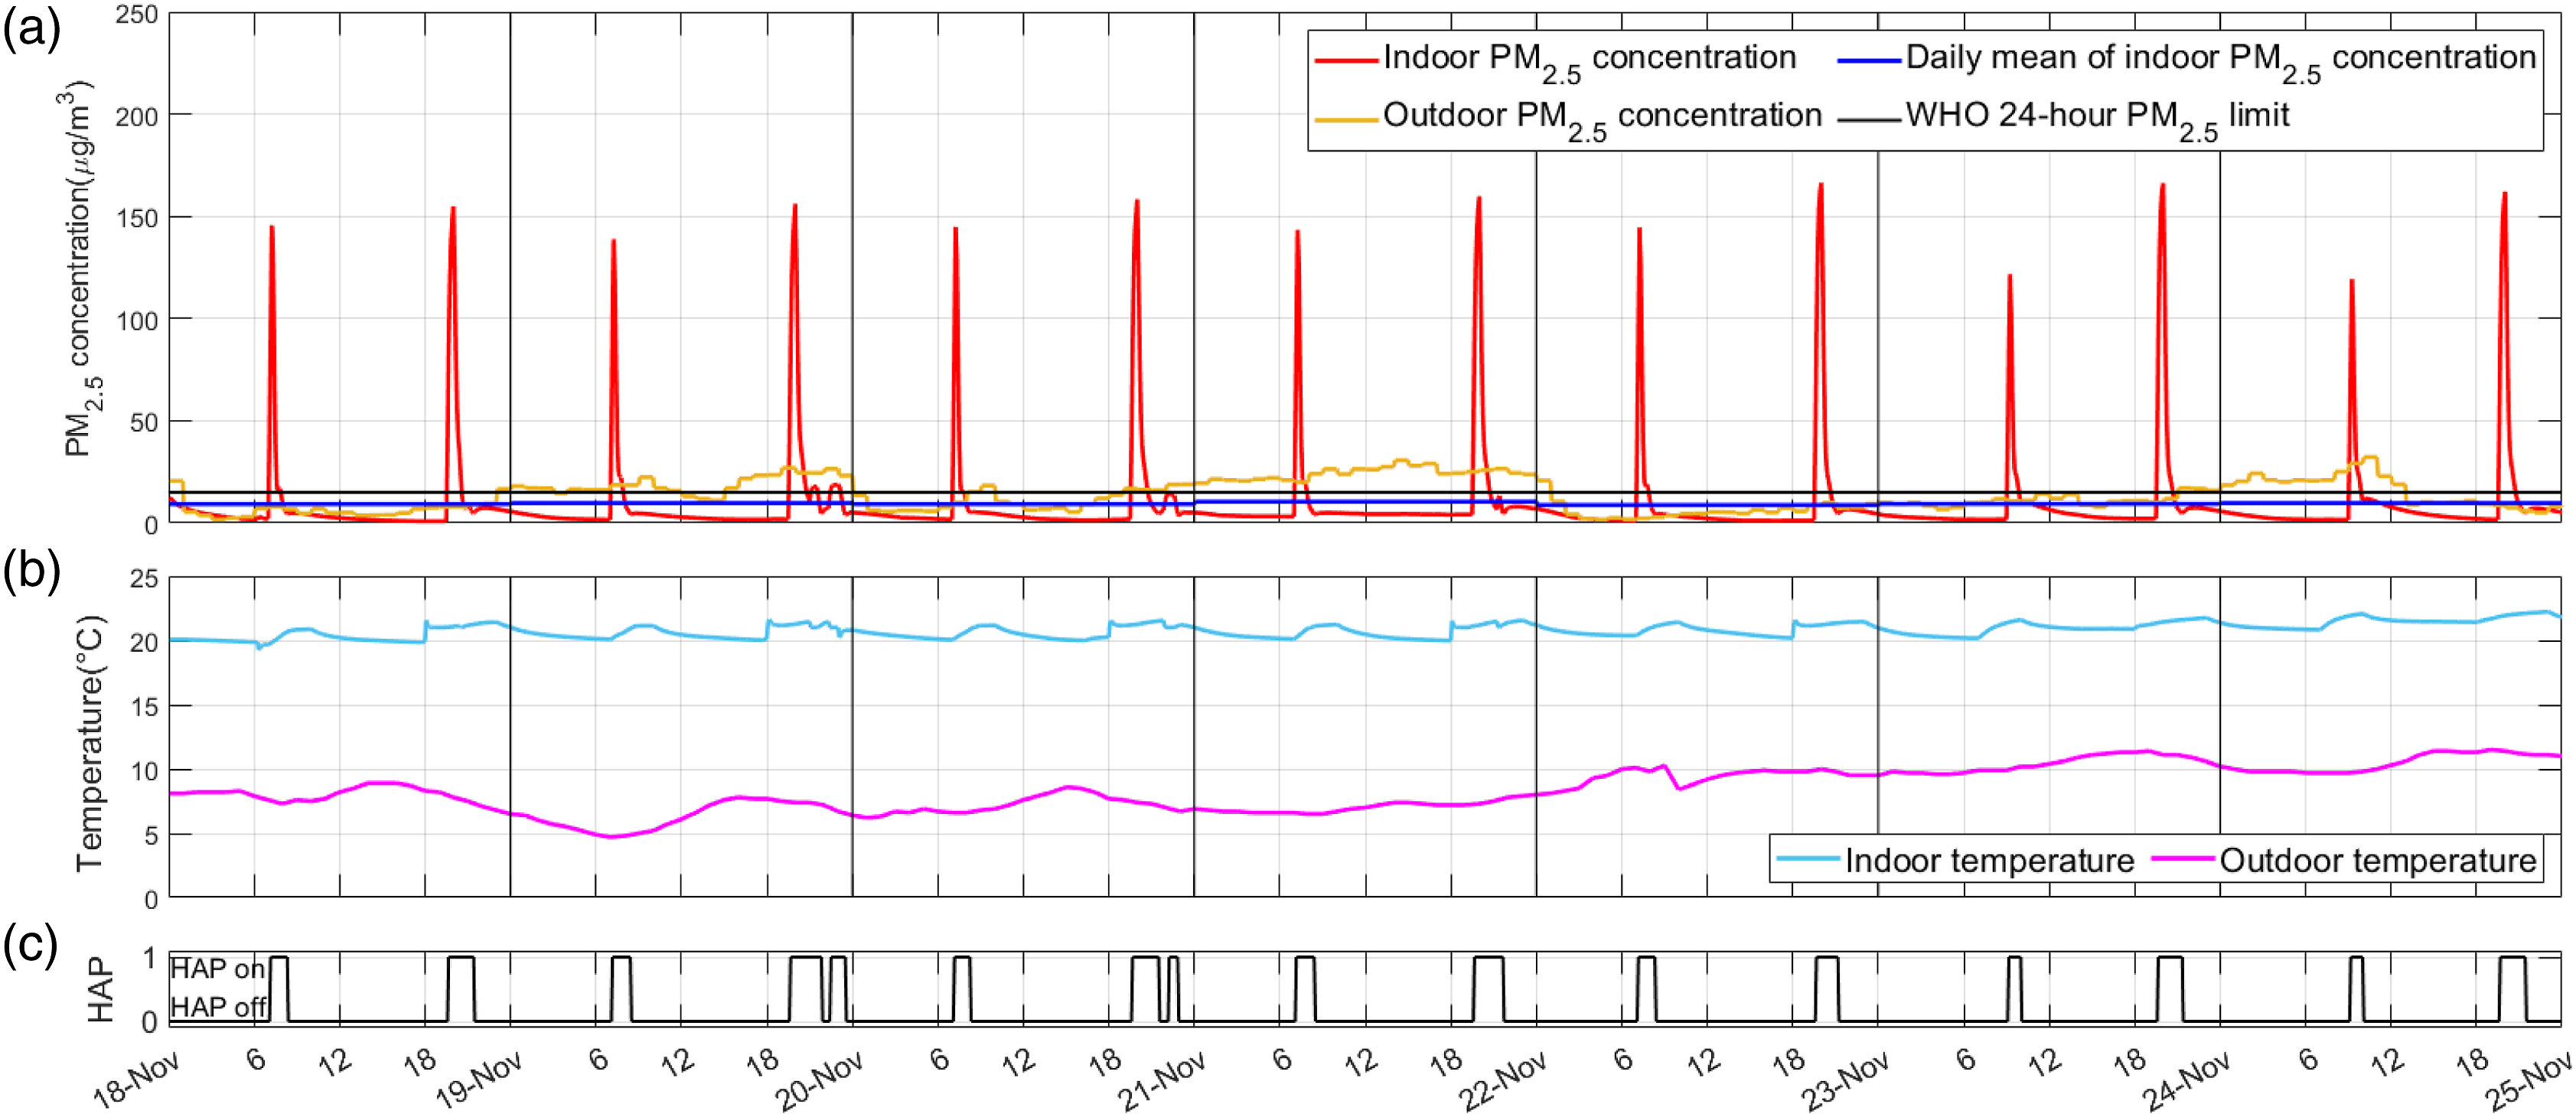
Hybrid mode
Same as in the HAP mode scenario, the purification effect was estimated to be substantial, as reflected in reduced indoor PM2.5 levels and all daily means below the WHO limit, as shown in Table 7.
Using an MVHR system without high-grade filters was not effective in reducing indoor PM2.5 concentration in the simulated winter scenario. The performances of HAP and hybrid modes were similar in terms of mean indoor PM2.5 concentration. That is because the outdoor PM2.5 concentration was often higher than the HAP-on threshold in the studied winter week.
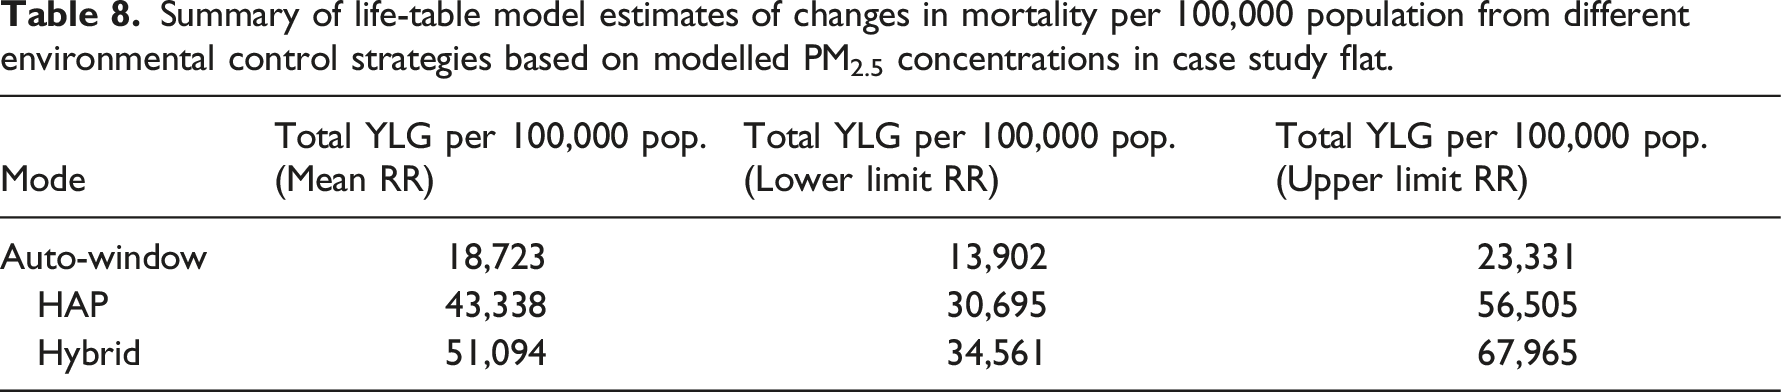
Health assessment
Summary of life-table model estimates of changes in mortality per 100,000 population from different environmental control strategies based on modelled PM2.5 concentrations in case study flat.
Discussion
Strengths
The study presented here proposes a novel framework that controls both HAP operation and window opening to reduce indoor PM2.5 concentration without compromising occupant thermal comfort. It should be noted that the presented work focuses on proposing and testing a building control framework rather than quantification of the accuracy of the simulation results. Considering that the vast majority of prior studies focused on thermal comfort and very few considered indoor PM2.5, this work advances research on smart window control systems. Moreover, this framework aims to assess the potential health impacts associated with the adoption of building controls that reduce indoor PM2.5 levels in homes. As reduced exposures to PM2.5 are expected to contribute to improving occupants’ health, an evaluation of intervention measures from the perspective of health benefits is meaningful but remains a missing part of previous work of the same nature.
Limitations and future work
The current building model only considered cooking as the indoor PM2.5 source alongside a general assumption about the emission rate and cooking schedules. This simplification may not be able to estimate levels and patterns in more complicated situations, e.g. homes with smokers, occupants with more diverse cooking types (associated with a wide range of PM2.5 emission rates) and more flexible or unpredictable cooking times. This work also did not model the range of utilisation rates or efficiencies of cooker extract hoods reported in other studies, 20,39 although it could be a useful exploration in future research. Additionally, the proposed control framework accompanied by health impact assessments was tested in a case study flat as proof of concept, but it is expected to be more meaningful to extend this work to large-scale building stock modelling, as the life-table health modelling is a population-based method. Moreover, this proposed framework that features HAPs currently only considers PM2.5 as the control target, but other types of pollutants such as NO2 should be considered in future work.
The work presented here assumes that appropriate safety and protection measures (such as pinch protection and finger guards) for automatic windows can be accommodated in residential applications. Convenience, safety and security issues, and how they affect acceptance and compliance of automated systems, should be considered in future work. The model demonstrated in this work only considered fully open or closed window states due to the binary nature of the window sensor data, but future work could explore options of incremental openings. It should be acknowledged that the health impact assessment is a population-based average. The availability of data on specific indoor concentrations, health effects of reductions in indoor PM2.5, and differences in the relative risk due to the primary source (indoor or outdoor) of PM exposure are limited. Another limitation is the relative risks used in the evaluation were drawn from the GBD 40 which were derived for ambient and household (i.e. solid-fuel combustion indoors) PM2.5 exposures. However, previous studies have used the GBD data for the estimation of risk, and still other research has highlighted the importance of indoor PM2.5 to total exposure.41–43
Health modelling provides a useful method of evaluating the impact of interventions on population health. However, the reliability of the results is subject to the accuracy of available sources of information, and the ability to add scientific credibility when those sources are uncertain. Building simulations can allow for the provision of a rich and readily customisable dataset to add to the predictive power of health modelling when empiric data are not available. Greater integration of the building simulation to modelled health outcomes could help inform future iterations of the control framework. Additionally, as more information is gained about user behaviour and the feasibility of long-term use of HAPs, more robust estimations of actual risk reductions can be incorporated into the health impact assessments. Lastly, the model presented here does not consider morbidities, such as asthma, which are associated with PM2.5. Future work would include a fuller range of health outcomes beyond mortality.
Conclusion
This study develops a novel control framework that integrates portable home air purifiers and window control systems with the aim to reduce indoor PM2.5 concentrations whilst maintaining thermal comfort. The proposed framework was demonstrated through a series of building simulations for an apartment as the virtual testbed. The results show that the joint control of HAP and window operation based on indoor and outdoor environmental conditions is one control mechanism that has the potential to not only maintain thermal comfort but also achieve effective PM2.5 removal which, consequently, can lead to considerable health benefits at a relatively low extra energy cost. The impact on population health via the implementation of the type of control logic demonstrated in this work is predicted to be substantial. The work presented here is the first known of its kind to integrate the assessment of potential changes to mortality from the implementation of advanced building control systems that measure and predict PM2.5 concentrations indoors.
ORCID iDs
Yan Wang https://orcid.org/0000-0003-4266-1125
Farhang Tahmasebi https://orcid.org/0000-0001-5727-2646
Footnotes
Declaration of conflicting interests
The author(s) declared no potential conflicts of interest with respect to the research, authorship, and/or publication of this article.
Funding
The author(s) disclosed receipt of the following financial support for the research, authorship, and/or publication of this article: This work was supported by the EIT-Digital project, “Quality of Indoor Air on Sites Matched with Outdoor Air Quality Datasets to Improve Wellbeing Outcomes” (activity number 19144); UK EPSRC (Project number 559487).