
Abstract
A comprehensive understanding of occupant comfort in mixed-mode (MM) buildings is crucial for the design of MM buildings which are being proposed as a low-energy solution to combat the global warming without compromising comfort. Current comfort standards are mainly for naturally ventilated (NV) or air-conditioned (AC) buildings, and there is a significant gap in standards for MM buildings. With comfort databases playing a major role in the development of thermal comfort models, the recently published ASHRAE Global Thermal Comfort Database II is utilised, in this research, to investigate the thermal sensation and occupant’s behavioural adaptations in MM buildings in temperate oceanic climates and to develop an adaptive thermal comfort model based on the outdoor environmental conditions. The Fanger's PMV model was found to underpredict the actual thermal sensation of the occupants while the occupant adaptivity was found to be lower than that predicted by the adaptive models of Standard 55 and EN15251/EN 16798-1. Furthermore, based on the results of this study and the various impediments faced, recommendations are proposed for future comfort surveys so that more detailed and conclusive studies can be conducted for wider applications using open-source thermal comfort databases.
Practical application
Good understanding of occupant comfort is necessary to reduce building energy consumption without compromising comfort. This article explores the use of ASHRAE Comfort Database II for determining occupant comfort in MM buildings in temperate oceanic climates and the limitations faced therein. A practical and publicly accessible database developed based on the recommendations from this study will improve thermal comfort models and enable better prediction of occupant comfort while improving energy efficiency substantially.
Introduction
Mixed-mode (MM) ventilation is gaining prominence for maintaining comfort in buildings without having the major energy implications of an air-conditioned (AC) building.1–4 An MM building combines the positive aspects of both NV and AC buildings. 5 The operable windows and the vents allow for free cooling while the mechanical systems ensure the quality of indoor air and prevent the indoor temperature from rising above the comfort levels. 6
The indoor thermal comfort conditions directly influence the energy consumption of the building. Even a slight increase in temperature setpoint significantly reduces the cooling energy demand.7–9 In an MM building, this setpoint adjustment could avoid the operation of the mechanical cooling system and continue to ventilate naturally. Thus, insight into occupant comfort range in MM buildings is necessary for reducing the energy consumption of the building. Additionally, well-defined characterisation of the thermal comfort in MM buildings is necessary to improve both the occupant comfort and meet the exceedance criteria required by the various standards. 6
Despite the need for a clear definition of thermal comfort in MM buildings, few studies have dwelled into this subject until very recently.5,10,11 Moreover, there is little consensus on the evaluation of occupant comfort in MM buildings.10,12,13 While Standard 55 14 implies the use of PMV-PPD model for MM buildings,6,10,12 the European Standard EN 16798-1 15 (the update to the EN15251 16 standard) stipulates the use of adaptive comfort model when the building is operated by natural ventilation and the use of PMV-PPD model when it is mechanically cooled. Nevertheless, a few recent research has found that the adaptive model is more suitable for evaluating thermal comfort in MM buildings.10,13,17–19 However, the results between these studies differ and are not in complete agreement.
With the looming climate crisis, it is now more imperative than ever to understand the comfort criteria for MM buildings, especially in temperate climates where many of the existing NV buildings would require retrofitting to operate as an MM building and new buildings would be of MM type.
This article aims to address this research gap in the evaluation of thermal comfort in MM buildings in temperate oceanic climates. The objectives of this article are: To evaluate the sensitivity of various factors and to identify the most influential factor affecting thermal comfort in an MM building. To develop an adaptive thermal comfort model for MM buildings in temperate oceanic climates. To compare the developed model with existing adaptive comfort models. To identify the inadequacies in the ASHRAE Global Thermal Comfort Database II for thermal comfort studies in MM buildings in temperate oceanic climates. To propose recommendations to improve thermal comfort surveys and comfort databases.
Background
The rising demand for cooling, with warming climate and urbanisation, has served as an incentive to research methods of reducing comfort-related energy demands by exploiting occupant adaptability. The ventilation strategy of a building is found to affect the comfort expectation of its occupants. Studies have found that the occupants in AC buildings have a high level of comfort expectation and show little adaptability than those in NV buildings who are acceptable of a wider range of indoor temperatures.3,20 Tim Law 4 argues that occupants who spend their time in an air-conditioned space lose their thermal adaptability due to acclimatisation to higher comfort levels. Research has demonstrated the adaptability of occupants to the indoor environment.17,21 Long-term exposure to tightly controlled indoors undermines the outdoor adaptability due to increased occupant expectation, thereby, leading to dissatisfaction to temperatures that would otherwise be comfortable.22–25 Nevertheless, several authors have argued that the adaptive comfort model can be applied to mechanically conditioned buildings by intelligently controlling its indoor environment.3,4,17 For this purpose, it is necessary to clearly understand the comfort expectations and adaptability of occupants.
The adaptability of occupants depends on the climate of their location17,21,25,26 and varies between seasons.26,27 Parkinson et al. 17 concluded from their study of the ASHRAE Comfort Database II that occupants in Asian countries prefer higher neutral temperatures than those in Western countries.
Studies have found behavioural adaptation in NV and MM buildings while little adaptation has been observed in the AC buildings.17,18,26 In a study of 26 office buildings in five European countries, Stoops 26 observed the seasonal adaptability of occupants in their clothing adjustments. Manu et al. 18 found that in NV and MM buildings, the occupants adapted by adjusting their clothing and air velocity (by operating fans and windows) to the indoor temperature rather than the outdoor climate. However, no significant behavioural adaptations were seen in the AC buildings. In another study, conducted by Parkinson et al., 17 occupant adaptability was found to be highly influenced by the indoor environment irrespective of the conditioning strategy.
Many studies on MM buildings propose a single comfort model over both the modes of operation.10,13,18,28 However, Rupp et al. 19 argue that their work found no evidence to support the use of a single adaptive model for both modes of operation in an MM building. In their study, a good adaptive relation was found between the indoor comfort temperature and the outdoor climate during the period of NV operation while the adaptability was found to be weak when the building operated in AC mode. The authors developed separate comfort models for the NV and AC modes of operation of an MM building. From their developed comfort model, it could be seen that occupants in NV spaces had about 2°C lower and higher comfort temperatures in hot and cold weather respectively than those in air-conditioned spaces. This shows that the use of natural ventilation in MM building can be extended to achieve lower energy consumption without affecting occupant comfort.
Many studies on MM buildings conclude the inaccuracy of the PMV-PPD model in estimating the occupant’s thermal comfort.10,13,19,29 Similarly, research has demonstrated a deviation in the neutral comfort temperature of occupant’s in MM buildings than that estimated by Standard 55 and EN15251.10,13,18,28 This deviation is generally attributed to the adaptive nature of the occupants that varies with climate and location. Considering the EN15251 standard being the subject of many previous studies on adaptability, this article refers to the EN15251 standard rather than the newer EN 16798-1 for comparison with older studies. However, the adaptive model in EN 16798-1 and EN15251 are the same.
The review of the literature has highlighted the need for the development of a thermal comfort model for MM buildings considering the adaptability of the occupants. Furthermore, due to adaptability being strongly influenced by the local climate, different climatic conditions would require separate models of thermal comfort. The need to evaluate the influence of the various environmental and personal parameters on the thermal comfort in an MM building is also required to address the criticism of the adaptive model being a black-box model. This article aims to address these issues and develop a thermal comfort model for buildings in a temperate oceanic climate.
Methodology
Comfort databases are important for developing standardised thermal comfort models due to their large number of response data with generally good variation of the response parameters. The adaptive models in both Standard 55 and EN15251 were developed based on large comfort databases, namely, ASHRAE RP-884 database and SCAT database, respectively.30,31 This study is based on the analysis of comfort survey records on MM buildings in temperate oceanic climates from the recently published open access comfort database, the ASHRAE Global Thermal Comfort Database II (henceforth referred to as Comfort Database). The following sections discuss the various buildings, their occupants, the climate of their location, and the analysis methodology followed in this study (refer Figure 1). Flowchart representing the various steps followed in the methodology.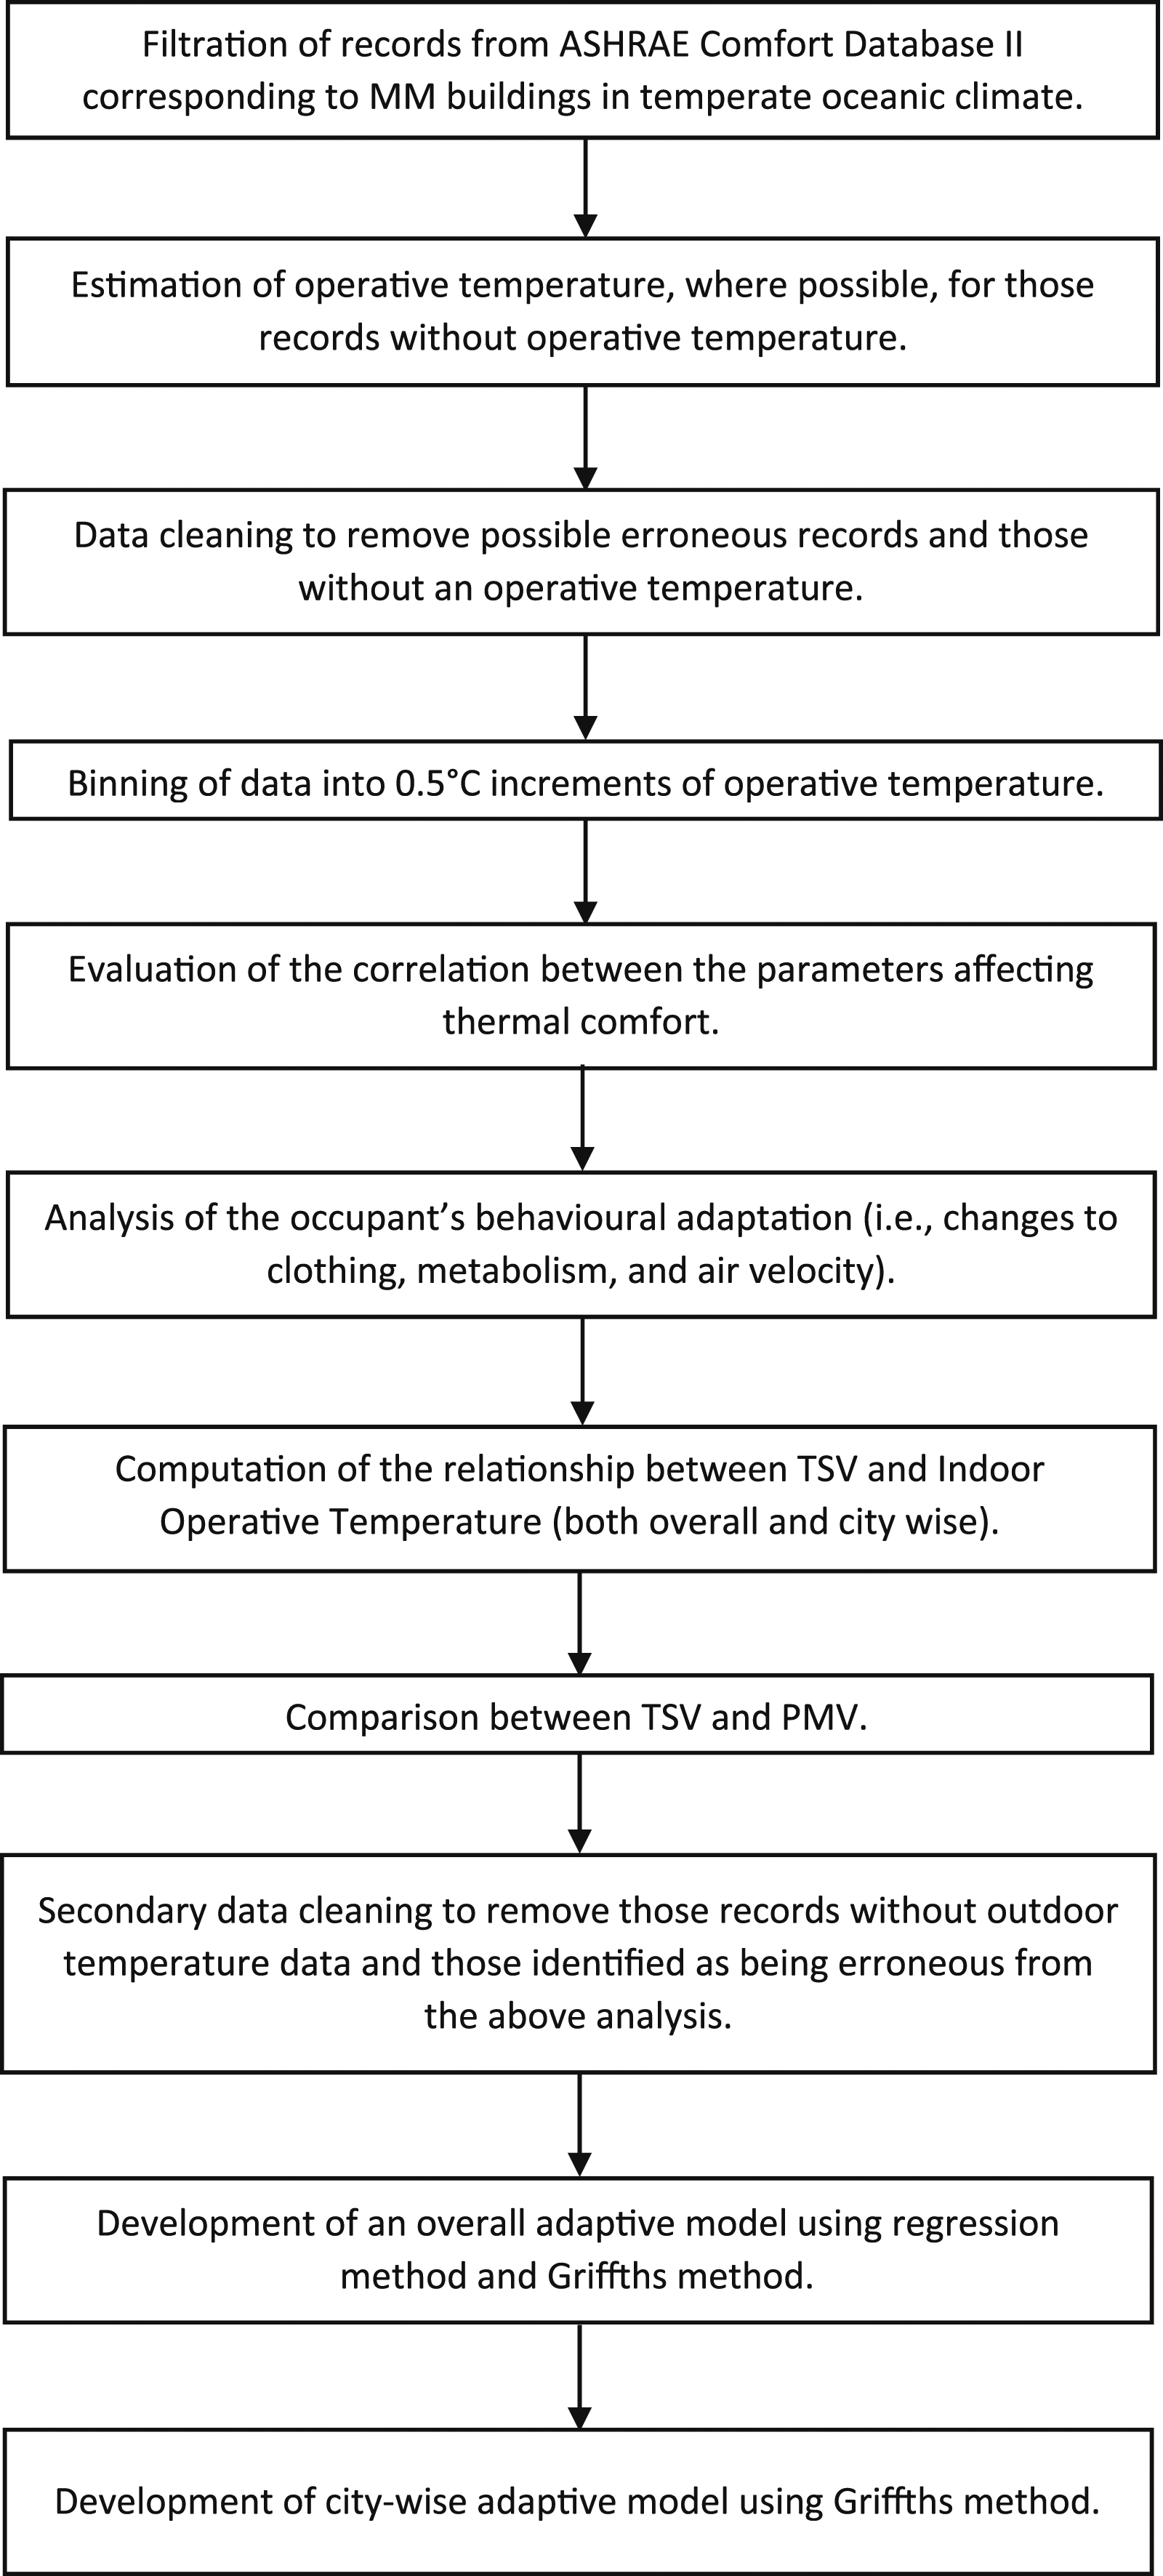
ASHRAE Global Thermal Comfort Database II
The ASHRAE Comfort Database was selected for the analysis in this study as it was expected that having a large repository of data would help to produce statistically significant findings that can be evaluated and compared on various levels such as climate-based analysis, country-based analysis and season-based analysis. The developers of the Comfort Database themselves state this as a reason for its development. 32 The authors quality-checked their collected data that included the building’s geographical location, climate, cooling strategy, occupant’s thermal comfort, space thermal measurements, calculated comfort indices and the state of various environmental controls. However, not all the records had information on all the parameters as the data came from various independent studies.
As this study focusses only on MM buildings in a temperate oceanic climate, the Comfort Database was filtered using the ASHRAE Global Thermal Comfort Database II Query Builder
36
to select only those data records that satisfied these conditions. Out of 81,846 observations, the Comfort Database has a collection of 1157 observations (1.4% of the dataset) for MM buildings in the Temperate Oceanic climatic zone. The data is from five contributors encompassing seven cities with a temperate oceanic climate (Table 1). The filtered database has different types of buildings, including offices, classrooms and a senior centre. The category ‘other’ refers to buildings that cannot be classified as a classroom, multifamily housing, office or senior centre.
32
Data cleaning, as stated below, was performed on the filtered database to prepare it for analysis. 1. Data Cleaning based on Operative Temperature (Top) Summary of the filtered database for MM buildings in temperate oceanic climates.
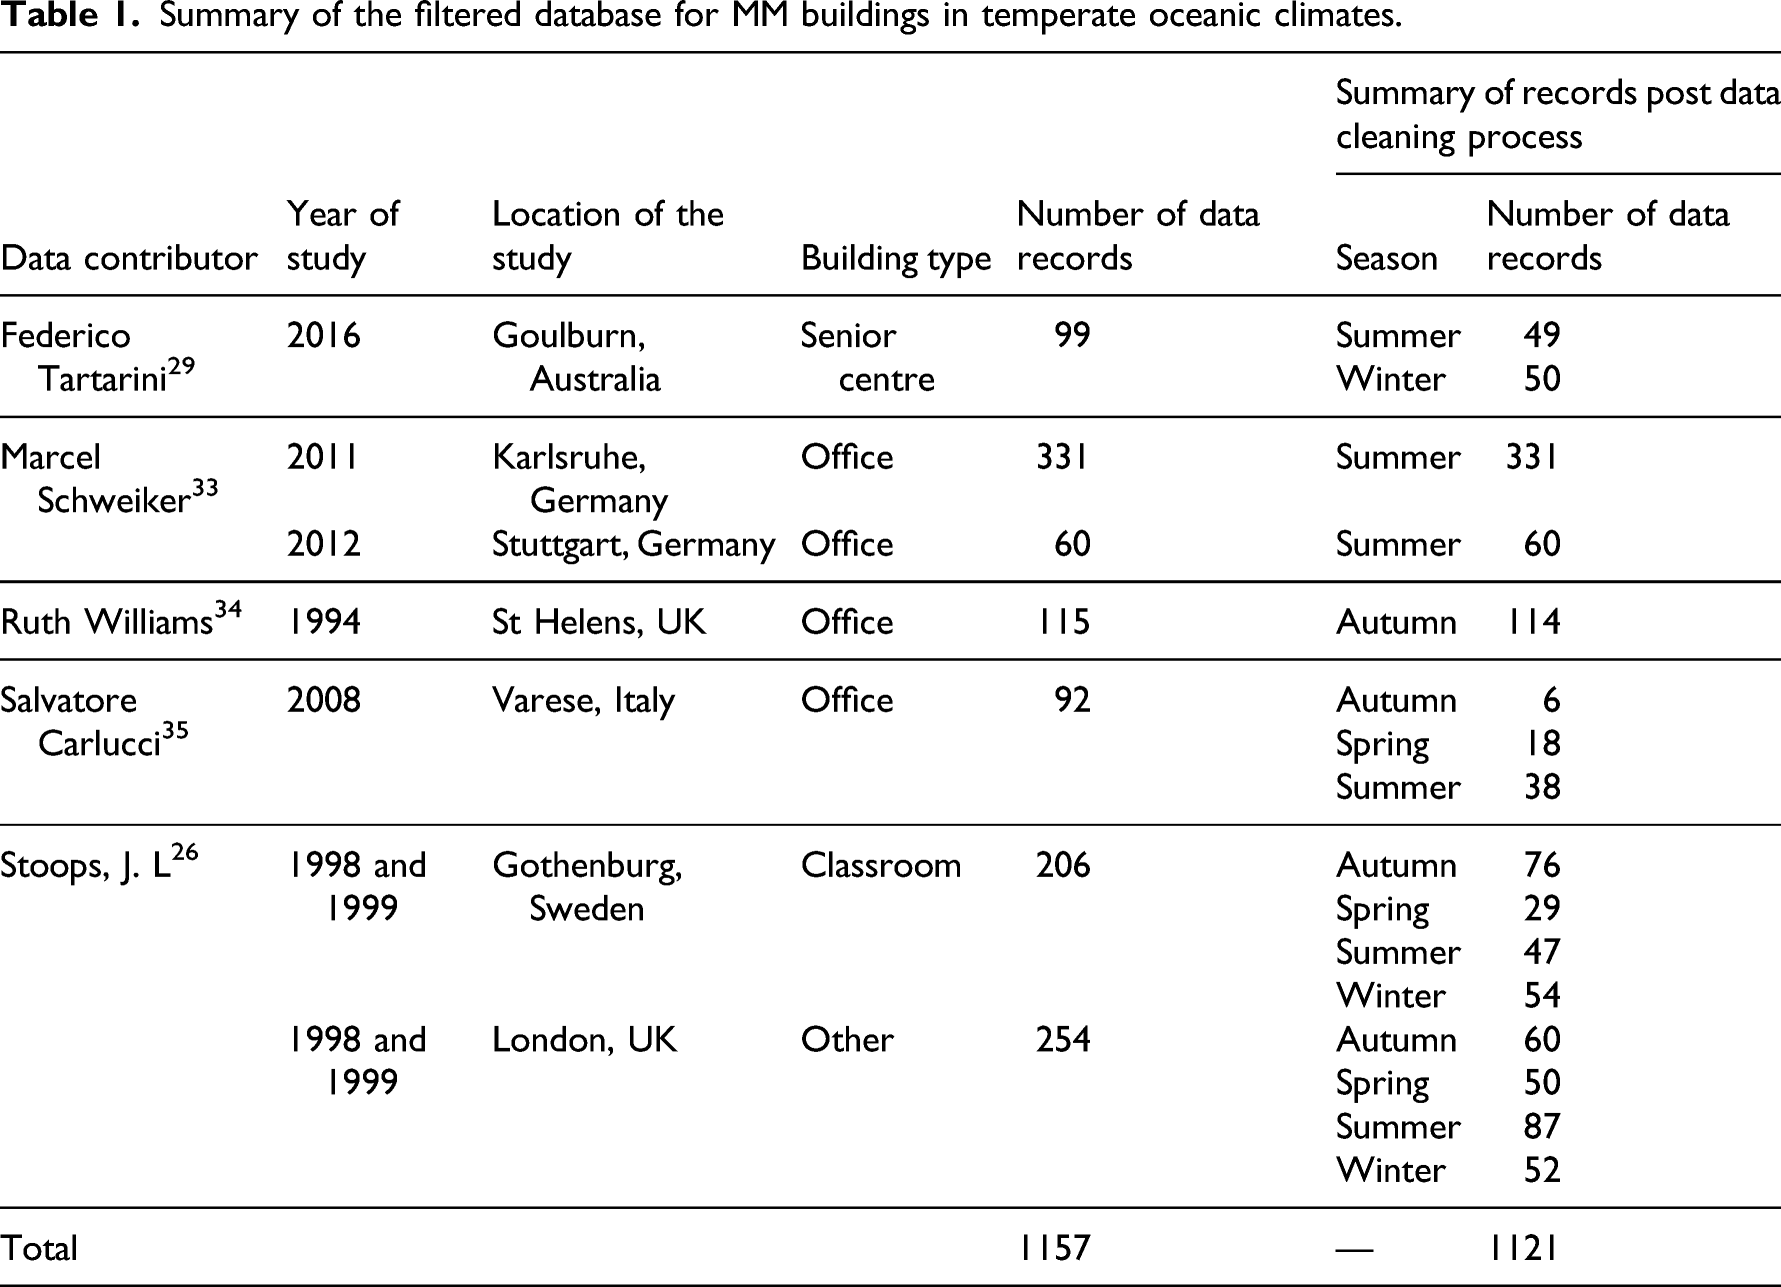
For all the records that did not have an operative temperature, the following steps were followed. A summary of records after performing cleaning is tabulated in Table 1.
If the air temperature and radiant temperature were available, their average was taken as the operative temperature.
Else if the record had a globe temperature, it was utilised as the operative temperature as globe temperature is a good measure of operative temperature at low air velocities. 37
In the absence of globe temperature, the indoor air temperature was utilised as the operative temperature because, at low airspeeds, the air temperature and radiant temperature are nearly equivalent. 38
If none of the three temperatures is available, the record was removed due to lack of sufficient data necessary for analysis.
2. Data Cleaning based on Occupant Thermal Sensation (TSV)
The ASHRAE thermal comfort scale was employed to record the comfort sensation of the occupants. Thus, a record with a TSV of 0.5, which is not possible, was removed.
Segregation of the data based on the mode of operation (NV or AC mode) was not possible as the ASHRAE database had a limited number of records with information on the state of window, fan and heater (refer Table A1). Moreover, no data on the state of air-conditioner was available.
Analytical approach
The software IBM SPSS Statistics 25 39 was employed for performing the various statistical analysis in this study, including aggregation, correlation testing, regression and significance testing. Statistical significance was eliminated to remove their corresponding records. Generally, non-significance is due to small sample size or lack of variability in the dataset. 31
Both the linear regression method and Griffiths method were used for developing the adaptive comfort model. These methods, as established by de Dear and Brager 31 and Nicol and Humphreys, 30 respectively, have been widely employed in various research for developing adaptive comfort models.3,10,13,18,28,40
The records are to be aggregated at the building level to ensure that the parameters such as neutral temperature can be derived from the comfort responses. 41 Grouping the database into individual buildings ensures the homogeneity of each subset of the data while allowing for a sufficient number of records in each subset; any finer resolution would result in insufficient records in the subgroups while a coarser resolution might not yield sufficient data points for fitting the adaptive regression model. However, in this study, as there is no information to differentiate between the records of different buildings in the Comfort Database, the records are aggregated for each city; the only other sensible form of grouping possible in this dataset.
For correlation and regression analysis, the indoor operative temperature was binned into 0.5°C increments and the mean TSV for each bin was computed for each city subset, and this mean TSV (denoted by ‘TSV_avg_bin’) was used for further evaluation instead of the individual subject’s thermal sensation vote. This helps reduce the effect of outliers on the regression analysis. However, the regression method yielded statistically non-significant results.
In the development of the adaptive model, a secondary data cleaning was performed to remove those records without the outdoor temperature data and to remove those records that were identified to be possibly erroneous from the analysis of the relationship between TSV and indoor operative temperature. The neutral temperature required for the development of the adaptive model using the regression method was determined by the undermentioned steps: For each season in each city, determine the relationship between TSV and Top (Indoor operative temperature in °C) using the regression method. The developed equation would be of the form TSV = a • Top + b, where a and b are constants. Using the developed equation, calculate the neutral temperature for each season in each city at TSV = 0, that is, 0 = a • TNeutral + b.
To overcome the issue with the regression method requiring a large database with a good variance to develop a statistically significant result,3,18 the Griffiths method was used. This method has been used by numerous studies, most notably by Nicol and Humphreys
30
in the derivation of the adaptive model for Standard EN15251. In the development of an adaptive model using the Griffiths method, the individual TSV was used to estimate the occupant comfort temperature. The Griffiths comfort temperature for each occupant was determined using the relationship
Though multiple studies have found that a Griffiths constant of 0.5 generates a better correlation between comfort temperature and outdoor temperature than a constant derived specifically for that study,3,13,30 many have criticised the use of a constant value of 0.5/K28,42. Nevertheless, Ryu et al. 42 suggest that the study-specific Griffiths constant be contrasted with the unified value of 0.5/K before selection.
While it was attempted to use both 0.5/K and the study-specific Griffiths constant, the study-specific Griffiths constant could not be significantly determined due to statistical non-significance of the result. This is similar to the study by Toe and Kubota 40 where the Griffiths constant could not be determined due to statistical non-significance. Hence, the Griffiths constant of 0.5/K was employed in this study. For the simplicity of the article, the derivation of the study-specific Griffiths constant is not presented in this article.
Results and analysis
Correlation between the parameters
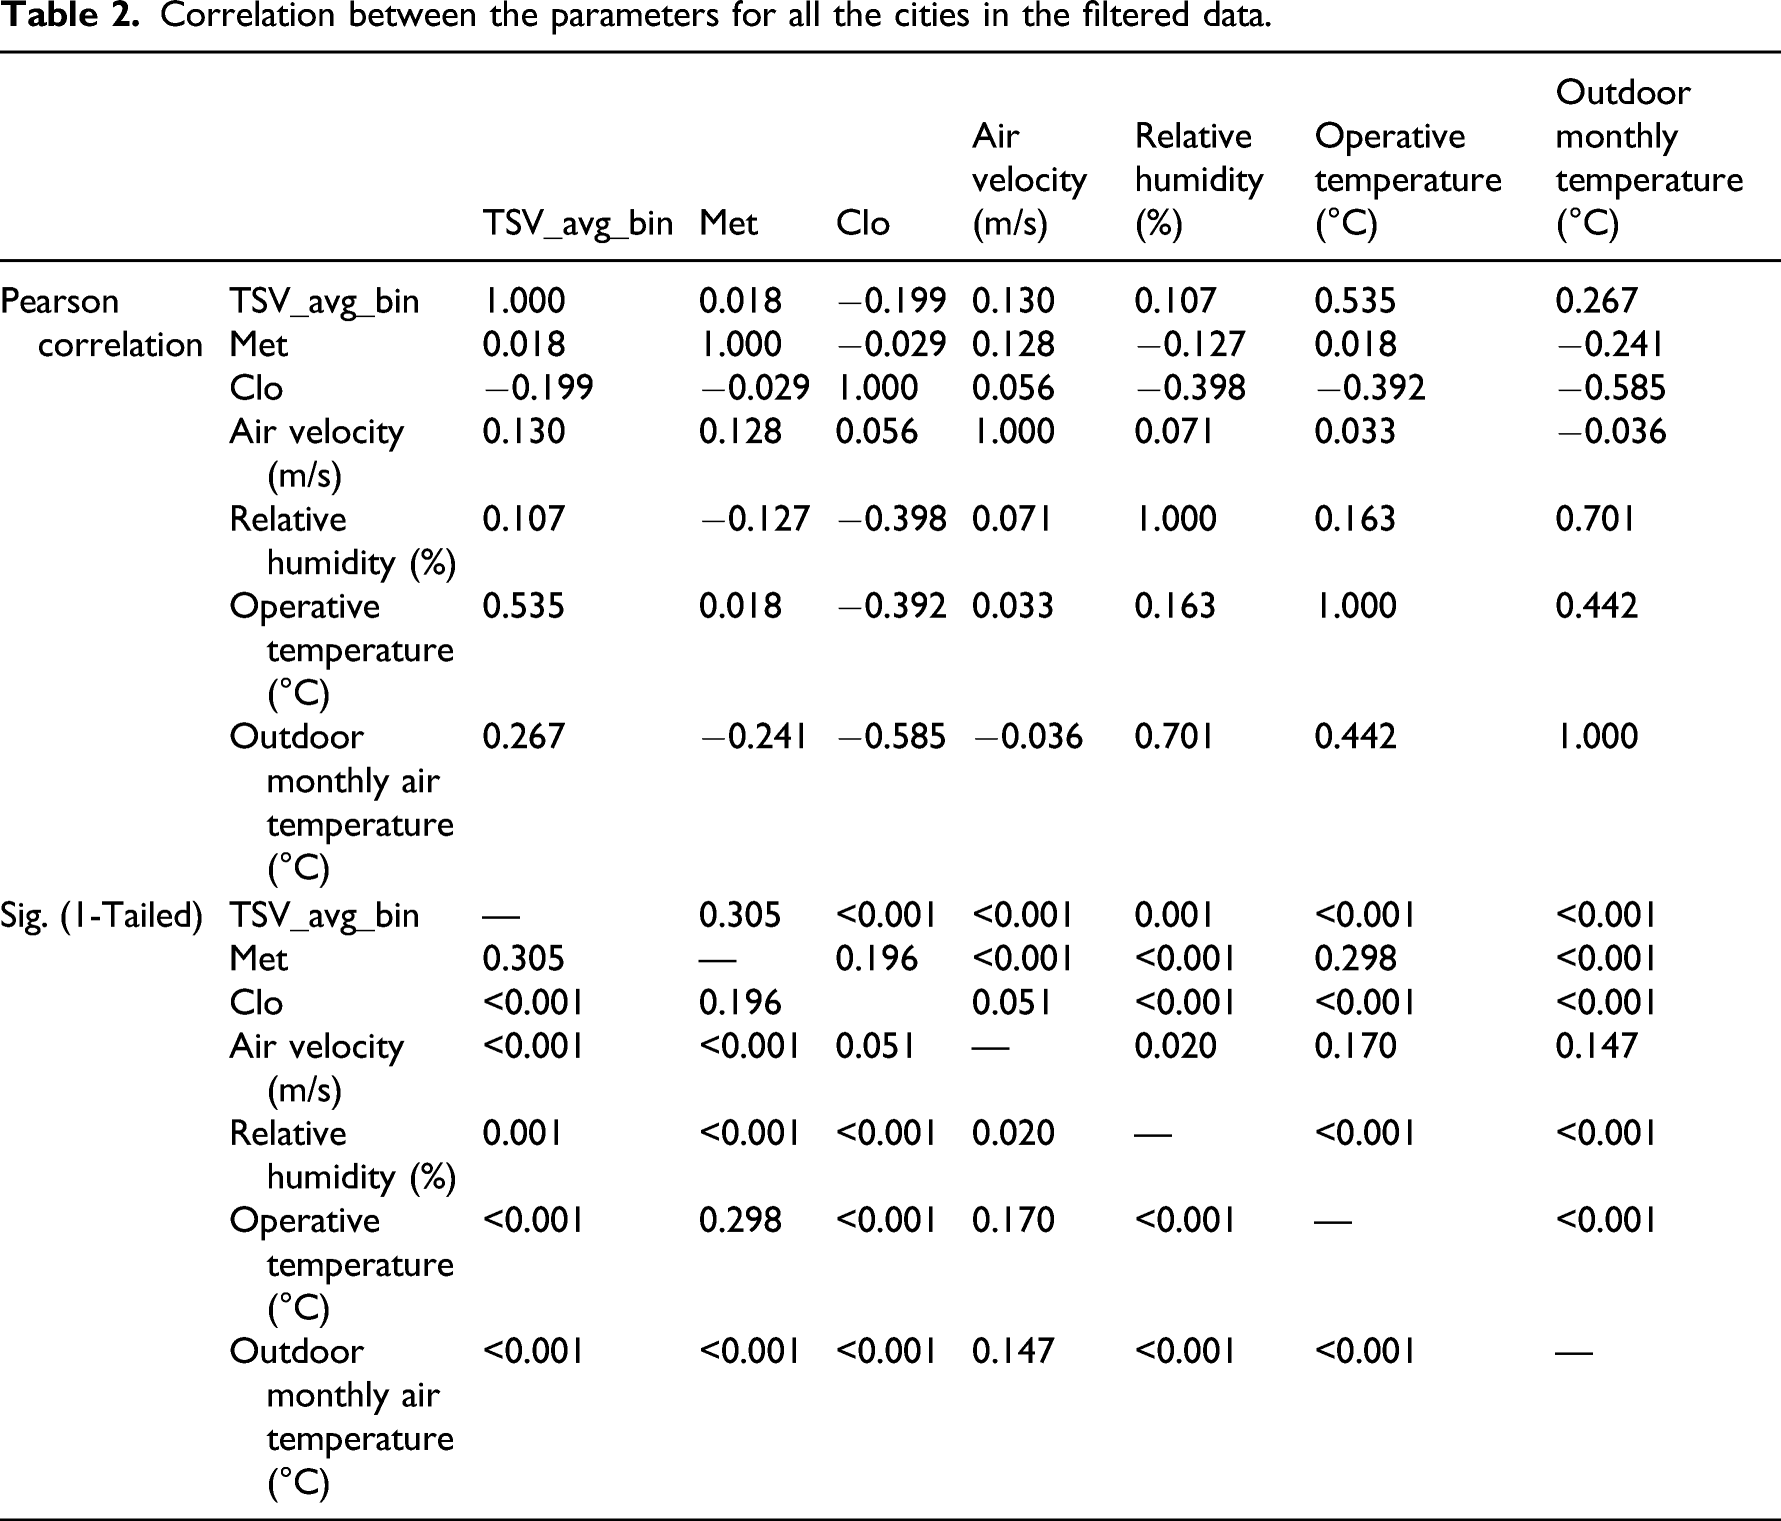
Correlation between the parameters for all the cities in the filtered data.
Summary of the multiple regression model for all the cities in the filtered data.
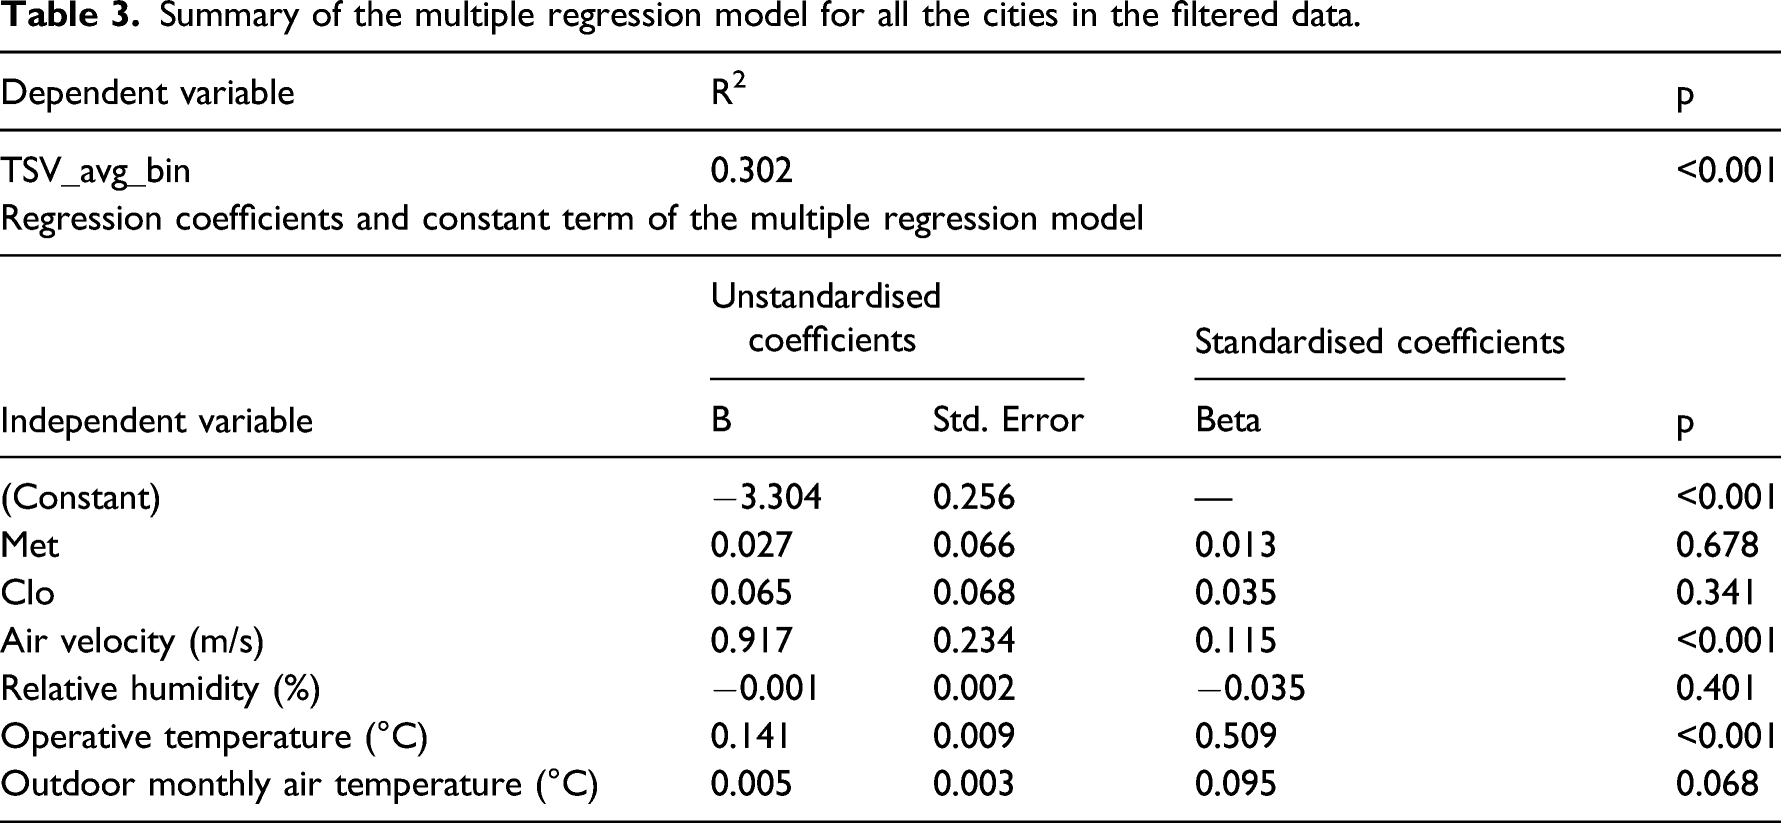
Thus, it can be concluded that indoor operative temperature is the most significant factor affecting the occupant’s thermal sensation. Influence of air velocity on TSV variation can be ignored due to its statistically weak correlation with TSV (correlation <0.3).
Behavioural adaptations
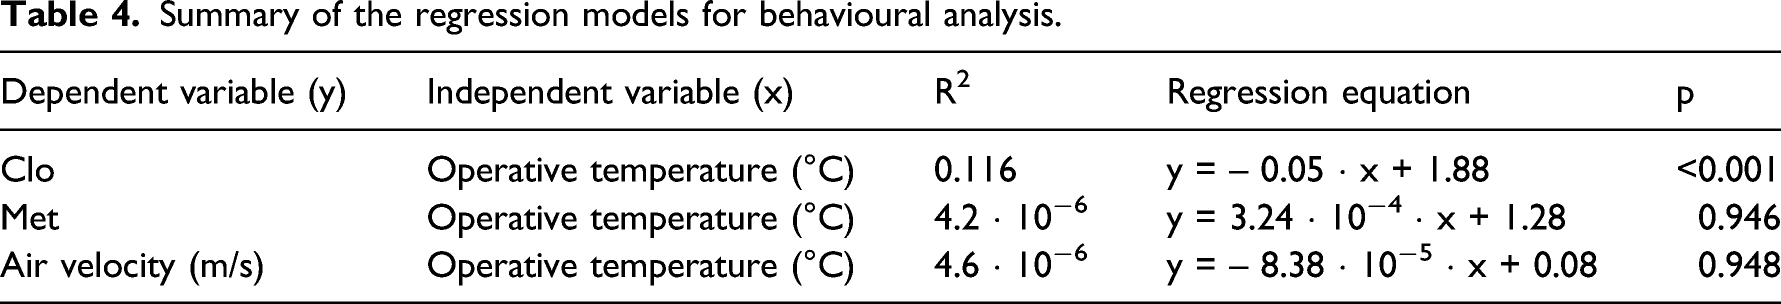
Summary of the regression models for behavioural analysis.
Relationship between TSV and indoor operative temperature
For all the cities combined, a linear regression between TSV and Top was developed (Figure 2). The resulting equation, TSV = 0.155 · Top – 3.339, has a low goodness-of-fit (R2 = 0.184). Hence, separate regression models were developed for each city to evaluate the reason for the low goodness-of-fit and to understand the relationship between TSV and Top for each city. The results of the city-wise regression are tabulated in Table 5 with its graphical representation in Figure A1. Relationship between TSV and Top (all cities combined). Summary of the linear regression model for each city. Independent variable (x): Operative temperature (°C) Dependent variable (y): TSV_avg_bin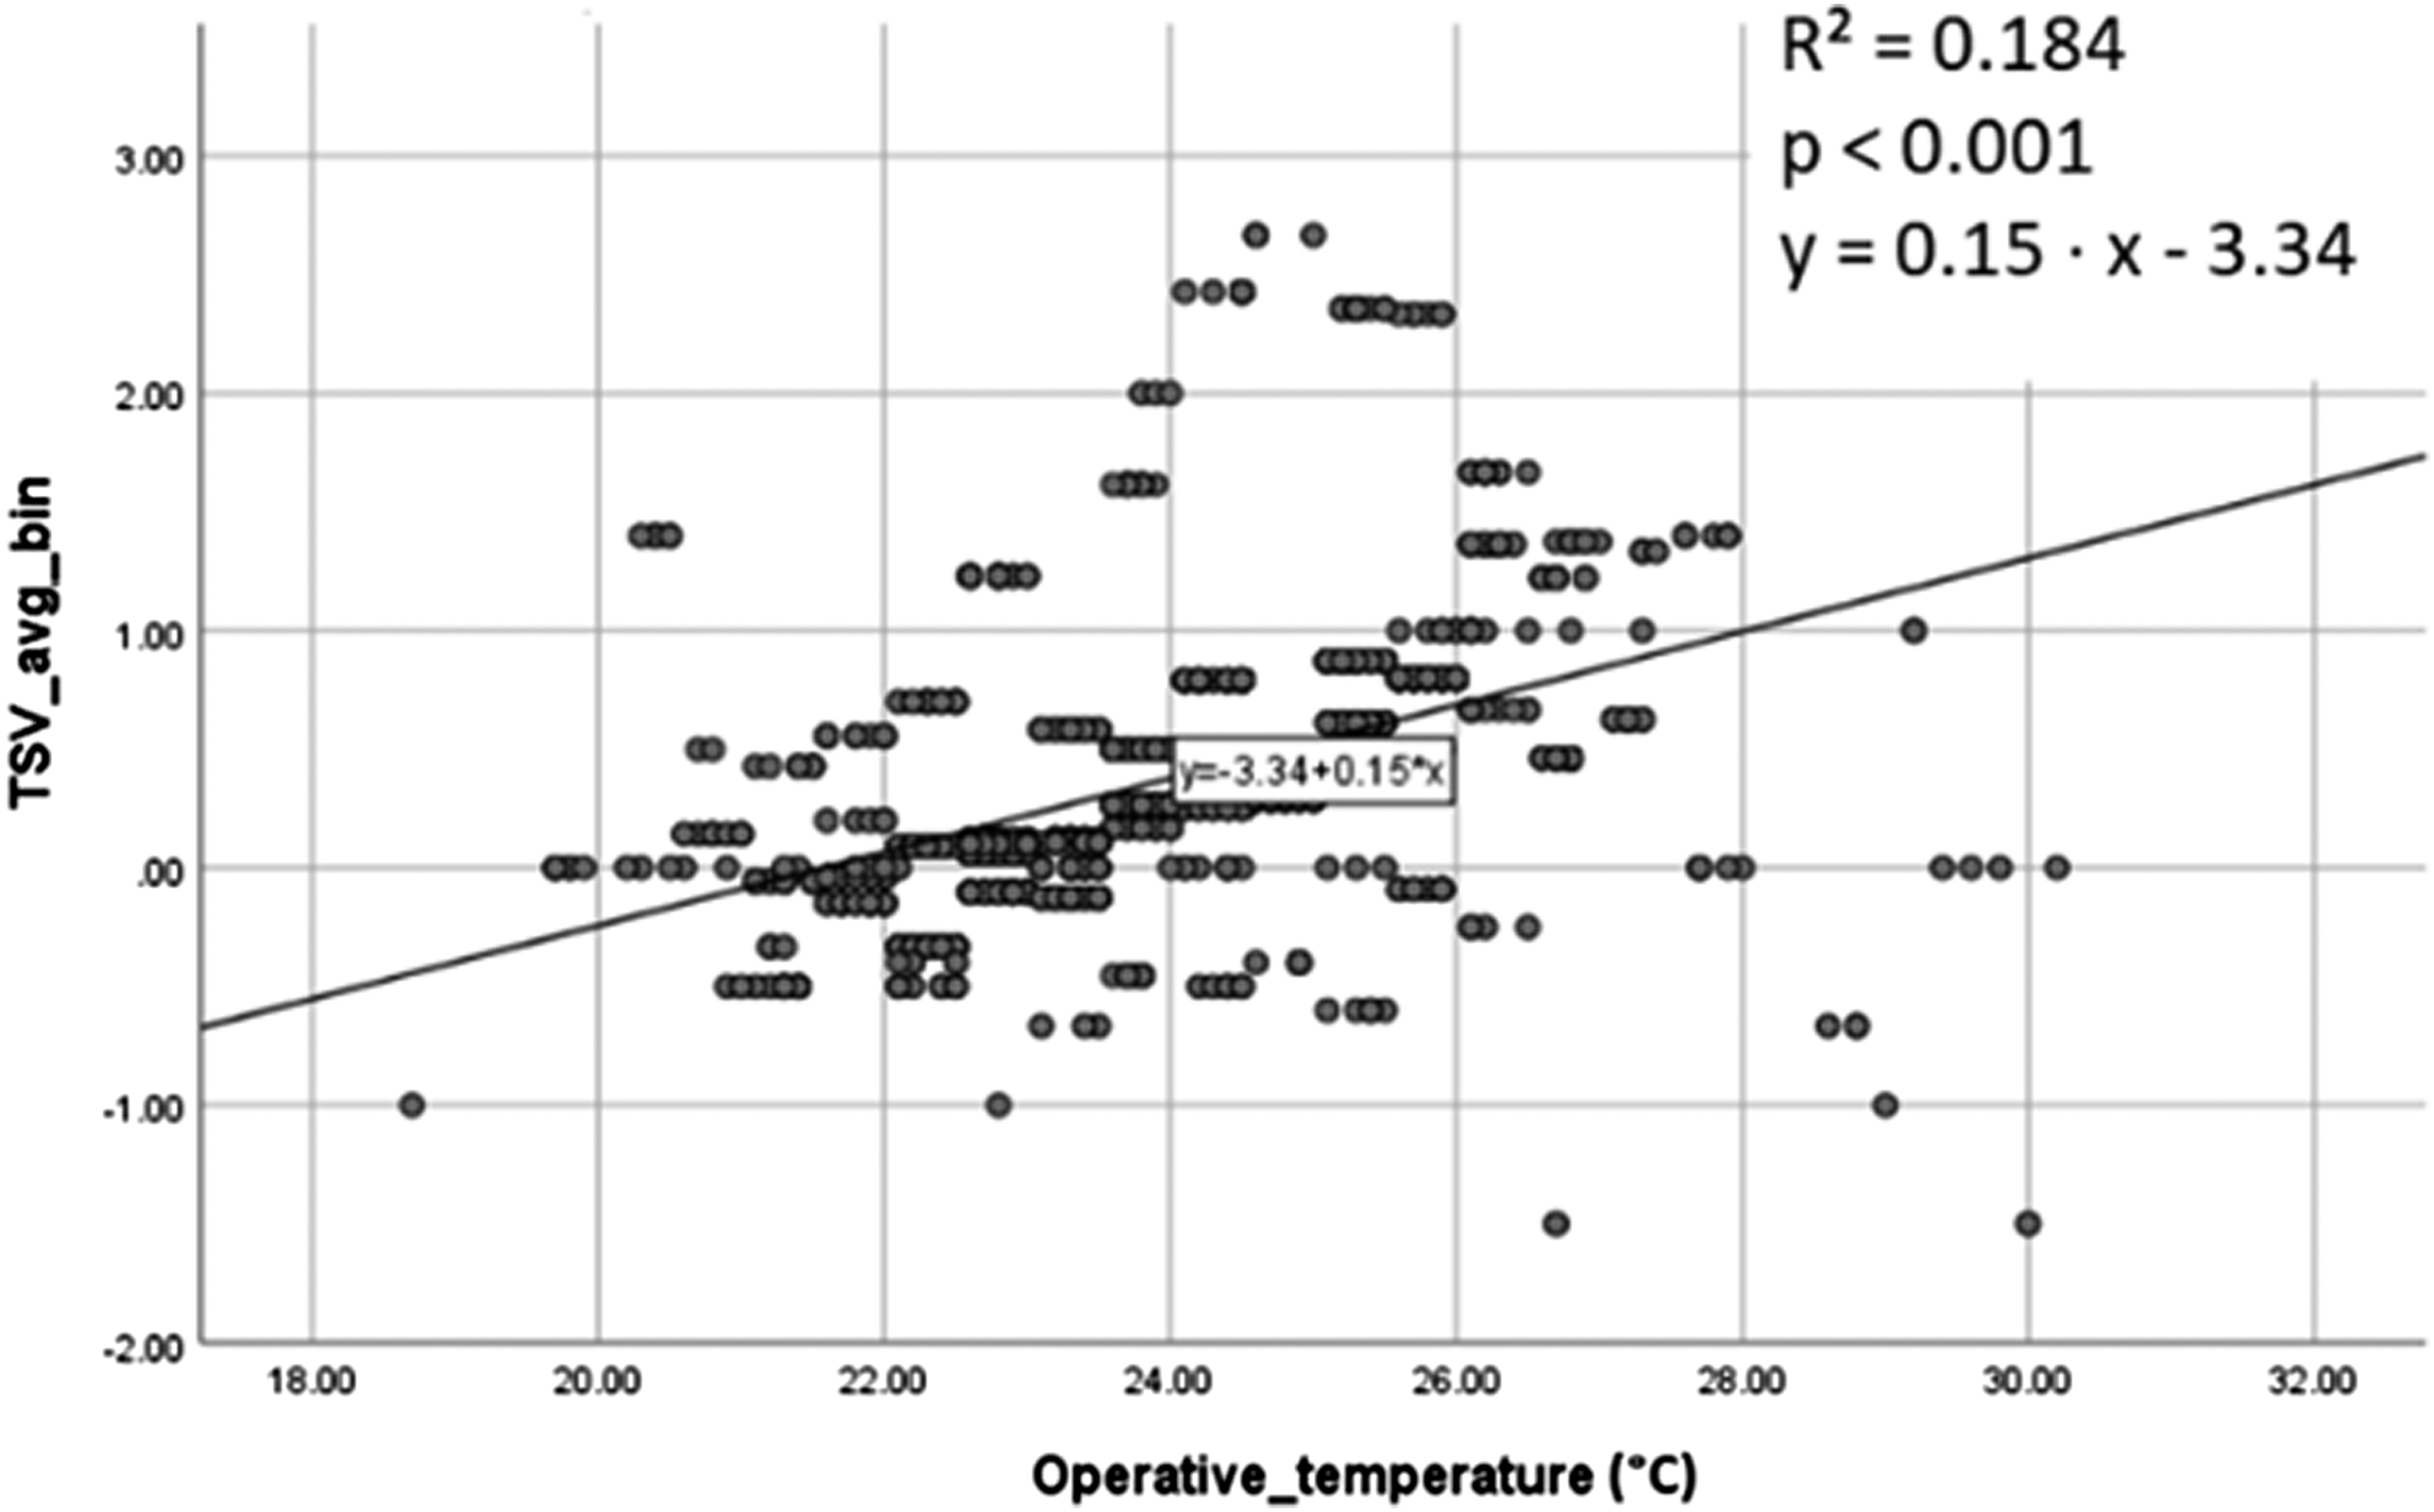
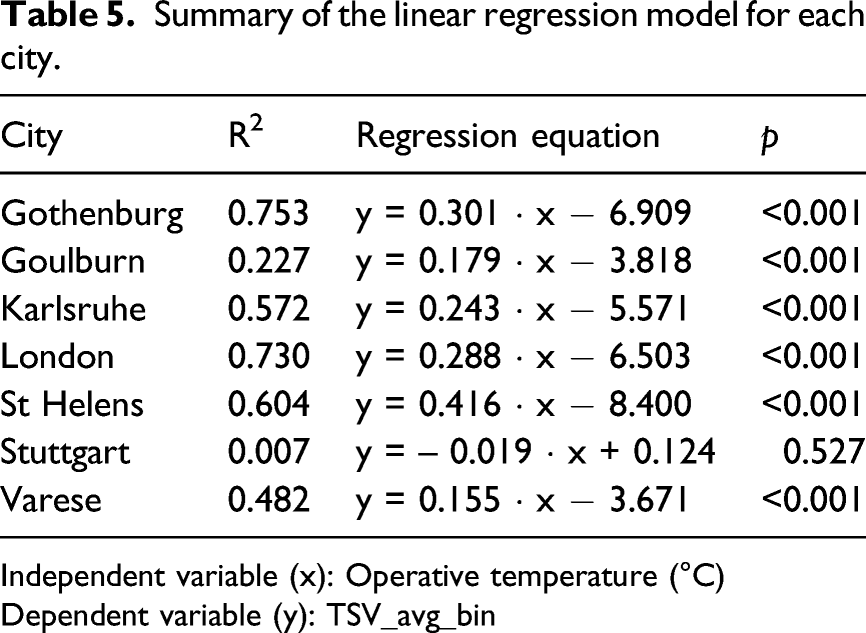
The results show an inverse relation between TSV and Top for the city of Stuttgart. This result is unacceptable based on the results from previous studies on thermal sensation.10,13,18 Furthermore, an occupant will not feel cooler with an increase in the surrounding temperature. The reason for this discrepancy could be attributed to some errors in the data collection for the city of Stuttgart. Thus, the low goodness-of-fit for the overall regression in Figure 2 can be attributed to the Stuttgart data. Hence, all records corresponding to the city of Stuttgart were removed from further analysis.
Summary of the linear regression model (Stuttgart not considered).
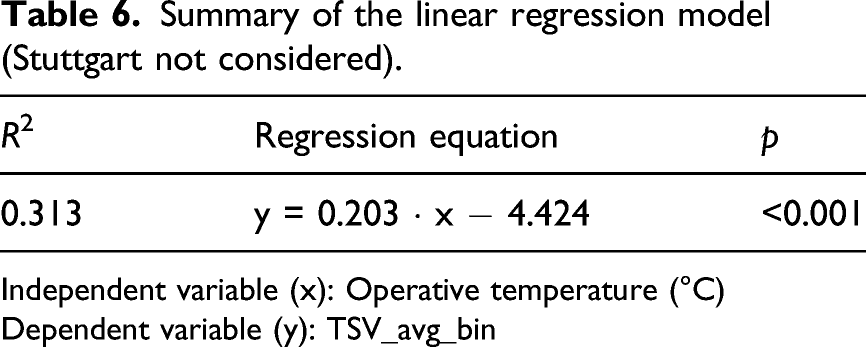
Independent variable (x): Operative temperature (°C)
Dependent variable (y): TSV_avg_bin
Comparison between TSV and (PMV)
The linear regression for TSV and PMV against Top is compared in Figure 3. It shows that the PMV generally underpredicts the thermal sensation of the occupants. While the PMV is closer to TSV at temperatures around 19°C, the deviation increases to over 0.5 units (on the ASHRAE thermal scale) at higher operative temperatures. Comparison between TSV and PMV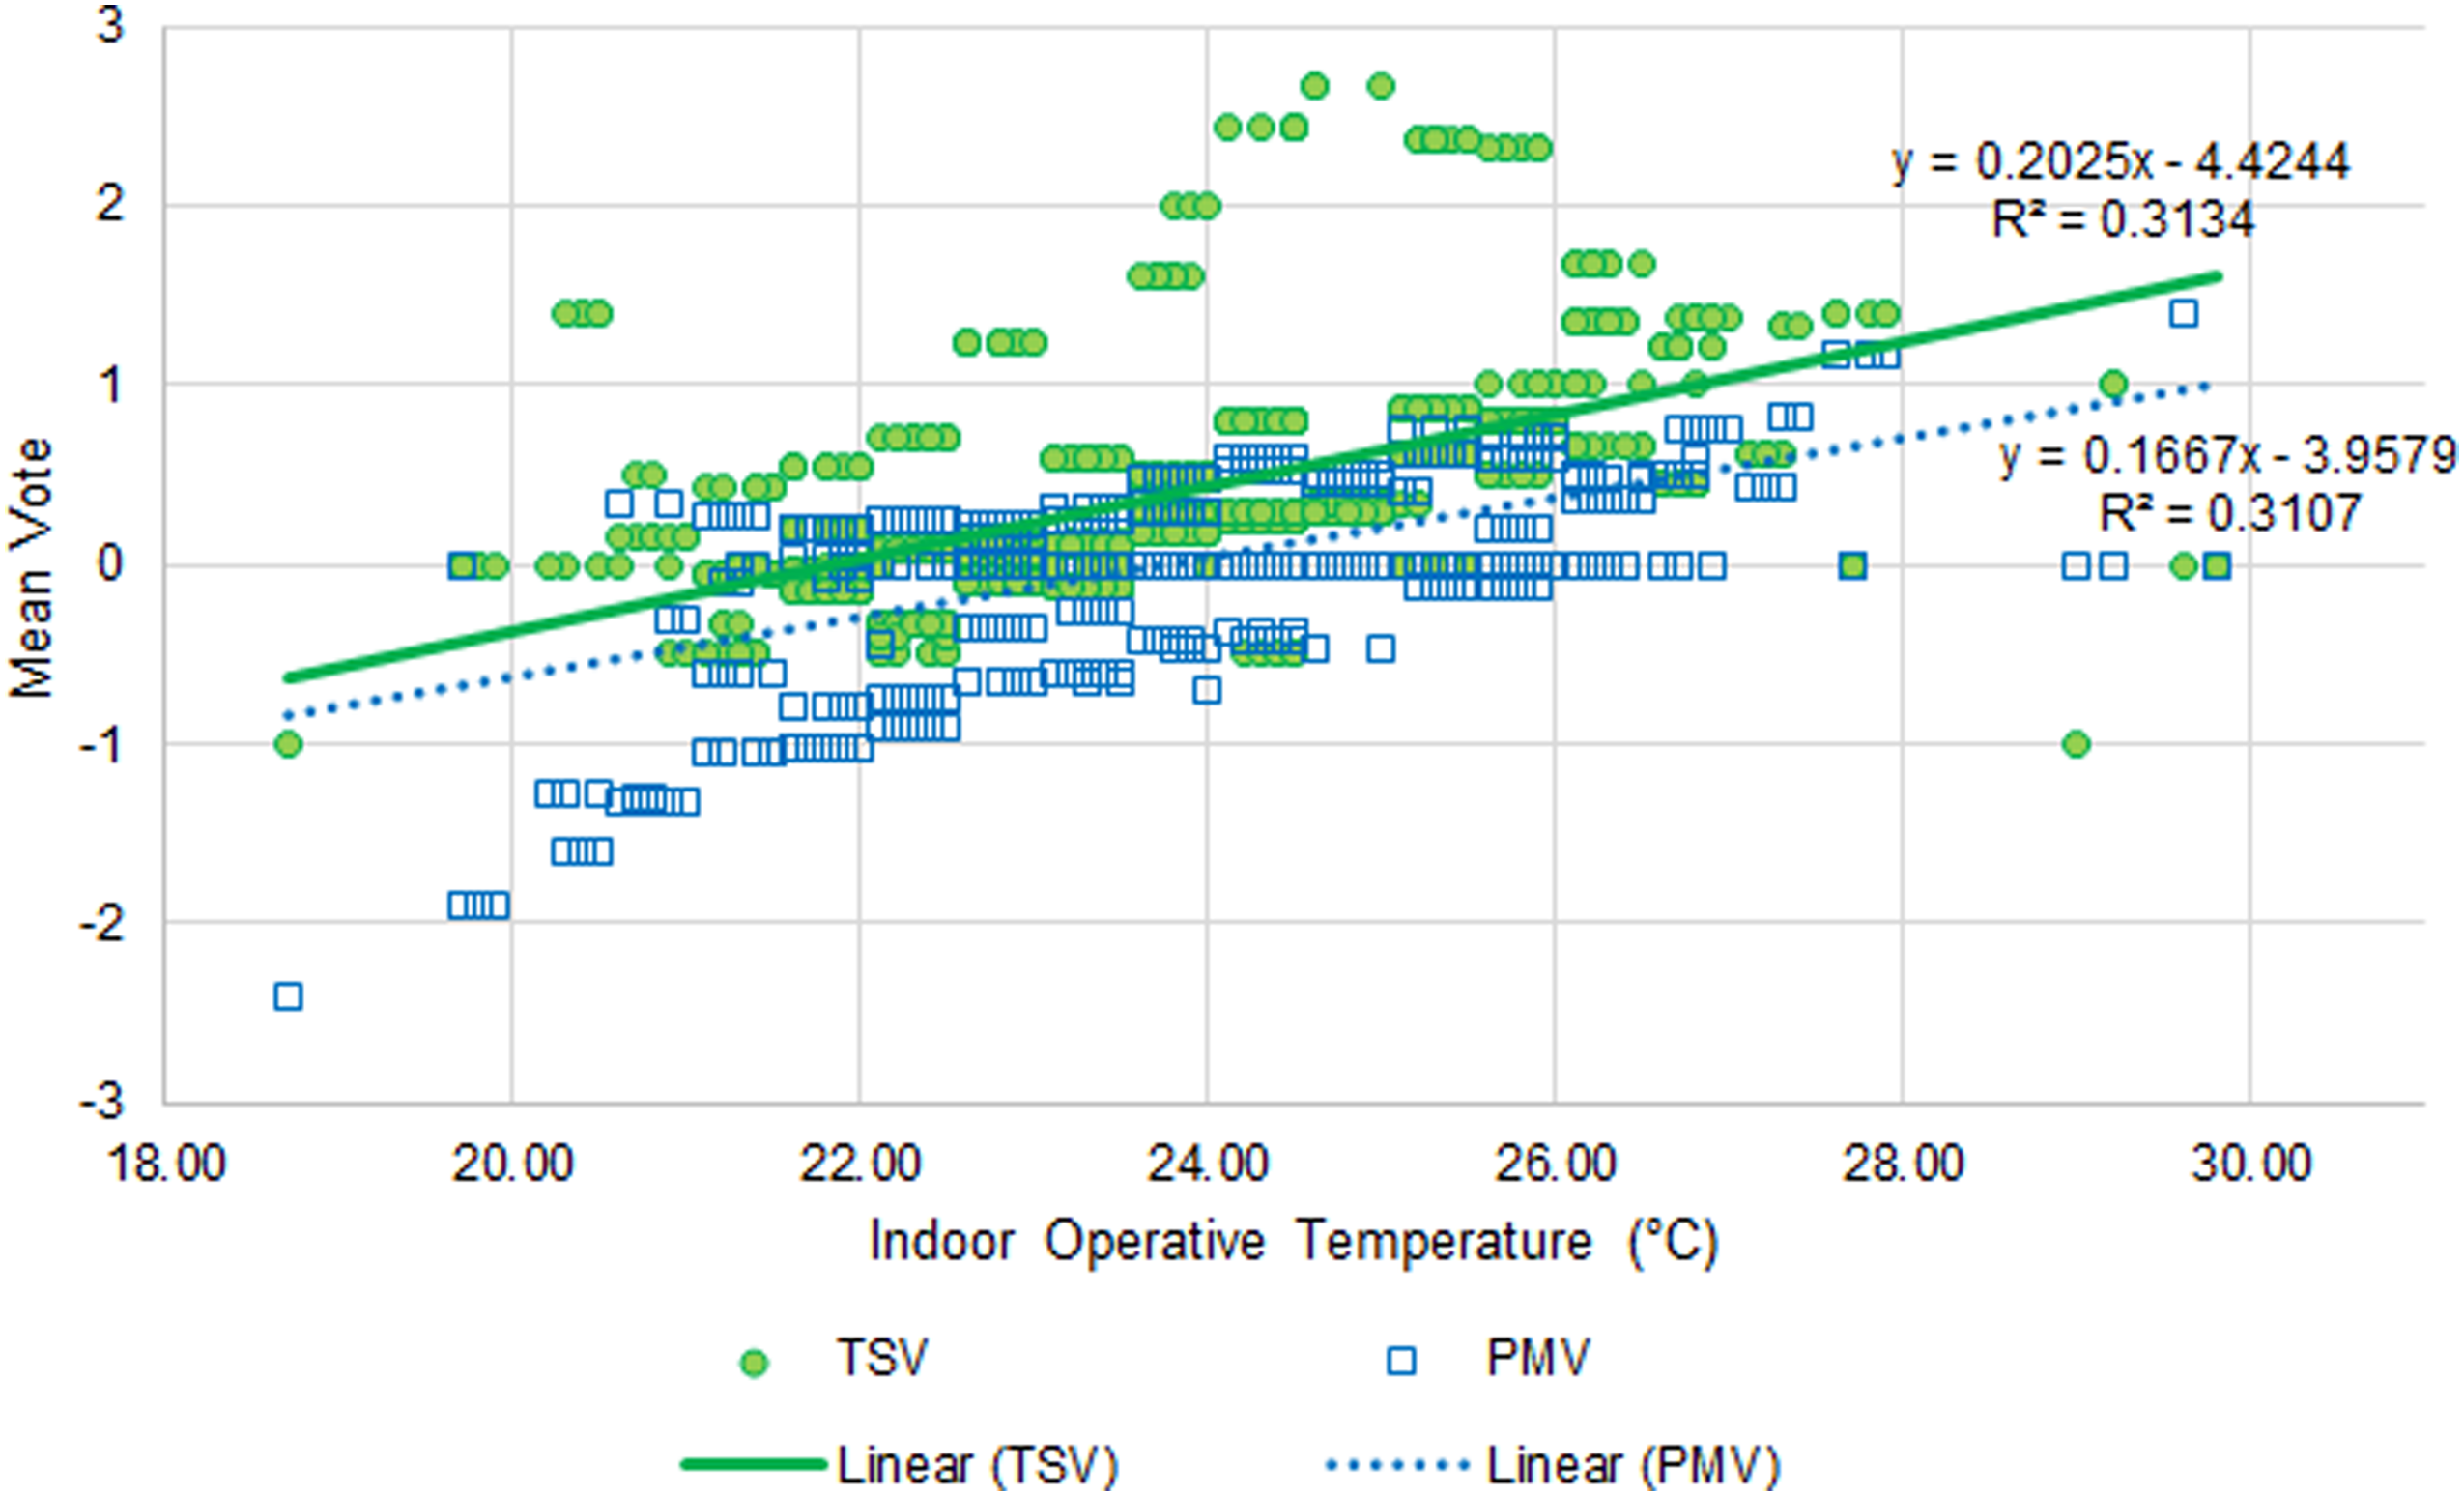
Regression-based adaptive comfort model
A secondary data cleaning was performed for the determination of neutral temperature. In addition to the removal of data corresponding to Stuttgart, the records corresponding to St Helens were removed as they did not have outdoor temperature data.
Summary of the TSV vs Top regression models for each city over the different seasons and their corresponding neutral temperature.
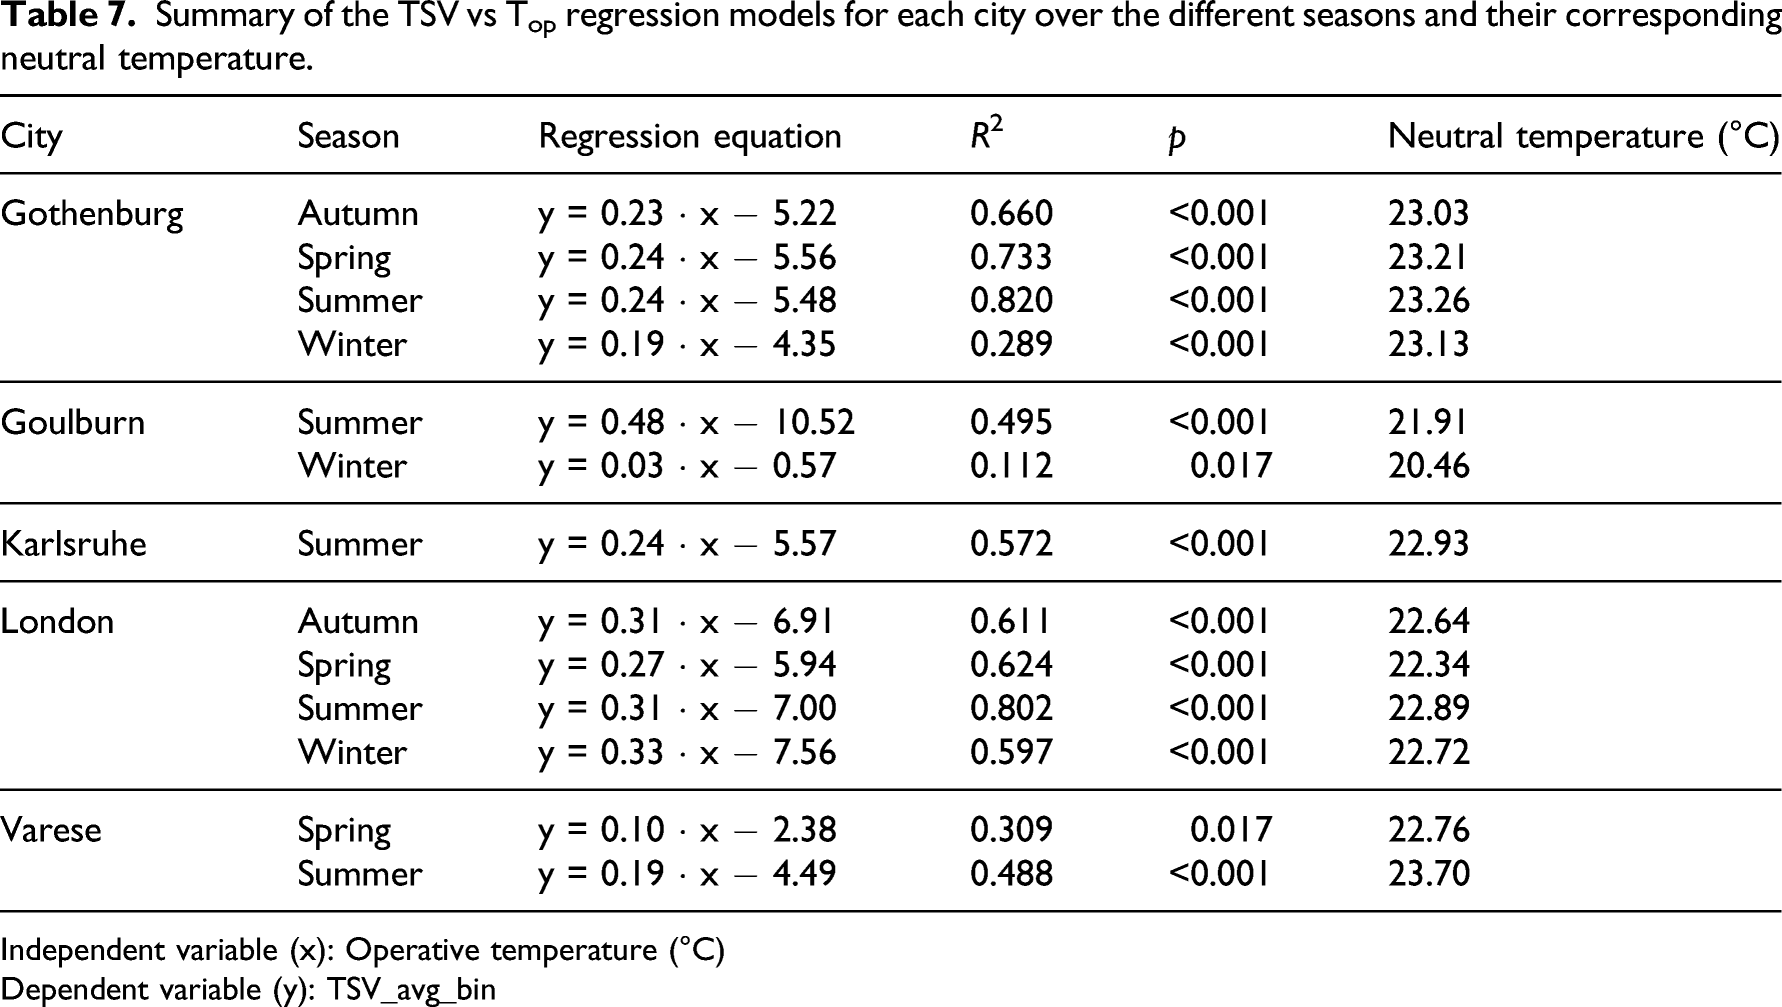
Independent variable (x): Operative temperature (°C)
Dependent variable (y): TSV_avg_bin
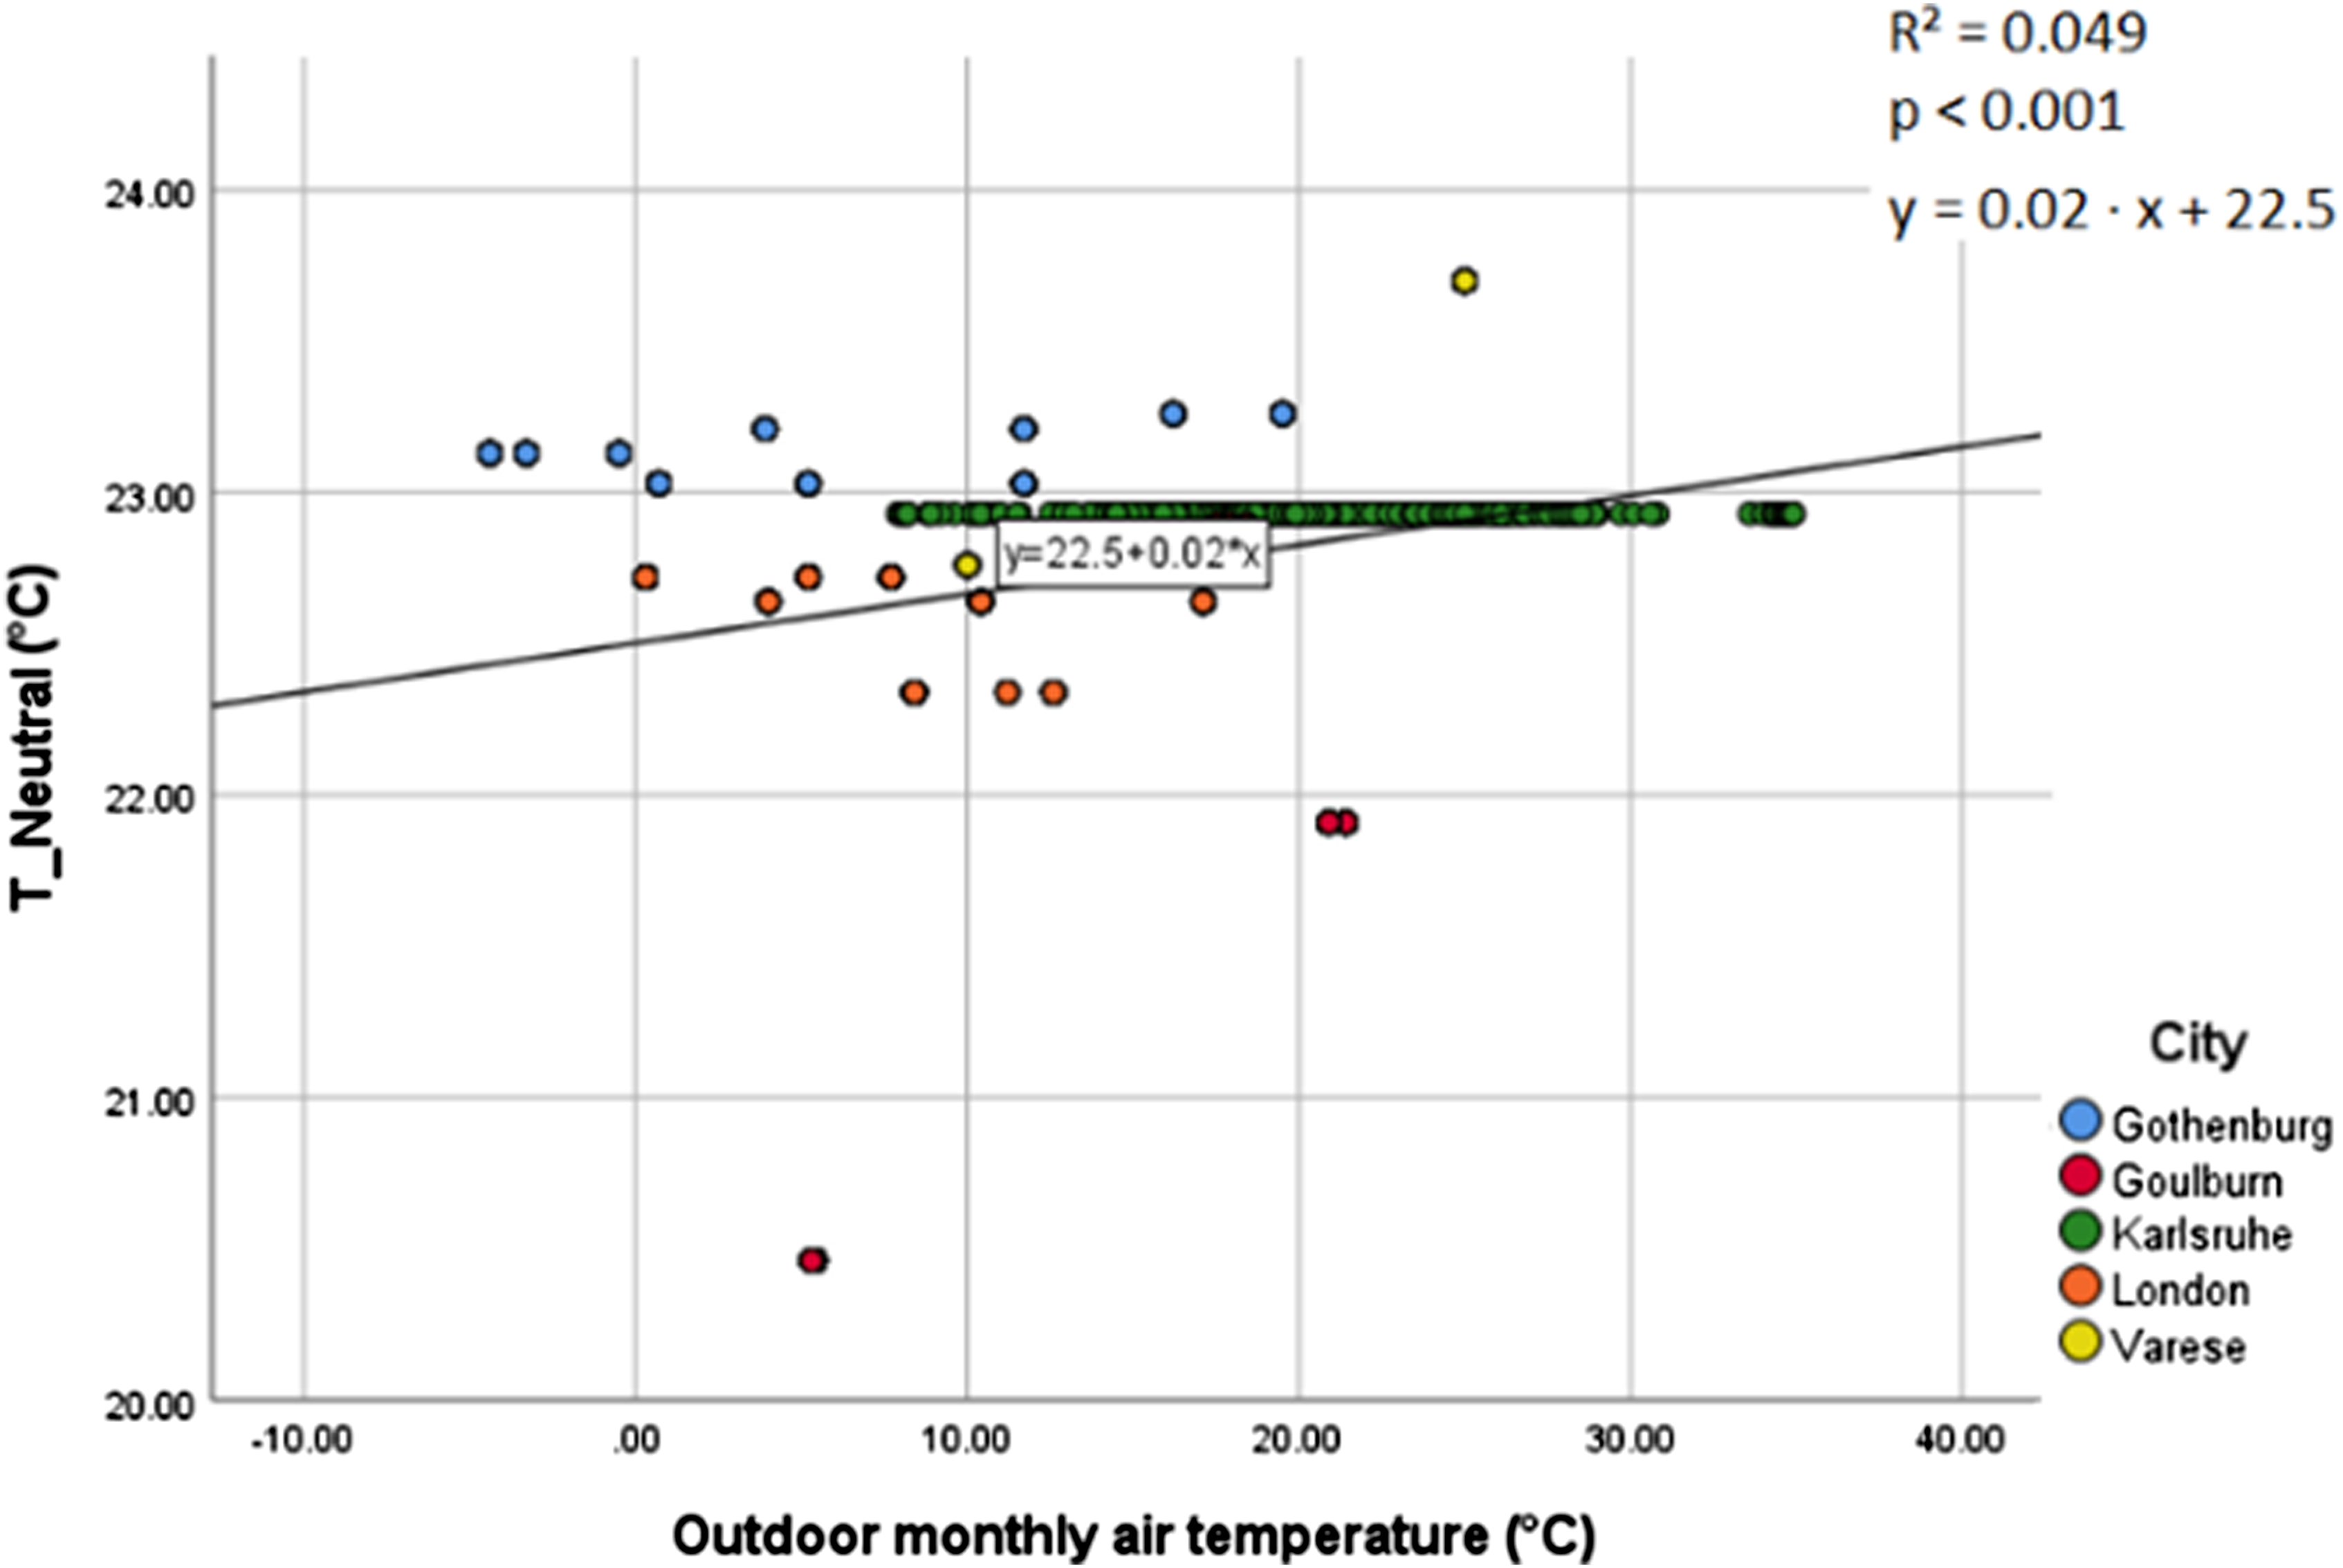
Relationship between the neutral temperature and outdoor monthly air temperature.
It can be seen from Figure 4 that the data, though statistically significant, does not have a good fit with the regression line. While this leads to reasoning that there is no substantial relation between outdoor temperature and neutral temperature in MM buildings, previous research on adaptation in MM buildings10,18,28 prove otherwise. A list of possible reasons for this discrepancy is listed below. The main issue is the low number of records for the cities over different seasons. Linear regression requires a very large data set for determining the relationship between outdoor temperature and neutral temperature.3,30 The inability to separate the data for each building has reduced the number of possible data points for neutral temperature. The lack of sufficient variation in neutral temperature with outdoor temperature, for each city, that is necessary to develop a significant adaptive relation could be a reason for this discrepancy.
Relationship between the Griffiths Comfort Temperature and Outdoor temperature
Overall adaptive relation for the database
Summary of the linear regression between the Griffiths comfort temperature and the outdoor monthly mean temperature.
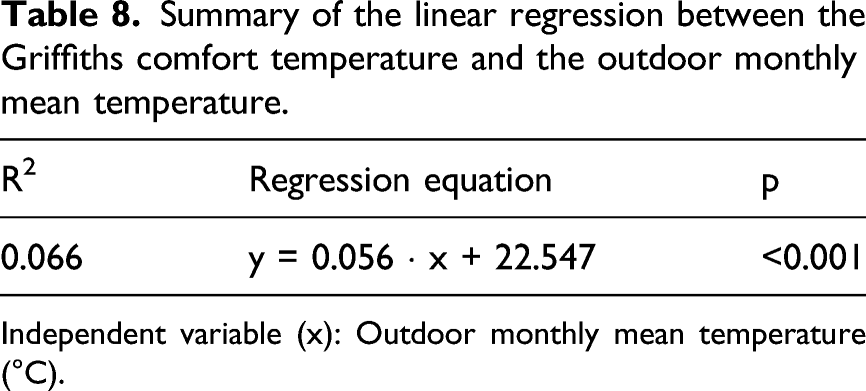
Independent variable (x): Outdoor monthly mean temperature (°C).
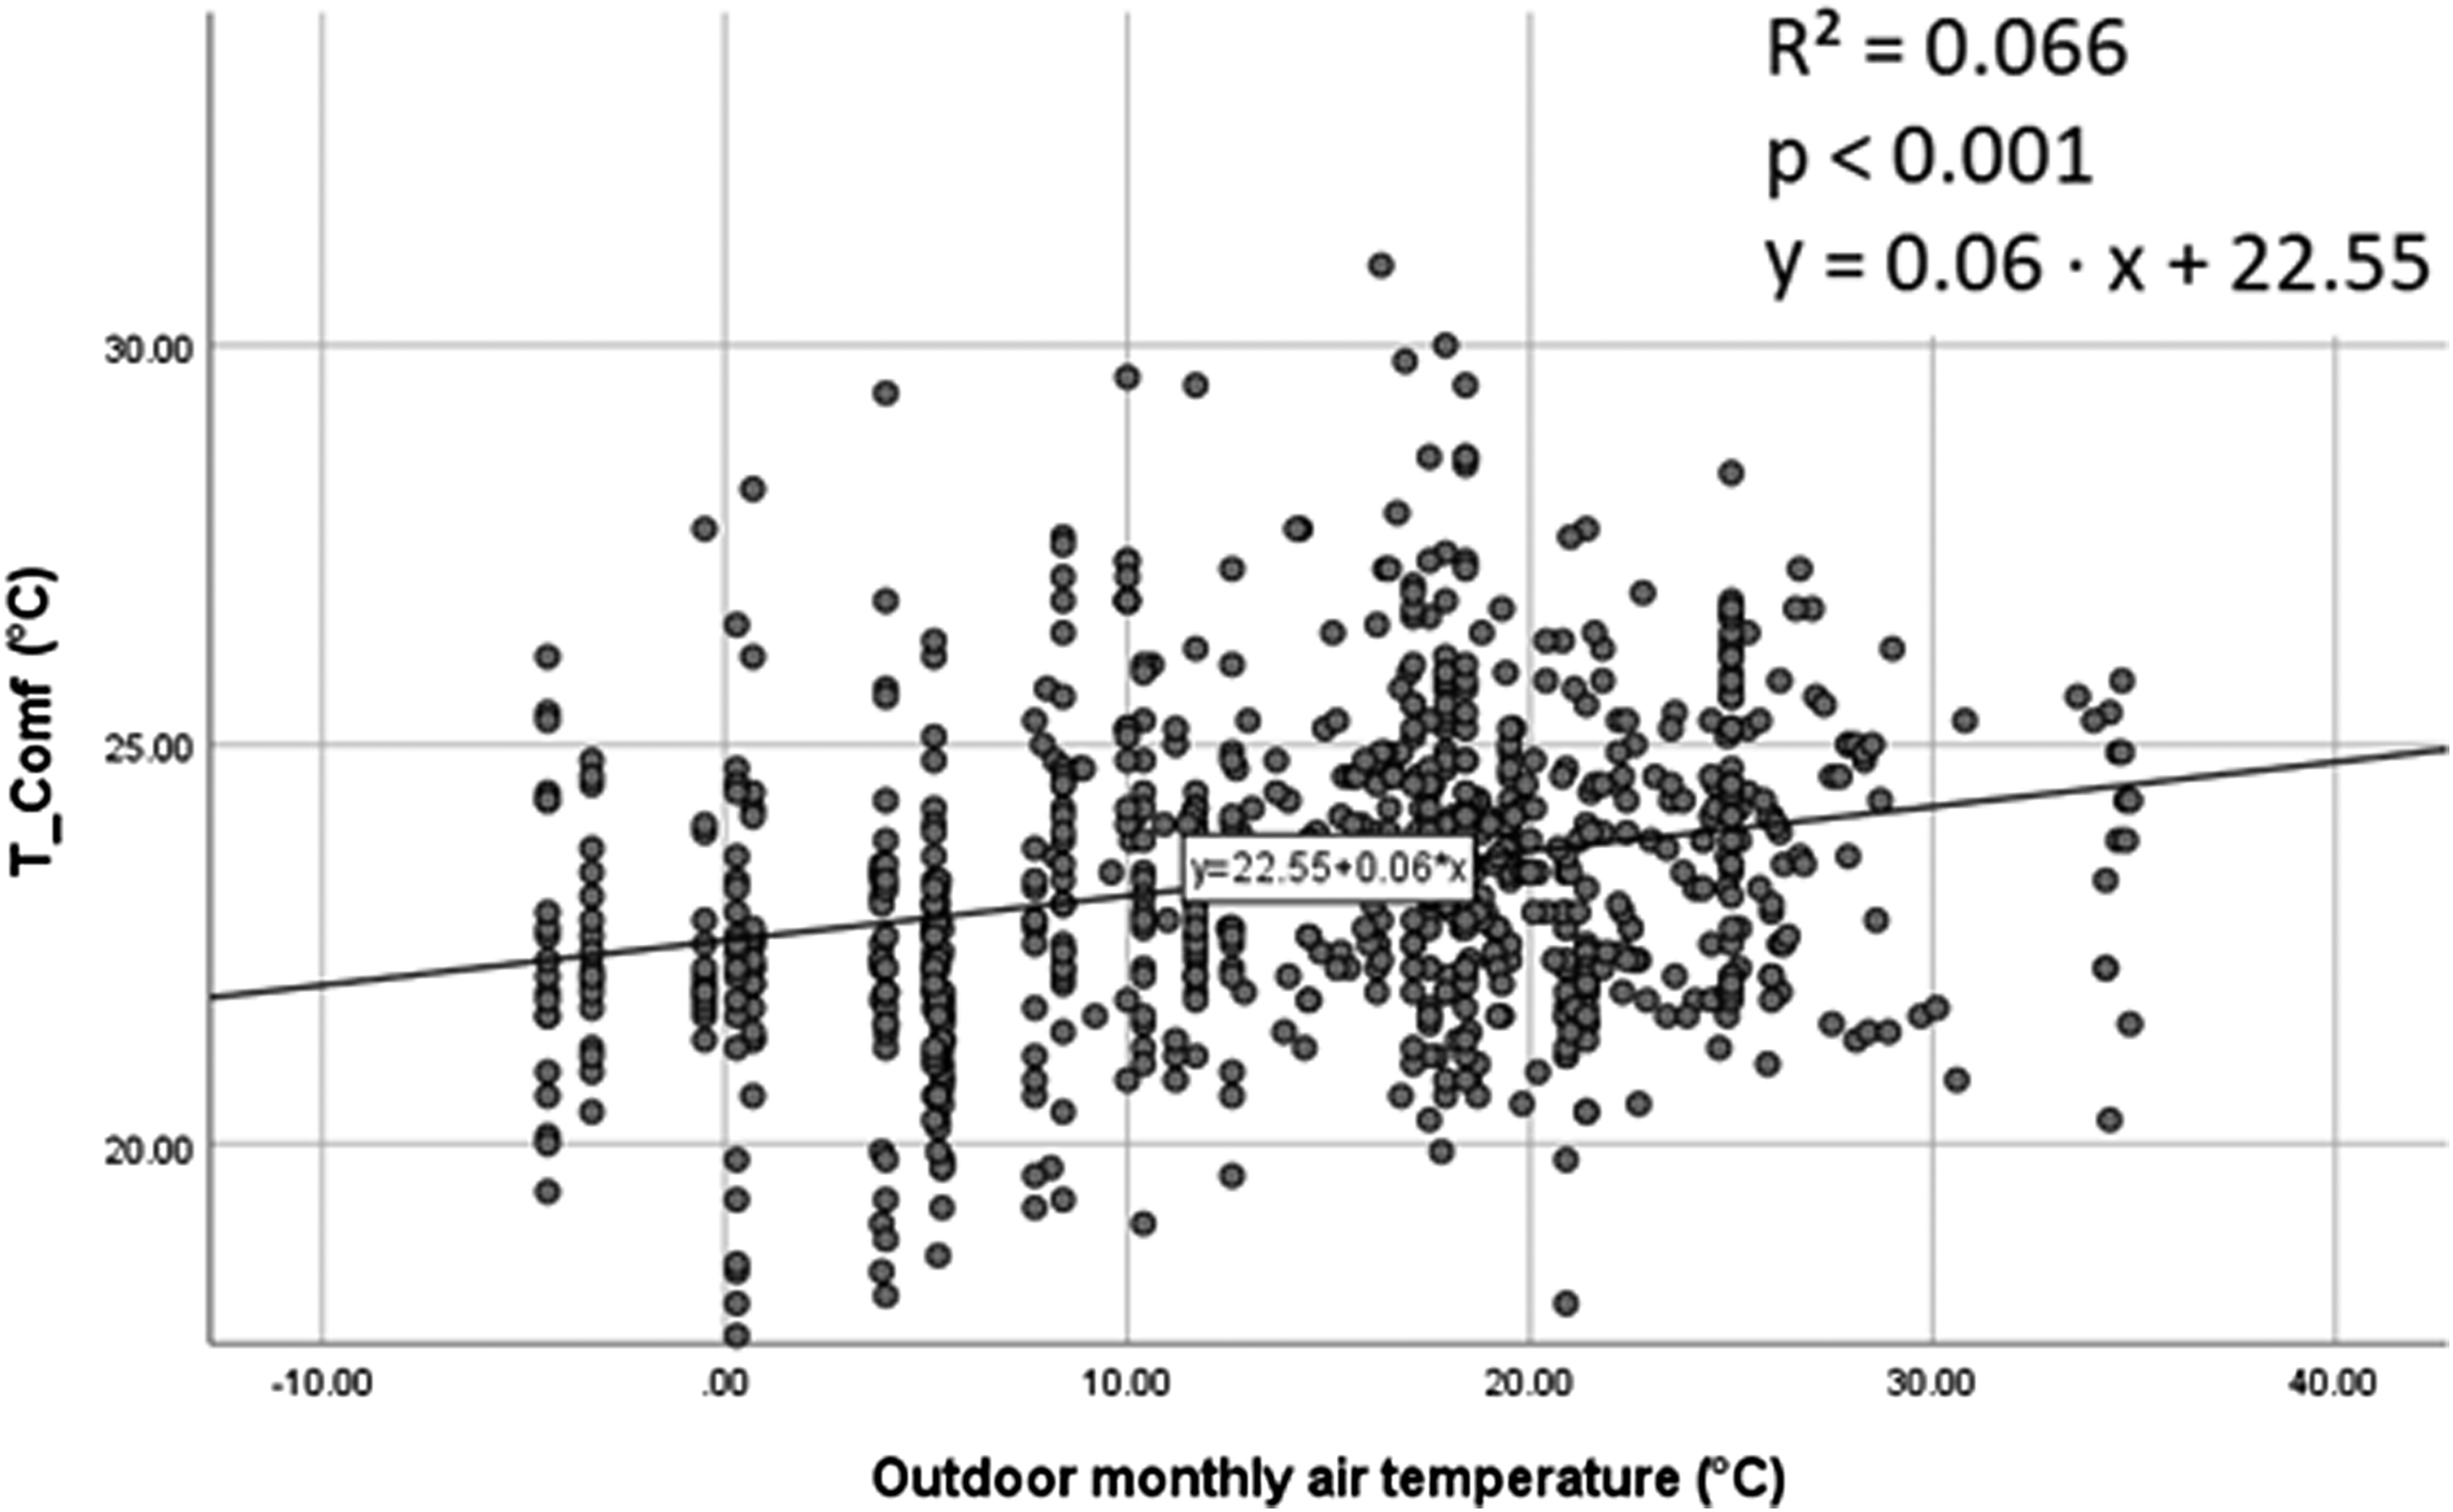
Relationship between the Griffiths comfort temperature and the outdoor monthly mean temperature.
However, the low slope of the developed equation indicates low occupant adaptability. It, also, has a very low goodness-of-fit (R2 < 0.3). To further evaluate the occupant adaptability, adaptive relation for each of the city was developed.
Adaptive relation for the different cities
Summary of the adaptive model for each city.
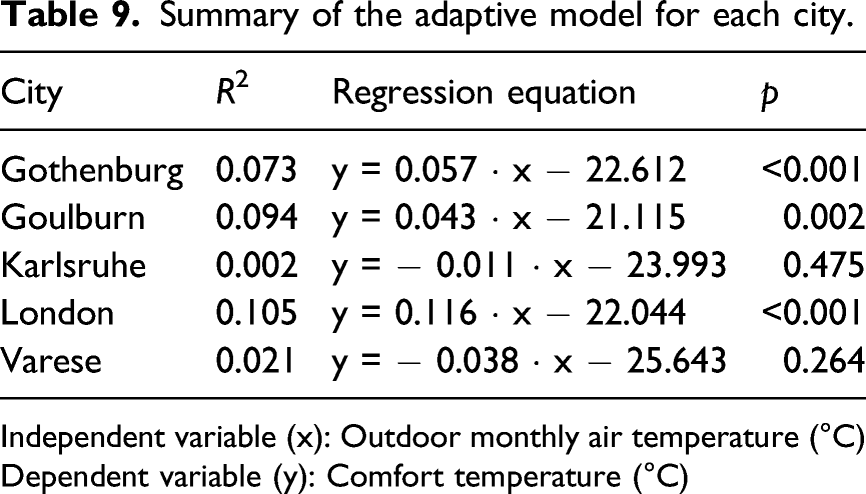
Independent variable (x): Outdoor monthly air temperature (°C)
Dependent variable (y): Comfort temperature (°C)
The low slope of the adaptive equations for Gothenburg (Figure A3) and Goulburn (Figure A4) imply a low occupant adaptability in these cities. However, it should be noted that their regression equations have a very low goodness-of-fit (R2 < 0.1). Nevertheless, the adaptive relation for London (Figure A5) shows a certain level of adaptation with outdoor climate.
Discussion
Parameters affecting thermal comfort
Indoor operative temperature is found to have the most significant influence on occupant’s thermal comfort in MM buildings in a temperate oceanic climate. While clothing, air velocity and relative humidity affect thermal sensation, they have a weak correlation with TSV and their influence is much weaker or statistically insignificant than that of operative temperature. This result is similar to the findings by Nicol and Humphreys 30 where the effect of humidity was found to be ‘very small and barely significant’. The mean thermal sensation of occupants derived as a function of operative temperature is stated below TSV = 0.203 · Top - 4.424.
The effect of operative temperature on thermal sensation as observed from this study is similar to the model derived by Luo et al. 10 for a comfort study in Loughborough (TSV = 0.21 · Top − 5.5) which has a temperate oceanic climate.
Behavioural Adaptations of the occupants
The behavioural adaptations due to clothing changes were conclusively determined, in this study, as stated below clo = 1.88 - 0.05 · Top.
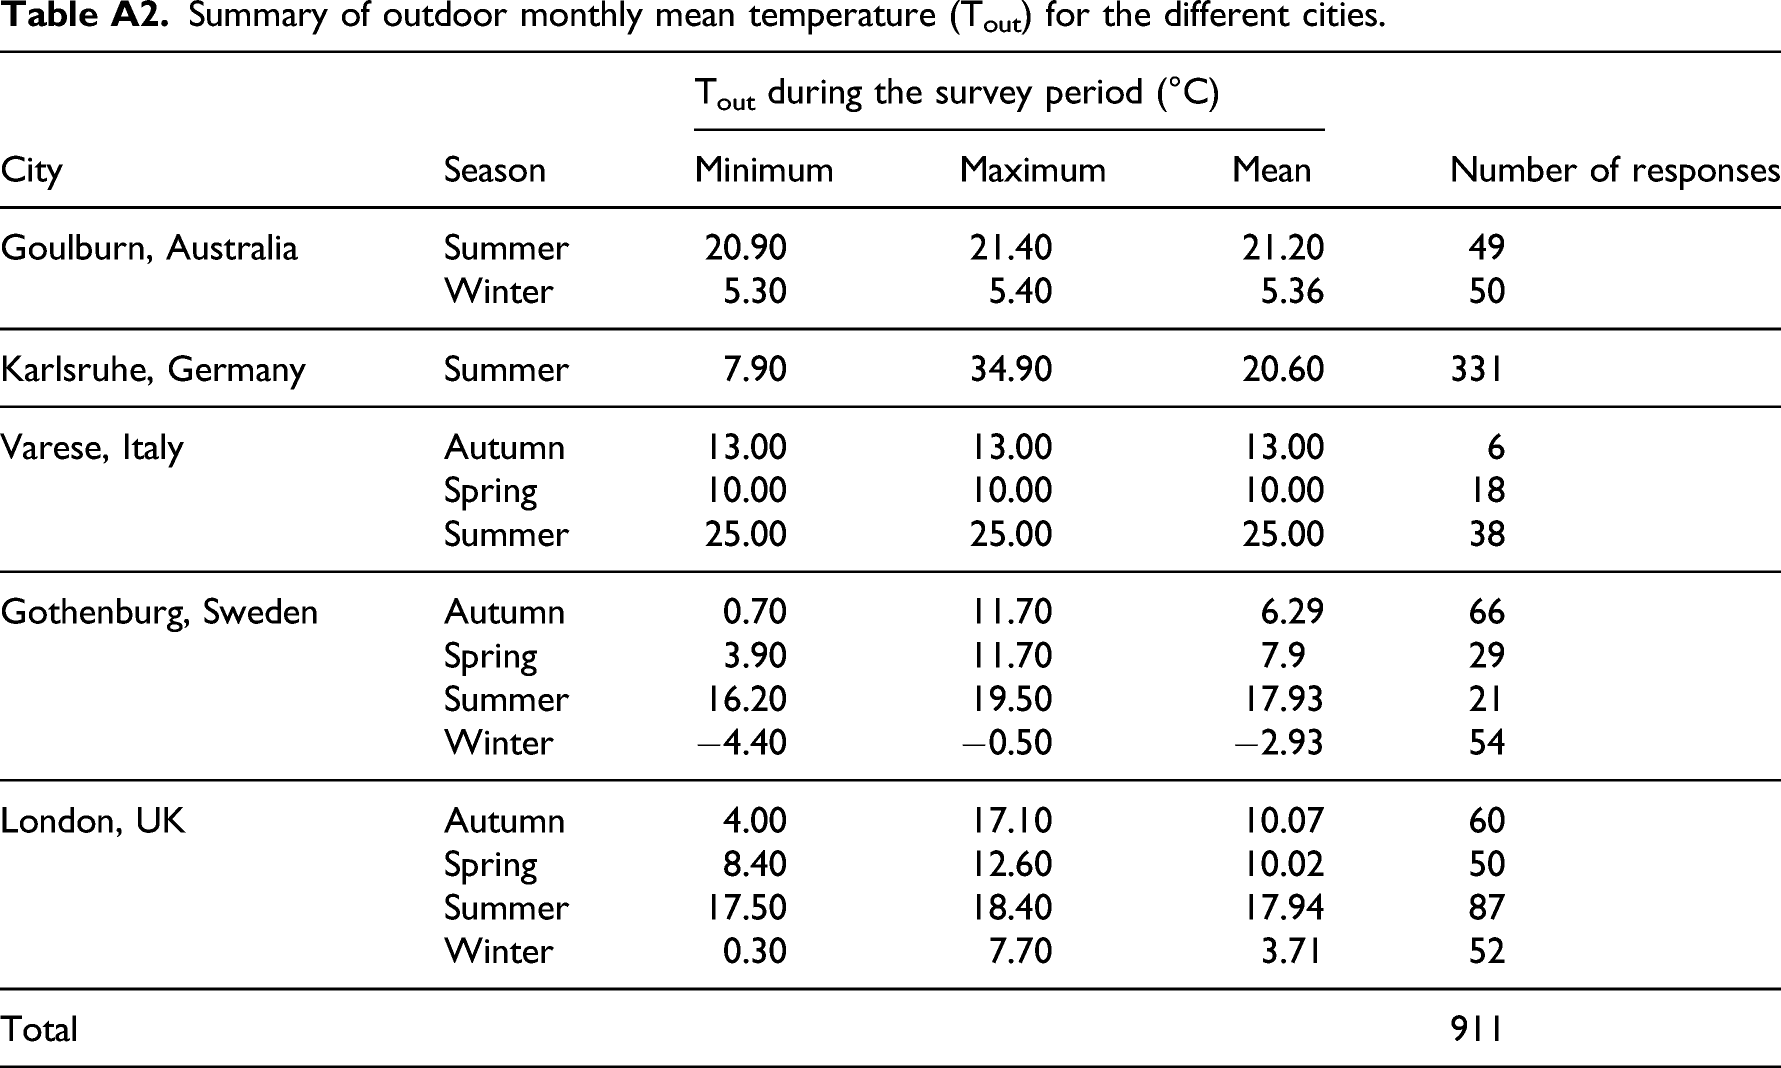
This is similar to the clothing adaptation model for AC buildings (clo = 1.93−0.04 · Top) rather than for MM buildings (clo = 4.12−0.12 · Top) as developed by Manu et al. 18 However, the results of this study are similar to that observed for both NV and AC buildings in a study by de Dear and Brager, 31 where little difference is observed between the clothing adaptability for NV buildings (clo = 2.08−0.05 · Top) and AC buildings (clo = 1.73−0.04 · Top). The tightly controlled indoor temperature could be the reason for the low clothing adaptability 4 observed in this study, as the indoors would have been mechanically heated owing to the outdoor temperature generally being below 20°C during the survey periods (refer Table A2). Thus, the survey should be well distributed over the year to better study the adaptability of the occupants in both NV and AC modes.
The effect of the indoor operative temperature on metabolic rate and air velocity could not be determined in this study due to the lack of variation in metabolic rate and air velocity resulting in a statistically non-significant result. This indicates that either the occupants did not adjust their metabolic rate or the surrounding air velocity to improve their comfort or they were unable to modify these parameters to improve their comfort. Most of the buildings in these environments were offices and classrooms where a change in metabolic rate is not possible due to the occupants being restricted to the same work. Furthermore, it is possible that the occupants did not have any mechanism to control the air velocity. Based on these details and the results of previous studies, it can be concluded that the occupants did not have sufficient control over these parameters (met and air velocity) rather than a lack of their relationship to comfort.
Accuracy of PMV in determining the thermal sensation of the occupants
In this study, the PMV underpredicts the thermal sensation of occupants. The PMV was closer to TSV at cooler temperatures than at warmer temperatures. This result is in agreement with the results obtained by Beizaee and Firth 43 where the PMV underpredicted thermal sensation by around 0.5 units in both homes and offices in the United Kingdom. It also agrees with other studies in regions with temperate climates, where the PMV was found to underpredict the thermal sensation of the occupants.10,19,44 However, it was in contrast to a study in India by Manu et al. 18 where the PMV overpredicted the thermal sensation. This difference could be due to the differences in climate as India has a predominantly warmer climate than in temperate regions.
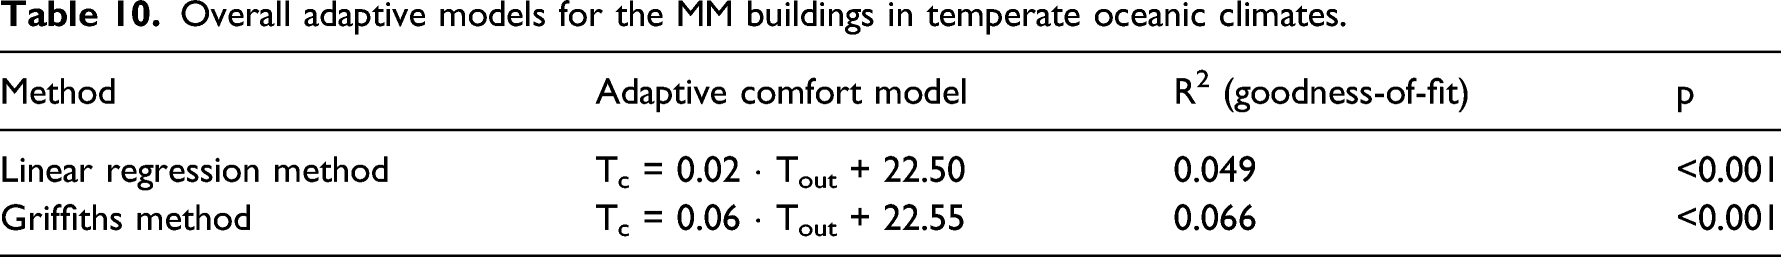
Adaptive comfort model for MM buildings in temperate oceanic climates
Overall adaptive models for the MM buildings in temperate oceanic climates.
Adaptive models for the MM buildings in various cities with a temperate oceanic climate.
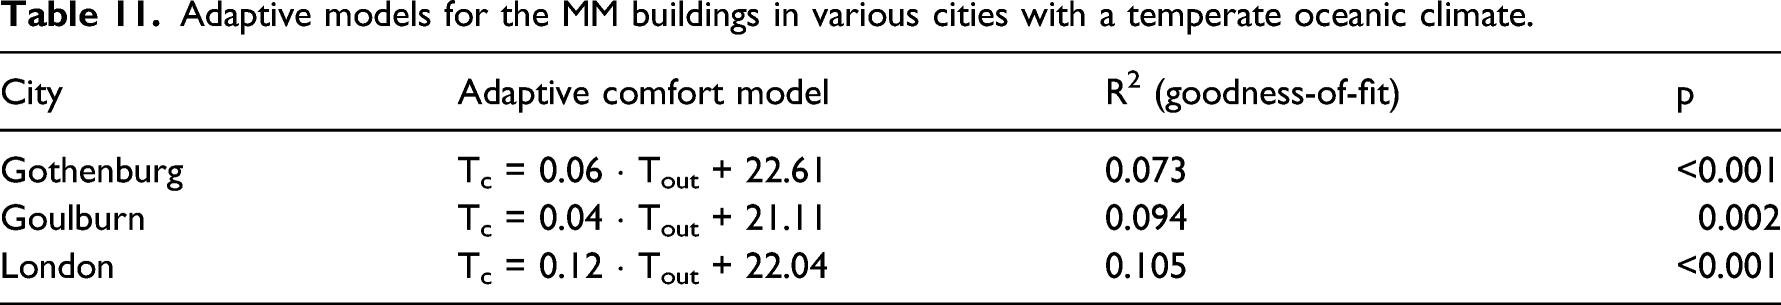
The adaptability of the occupants is found to be the lowest in Goulburn, Australia. It could be due to the low variability in outdoor temperature data for this city. There are only four different outdoor temperatures, at 5.3°C, 5.4°C, 20.9°C and 21.4°C (refer Figure A4), which might lead to the result being non-representative of the actual adaptability. Moreover, the subjects of the Goulburn survey being elderly people could also be a reason for their low adaptability to outdoor changes. The low adaptability of elderly people is observed in several studies that have shown elderly people preferring less variation from their neutral temperature.45–47
The low occupant adaptability observed in Gothenburg, Sweden is in agreement with the study by Stoops 26 where the indoor thermal conditions in offices in Gothenburg were found to be closely controlled, thus, explaining the low adaptability of its occupants. It is to be noted that the study by Stoops 26 is the source for the comfort data considered for Gothenburg in this study (Table 1). The occupants in London are found to demonstrate moderate adaptability with outdoor conditions. The developed adaptive model is similar to the adaptation observed for the UK in the SCAT study. 30
The adaptive models for the cities in this study are based on survey data during a predominantly heating season, as the outdoor monthly mean temperature rarely exceeded 20°C (Table A2). Due to this reason, the aim of this study to examine the adaptability of occupants towards warming climates was not sufficiently concluded. Thus, it can be concluded that to effectively study the occupant adaptability, the survey period should be well distributed over the year covering all climates and temperatures.
Comparison with adaptive comfort models of previous studies
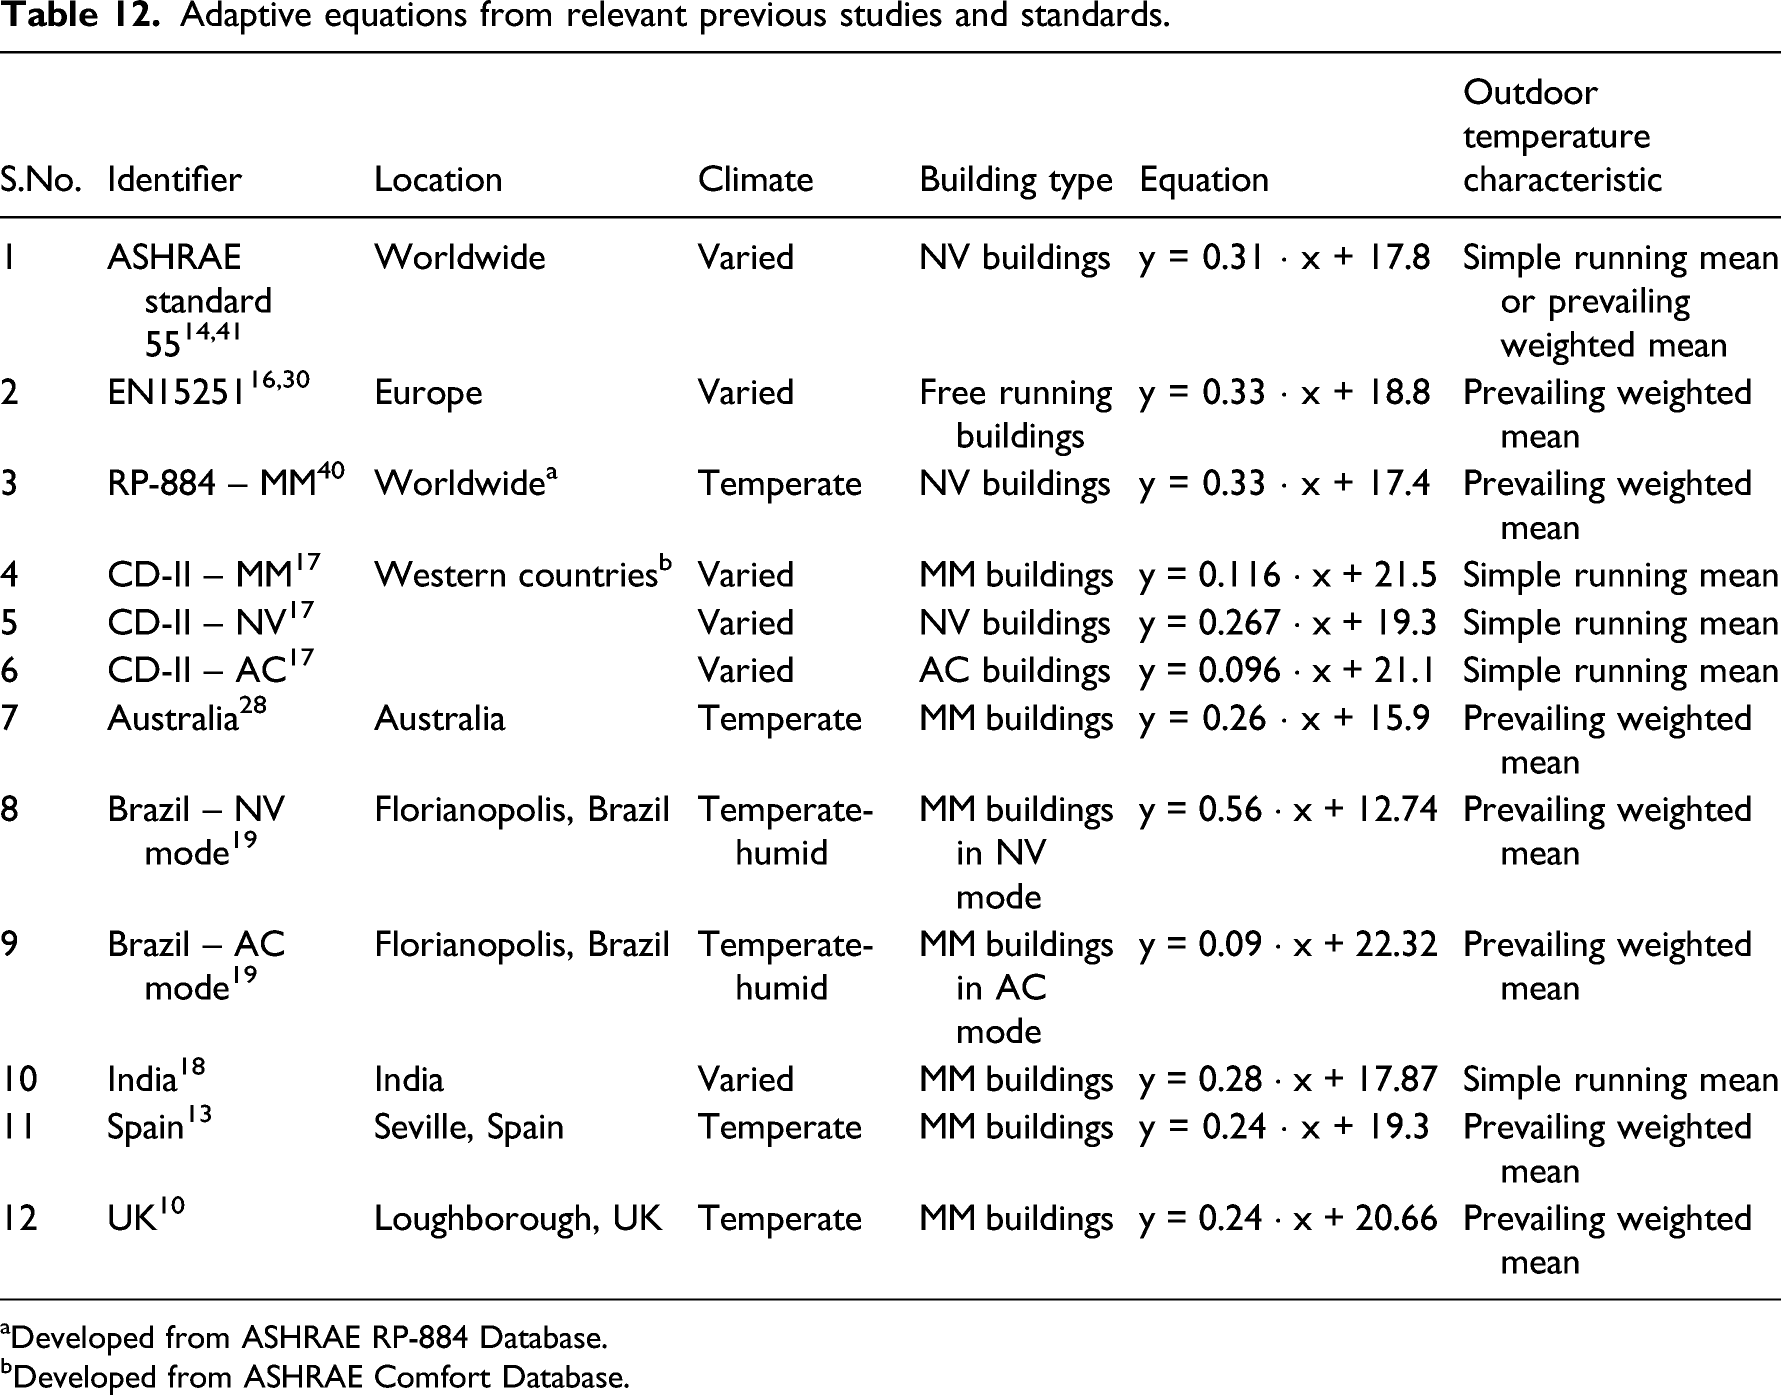
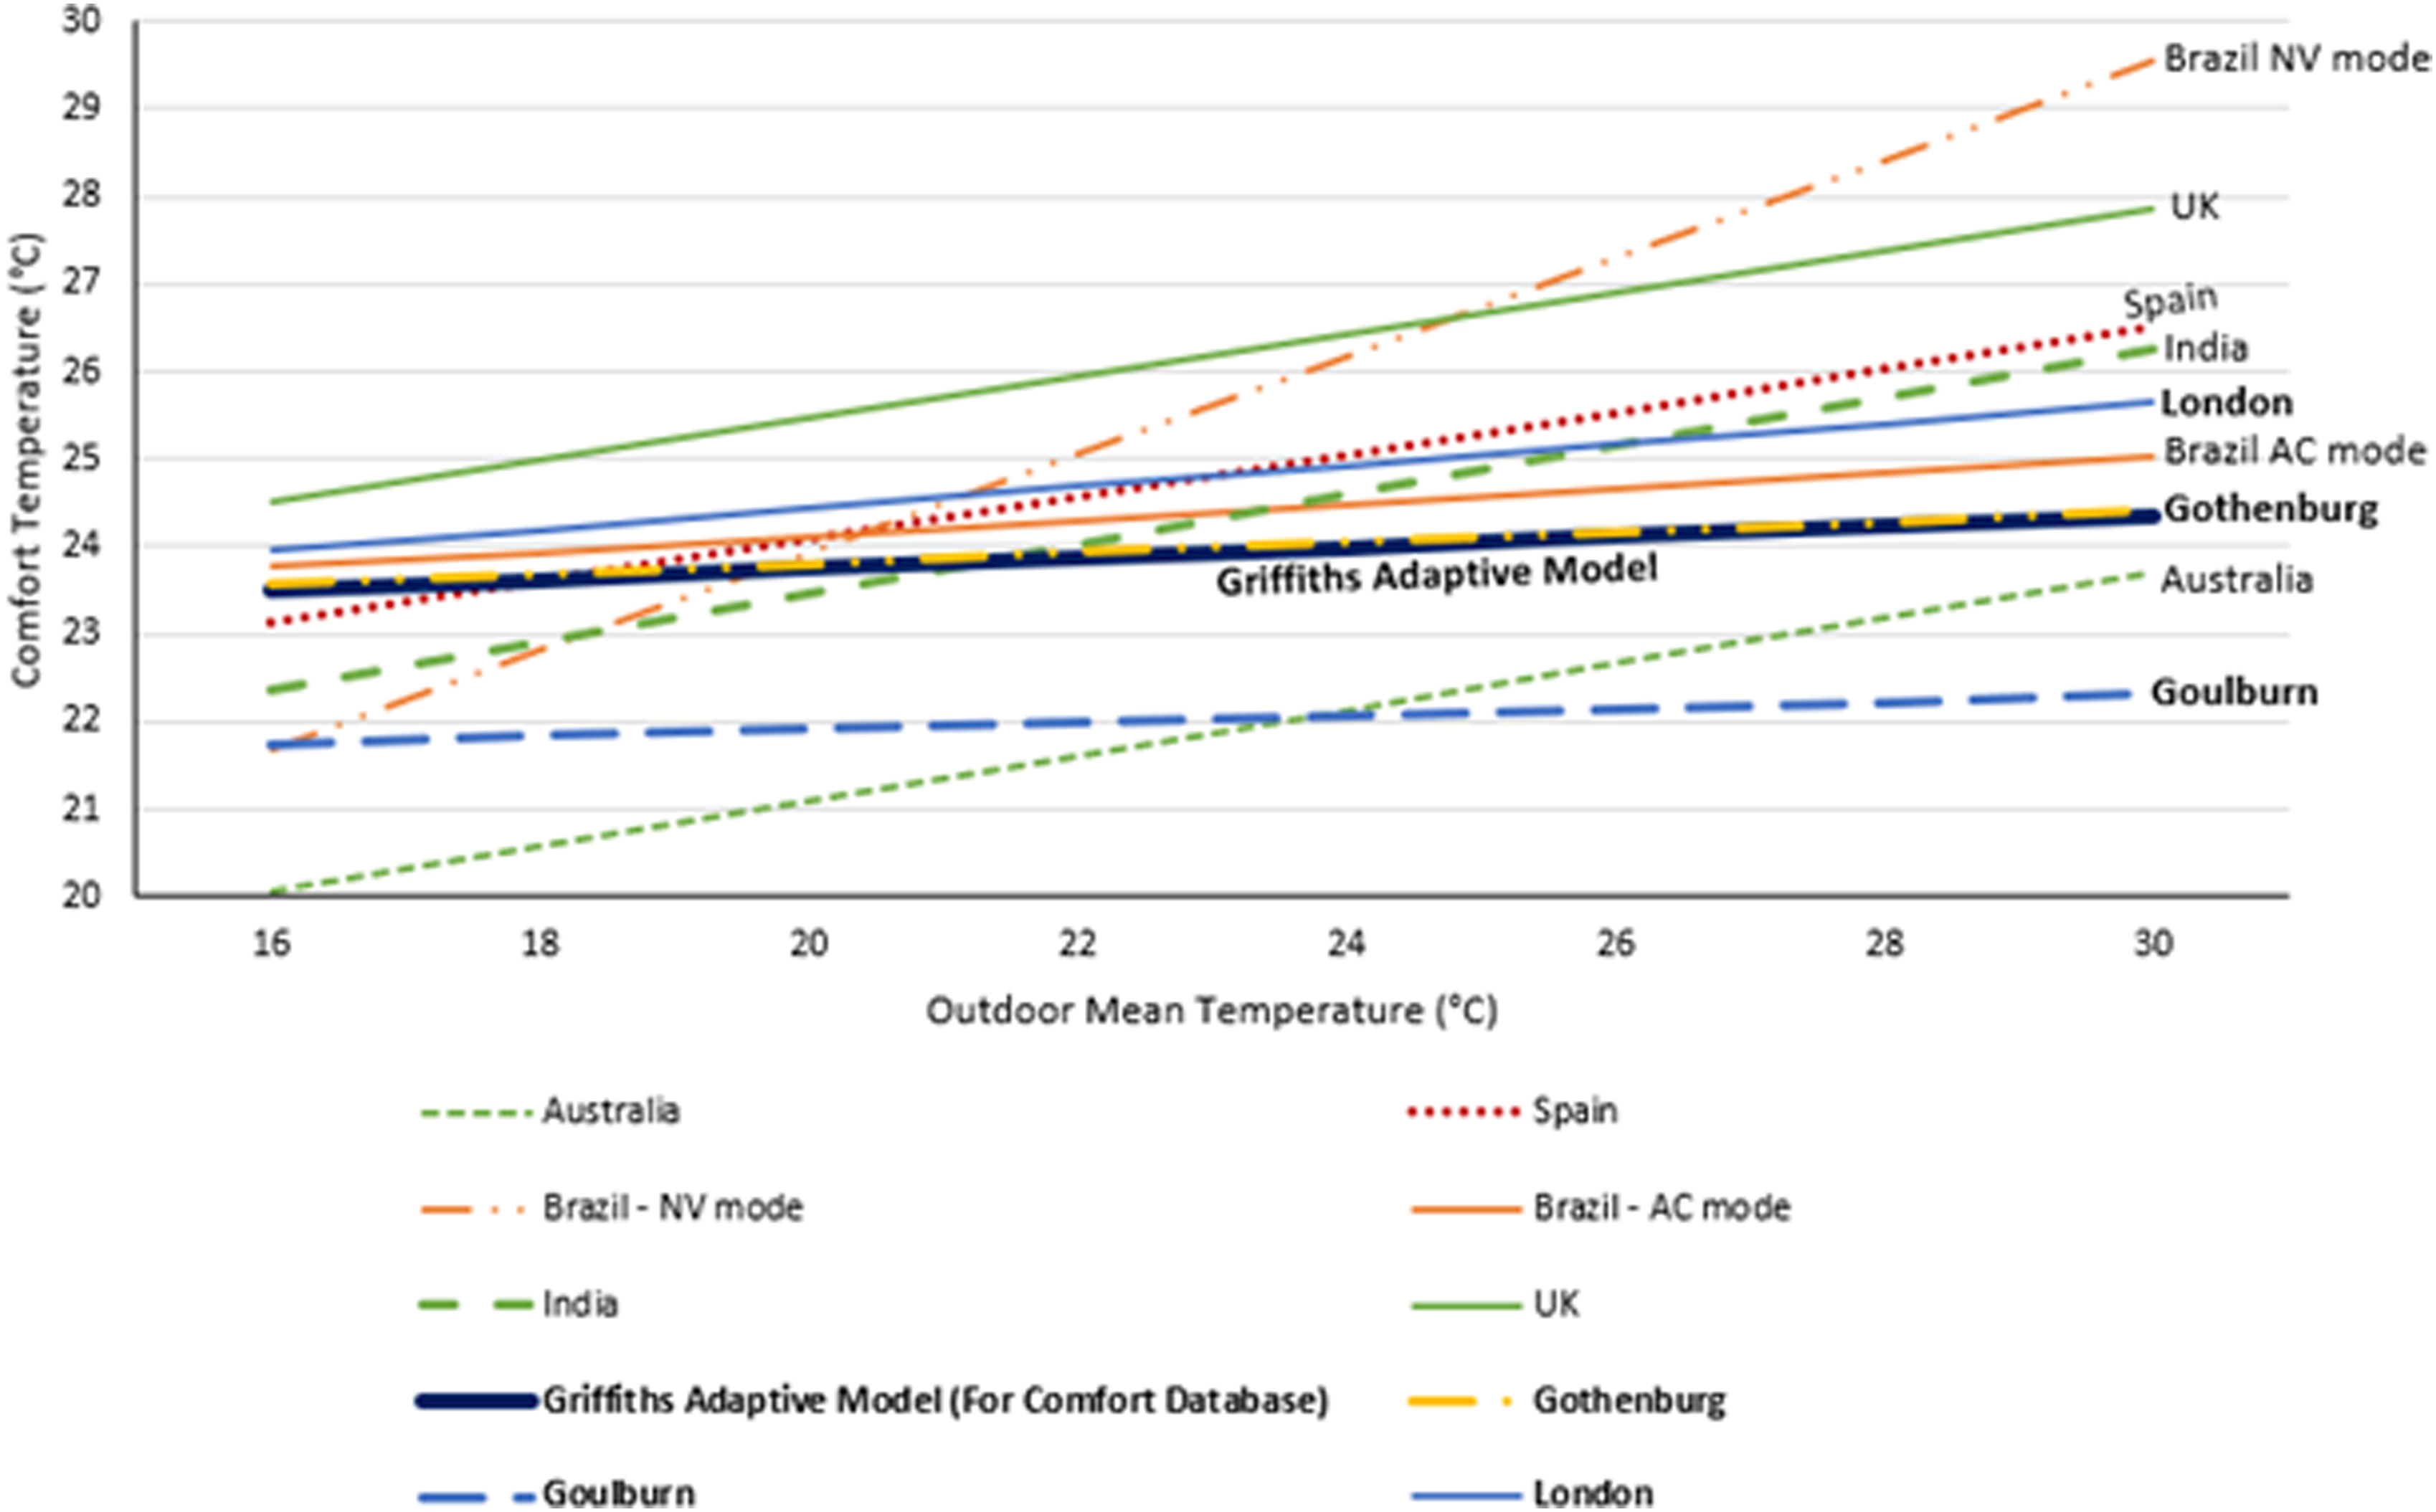
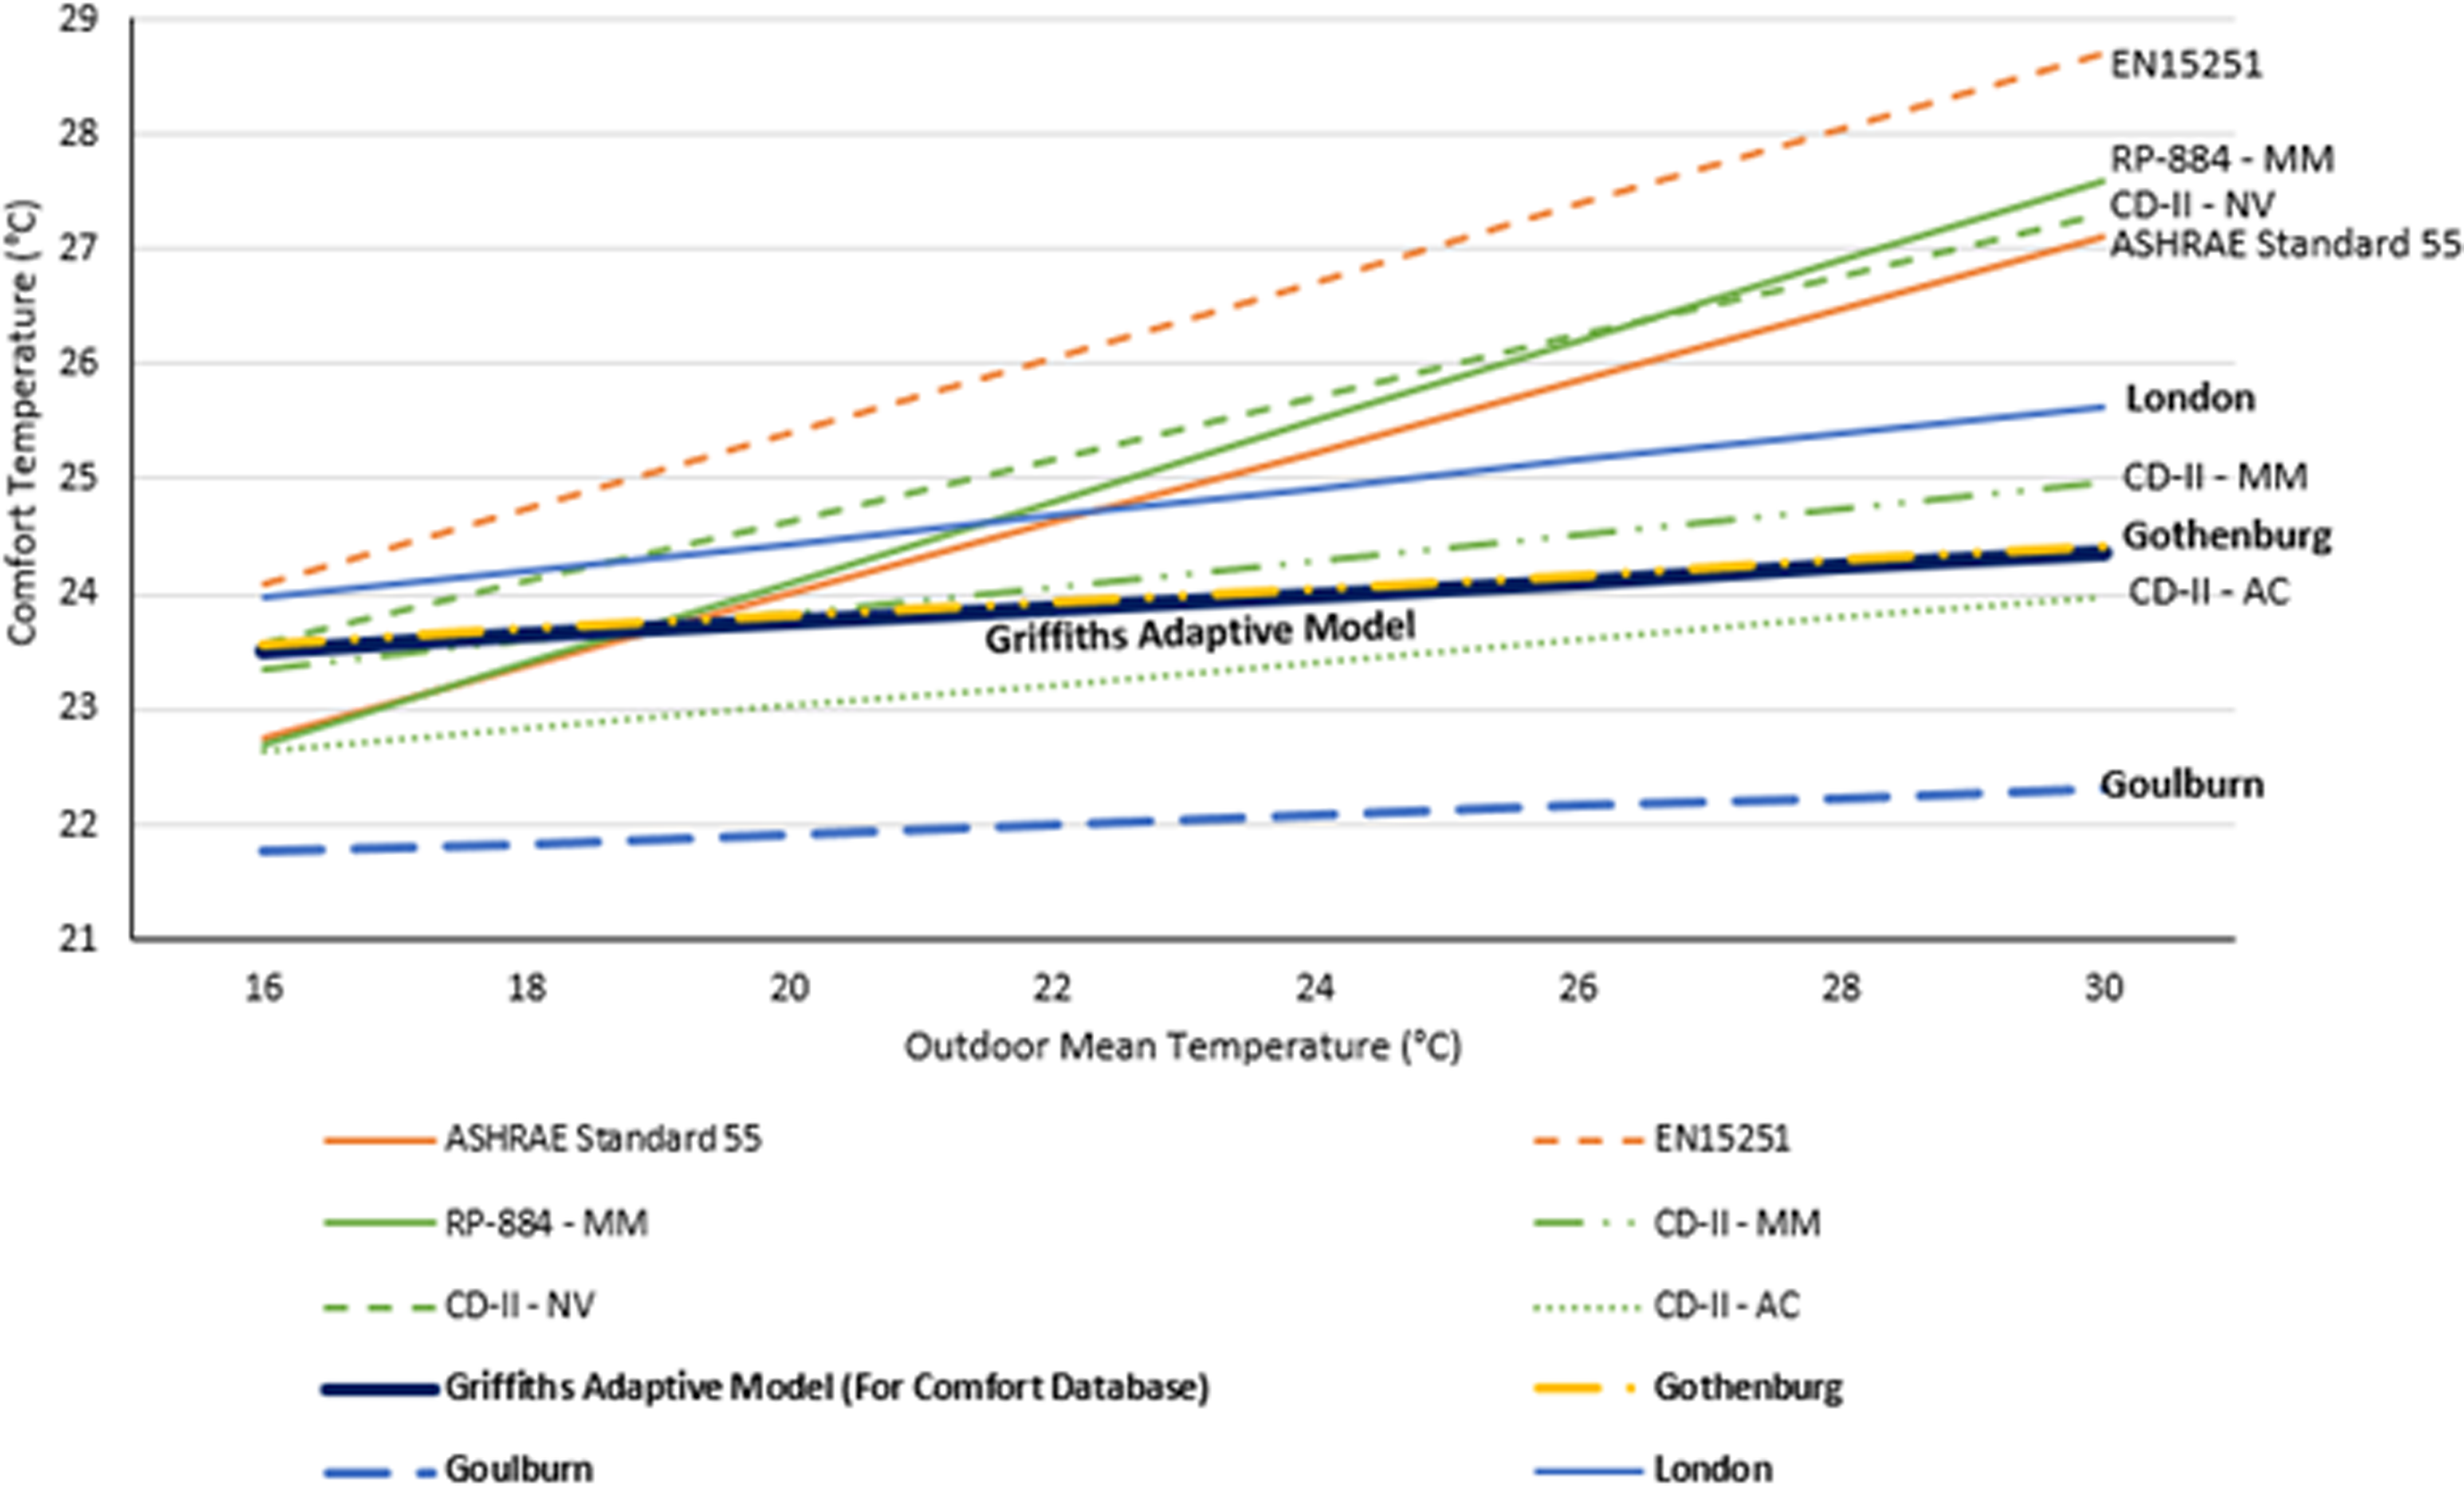
Graphical representation of adaptive models from standards and previous studies (as tabulated in Table 12) are shown in Figure 6 and Figure 7. The inferences from a comparison of these models with those developed in this study are stated below. The adaptive models developed in this study, that is, the overall Griffiths model, models for Gothenburg, Goulburn and London, have low adaptability (slope of the adaptive equation) similar to that for AC buildings (CD-II – AC) and MM buildings (CD-II – MM) in western countries. Furthermore, the adaptability in these models is like MM buildings operating in AC mode in Brazil (see ‘Brazil – AC mode’). However, these models indicate lower adaptability than the MM buildings in temperate climates shown in Table 12. Thus, a difference in adaptability between locations even with similar climates (here temperate climate) could be inferred. The contradiction between the model for London (in this study) having a lower adaptability to that of the UK (in the previous study by Luo et al.
10
) can be explained by the following points: The study by Luo et al.
10
was conducted only in Loughborough, yet the authors claimed the model is suitable for the whole of the UK. The model for London is based on a survey from the years of 1998 and 1999,
26
and the adaptability of the occupants may have improved over the years with the warming climate. Moreover, it should be noted that the model for Gothenburg, Sweden is also based on old surveys from the years of 1998 and 1999.
26
Thus, it is possible the model developed in this study for Gothenburg does not represent the present adaptability of the occupants in MM buildings. As discussed in the previous sections, the low adaptability for Goulburn, Australia could be due to the age of the occupants. All the adaptive models developed in this study have a much lower adaptability than the adaptive model of both the ASHRAE Standard 55 and the European Standard EN15251, thus, hinting at the lack of suitability of the adaptive models specified in the standards for an MM building. Adaptive equations from relevant previous studies and standards. aDeveloped from ASHRAE RP-884 Database. bDeveloped from ASHRAE Comfort Database. Comparison with location-specific adaptive models from previous studies. [The adaptive models developed in this study are represented using ‘bold’ font] Comparison with previous adaptive models developed from databases and standards. [The adaptive models developed in this study are represented using ‘bold’ font]
Limitations of this study
The limitations faced in this study are enumerated below. Due to a lack of information necessary to differentiate the records of different buildings of the same study and location in the ASHRAE Comfort Database, any building-wise evaluation was not possible. Sufficient information to significantly group the responses into NV mode and AC mode was not available in the Comfort Database. Hence, the operational state of environmental controls (heaters, fans, windows and air-conditioners) could not be determined for most of the response data. A lack of information on the MM strategy of the building meant that the disparities in thermal comfort between the different modes of operation could not be evaluated. Previous studies have shown an increase in air velocity as an adaptive measure undertaken by the occupants.18,41,48 However, in this study, this behaviour could not be investigated due to little variation in the observed air velocity. Many of the comfort responses for the MM buildings in temperate oceanic climates in the Comfort Database are from surveys conducted before the year 2000. With the climate getting significantly warmer since 2001,
49
the thermal sensation of the occupants may have changed since then due to long-term adaptation. Hence, further research is necessary to clarify this issue. Finally, despite the measures taken to ensure the quality of the Comfort Database,
32
there seem to be some inherent issues with some of its data. This ensued a removal of those ambiguous records during analysis.
Recommendations
Most of the limitations faced in this study were inherent to the data in the ASHRAE Comfort Database. The following recommendations are suggested for future research on thermal comfort: It is recommended that the survey be taken multiple times a month and over an entire year so that the collected data represents the changes in occupant adaptability with outdoor climate. Conducting thermal comfort surveys during warm spells in summer (planned based on weather forecast) would help capture the thermal sensation of the occupants during peak summer, thus, giving valuable insights into adaptability during the extremes of climate change. Moreover, conducting the comfort survey over the year would give valuable insights into the variation in the comfort temperature over the year. It is recommended that sufficient provisions be made for behavioural adaptation by the occupants. Permitting clothing variations and controls for changing surrounding air velocity is necessary to analyse behavioural adaptation. It is recommended to record the operational strategy (NV or AC) of the buildings during the survey along with information on the various environmental controls available in a space and their operating status. In comfort databases, it is recommended to have unique identifiers for each building and each space with different environmental controls within the same building. This would prevent the aggregation of data between spaces operating using different thermal control strategies and, thus, would result in a more accurate analysis of the neutral temperatures in a city over varying outdoor climates. It is recommended that a new publicly accessible database be developed where responses of new thermal comfort surveys can be submitted, existing data can be checked for validity, and errors or issues with data can be flagged by researchers. The development of this novel open-access dynamic comfort database would provide researchers with more accurate recent data for conducting thermal comfort analysis.
Conclusion
The purpose of this study was to develop a thermal comfort model for MM buildings in temperate oceanic climates. The survey data from the ASHRAE Comfort Database was used to examine the occupant’s thermal comfort and adaptability.
The analysis showed that the indoor operative temperature has the most significant effect on the occupant’s thermal sensation in MM buildings in a temperate oceanic climate which agrees with published research. All the other parameters play a relatively small influence that could be practically ignored in the evaluation of the mean thermal sensation of the occupants. Occupant adaptation to indoor temperatures by clothing adjustments was observed. However, other behavioural adaptations, by the change of air velocity or metabolic rate, could not be determined due to statistical non-significance of their analysis. A comparison between Fanger’s PMV and the actual thermal sensation (TSV) of the occupants reinforced the claim by multiple previous studies on the unsuitability of PMV to determine thermal comfort in MM buildings. An interesting outcome of this thermal comfort study was that the data for Stuttgart, from the ASHRAE Comfort Database, was found to be flawed. A negative correlation between thermal sensation and operative temperature was observed, for the occupants of Stuttgart, indicating a possible issue in the data collection procedure for this city as this finding is contrary to both logic and previous research. Finally, both the Linear Regression and Griffiths methods were employed in estimating the neutral temperatures and, subsequently, developing the adaptive comfort model. However, the linear regression method yielded adaptive models that had low goodness-of-fit or were statistically insignificant. Moreover, the study-specific Griffiths constant could not be developed due to the limited data availability resulting in statistical non-significance. Hence, the adaptive models for the different cities were developed using the unified Griffiths constant of 0.5 K−1. Due to the low adaptability of the developed comfort models which does not conform to the results of previous studies and the various constraints owing to the inherent limitations in the dataset derived from the ASHRAE Comfort Database, further research is necessary to confirm the results of this study. The proposed recommendations would help overcome the limitations observed in this study and facilitate comprehensive comfort studies.
Footnotes
Declaration of conflicting interests
The author(s) declared no potential conflicts of interest with respect to the research, authorship, and/or publication of this article.
Funding
The author(s) received no financial support for the research, authorship, and/or publication of this article.
Appendix
Summary of outdoor monthly mean temperature (Tout) for the different cities.
| City | Season | Tout during the survey period (°C) | Number of responses | ||
|---|---|---|---|---|---|
| Minimum | Maximum | Mean | |||
| Goulburn, Australia | Summer | 20.90 | 21.40 | 21.20 | 49 |
| Winter | 5.30 | 5.40 | 5.36 | 50 | |
| Karlsruhe, Germany | Summer | 7.90 | 34.90 | 20.60 | 331 |
| Varese, Italy | Autumn | 13.00 | 13.00 | 13.00 | 6 |
| Spring | 10.00 | 10.00 | 10.00 | 18 | |
| Summer | 25.00 | 25.00 | 25.00 | 38 | |
| Gothenburg, Sweden | Autumn | 0.70 | 11.70 | 6.29 | 66 |
| Spring | 3.90 | 11.70 | 7.9 | 29 | |
| Summer | 16.20 | 19.50 | 17.93 | 21 | |
| Winter | −4.40 | −0.50 | −2.93 | 54 | |
| London, UK | Autumn | 4.00 | 17.10 | 10.07 | 60 |
| Spring | 8.40 | 12.60 | 10.02 | 50 | |
| Summer | 17.50 | 18.40 | 17.94 | 87 | |
| Winter | 0.30 | 7.70 | 3.71 | 52 | |
| Total | 911 | ||||