
Abstract
The recent commitment towards a net-zero target by 2050 will require considerable improvement to the UK’s building stock. Accounting for over 10% of the services energy consumption of the United Kingdom, the education sector will play an important role. This study aims to improve the understanding of English primary and secondary schools, using national on-site survey data with several large-scale disaggregate data sources. Property Data Survey Programme (PDSP) data on 18,970 schools collected between 2012 and 2014, Display Energy Certificate (DEC) and school census data from the same period were linked and processed to form a unified schools dataset. Statistical analyses were undertaken on 10,392 schools, with a focus on energy performance, and the relationship to several building and system characteristics. The analyses may point to the possibility of assessing operational energy use of schools in a more disaggregate manner. New datasets with detailed and accurate disaggregate information on characteristics of buildings, such as those used in this study, provide opportunities to develop more robust models of the building stock. Such data would provide an opportunity to identify pathways for reducing carbon emissions effectively and provide lessons for other organisations seeking to achieve significant reductions for achieving climate change goals.
Introduction
In recent years, globally, there has been a marked shift in policies towards decarbonisation. 1 In the United Kingdom, the government recently committed to achieving net-zero carbon status by 2050. 2 Accounting for nearly 40% of the country’s carbon emissions, reducing building energy demand is a key priority for achieving this target.3,4
Understanding the current characteristics and performance of the stock is necessary for evaluating its operational efficiency and helping stakeholders set appropriate energy reduction targets (Hong et al. 2018). Primary and secondary schools form an important part of the services sector. In 2019, they accounted for approximately 2% of the total energy consumption of the United Kingdom by end use. 5 To improve the conditions of the school stock, the Department for Education (DfE) has introduced various policies including the Free Schools Building Programme and the Capital Improvement Fund Priority 6 School Buildings Programme. In order to allocate funds effectively, the department carried out the Property Data Survey Programme (PDSP), a large-scale, highly detailed survey of the condition of school buildings across England.
This study uses this national on-site survey in conjunction with other publicly available data sources to provide an improved understanding of the building characteristics and energy performance of English schools.
Characterising the building stock
In recent decades, there has been a noticeable increase in publicly available information on the energy performance of buildings in the United Kingdom, through initiatives such as the Open Data policy. 7 Data from the Display Energy Certificate (DEC) scheme by the Ministry of Housing, Communities and Local Governments (MHCLG) has allowed numerous studies to quantify the energy consumption of various public sector buildings and their characteristics. 8
Due to limitations in sample sizes and the range of variables available, however, the extent to which buildings could be examined has varied considerably, 9 for example, analysed DEC data to understand the latest patterns of energy use, and the relationship to building characteristics. The study found strong correlations between the two, including higher demand for electricity associated with increasing levels of mechanical systems. The study was, however, limited by the level of information provided within DECs and the sample of schools that had lodged a certificate.
Several studies took additional steps to enrich the DEC data to gain a deeper insight on how building characteristics such as the built form relate to performance. A study by Godoy-Shimizu et al. 10 analysed and characterised primary and secondary schools in England. Owing to a large sample size, the study was able to make inferences about patterns of energy use of primary, secondary and academy schools at a national level. The study also considered a limited range of building characteristics such as ventilation types. In a follow-up study, Armitage et al. 11 analysed the energy performance of approximately 2600 public sector offices. By matching various publicly available datasets, the study extended the scope by including previously unexplored characteristics such as building age and typologies. Due to limitations in the publicly available data, however, the study was only able to analyse fewer than 250 buildings in detail.
Some studies have taken this approach further by establishing methods for collecting and exploring data on a wider range of building characteristics. Hawkins et al. 12 explored data on geometry and glazing areas of higher education buildings in addition to the variables from DECs to understand the relationship between energy use and contextual factors. Hong et al. 13 applied a similar approach for understanding the characteristics of English schools. Due to difficulties in acquiring detailed information on building characteristics, however, both studies showed a noticeable reduction in sample sizes, limiting the scope for generalisation.
Additionally, several national surveys have been undertaken. The Building Energy Efficiency Survey (BEES) is a notable national survey which aimed to capture the latest patterns of energy use of non-domestic buildings in England and Wales in 2014. 14 Within the project, however, data collection was limited to a small number of telephone and on-site surveys. Elsewhere, the Commercial Buildings Energy Consumption Survey (CBECS) is a national survey in the United States. Like BEES, a sampling method is used to collect information on buildings that are deemed representative of the building stock. 15 These surveys provide valuable data to make inferences about energy use and characteristics of the building stock, and are good examples of how building stock models can be developed from fairly small representative samples. How accurately these samples might represent the diversity of a building type such as the school sector, however, has yet to be explored.
The review of previous studies shows that there is a gap in knowledge of the characteristics and energy performance of the English school stock. The existing evidence on school characteristics are limited to inferences made from relatively small (but theoretically representative) samples, and a limited range of variables. There are also gaps in knowledge about features such as swimming pools or system-level information that could potentially influence the demand for energy in schools. This study therefore aims to review and update the understanding of primary and secondary schools in England, based on data from a national on-site survey carried out by professional surveyors.
Methodology
This study involved creating and analysing a unified national database of schools using data from the following three sources:
Edubase was used as a ‘spine’ for the combined schools database. The DEC and PDSP datasets were separately processed and validated, before being matched to it. Finally, checks were undertaken to identify potential inconsistencies or conflicts between the matched data. The process is summarised in Figure 1, and detailed below. Data processing and matching overview.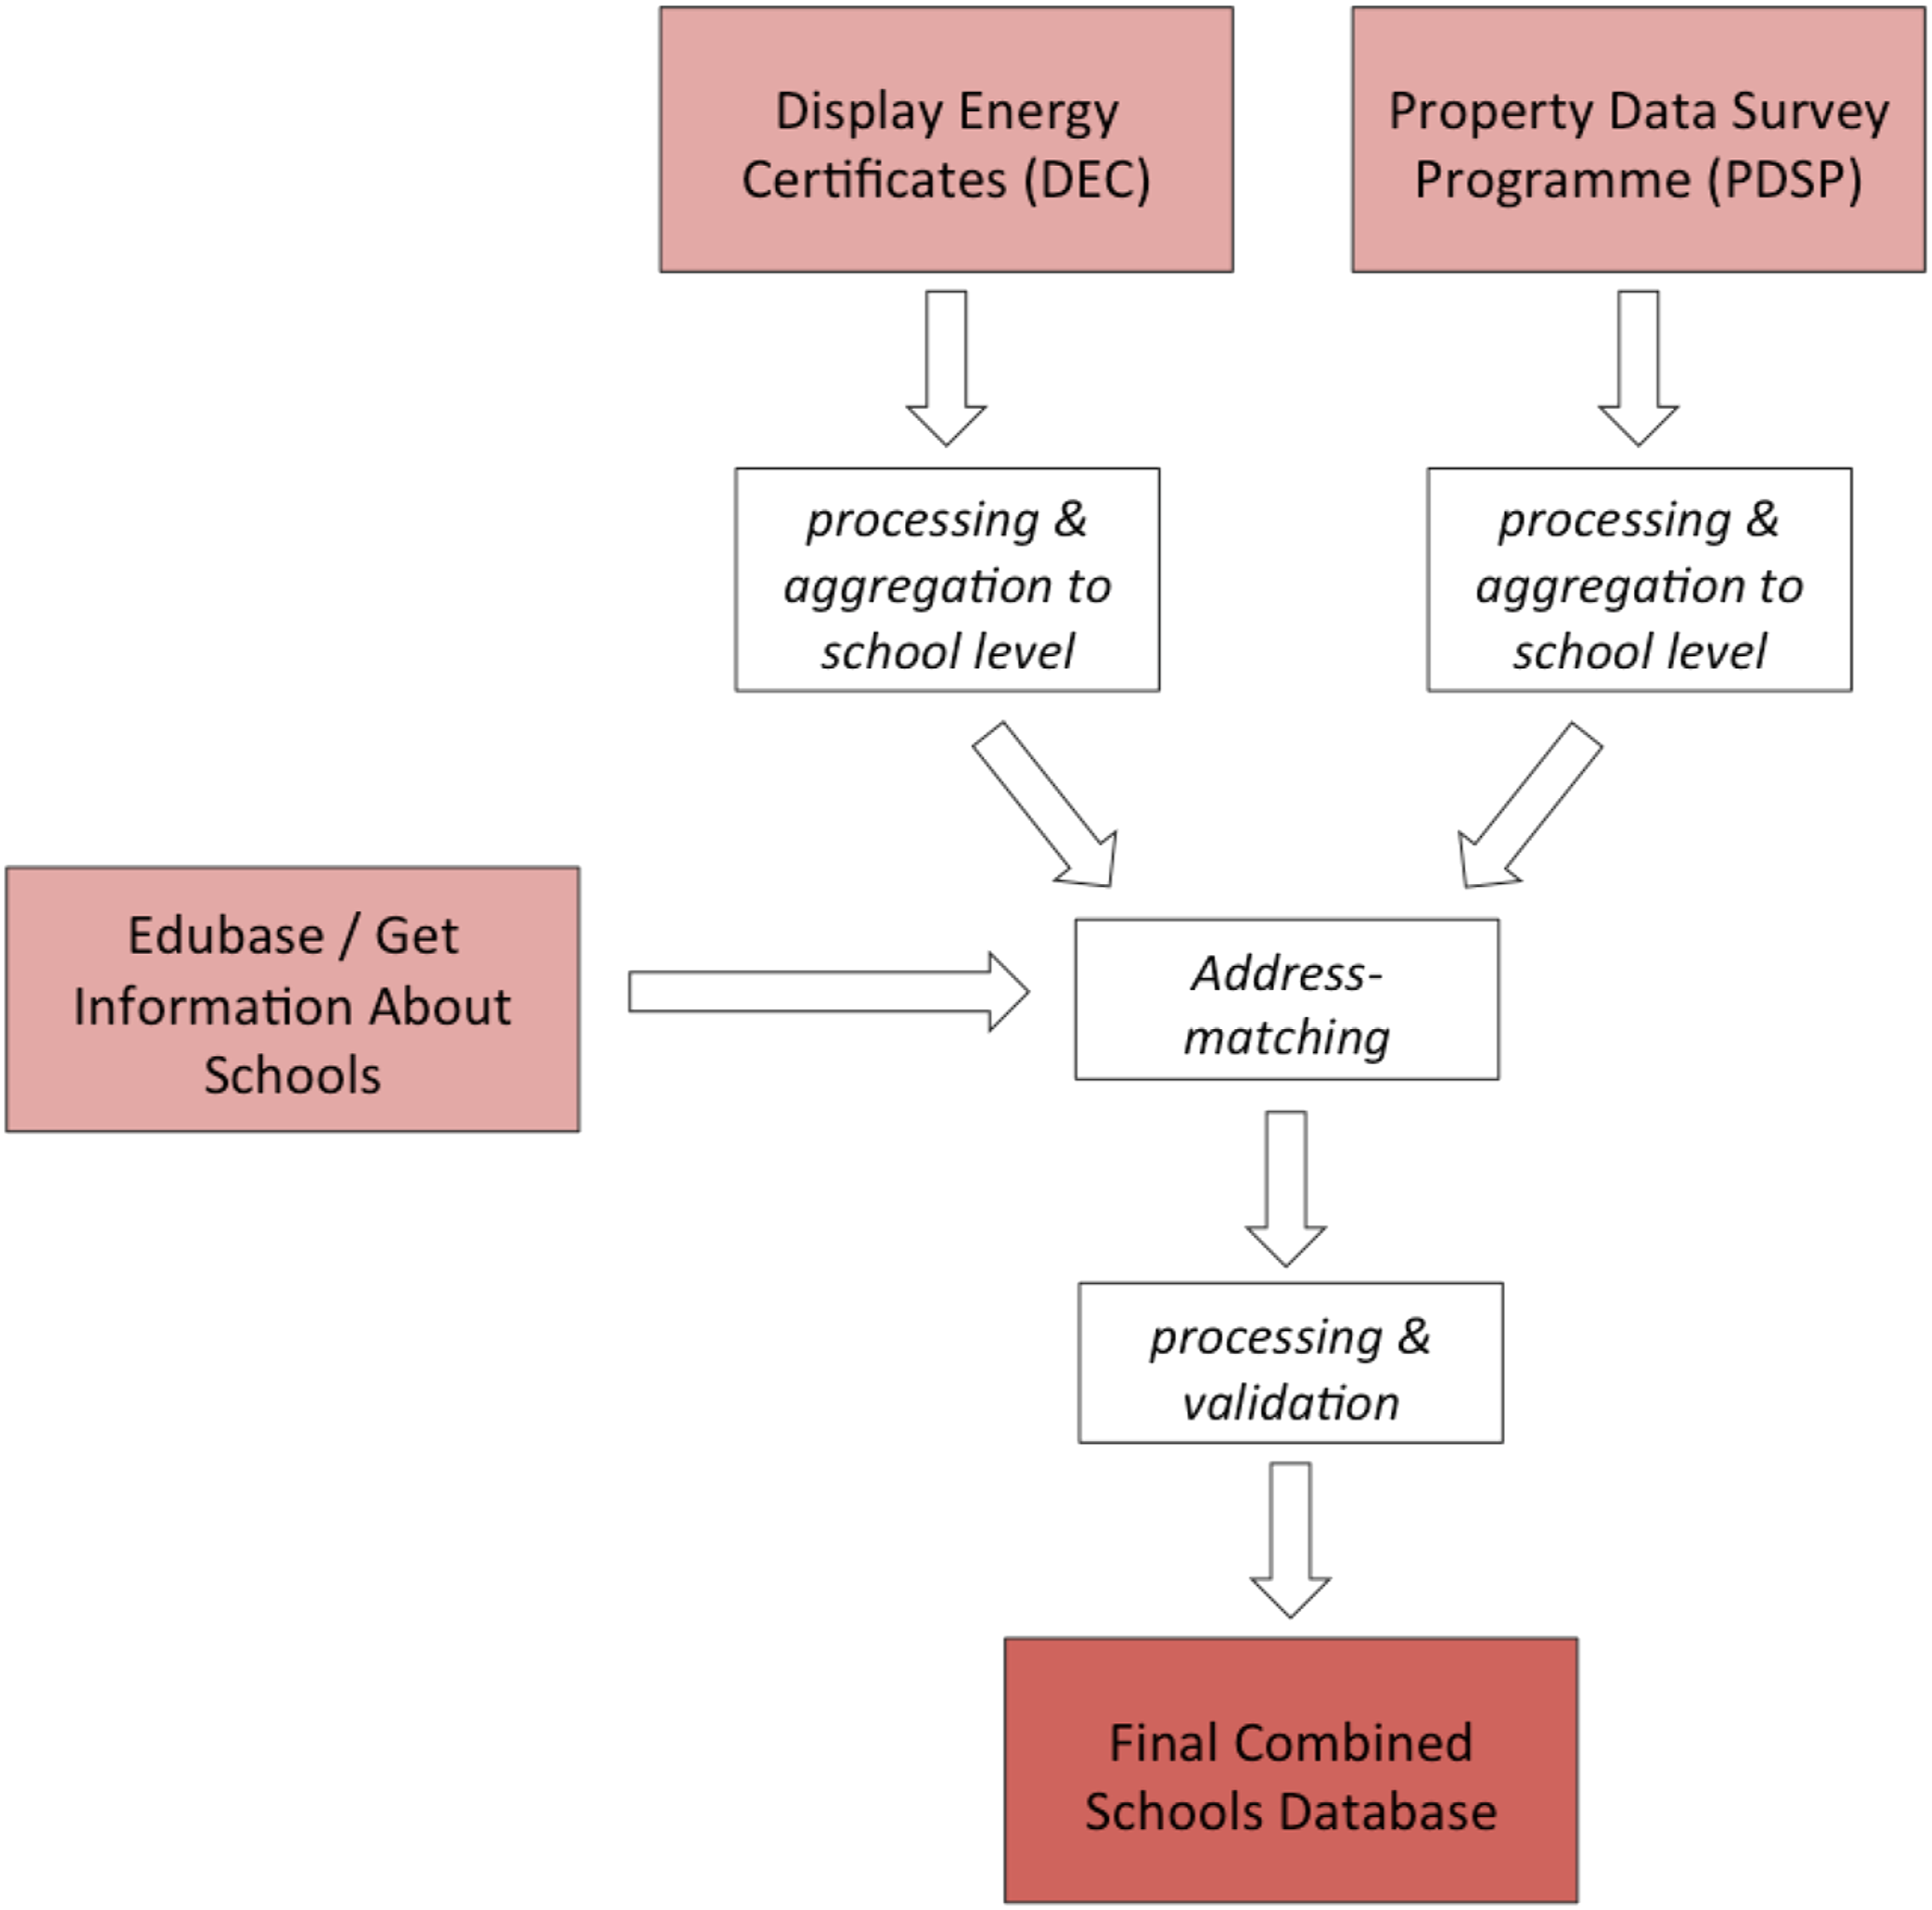
Processing edubase
As a register intended primarily for educational professionals and parents/guardians, Edubase includes numerous variables outside the focus of the present study (e.g. information on Ofsted inspections). For this work, the following Edubase variables were collected and processed: Unique Reference Number (URN), name and address: These were used for data processing, and matching to the other datasets. The URN was used as the school identifier. Types: This includes the presence of boarding, phase of education (e.g. primary or secondary) and establishment (e.g. local authority run or academy). The latter two variables have been shown to correlate with differences in energy use in past studies.10,13 Capacity: School capacity, defined as the number of pupils each school can accommodate, was used to assess the energy consumption per pupil. It should be noted that the actual number of pupils for a given school in any given year will not necessarily equal the capacity. However, using census data from Compare School Performance for 2012–2014 (the years of the PDSP survey), the median number of pupils was over 90% of capacity for primary and secondary schools.
19
Processing PDSP
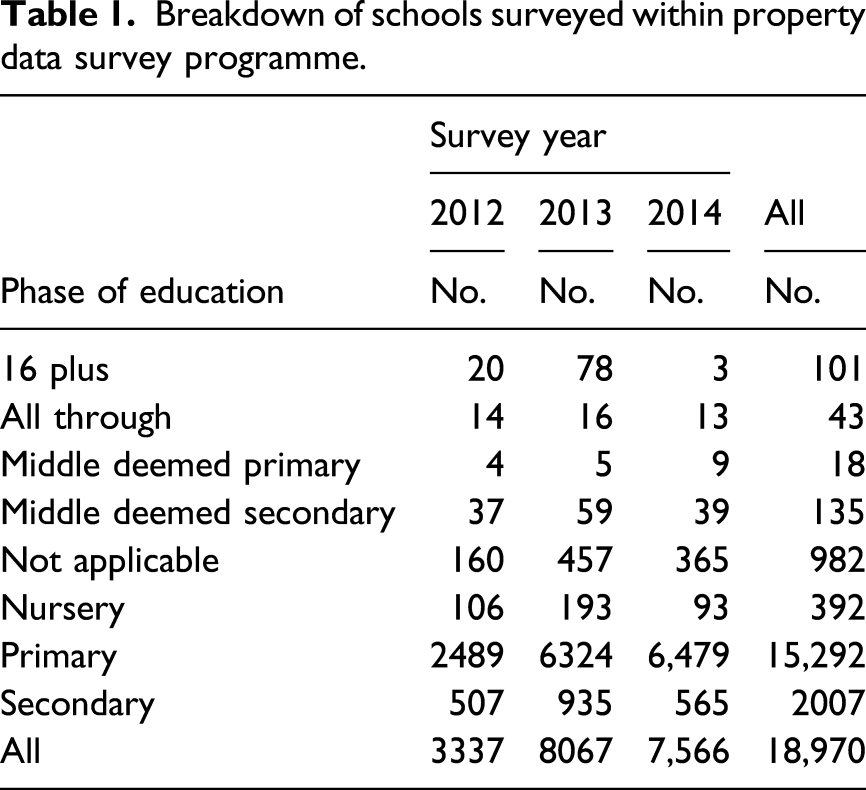
Breakdown of schools surveyed within property data survey programme.
Summary of variables in Property Data Survey Programme used in the present study.
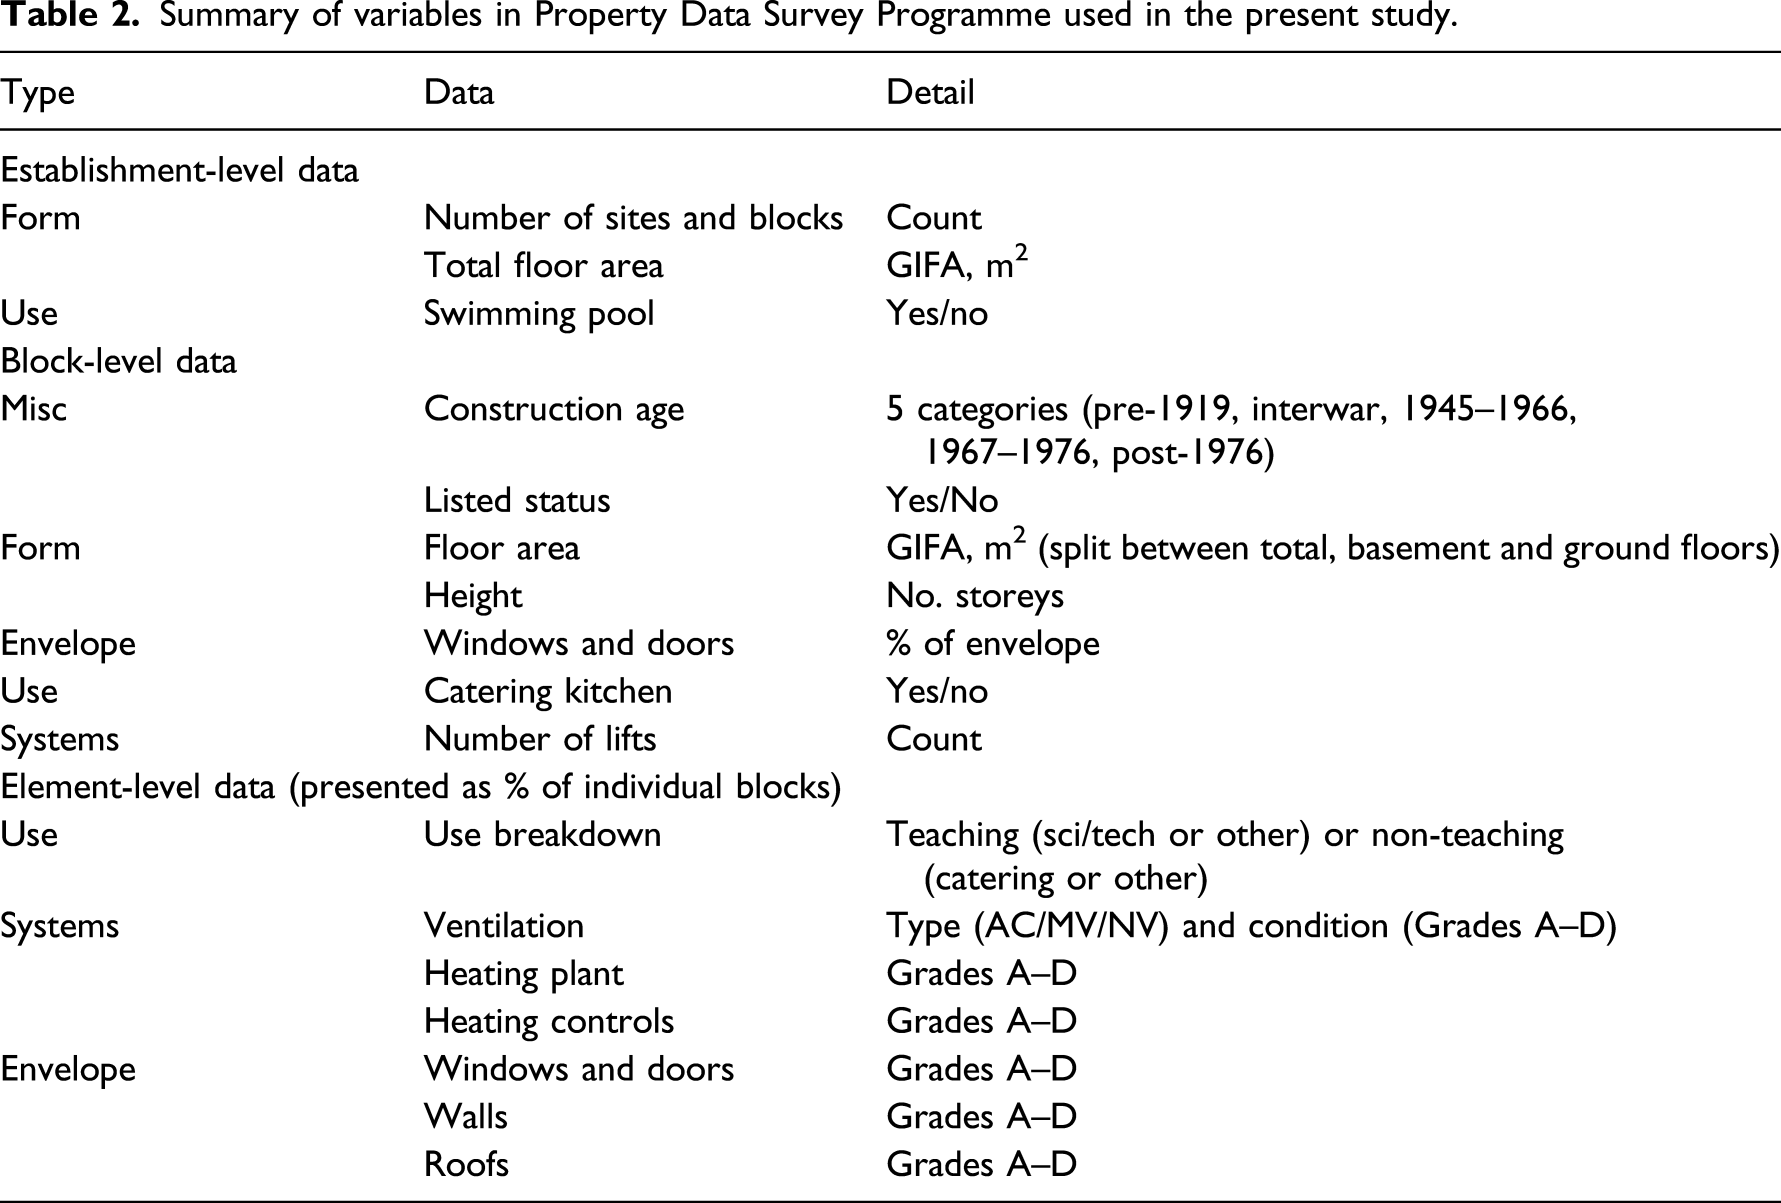
It should be noted that the definition of a ‘block’ within PDSP is not straight forward; for example, a block could represent a stand-alone, physically isolated structure or a portion of a building. 21 Consequently, these data were processed and aggregated to a school level. Variables originally collected at a more disaggregate scale were aggregated based on floor areas or proportions of floor areas as appropriate. Checks were carried out for each data type to ensure that block- and school-level totals added to 100%. Where this was not the case, an ‘unknown’ flag was added to account for missing information. For example, if the sum of all ventilation types for a school block was 75%, then a 25% ‘unknown’ ventilation type was added. Finally, the condition grade data, available for the building systems and envelope elements were each aggregated, on an area basis, to produce an overall A–D grade for each school. These grades were assigned by the PDSP assessors, and correspond with the integrity or operation of each element being in ‘good’, ‘satisfactory’, ‘poor’ and ‘bad’ condition. 22
Following the steps above, this PDSP dataset was matched to Edubase. Both Edubase and PDSP include the schools Unique Reference Number (URN) for each school. Therefore, these datasets could be matched directly.
Processing DECs
The downloaded DEC data comprised 354,808 certificates lodged between January 2010 and September 2020 (DECs lodged in 2008 or 2009 were excluded from the present analysis). From this, records that belong to ‘Schools and Seasonal Public Buildings’ were first extracted. It should be noted that, depending on a school’s characteristics, DECs may be required to be produced for the entire school or for each building. Additionally, new certificates are lodged annually, and the DEC data cover England and Wales. For these reasons, the number of school records in the DEC database far exceeds the total number of schools in England noted previously.
The raw data were processed using methods developed and used by Hong et al.
9
to exclude records that could introduce uncertainties to the analysis. This involved identifying and excluding records that show DECs lodged in 2008 or 2009, Unusually high (greater than 1000) or low (less than 5) operational ratings, Default operational ratings (200 or 9999), Floor area <50 m,2 Buildings with zero electricity use, Non-electrically heated buildings with zero fossil-thermal energy use and A composite methodology (representing DECs produced for buildings with mixed uses).
While DECs are required to be lodged annually, the database includes several instances where multiple DECs have been lodged for a building in a single year. This includes near-identical DECs have lodged on a single day, from spot-checks often representing corrections of individual errors, as well as those lodged weeks or months apart. For the former case, the most recent DEC lodged for a building each day was used. For the latter, duplicate records, updated within 6 months were excluded. Finally, pro-rata’d records based on a site-level measurement were also excluded.
Since a single school might have multiple DECs corresponding with different buildings and/or years, a final aggregation step was undertaken to calculate the overall DEC data for each school and year. From the DEC data alone, it is not always possible to identify records associated with the same school. Therefore, each record was first address-matched to Edubase, after which the DEC data aggregation was performed.
The address-matching was carried out using a semi-automated approach. A script was written in SAS 9.4 1 and PostgreSQL 9.5 2 to identify likely matching pairs of addresses. This used postcode data to identify schools in similar locations between the data sources and Levenshtein ratios to calculate how similar the address fields were. Allowances were made for specific phrases (e.g. ‘Church of England’ being sometimes listed as ‘CoE’ or ‘C of E’), and manual inspection was used to verify a sample of the address-matching results, and fill in any gaps where possible.
Following this process, where schools had multiple DECs for a given year, aggregate values were calculated using area-weighting. Lastly, weather-correction was applied to the fossil-thermal energy consumption figures to account for different locations and time periods. This involves scaling the proportion of energy use associated with space heating, based on the local climate. For this study, the approach used in the DEC methodology was implemented. 23 Instead of 55%, however, 80% of fossil-thermal energy use adjusted as Hong et al. 13
The nature of the data means that, for any given year, the matched DECs for a school may not cover all of the sites. This could reflect gaps or inconsistencies in the underlying raw data, or problems with the address-matching process. To allow for this, energy use intensities (EUI), expressed in kWh/m2, for each school have been calculated using the total floor areas from the DECs, rather than from PDSP. Similarly, energy use per pupil (kWh/pupil) has been calculated by scaling the Edubase school capacity by the DEC floor area to PDSP floor area ratio.
Creating a unified dataset
After processing the separate Edubase, PDSP and DEC files, and address-matching, final steps were carried out to ensure consistency in the information available for each school, and limit the data to the scope of the study. Reflecting the two broad aims of the present article – to quantify the characteristics of the schools stock, and its current energy performance – this was carried out in two stages, producing two samples: An overall combined schools dataset (Overall combined schools dataset) and A combined schools-energy dataset (Combined schools-energy data).
The steps to produce each are described below.
Overall combined schools dataset
This dataset represents the schools for which reliable buildings data were available. For this, schools with any of the following attributes were excluded: Without matched PDSP data, Missing data on phase, boarding or establishment type, Missing capacity data and More than 33% of any PDSP detailed data are unknown or listed as ‘temporary premises’, by floor area (e.g. the heating plant condition grade should be provided for at least two-thirds of the school area).
Additionally, schools with the following attributes were excluded, to focus the schools assessed: Not listed as being primary or secondary (around 8.8% of PDSP are for schools across a number of different other phases) and Listed as having boarding facilities in PDSP, since boarding facilities in schools could have different DEC benchmarks applied (less than 1% of schools in PDSP have boarding facilities listed in Edubase).
In total, the Combined Schools data included 14,670 primary schools, and 1902 secondary schools in England (corresponding with 77.7% and 49.9% of each type open when PDSP was undertaken 3 ).
Combined schools-energy data
This dataset represents the schools for which reliable buildings and energy data were available. In addition to the criteria used for the overall combined schools dataset (3.4.1), schools without matched DECs were also removed. Schools where gas was not listed as the main heating fuel were also excluded (around 12% and 14% of primary and secondary schools with DECs, respectively).
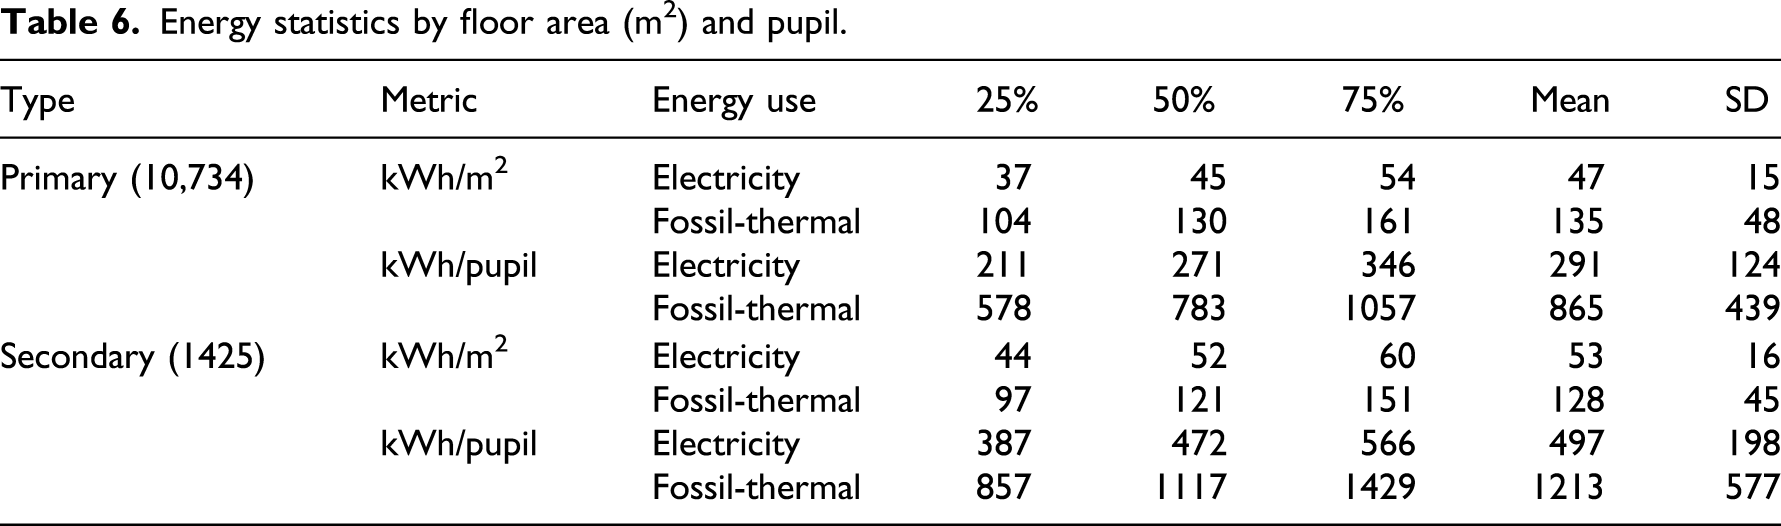
In total, the Schools-Energy dataset included 10,734 primary schools and 1425 secondary schools.
The difference in sample sizes between the two datasets largely corresponds with the DEC data: DECs were matched to 85.3% and 89.2% of primary and secondary within PDSP, respectively. It should be noted that the gap will reflect not just schools without lodged DECs, but also the address-matching process. This can be particularly difficult for non-domestic buildings, due to the complexity and inconsistency of address strings relative to domestic properties, and 9.9% of DECs where school was the main benchmark could not be matched to an Edubase address.
All analyses presented in the remainder of this article refer to the processed databases (i.e. ‘combined schools’ and ‘schools-energy’).
Methods of analysis
Combined datasets are statistically analysed to improve the understanding of the characteristics and energy performance of English schools. Analyses are carried out in three broad parts.
Firstly, the combined schools database is analysed to provide a description of the overall school stock of England. This focusses on understanding the distribution of key variables and considers the differences between primary and secondary schools. Comparison is also made between the ‘combined schools’ and ‘schools-energy’ databases, in order to understand how representative the school-energy dataset is of the comprehensive PDSP dataset.
Next, variations in the energy performance of primary and secondary schools are assessed. These represent the overall energy performance of the school stock, and are presented as cumulative distribution curves calculated on the basis of kWh/m2 as well as kWh/pupil.
Finally, the data are explored to examine how energy use varies with a number of key variables. The analyses are mainly carried out using descriptive statistics to assess the correlation between key element-level characteristics and energy use. Where appropriate, statistical tests have been undertaken to see the likelihood that energy profiles of different groups come from separate populations. The energy data are non-normal, so Mann–Whitney–Wilcoxon tests (MWW) have been used when checking pairs of categories (e.g. comparing primary and secondary school performance). When considering larger numbers of categories, such as building age, the Kruskal–Wallis test (KW) has been used followed, if appropriate, by Dunn’s test with a Bonferroni adjustment to the p-value.
Results and discussions
Results are presented in three parts as per Methods of analysis.
Characterisation of the school stock
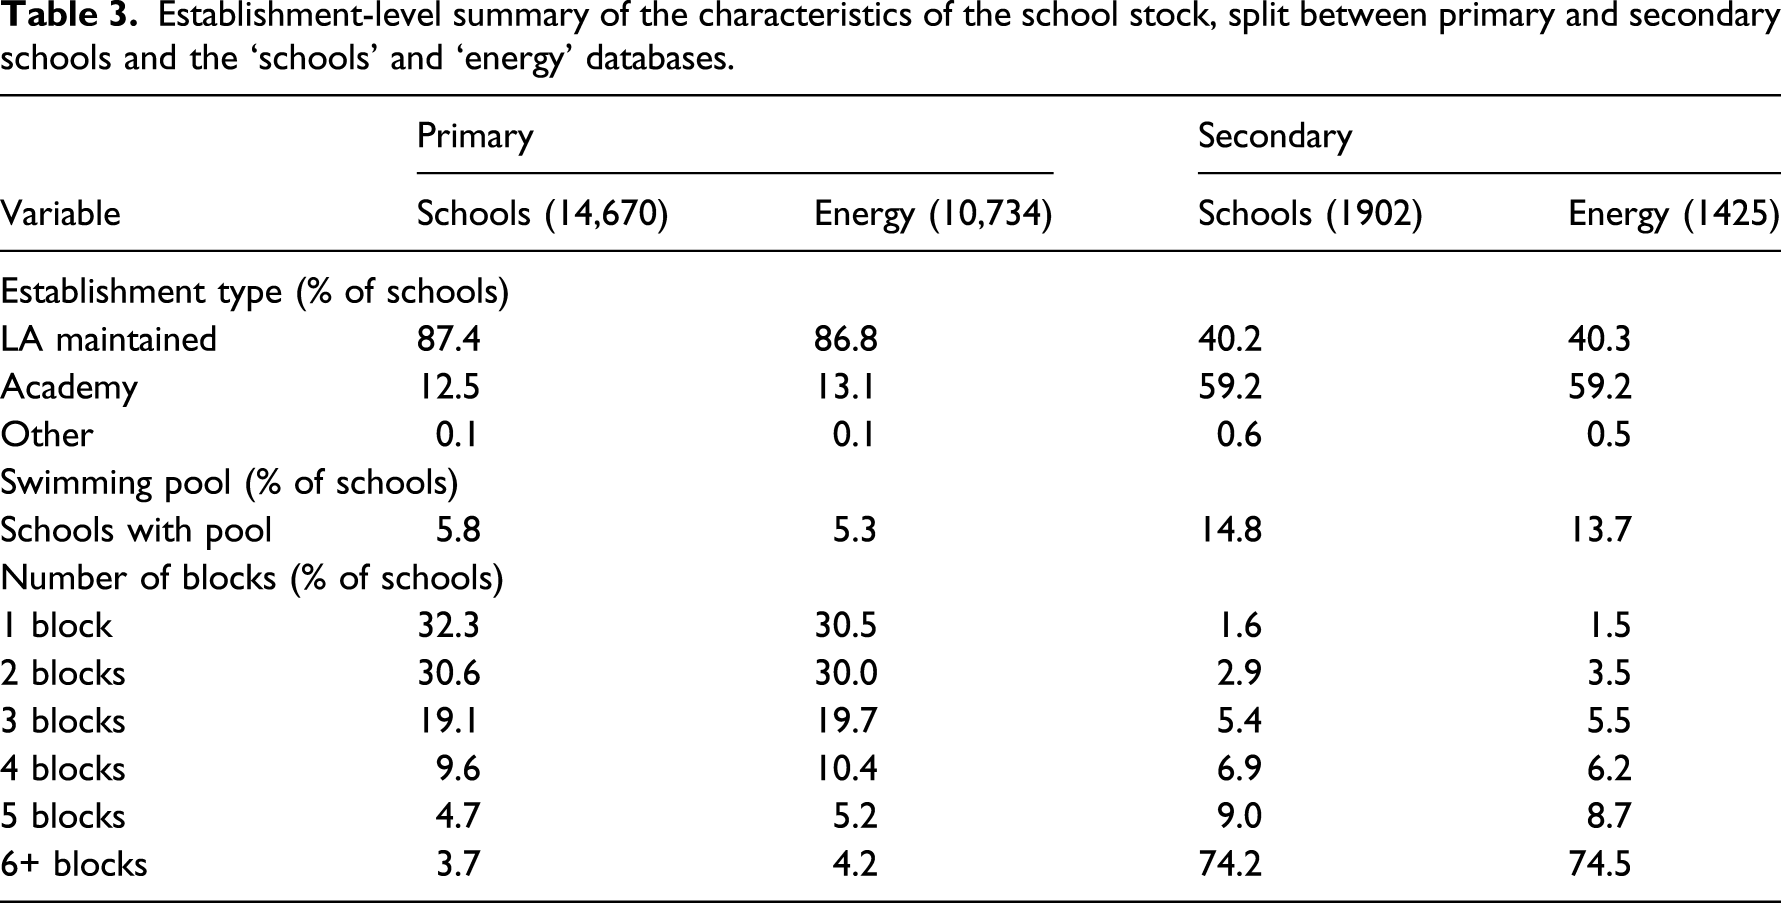
Establishment-level summary of the characteristics of the school stock, split between primary and secondary schools and the ‘schools’ and ‘energy’ databases.
The results give a clear picture of the typical characteristics of the school stock of England, and highlight the differences between primary and secondary buildings.
In Table 3, it can be seen that primary schools included in this study are predominantly maintained by local authorities. The secondary schools in the dataset on the other hand are mainly academies. Analyses of the establishment-level data revealed the extent to which schools have swimming pools. A greater proportion (15%) of secondary schools were found to have pools than primary schools (6%).
Secondary schools were found to be physically more complex, with almost three-quarters having six or more blocks, compared to primary schools where more than 60% were found to have fewer than three blocks. This is likely due to the fact that many primary schools are single-building based while secondary schools are greater in size, with more extensions from different construction eras. It should be reiterated, however, that a higher number of blocks do not necessarily mean more buildings, due to the survey process (Processing PDECs).
Block-level summary of the characteristics of the school stock, split between primary and secondary schools, and the ‘schools’ and ‘energy’ databases.
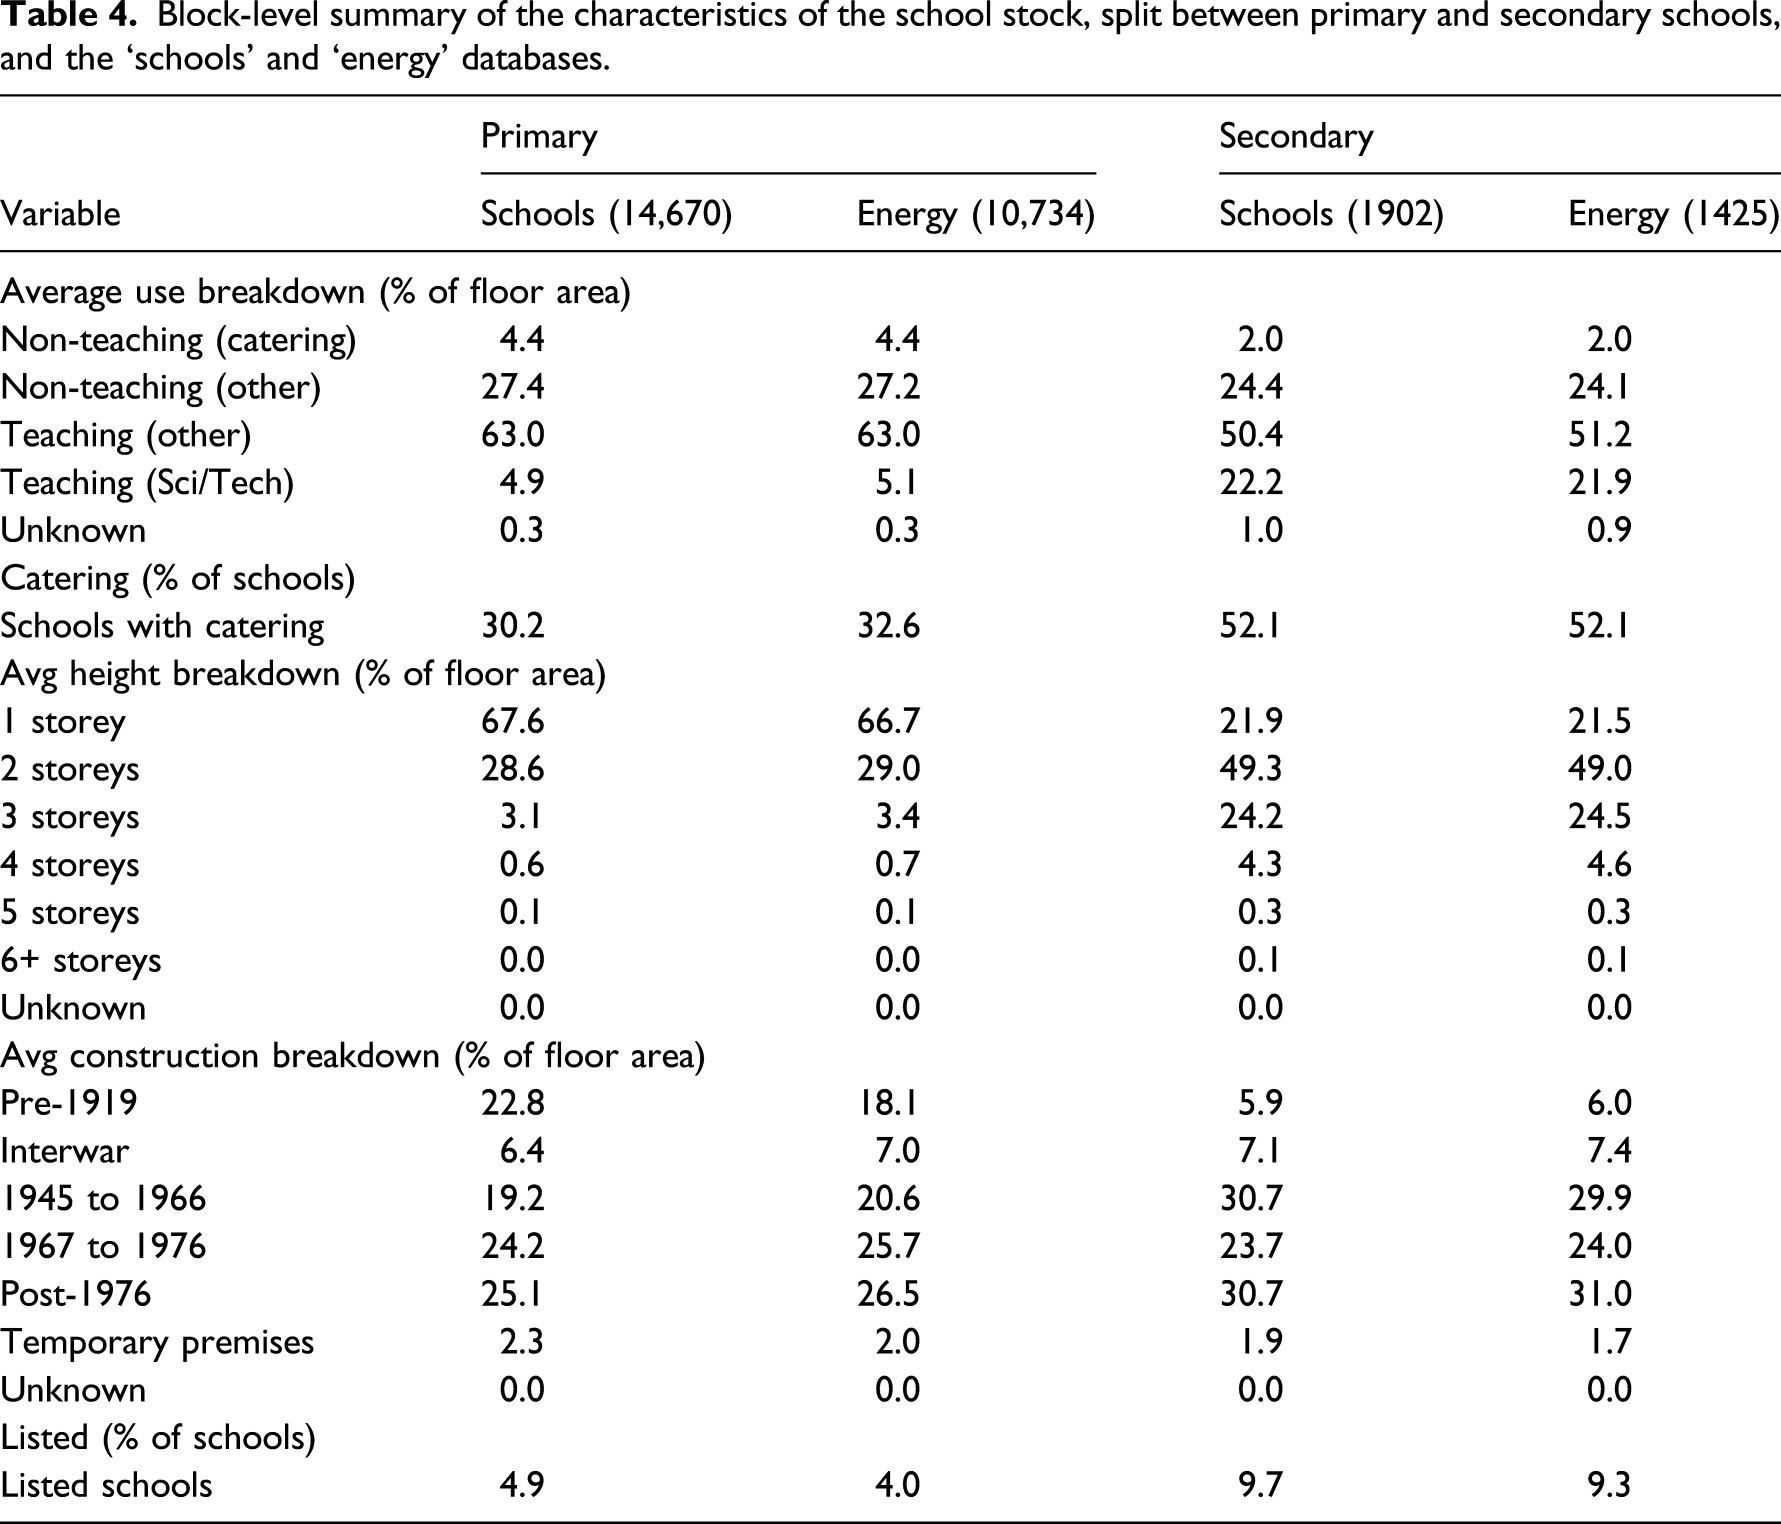
Elemental-level summary of the characteristics of the school stock, split between primary and secondary schools, and the ‘schools’ and ‘energy’ databases.
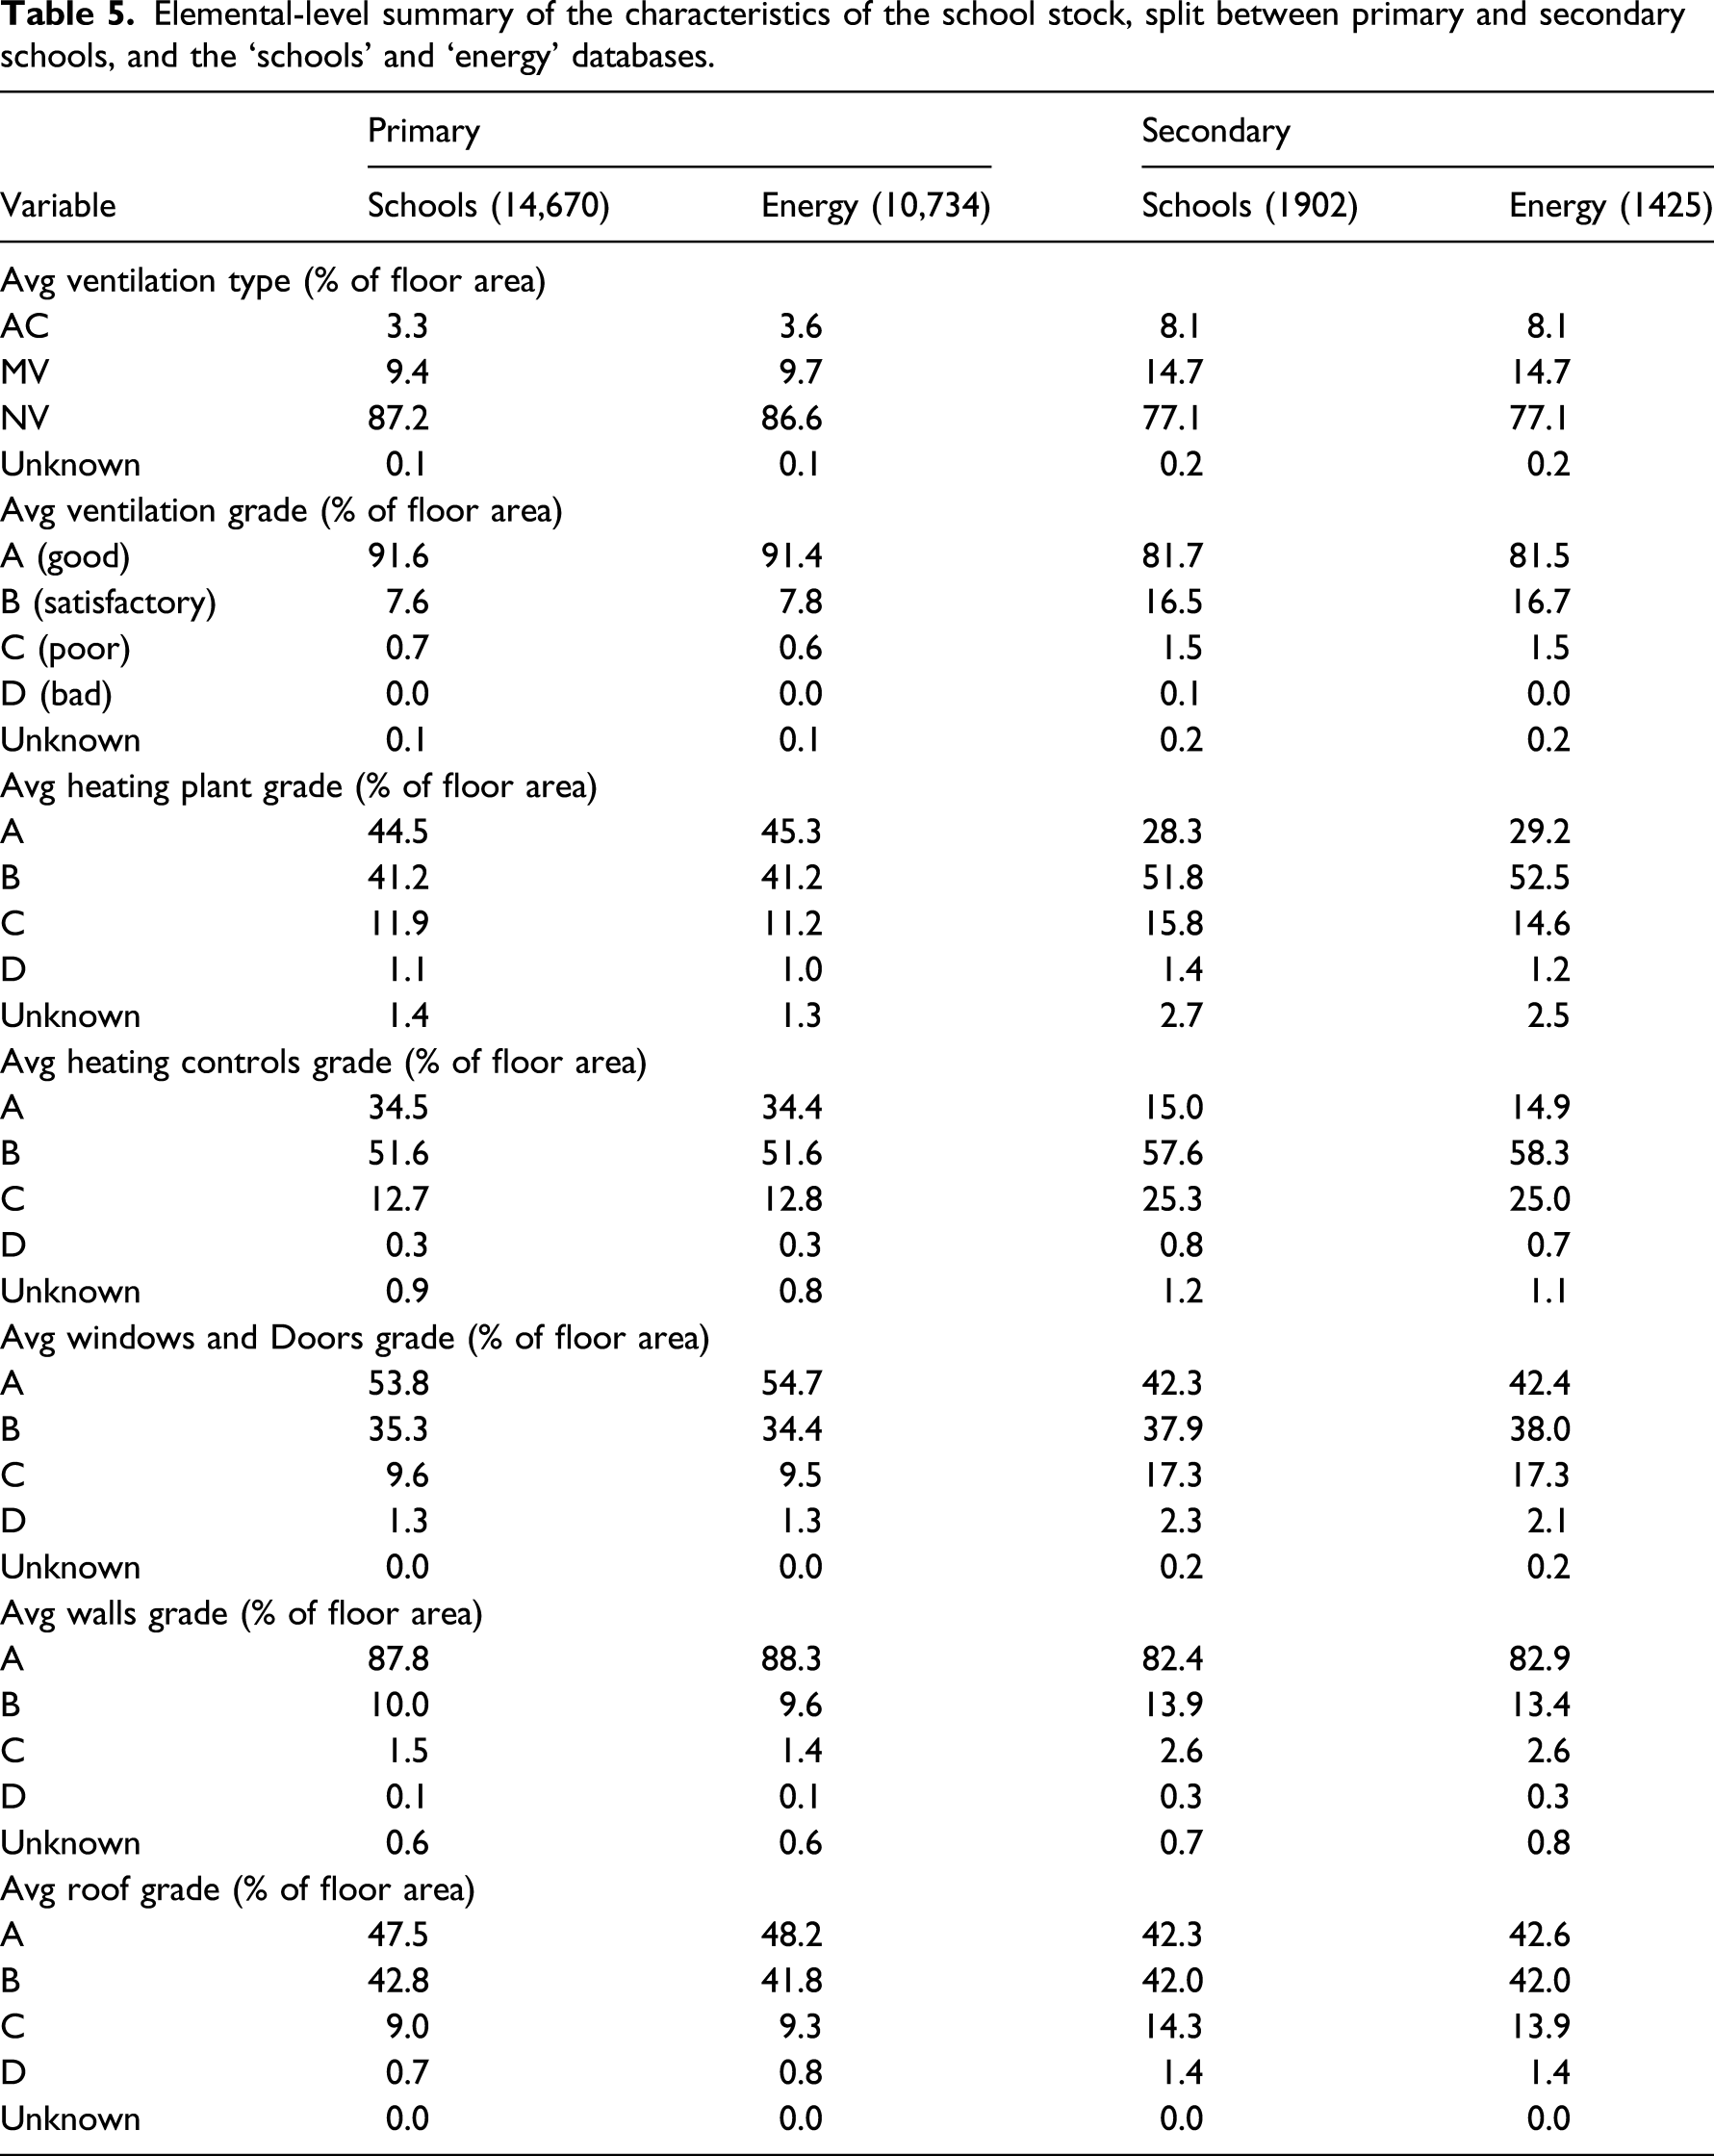
As shown in Table 5 the data suggest that secondary schools are likely to have more energy-consuming equipment. Compared with primary schools, secondary schools have greater use of mechanical ventilation and air conditioning (in total accounting for 23% of secondary school floor area, compared with 13% of primary school floor area).
The significance of the factors analysed in Tables 3–5 is also noted in the Building Energy Efficiency Surveys (BEES), which noted that ‘As the age of the students increases energy intensive activities such as computer rooms, … and swimming pools became more common’. 14
Figure 2 shows distribution of school sizes in terms of floor area and school capacity. It also includes equivalent figures for the establishments in the schools-energy database. As the most uniform and consistent dataset, floor areas are taken from PDSP for all buildings in schools. Distribution of school sizes in terms of (a) floor area and (b) pupil capacity, between primary and secondary schools, and the ‘schools’ and ‘energy’ samples.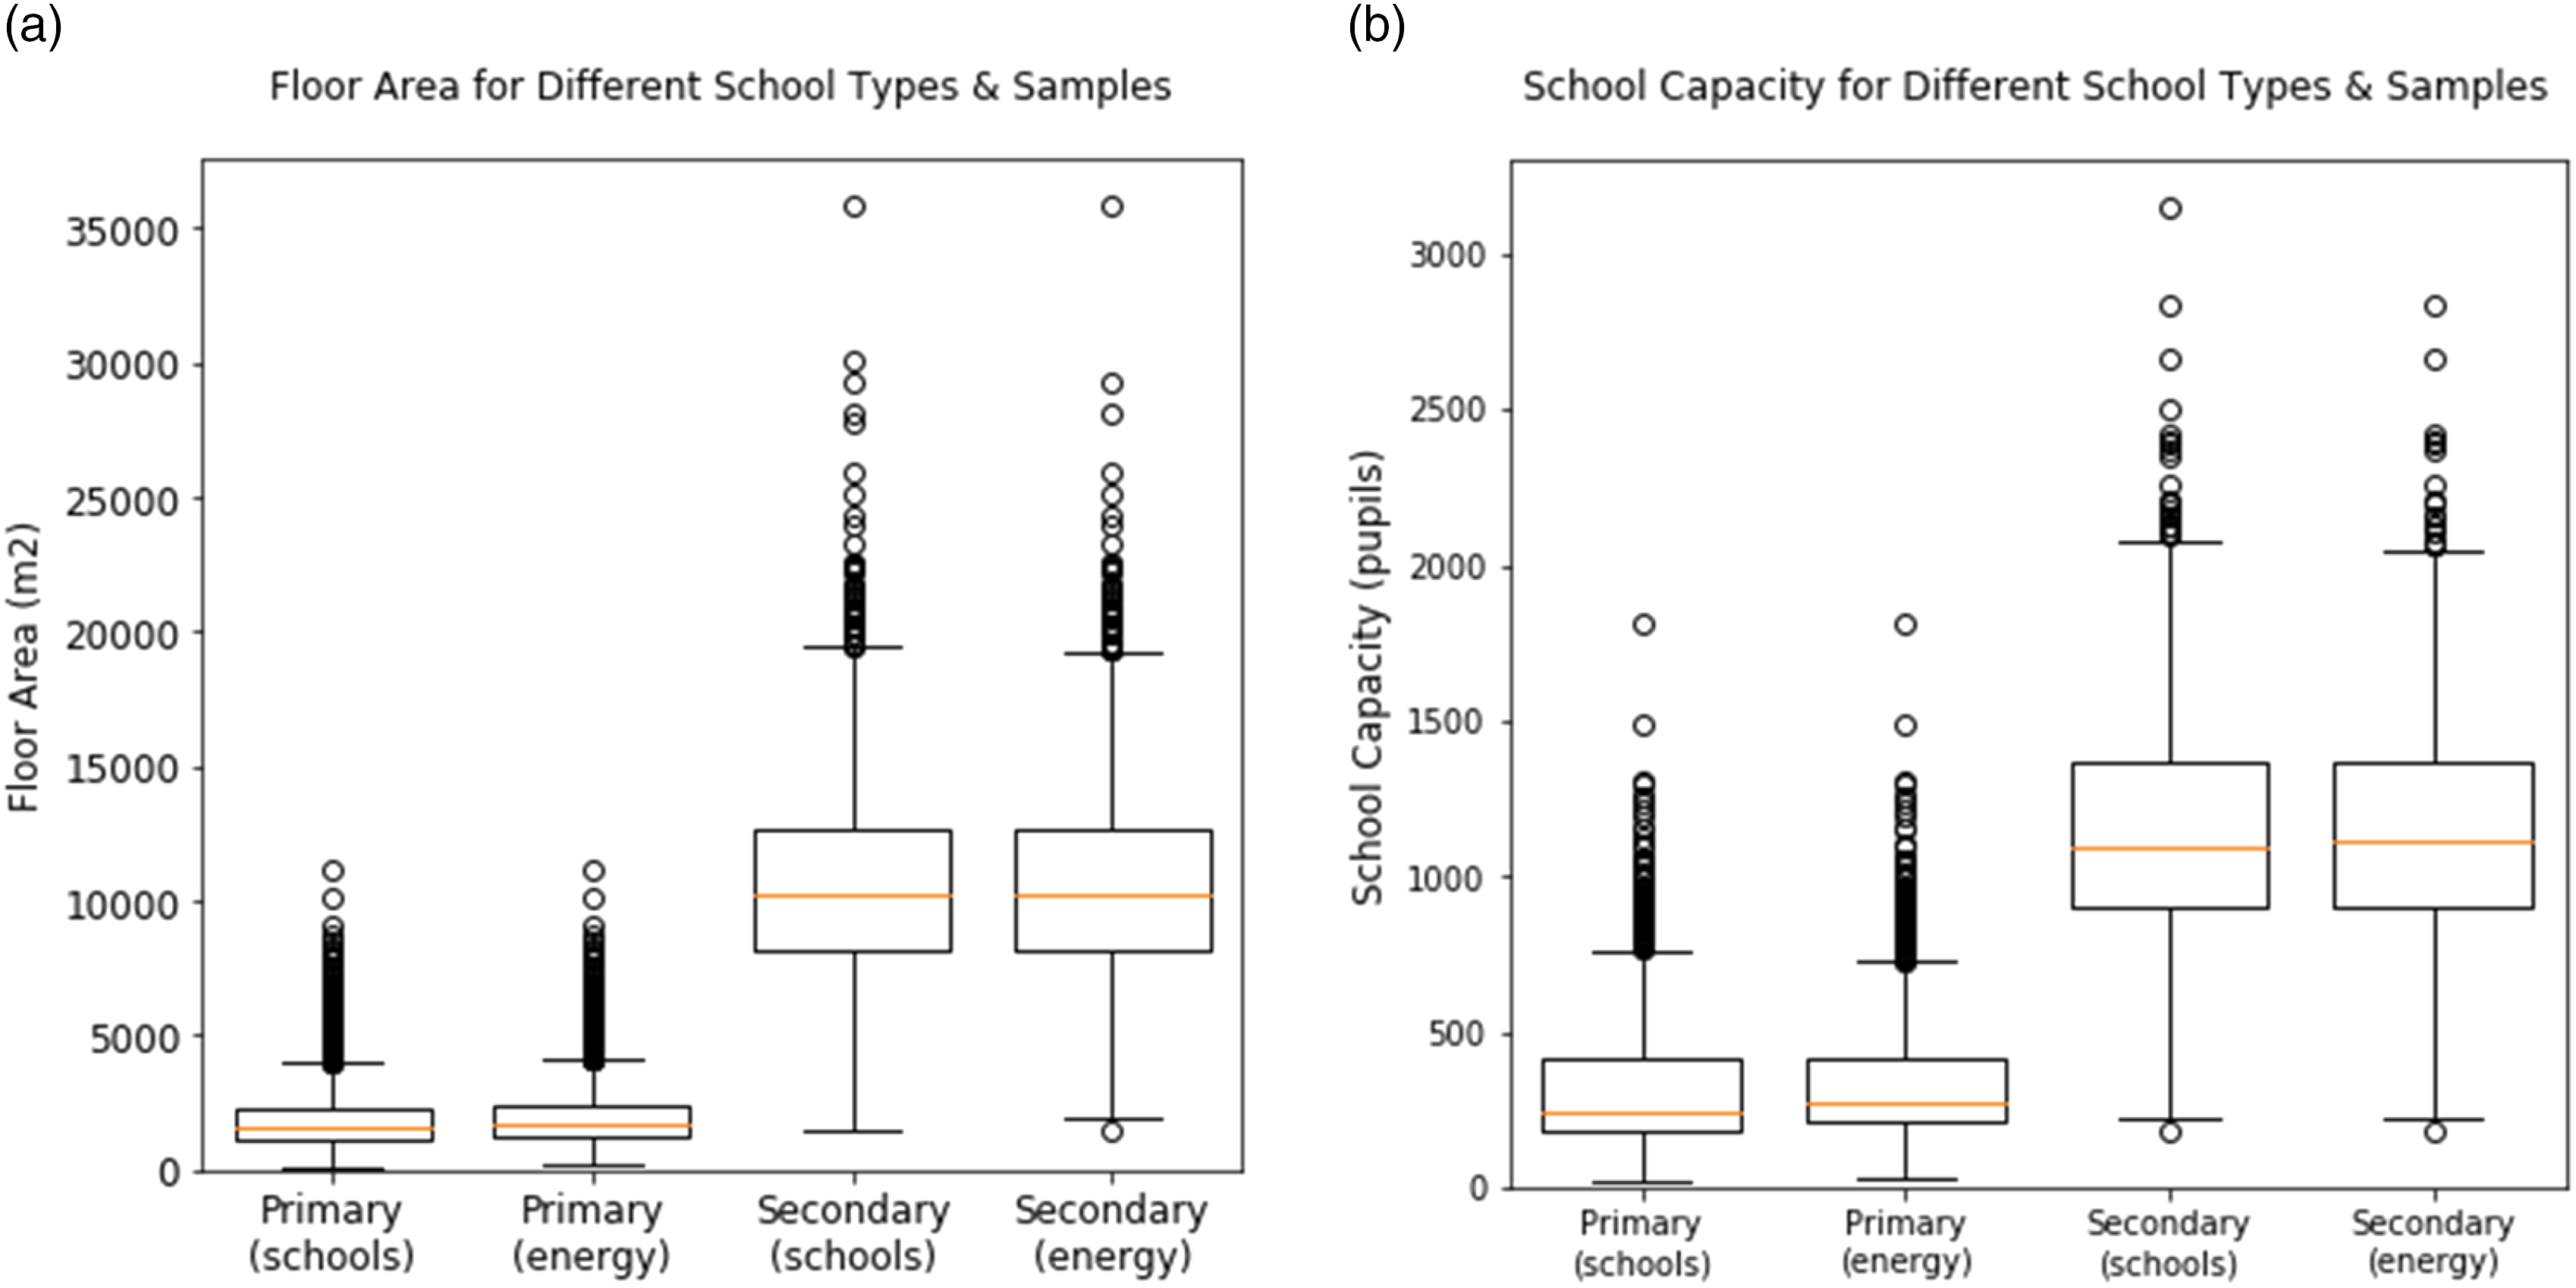
Figure 2 reveals that secondary schools are considerably larger than primary, both in terms of physical size (mean floor area is 6.1 × larger) and pupil numbers (mean capacity is 4.0 × larger). The median size of primary and secondary schools are around 1500 m2 and 10,000 m2, respectively. These figures are somewhat different from past studies. Processing the DEC data alone, Hong et al. 9 estimated primary and secondary schools to be 1000–3,000 m2, and 3000–10,000 m2, respectively. The BEES project meanwhile estimated the typical areas to be 1,220 m2 and 2,000 m2, respectively. 14 The differences may reflect practical methodological factors: Without a single schools-focussed dataset like PDSP, the former study required aggregation to sites based solely on the DEC addresses, while the latter relied on surveys of smaller numbers of schools. Ultimately, comparison with past results highlights the difficulty of estimating parameters of the non-domestic building stock, even for a relatively uniform type such as schools. In contrast, the variety of uses and built forms in other non-domestic sectors such as higher education might be far larger, potentially amplifying this issue. 25
Comparison between the ‘schools’ and ‘energy’ data samples, reveals very similar characteristics between the two, with only minor differences in the overall statistics across the different variables in Table 3–5, for both primary and secondary schools. It should be noted that, for primary schools, the ‘energy’ sample schools are physically bigger than those in the overall ‘schools’ sample (mean and median floor areas are 11.1% and 11.9% larger, respectively). This is also reflected in school capacities (11.4% and 14.6% larger, respectively). Testing within the ‘schools’ sample, between those in the ‘energy’ sub-sample and those not, suggests that these differences are significant for primary schools (MWW, p < 0.01 for floor area and capacity), but not significant for secondary schools (MWW, p > 0.05 for both variables). Pupil densities are also found to be statistically significantly different for primary schools only (MWW, p < 0.01), although the absolute differences are very small: Mean and median pupil densities are within 2% for both primary and secondary schools.
Overall school performance
To understand the current performance of the school stock, Figure 3 presents cumulative distribution curves of energy use intensities for the ‘schools-energy’ sample (Combined schools-energy data). Reflecting the coverage of lodged DECs, the timeframe of the available energy data was not uniform across the school stock. Where available, the energy data presented below are from the most recent year during PDSP (2012–2014). However, where energy data from that period were unavailable, the available year closest to PDSP was used. In the analysis that follows, 85.9% and 88.8% of primary and secondary schools include energy data from 2012 to 2014. Fossil-thermal (gas, since the analysis only included schools with main heating fuel as gas) and electricity uses are shown with red and green lines, respectively, while primary and secondary schools are differentiated by solid and dashed lines. Annual electricity (Elec) and fossil-thermal heating intensity profiles for primary and secondary schools in England (kWh/m2).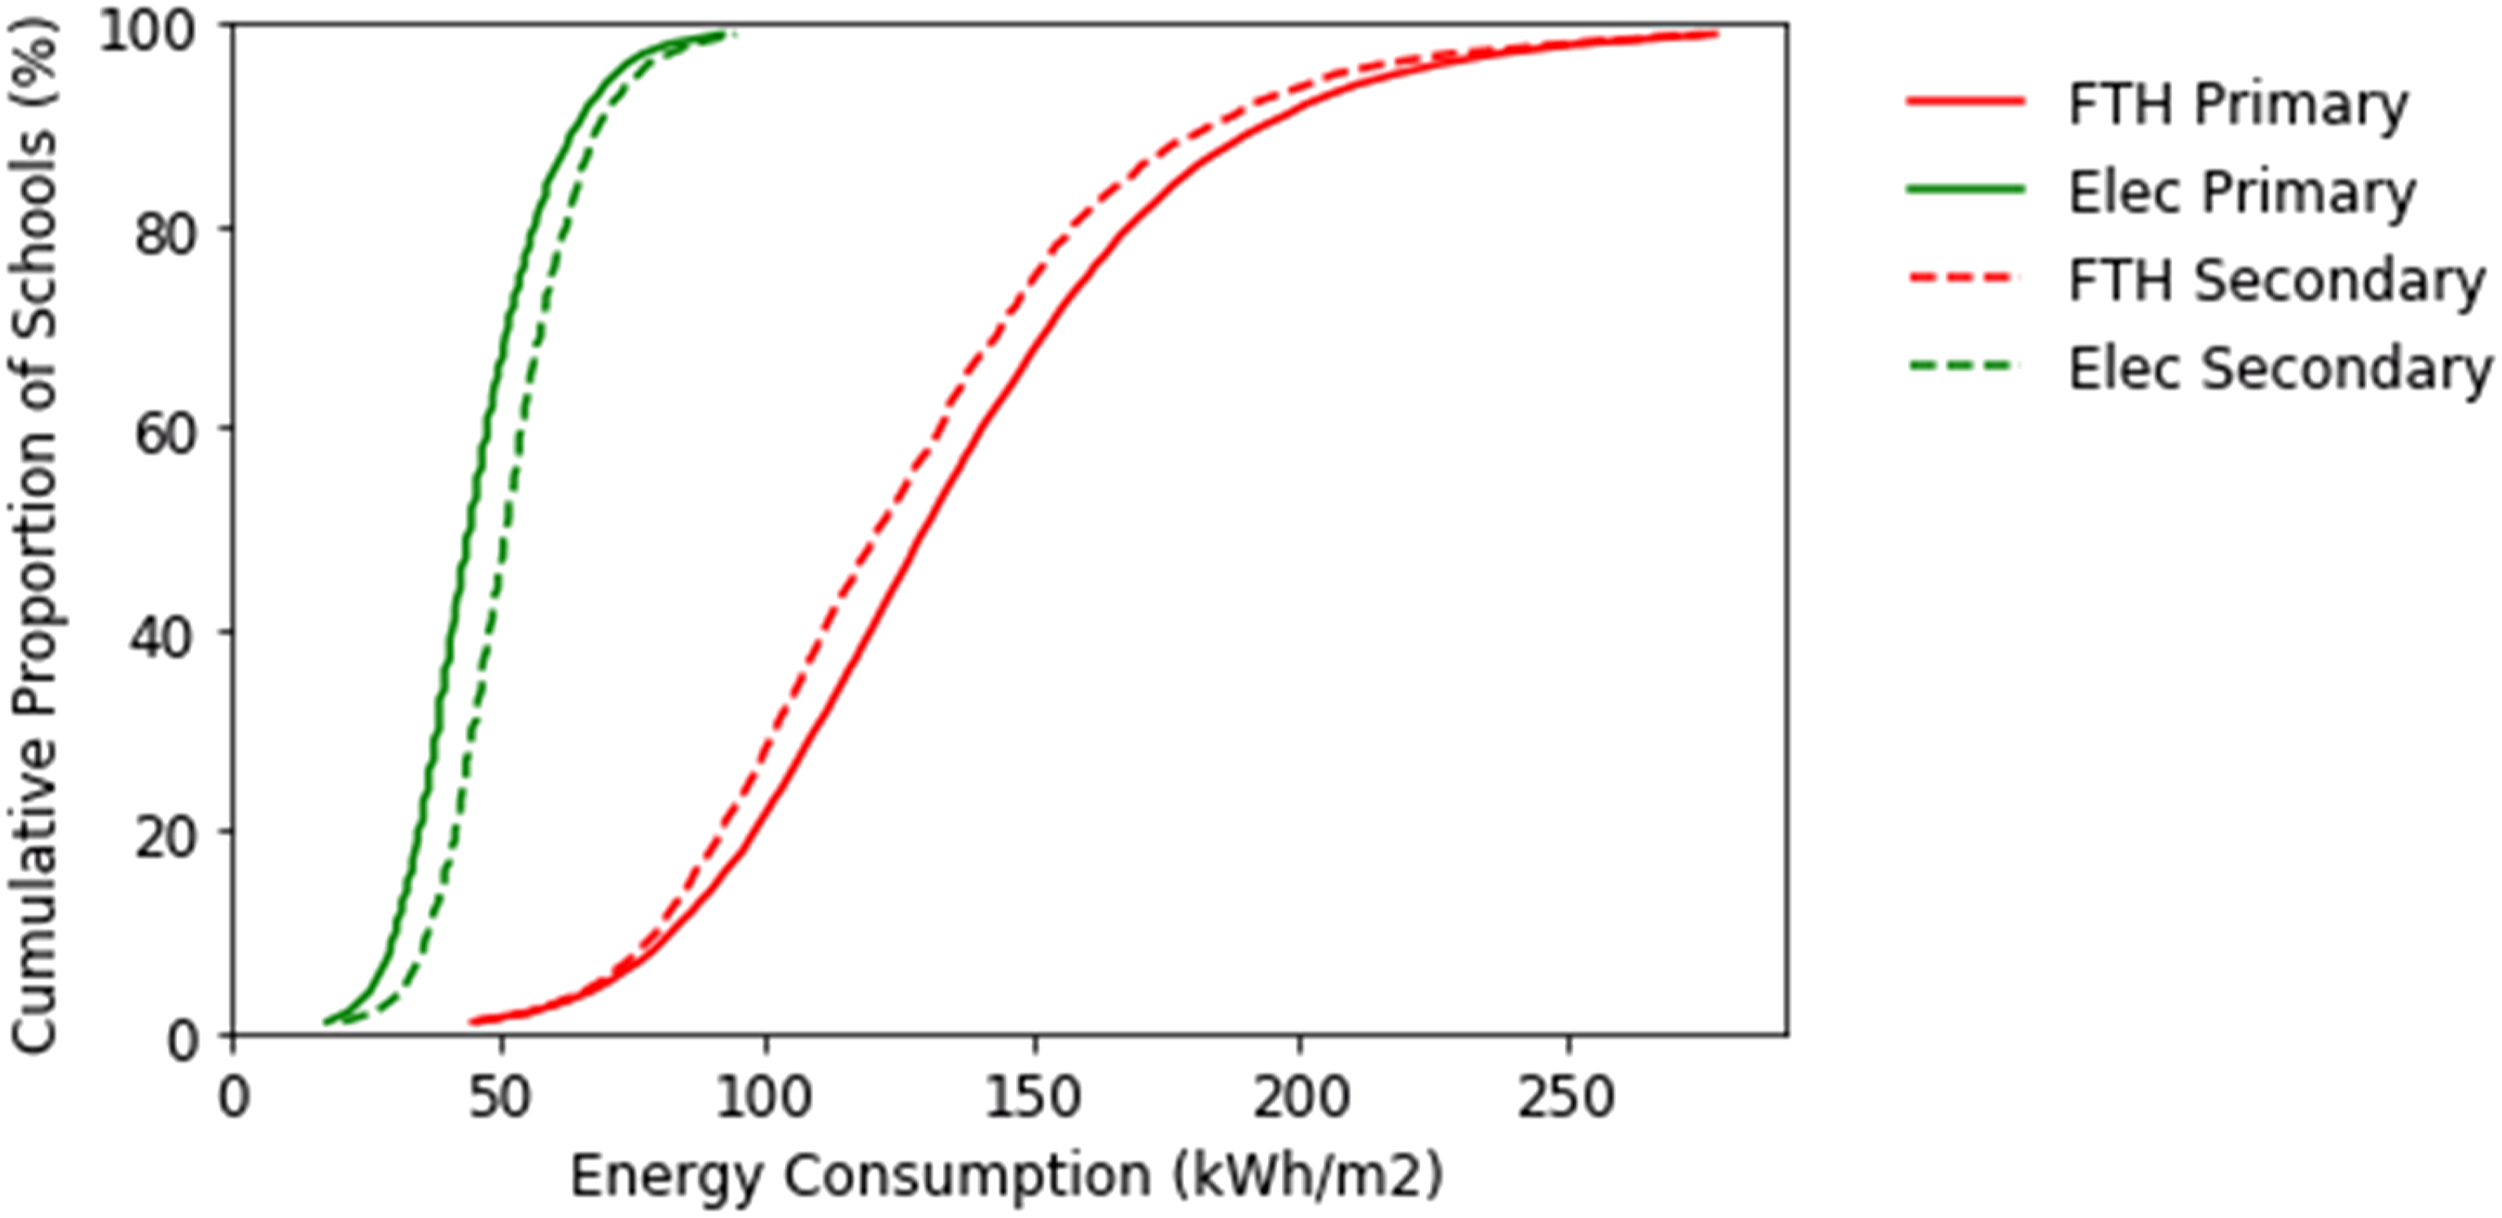
‘Good practice’ and ‘typical practice’ benchmarks are sometimes defined as the 25th percentile and median values. 26 Using these definitions, current typical practice is 130 kWh/m2 fossil-thermal and 45 kWhm2 electricity for primary schools, and 121 kWh/m2 fossil-thermal and 52 kWh/m2 electricity for secondary schools. For both gas and electricity use, the profiles are found to be statistically significantly different between primary and secondary schools (MWW, p < 0.01). The width of the curves, meanwhile, reveals the considerable variation in performance within the sector. The interquartile range amounts to 46% and 54% rises in electricity and fossil-thermal intensities for primary schools and 36% and 55% rises for secondary schools. It should be noted that no correlation was found between electricity and fossil-thermal intensities, for either school type. This means that schools with low electricity use were not more likely to have low fossil-thermal use, and vice versa.
Comparing these figures with results from similar analyses of earlier years’ energy data, the observed energy-type trend remains consistent; secondary schools have higher electrical- but lower fossil-thermal use than primary schools. 10 However, the magnitude of this trend has changed: against the 2008–09 energy data, the current results show slightly higher electricity intensities for both primary and secondary schools (7% and 5% higher medians, respectively), and lower fossil-thermal intensities (4% and 8% lower, respectively). Since PDSP excluded schools modernised since 2004, it is unlikely that the change is due to improvements in the buildings themselves (e.g. major refurbishments of envelopes). They may reflect more equipment in schools in the intervening years. For example, computing has been identified as one of the main reasons for the significant rise in schools’ electricity consumption between 1990 and 2006. 27 This may also explain the decrease in fossil-thermal energy use, since increased electrical equipment will also cause higher internal gains, potentially lowering space-heating demand. A further explanation may be greater use of renewables. An increasing proportion of school DECs lodged between 2010 and 2016 list renewable energy. However, even for the newest batch, the proportion remains low (5.4% of matched certificates lodged in 2016).
While the analyses presented have been normalised using floor area, in line with the DEC methodology, Figure 4 shows the same results, calculated on an occupancy basis from the school capacity data. Annual electricity and fossil-thermal energy intensity profiles for primary and secondary schools in England (kWh/pupil).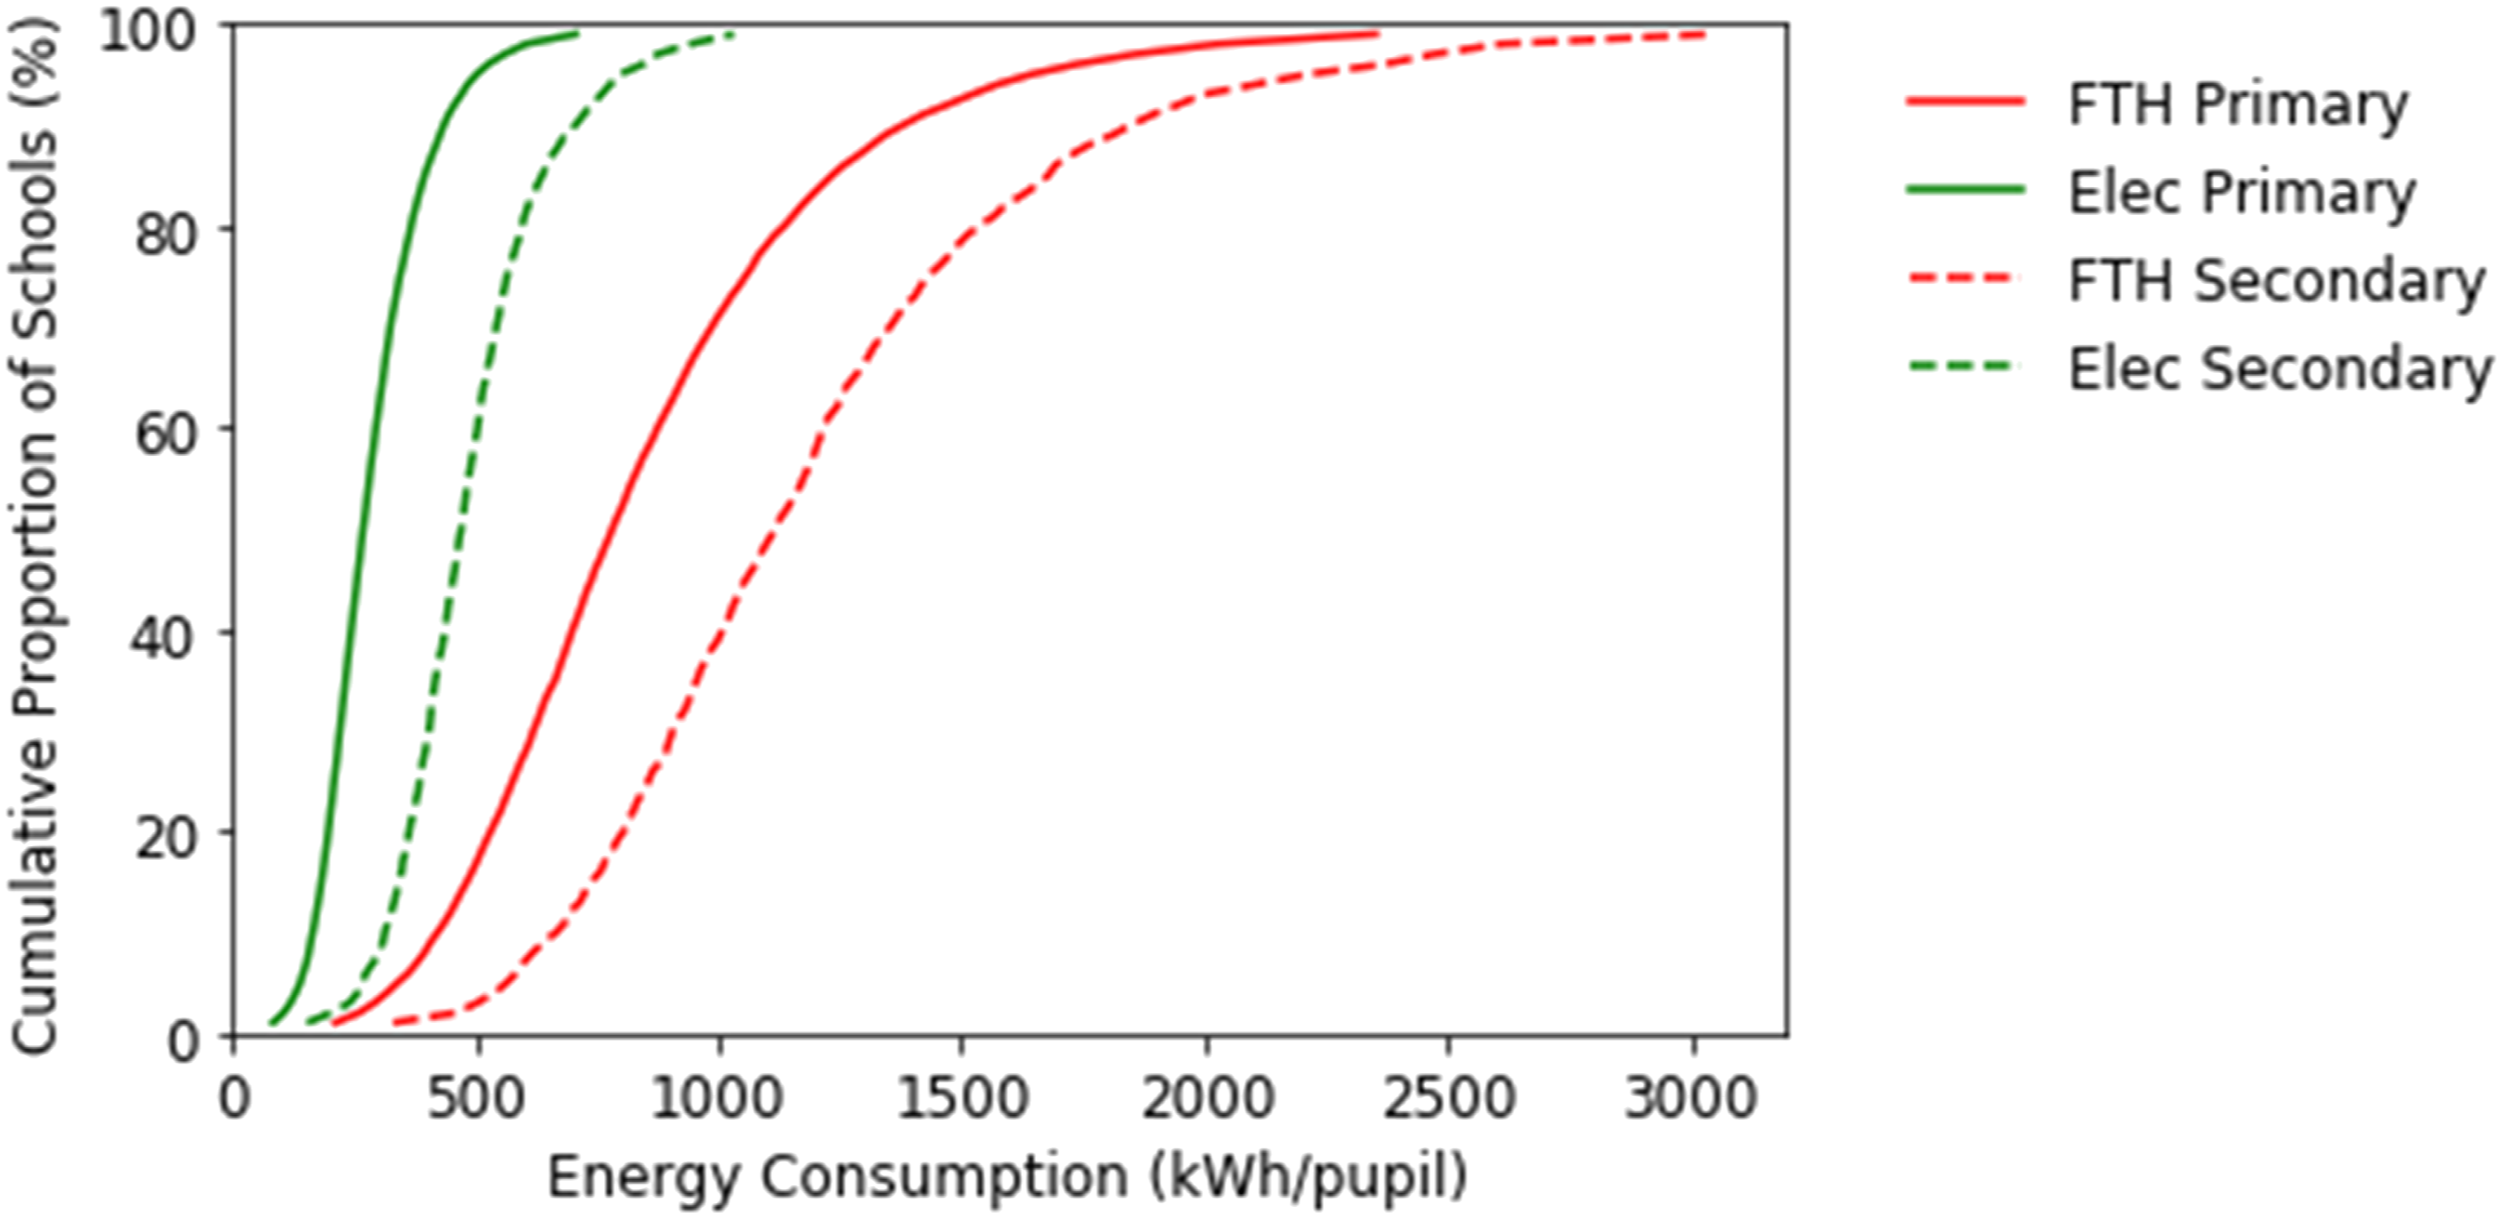
As noted previously, there is a large difference in pupil density between primary and secondary schools in England. Average densities are 6.4 and 9.5 m2/pupil for primary and secondary schools, respectively, and the 25th percentile density for secondary schools (8.2 m2/pupil) is lower than the 75th percentile density for primary schools (7.2 m2/pupil). Note that a higher m2/pupil value corresponds with a lower occupancy density. Accordingly, calculating school-energy use per pupil amplifies the differences between primary and secondary performance compared with the floor area-based trends (MWW, p < 0.01 for electricity and gas use).
As expected, there is a strong correlation between school floor area and capacity. Accordingly, the energy distributions are broadly similar when considered on the basis of kWh/m2 or kWh/pupil. However, the choice of measurement convention does impact on the apparent performance for a proportion of the stock. For example, 21.9% of schools which fall in the first quartile in terms of fossil fuel consumption in kWh/m2 sit within the second quartile when this is measured as kWh/pupil (i.e. this shift in measurement convention changes the schools from having ‘good practice’ to ‘typical practice’ gas use). The equivalent for electricity use is 25.6%. Considering there is a stronger correlation between floor area and energy use in schools, it is likely that kWh/m2 metric will remain relevant for assessing operational energy efficiency until further study is carried out on kWh/pupil metric in relation to end-use energy. 13
Longitudinal energy analysis
The results above represent the current performance of English schools. However, as noted previously, the ‘energy-schools’ database includes energy data from DECs lodged between 2010 and 2020. Therefore, to explore how the performance of the stock has changed over time, the performance was calculated for each year. Figure 5 presents the variation in energy use, split between fossil-thermal and electricity energy intensities in red and green, respectively, between 1995 and 2020. In each graph, the bands present the median use (typical benchmark), alongside the interquartile range. The energy data were produced as follows: The 2010–2020 data are based on the DEC lodgement date, from the schools-energy database. Reflecting data availability, the sample varies between years, as noted in brackets on the x-axis. The prior years’ energy figures come from a large-scale 1995 survey
28
and an analysis of the 1999–2002 energy data.
29
These figures include weather-correction from the original sources, although it should be noted that the details may differ between sources (e.g. base temperatures used for calculating degree days). The 75th percentile values for 1995 were estimated by scaling the 1999–2002 years’ data, since only 25th and 50th percentile values were available for that year. Linear interpolation was used to fill in the years without energy data. Variation in energy use over time, from 1995 to 2016 for (a) primary and (b) secondary schools (kWh/m2).
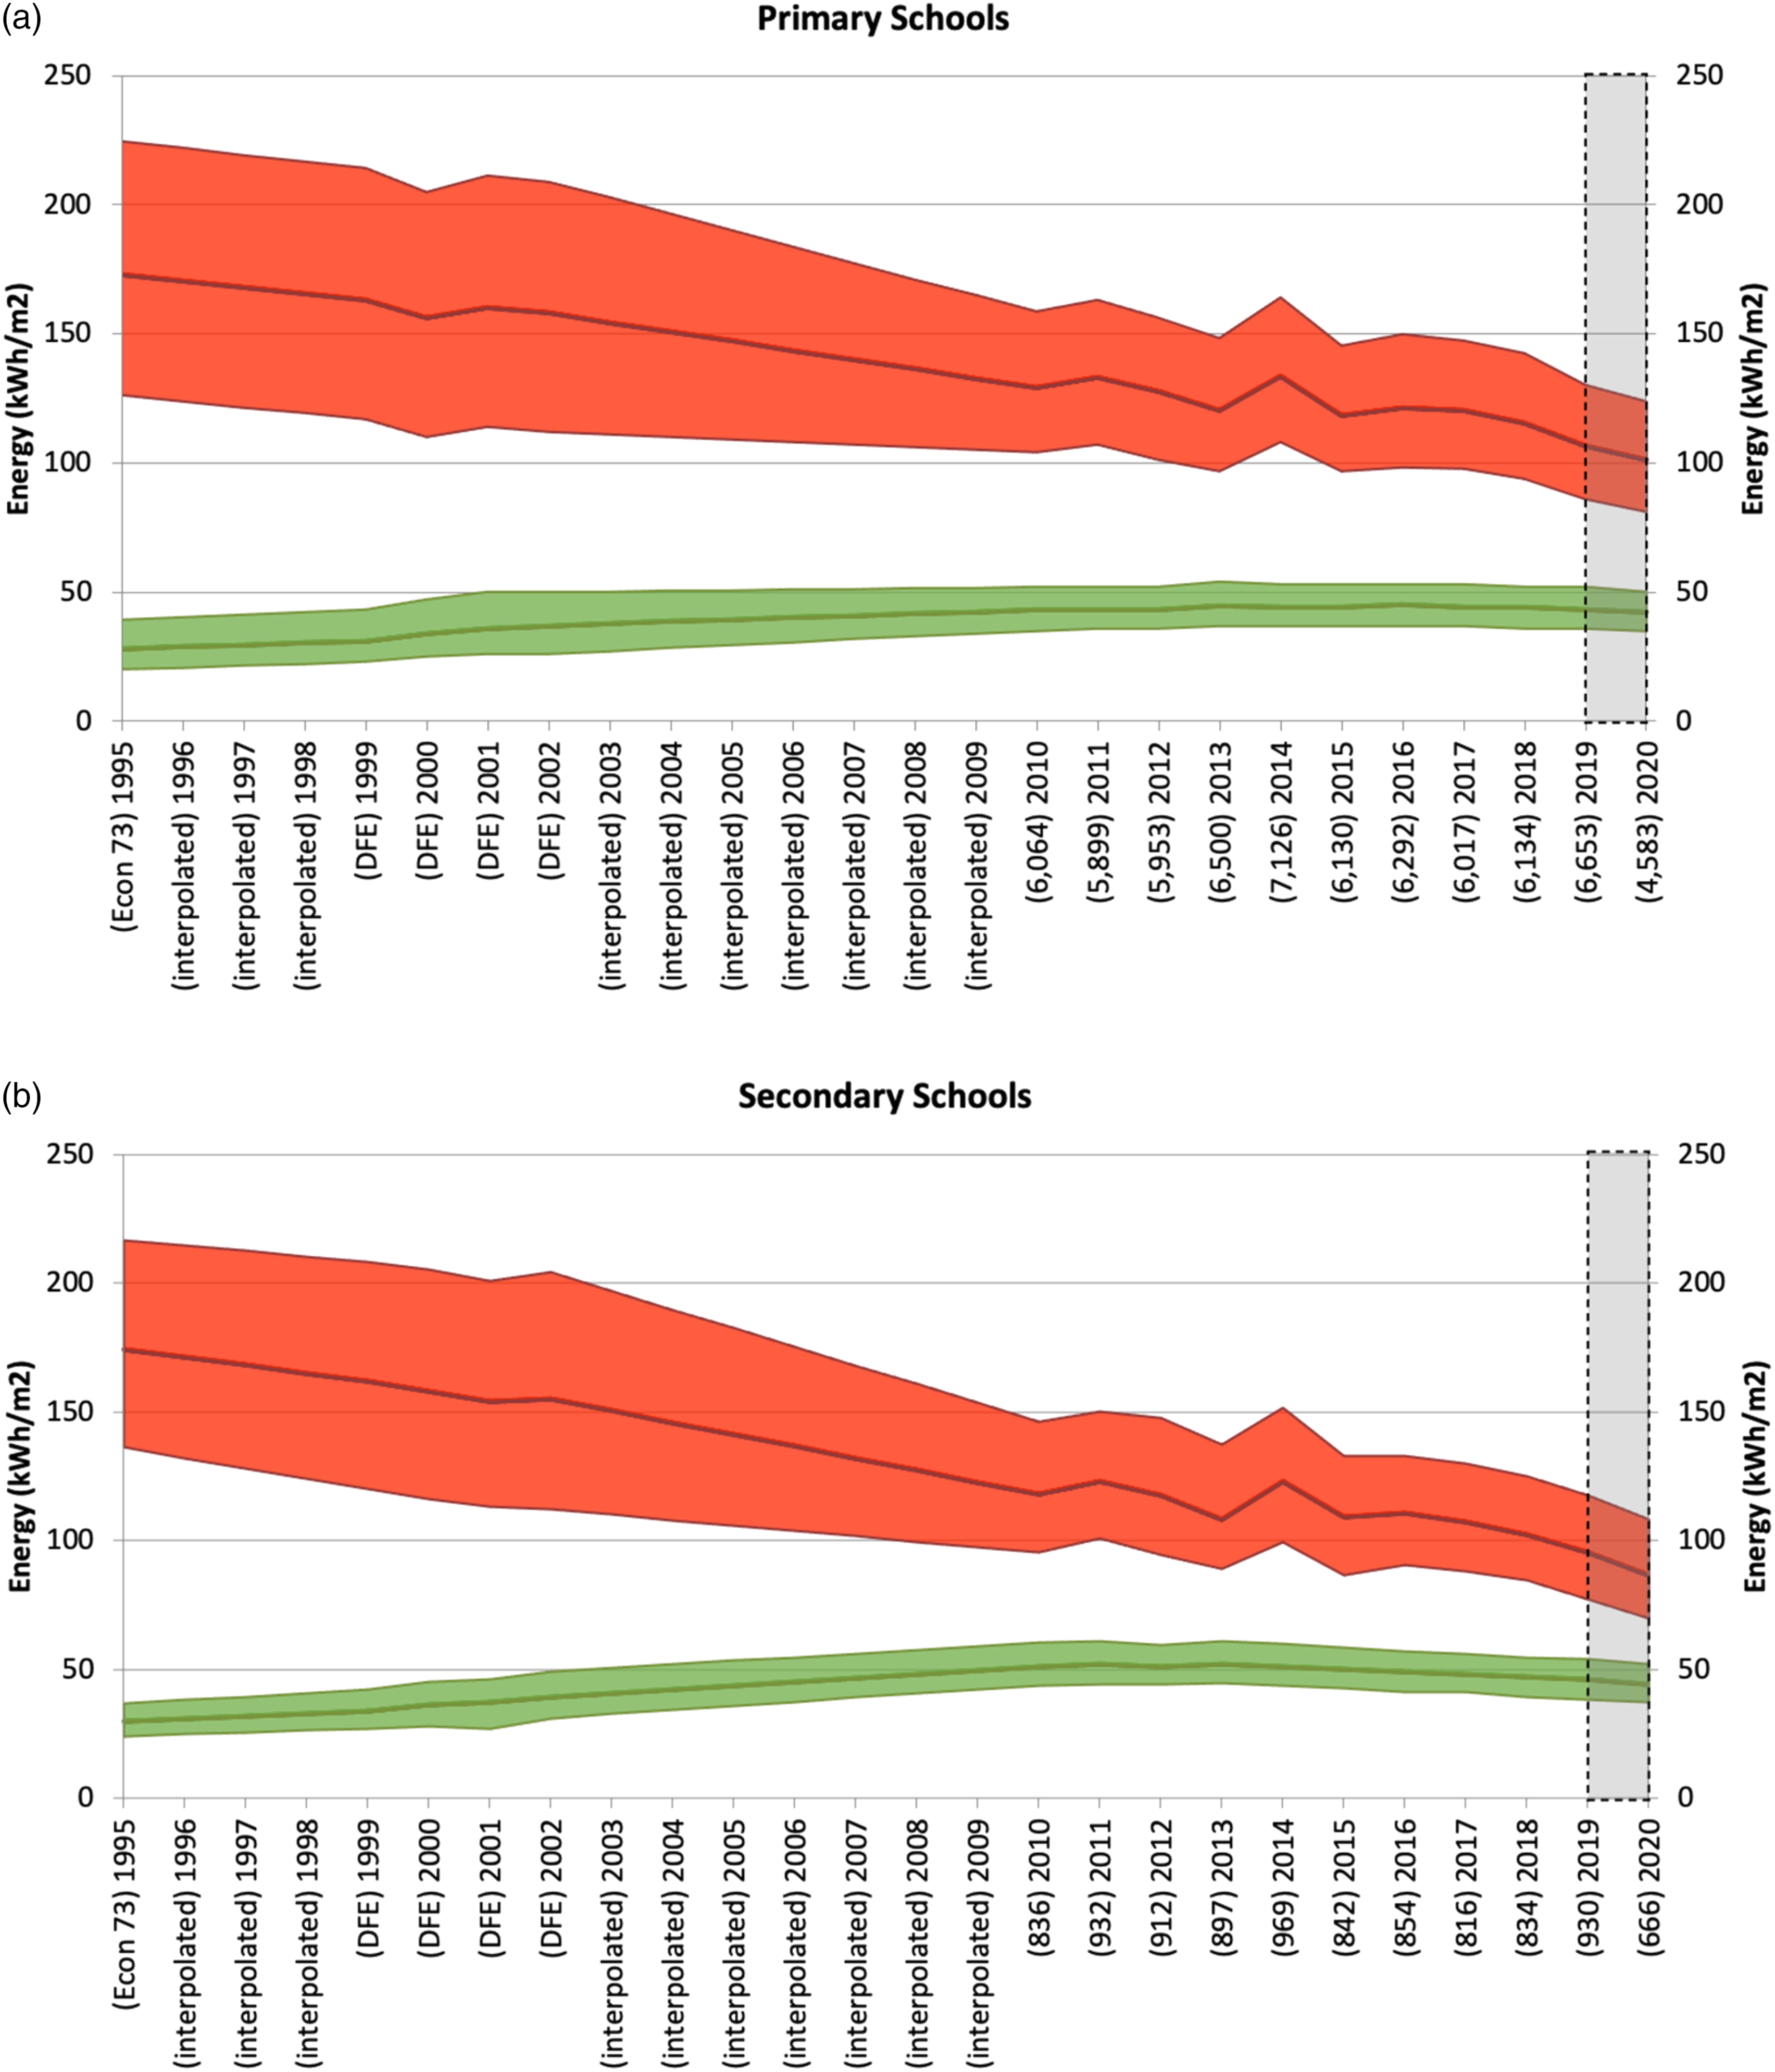
It should be noted that only DECs lodged prior to September 2020 were available for the present analysis. Since DECs will typically use energy data for the preceding 12 months, this means that the 2020 portion of the results should be considered incomplete and treated with some caution. This section of the charts has therefore been dashed.
The results show steadily declining fossil-thermal use over the quarter-century examined, but slowly rising electricity use, for both primary and secondary schools. Over the 2 decades between 1999 and 2019, median fossil-thermal intensity has fallen by 35% and 41% in primary and secondary schools, respectively, while median electricity has increased by 39% and 35% in the same period.
These trends provide insights to the findings discussed in Overall school performance. It is also worth noting that the electrical energy use intensity appears to have plateaued in primary and secondary schools. These findings agree and support findings by Hong et al. 9 but more specifically for each school type.
Energy and detailed building characteristics
This section presents results from analyses aimed at exploring how energy use varies with several key variables.
Establishment types
Past studies found differences in school performance, with establishment status.10,13 Specifically, academies were shown to be associated with higher electricity intensity and lower fossil-thermal intensity than local authority–maintained schools. However, both studies were limited to very small sample sizes, owing to the number of academies at the time: By the end of 2010, there were only 265 secondary and 24 primary academies. 30 In the past decade, however, the number of academies has grown significantly, and by 2015, these numbers had grown to around 2800 and 1800, respectively, primarily through a mix of ‘converter’ and ‘sponsored’ schools. 1402 of the primary schools and 844 of the secondary schools within the ‘school-energy’ sample are identified as Academies from Edubase.
In contrast to the mentioned past studies, analysis of the ‘schools-energy’ data shows no practical difference in energy consumption with establishment status, for either primary or secondary schools, for electricity or fossil-thermal uses (Figure 6). Gas intensities for both school types and electricity for secondary schools are significantly different between local authority maintained and academies (MWW, p < 0.01), and electricity for primary schools is not (MWW, p > 0.05). However, the magnitude of this difference is minimal; median intensities are within 2–6%. It is possible that this simply reflects changes in the performance of the school stock over time. However, it may also reflect the limitations of PDSP: An assumption of past studies when explaining the results was that earliest academies were often linked to new constructions or major refurbishments, and therefore might be expected to have better thermal performance, and more electrical equipment. However, as previously noted, the PDSP survey excluded schools significantly rebuilt since 2004. This may therefore be a reflection of a large number of local authority–maintained schools simply converting to an academy status without substantial changes in buildings or equipment.
31
Distribution of energy intensity split by establishment type for (a) primary and (b) secondary schools (kWh/m2).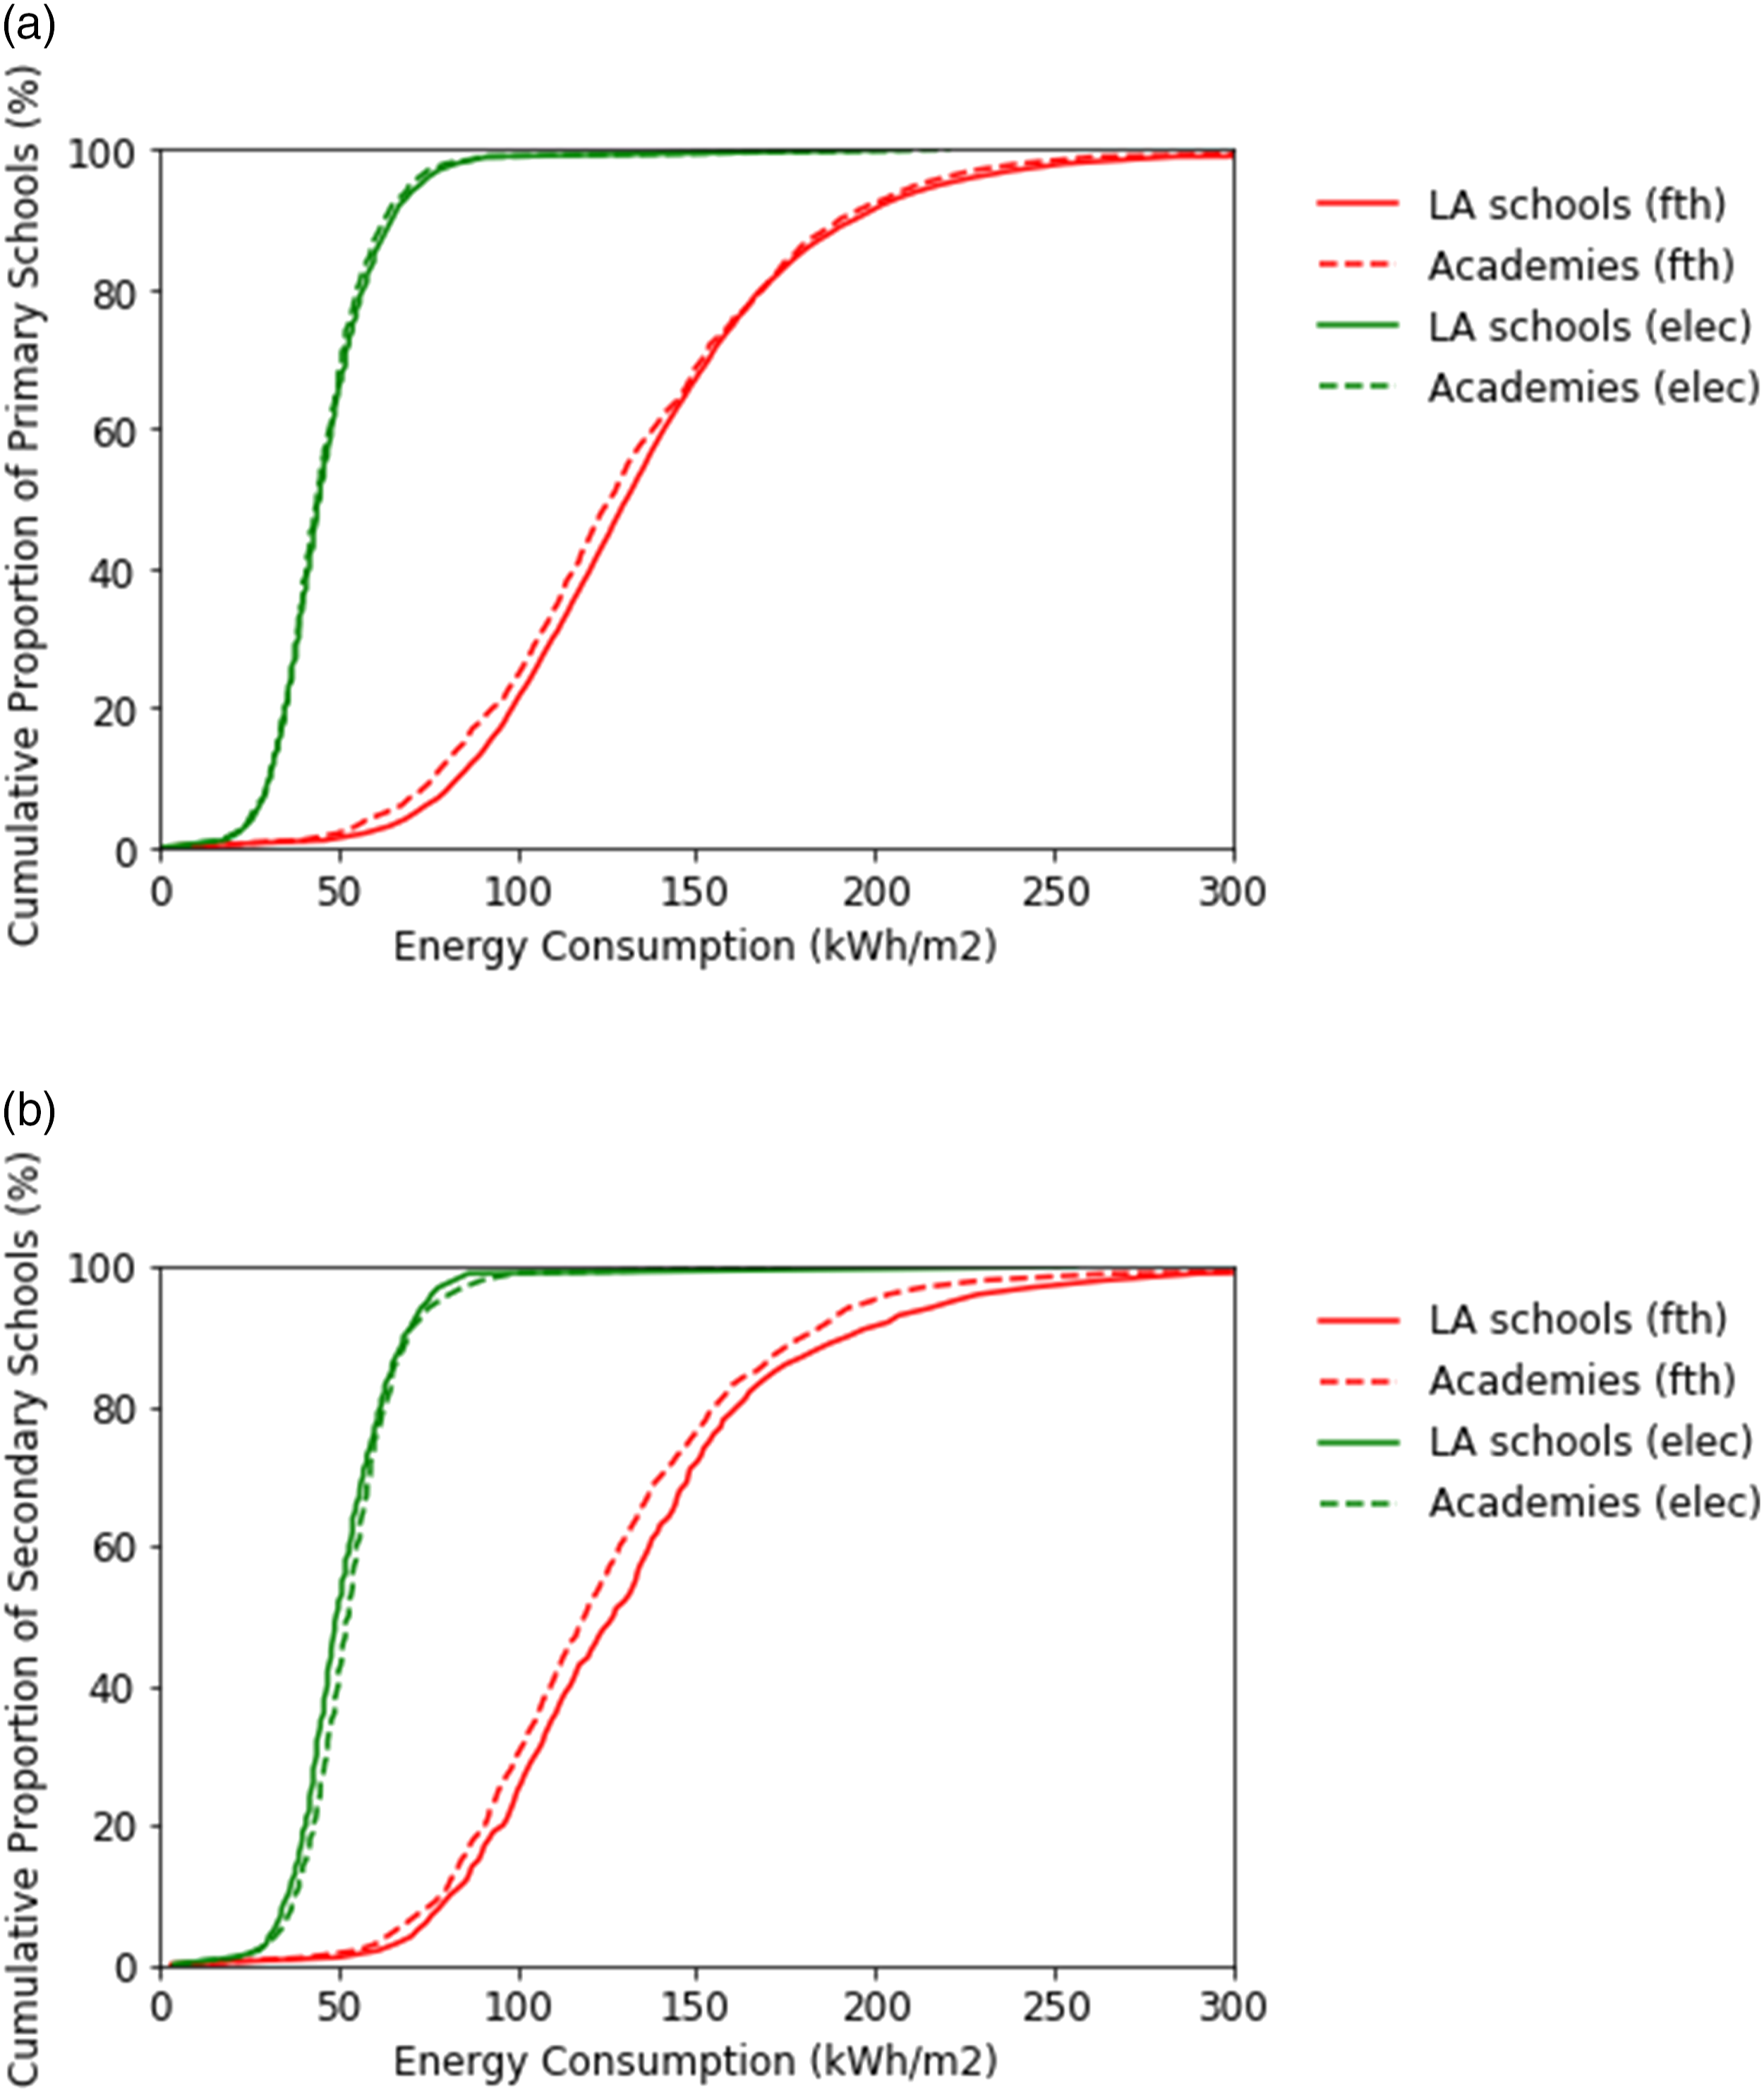
Swimming pools
Within the school-energy sample, 6% of primary schools and 13% of secondary schools are identified as having swimming pools. Figure 7 shows the distribution of energy intensities, split between schools with and without swimming pools. Distribution of energy intensity split between schools with and without swimming pools for (a) primary and (b) secondary schools (kWh/m2).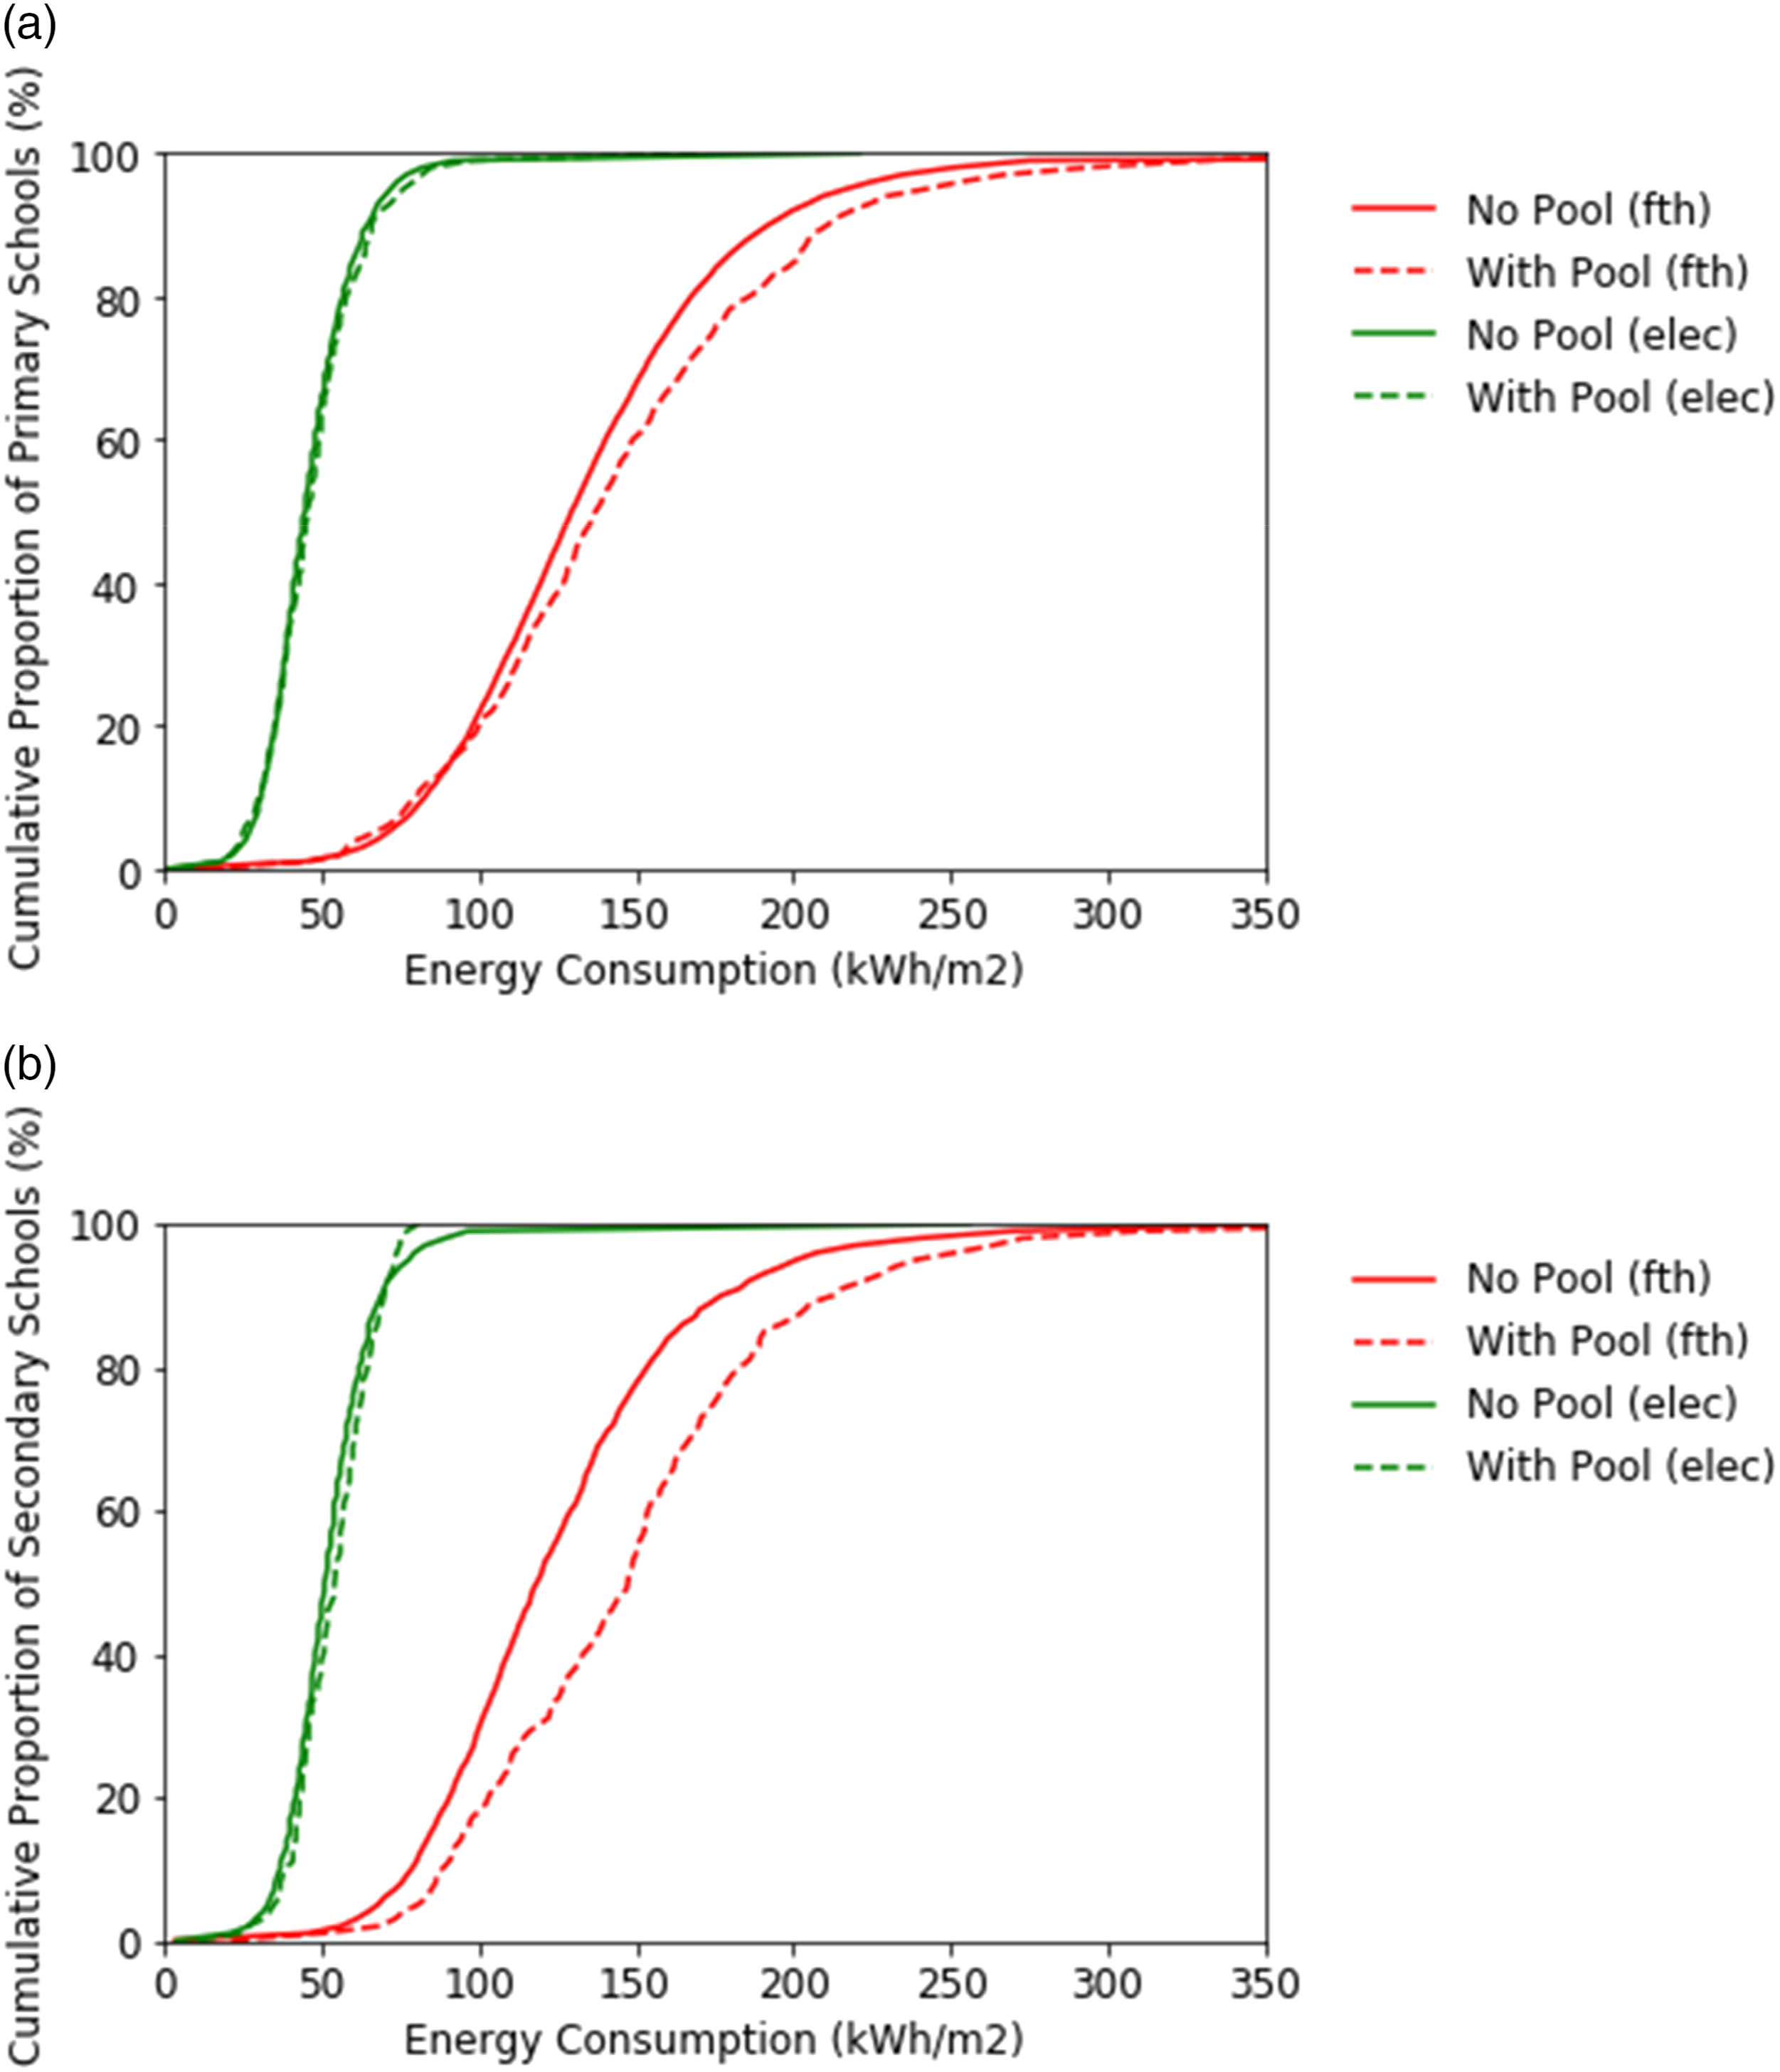
The results seen may be as expected. A minimal change is observed in electricity, but fossil-thermal use is higher in schools with pools than those without. Fossil-thermal has 7.1% and 19.1% rises in mean intensities in primary and secondary schools, respectively (MWW, p < 0.01 in both cases), compared with 2.7% and 2.0% rises in electricity intensities. The smaller rise, compared with the aforementioned DEC benchmarks, reflects the fact that swimming pools in schools typically only represent a small proportion of the total floor area. It should be noted that, in theory, schools with swimming pools may provide separate DECs for the pool blocks where the associated area is large enough and appropriately sub-metered. Therefore, it is likely that the above result is conservative. These results agree with patterns of energy use described in the CIBSE Guide 32 F in the form of energy benchmarks where schools with pools show considerably higher demand for heating and elevated electricity use. The new finding provides evidence to support these differences and highlights the importance of understanding factors that determine demand for energy use to assess their operational energy efficiency accurately.
Building age
Past studies have shown that building age is associated with differences in energy use 11,13 This is driven both directly, such as through the thermal performance of the envelope (associated with changes in building regulations, deterioration over time, etc.), as well as more indirectly, such as through changes in construction trends over time. Within PDSP, age data were provided at a block level, using the following five bands: pre-1919; interwar; 1945–1966; 1967–1976 and post-1976. These ‘represent distinct eras within school building programmes and schools built within these eras often have similar construction characteristics, maintenance needs and lifecycle expectations’. 20 For the present study, the most prominent age band for each school was calculated, based on the largest floor area. No interpolation of ages was used, so a school with 75% of the area constructed ‘pre-1919’ and 25% ‘post-1976’ would have an overall age of ‘pre-1919’ rather than between these two. Within PDSP, areas in schools with different ages are recorded as separate ‘blocks’, even if they are not physically separate. Thus, from Table 3, it can be seen that a larger proportion of primary schools than secondary schools have a uniform construction age (a third of primary schools have a single block, compared to only 1% of secondary schools).
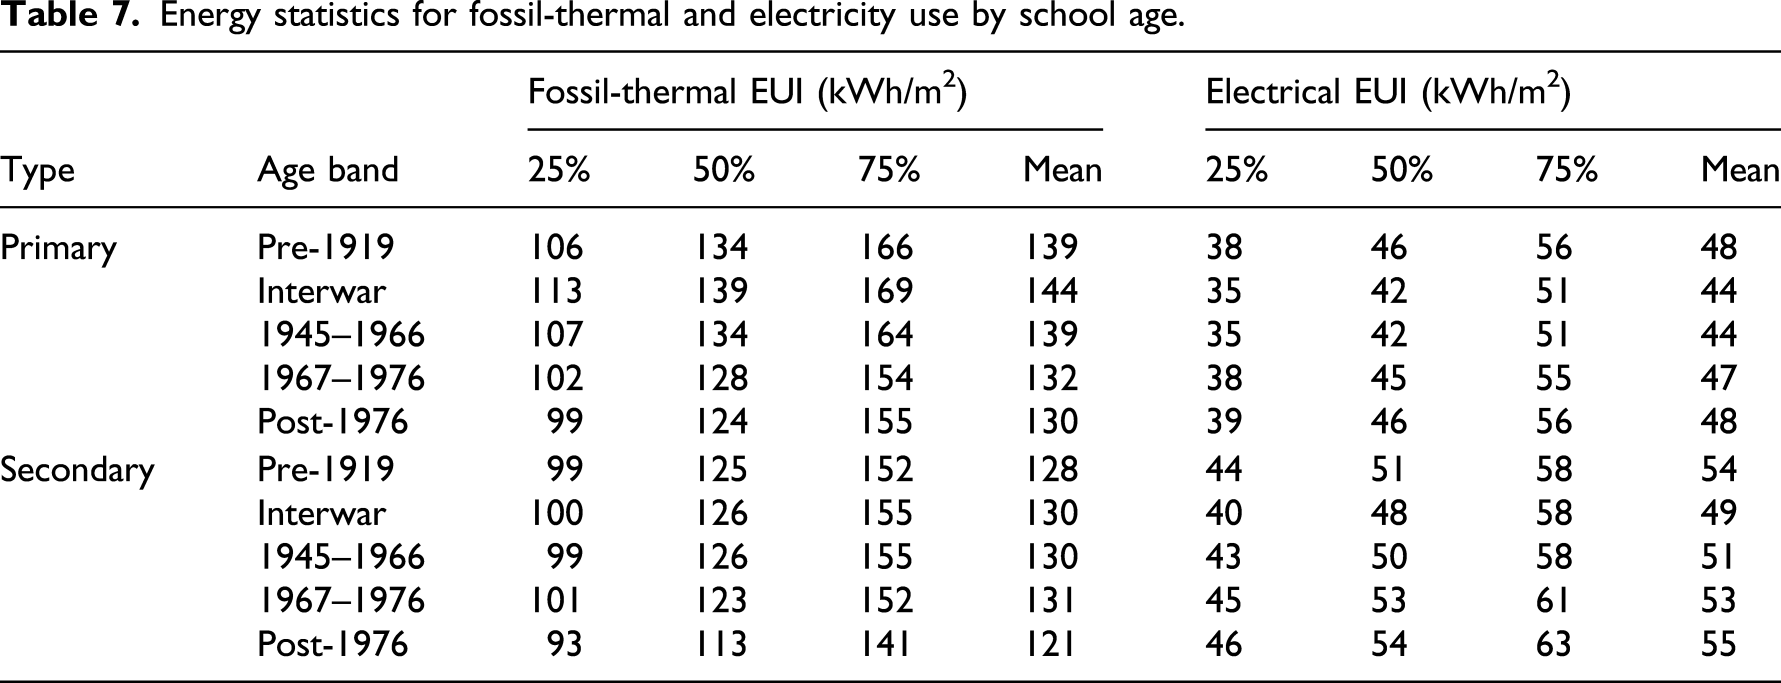
Figure 8 above shows how energy performance varies split by school age. The key data are also shown in Table 7. The variations in heating consumption with age are larger for primary than secondary schools, which may reflect the proportion of mixed ages. For primary schools, both gas and electricity intensities vary with age (KW, p < 0.01). The post hoc Dunn tests, comparing each of the 10 pairs of ages show that for gas all pairs are different except for ‘pre-1919’ versus ‘1945–1966’ and ‘1967–1976’ versus ‘post-1976’, while for electricity, all pairs are different except for ‘pre-1919’ versus ‘1967–1976’, ‘pre-1919’ versus ‘post-1976’, ‘1945–1966’ versus ‘interwar’ and ‘1967–1976’ versus ‘post-1976’. Secondary schools are also found to vary with age for both fuels (KW, p < 0.01). However, the Dunn tests are less clear about where this difference lies; significant differences are only found for two pairs each, for gas and electricity. Considering the extremes, compared with ‘pre-1919’ schools, ‘post-1976’ schools have a 7.0% lower median fossil-thermal intensity in primary schools, and 8.8% lower in secondary schools. However, the data show that the energy-age relationship is not simple; the interwar period show higher-than-expected fossil-thermal consumption, especially for primary schools. Interestingly, this trend, where interwar properties have higher-than-expected space heating, is also found in the English domestic stock.
33
Distribution of energy intensity split by age band for (a) primary and (b) secondary schools (kWh/m2). Energy statistics for fossil-thermal and electricity use by school age.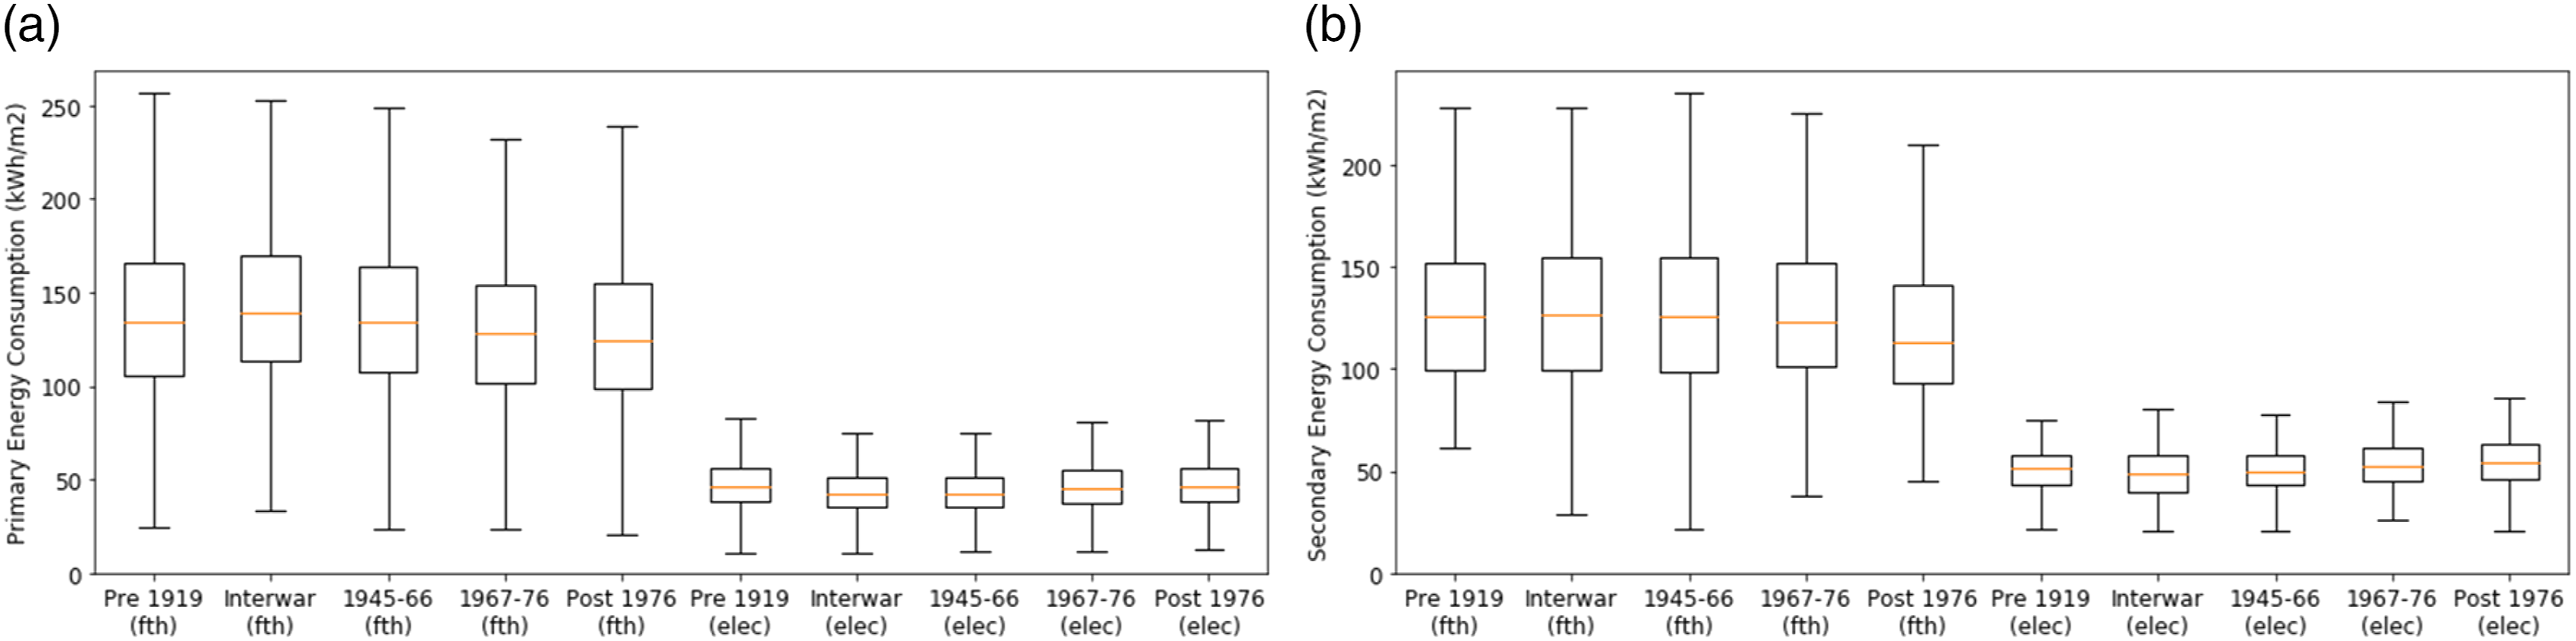
HVAC
It is well understood that building energy consumption varies with internal systems.9,10 Past DEC-based studies have used the ‘main internal condition’ variable, which represents the Heating, ventilation, and Air Conditioning (HVAC) type (air conditioning, mechanical or natural ventilation) associated with the largest carbon emissions, and found that mechanical ventilation is associated with higher electricity consumption and lower fossil-thermal consumption than natural ventilation in schools. Within PDSP, however, a greater level of detail is available. This includes a breakdown of the floor area associated with different HVAC systems within each school but also, significantly, information on the condition of the existing systems.
Figure 9 below presents the variation in energy use by HVAC system. The overall HVAC system within each school was determined from the PDSP data on an area-weighted basis. Very few schools are predominantly air-conditioned: 1% of the sample for both primary and secondary schools, amounting to 95 and 14 schools, respectively. Due to the tiny sample size, the AC secondary schools are excluded from the chart, although the key figures are included in Table 8 for reference. Distribution of energy intensity split by HVAC for (a) primary and (b) secondary schools (kWh/m2). Energy statistics fossil-thermal and electricity use by HVAC type.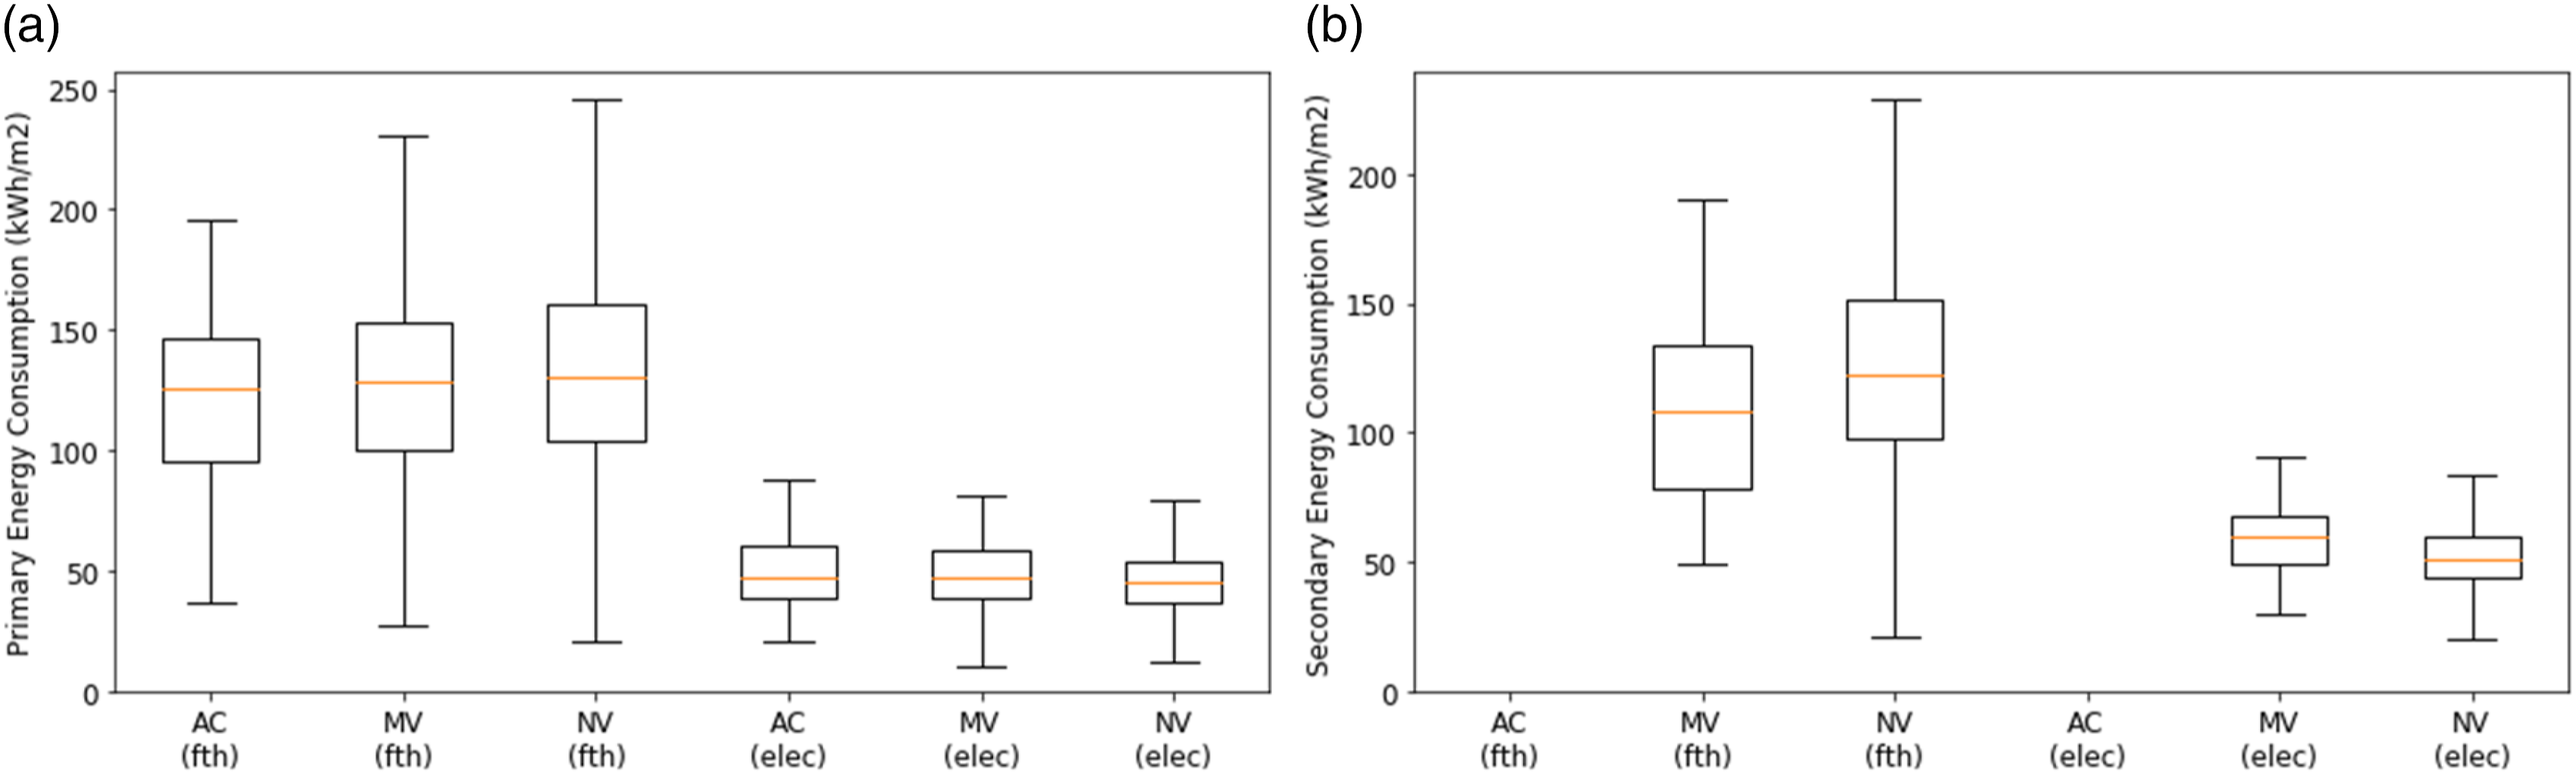
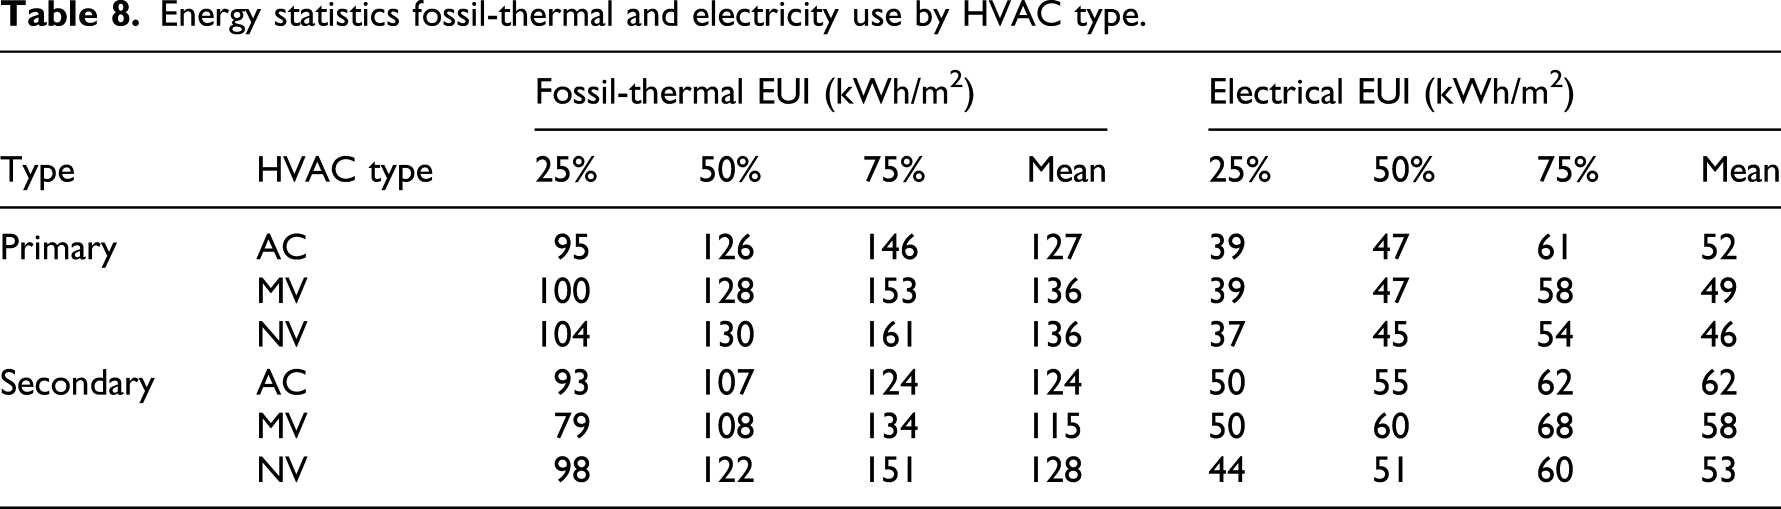
The observed trends tally with past results. Moving from active to passive systems (from predominantly air-conditioned schools to predominantly naturally ventilated schools) is associated with reductions in typical fossil-thermal and increases in electricity use, for both primary and secondary schools. Compared with NV, the data show that MV is associated with rises in typical electricity intensities of 17.3% and 4.4% in secondary and primary schools, respectively (MWW, p < 0.01 for both). Fossil-thermal use, meanwhile, falls by 11.5% (MWW, p < 0.05) and 4.3% (MWW, p > 0.05), respectively.
Figures 10 and 11 show how energy use varies with the condition of school heating plant and controls. As noted previously, the overall conditions for each school have been calculated by area-weighting the A–D grades assigned by PDSP assessor on a floor area basis to each school block. As before, cases with very small samples have been excluded from the analysis (5 secondary schools have an overall heating plant grade of D; 24 primary and two secondary schools have an overall heat control grade of D). Distribution of energy intensity split by heating plant condition for (a) primary and (b) secondary schools (kWh/m2). Distribution of energy intensity split by heating controls condition for (a) primary and (b) secondary schools (kWh/m2).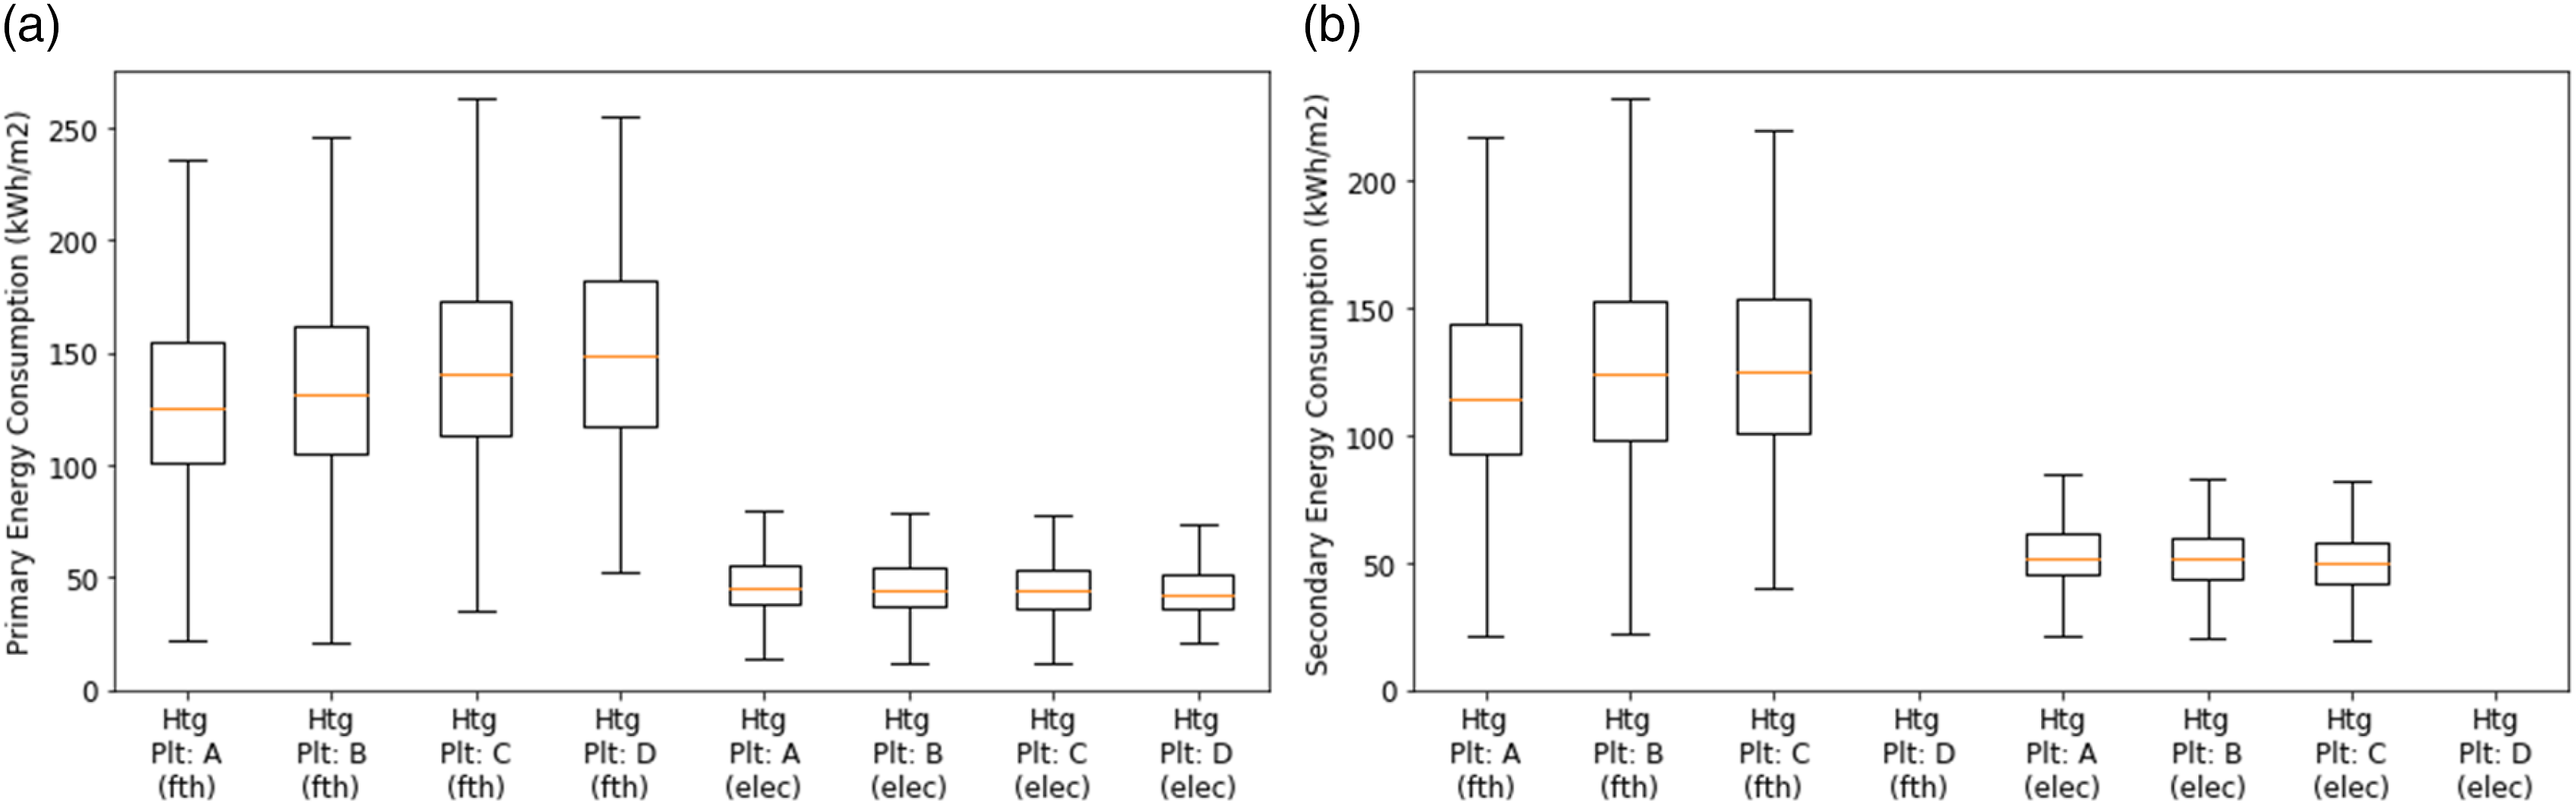
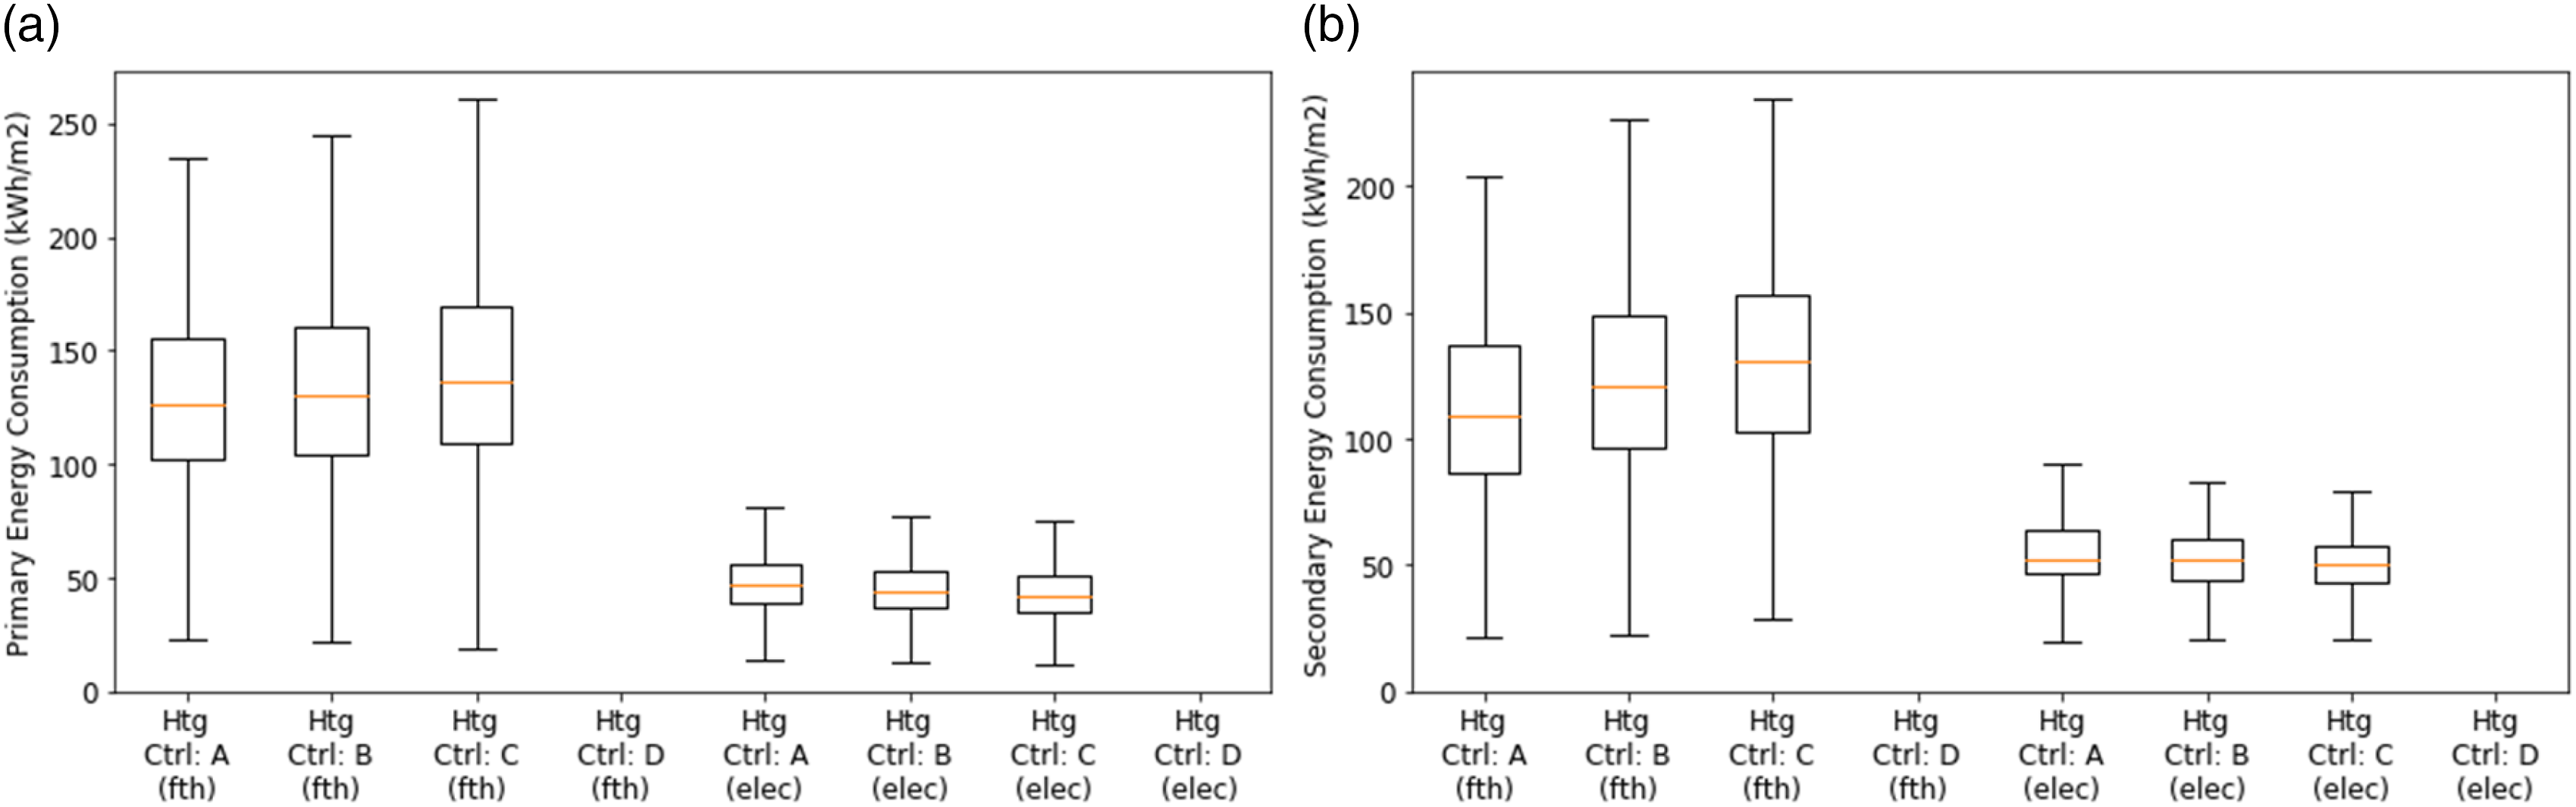
Reassuringly, while the condition grades were originally assigned using visual inspection only, and therefore depend on the qualitative judgement of each assessor, the results highlight strong links between system condition and energy use: Rising fossil-thermal energy use with falling plant and controls quality can be observed in both primary and secondary schools. 20 Median fossil-thermal energy use for primary schools with good condition heating plant (A) for example is 125.8 kWh/m2, compared to 148.8 kWh/m2 for schools with poor condition (D), a rise of almost one-fifth. For secondary schools, a rise of 9.4% was observed from A to C, 113.9 to 124.6 kWh/m2. Similar trends can be seen for heating controls grades; comparing C to A grade schools, is associated with an, 8.0% rise in median fossil-thermal intensity in primary schools, and a 20.3% rise in secondary schools. These findings extend the understanding of determinants of energy use which, in previous studies, tended to be limited to HVAC systems due to insufficient information on building services systems.9–11,13,25 Such results provide insights to potential improvements that could be made to increase operational energy efficiency of schools.
Conclusion and further work
This study uses data from PDSP (a national on-site survey data on school buildings) in conjunction with open access data from Edubase and the DECs, to explore the characteristics and energy performance of primary and secondary schools in England. By processing and combining the separate datasets, a unified large-scale, disaggregate database of the school stock has been produced, which includes data on building characteristics as well as annual electricity and fossil-thermal consumptions. Such a comprehensive dataset on a particular sector has not existed previously for UK non-domestic buildings, and this unified dataset has been used to review the existing, sample-based, knowledge of the English school stock.
Selected key variables from the combined dataset were analysed in three stages. Analyses of the school characteristics dataset covered approximately 77.6% and 49.8% of primary and secondary schools, respectively. 34 The combined dataset of characteristics and energy on the other hand covered approximately 44.9% and 24.2% primary and secondary schools, respectively. Statistical tests were carried out between the two datasets and a significant difference found in floor area and capacity for primary schools. However, since both measures were found to vary to similar degrees, the resulting difference in pupil density was very small (<2%). As such, the smaller combined dataset was deemed representative of the wider range of schools in the characteristics dataset. Combined datasets are statistically analysed to improve the understanding of the characteristics and energy performance of English schools. Statistical analyses were carried out in three broad parts to describe the characteristics and energy use of schools and find relationships between the two aspects.
Analysing previously explored variables such as floor area and pupil density revealed similar patterns to previous studies. There were, however, differences which highlighted uncertainties associated with using samples to approximate stock characteristics. Descriptive statistics on variables such as floor area breakdown by use, age distribution of blocks, and element conditions provided detailed understanding of characteristics of the school stock. Analysing these variables in relation to energy use revealed relationships that would be valuable for improving relevance of assessing and benchmarking operational energy efficiency of schools.
A need for incorporating more contextual factors to provide more relevant and accurate benchmarks has been highlighted in numerous studies.10,13,25 These results provided an opportunity to improve the understanding on how schools with different facilities use energy. Such knowledge has the potential to improve the relevance of benchmarking processes for assessing operational performance of primary and secondary schools.
Correlations found between energy use and characteristics such as conditions of heating systems and controls and swimming pools highlight possibilities of introducing these variables into benchmarking processes to improve the relevance of benchmarking.
Aggregated data would however mean that benchmarking would be carried out at site-level for building types where multiple buildings are typical a part of a premise such as schools and hospitals. For those premises without building-level energy meters, this approach may lead to a more accurate evaluation of how efficiently energy is being used in a premise.
This study has provided improved understanding of building characteristics and energy performance of primary and secondary schools in England. Findings highlight the value of acquiring such a comprehensive and detailed data for understanding a building stock. This is a positive step towards developing capacities for assessing and identifying pathways for achieving substantial reductions in carbon emissions effectively both in terms of cost and carbon emissions to contribute towards meeting the climate change goals of the United Kingdom and more broadly the Paris Agreement.
Further work
Understanding performance of contemporary schools
Property Data Survey Programme data provided detailed and comprehensive information on a large proportion of existing schools in England. The survey however did not include contemporary schools which were built to higher specifications and are reflective of the latest developments in policies and technologies. Acquiring data similar to PDSP but for contemporary school buildings will provide an opportunity not only to complement the current knowledge on the school stock but also to learn from the latest design approaches. Passivhaus standards and ground and air source heat pumps are some of the examples of design approaches and technologies which are being explored to achieve a net-zero carbon future. Assessing characteristics and energy performance of schools with forward-looking designs would be highly beneficial for informing future decisions on investments for improving the building stock.
Identifying opportunities and pathways for reducing carbon emissions from schools
This study focussed on introducing PDSP data, describing the characteristics of primary and secondary schools and their energy use. In addition to the insights, the study also highlights possibilities of exploring top-down and bottom-up methods informed by PDSP to gain an improved understanding how to develop a robust stock model. Consequently, follow-up studies are currently being undertaken to explore developing archetypes of schools based on the comprehensive data and developing a digital twin of the school stock. A by-product of such an exploration would also provide an opportunity for assessing and identifying opportunities and pathways for reducing the carbon emissions from English schools effectively.
Footnotes
Declaration of conflicting interests
The author(s) declared no potential conflicts of interest with respect to the research, authorship, and/or publication of this article.
Funding
The author(s) disclosed receipt of the following financial support for the research, authorship, and/or publication of this article: This study was a part of the EPSRC-funded Advancing School Performance: Indoor environmental quality, Resilience and Educational outcomes (ASPIRE) project and the CIBSE-funded Energy Benchmarking project.