
Abstract
Internal wall insulation is one of the few, possibly, the only feasible solution to efficiently reduce heat losses through the external walls of buildings where the application of external insulation is not an option, for example, in conservation areas. However, the application of this intervention may lead to unintended consequences, such as moisture accumulation and mould growth. Currently, no international standards and regulations exist to evaluate these hazards via non-destructive inspections. Air sampling through impaction and culture-based analysis was suggested in previous research as a potential non-disruptive methodology for interstitial mould testing. The method requires the perforation of the inner side of a wall and the creation of airflow through the operation of a pump, to allow the collection of particles from the confined space of interest. The present study aimed to assess the location of perforations and their effect on the airflow created and the airflow pattern variations due to changes in the airflow velocity at the outlet. Results regarding airflow features such as the turbulence intensity, dynamic pressure and volume-averaged velocity were also extracted and discussed.
Keywords
Introduction
Buildings are estimated to be responsible for more than one-third of the global energy demand, 1 while uninsulated walls can account for more than one-third of a building’s total energy consumption. 2 According to the statistical data published by the department for business, energy and industrial strategy (BEIS) 3 it is estimated that more than 90% (7.7million) of the existing 8.5 million solid wall properties has yet to be applied either external or internal wall insulation. To that end, insulation on uninsulated walls can be a feasible solution for improving a building’s energy performance. However, the decision-making process for the selection of the most appropriate insulation solution might be challenging.
To present, external, internal, and cavity wall insulation are the three options available to help reduce heat losses from uninsulated walls and improve thermal comfort. However, current legislation, planning regulations and the characteristics of the buildings might limit the applicability of some options. For instance, in the retrofit of historic buildings, the application of internal wall insulation (IWI) might be the only feasible solution as external wall insulation might be restricted by legislation. However, the installation of the IWI, when designed and installed wrong, might lead to the aggregation of moisture, condensation and thus moisture-related problems such as mould growth that constitutes a health hazard and can potentially lead to damage to building materials and problems with the overall durability of building components.4,5
Reduced ventilation or installation of materials with a lower water vapour permeability may be responsible for moisture getting trapped inside internally insulated walls. 6 Interstitial condensation may also result from poor installation of ventilation or plumbing equipment during the implementation of the insulation or from the use of materials that have been exposed to humid conditions, introducing “built-in” moisture in the building system.7–9 Moreover, the inability to properly seal around penetrations and services may also cause moisture accumulation. 8 Trapped moisture may be attributed to thermal bridges created when the insulation of joist ends is improperly installed. 8 Leaks from plumbing failures may also contribute to moisture aggregation within exterior walls.7,9
For the prevention of moisture-related risks, an air gap of at least 3 cm between IWI and external walls has been suggested as a solution to avoid moisture accumulation and mould growth issues. 10 However, this type of intervention may not always guarantee the prevention of dampness and the risk of mould growth in case of considerable built-in moisture and inadequate detailing, among other factors.11,12 Hence, the assessment of risks related to mould should be of concern when evaluating the installation of IWI.
Mould growth and dampness are detrimental to all building materials in the long run, especially for wood-based and other organic materials, 13 leading to expensive remediations. 14 Health implications for occupants and indoor materials damage can also be related to mould growth and dampness. 15 As reported by the World Health Organization (WHO), damp indoor environments and the growth of mould may jeopardise the health of the occupants and disturb their wellbeing. 15
The evaluation of indoor mould contamination has gained the interest of the research community for almost a century. To that end, many sampling methods and analysis techniques have been developed over the years (for a review of the most commonly used techniques, see16,17). Several standards and international guidelines, as well as research efforts, have attempted to provide guidance on testing/analysis protocols and the interpretation of testing results (e.g. BS IS0 16000 parts 16-20, D7338 – 14 by ASTM, Guidelines produced by the Federal-Provincial Committee on Environmental and Occupational Health and the New York City Department of Health and Mental Hygiene, and studies by Gots et al., and Aktas et al.18–27). However, while the documents aim to guide the assessment of mould inside properties, they lack information regarding the evaluation of mould growth within air gaps of exterior constructions. In addition, no document has yet been widely accepted by the research community. 28
In an experimental study on small scale specimens, Efthymiopoulos et al.29,30 have proposed a novel testing methodology to assess mould growth inside confined spaces such as air gaps, which rely on the collection of air samples through impaction and data processing through culture-based analysis. The testing methodology relied on the perforation of two holes on the inner side of the wall of interest and the operation of a pump for the collection of air samples. Using one hole as an inlet and the other as an outlet, the pump forces air to be drawn from the indoor environment inside the confined space. Airflow is then created, leading mould particles to impact the sampling medium within the impactor connected to the outlet hole. The volumetric flow rate is controlled by adjusting the back pressure of the pump based on the rotameter reading. A schematic representation of the proposed setup is shown in Figure 1.
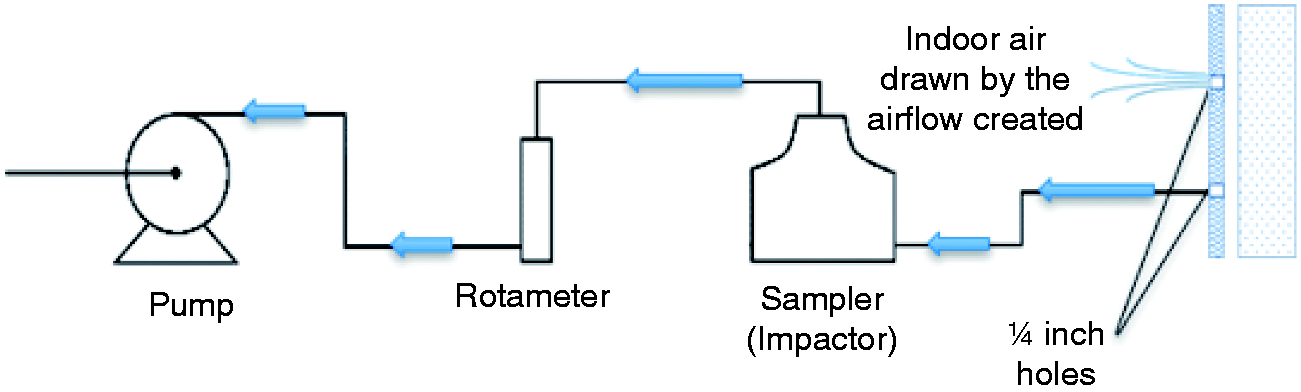
Schematic representation of suggested experimental equipment for the assessment of mould hidden behind internal wall insulation.
Efthymiopoulos et al. 30 have shown that the proposed method is potentially the way forward for the mould assessment in air gaps, but that the airflow pattern within the cavity is noticeably affected by the location of the perforated holes with strong implications on the recovery rate of mould spores, fragments and microorganism.
This study builds upon this previous work by further exploring, through computational fluid dynamics (CFD) analyses, the relation of the airflow pattern to the volumetric flow rate selected for sampling for the implementation of the method in real scale constructions for a set of different holes configuration. Thus, insight could be provided regarding the areas inside the examined space, affected the most or the least by the airflow. This study’s findings can inform inspectors of the most appropriate hole configuration and airflow rates for a correct assessment of fungal biomass present within a given cavity.
Methodology
A CFD analysis was carried out to develop an understanding of the effect of the holes’ location and the sampling flow rate to the airflow created by the pump's operation. A 300×300×3 cm box was modelled in Ansys Fluent to produce a geometry that well describes a full-scale wall air gap. All surfaces were simulated to be stationary walls. The air within the space was considered to be still at a pressure of 1 atm and a temperature of 15 °C. Two 6.35 mm holes were then defined at one of the surfaces to represent the airflow inlet and outlet. Four different configurations with regards to the hole location were examined (Figure 2). Cases 1 and 2 involved the perforation of two holes on the diagonal of the inner side of the wall with a distance between them of 2.8 and 1.4 m, respectively. On the other hand, in Cases 3 and 4, the holes were placed on the bisector of the same square surface, and the distance between the inlet and outlet was set to be 2 m and 1 m, respectively.
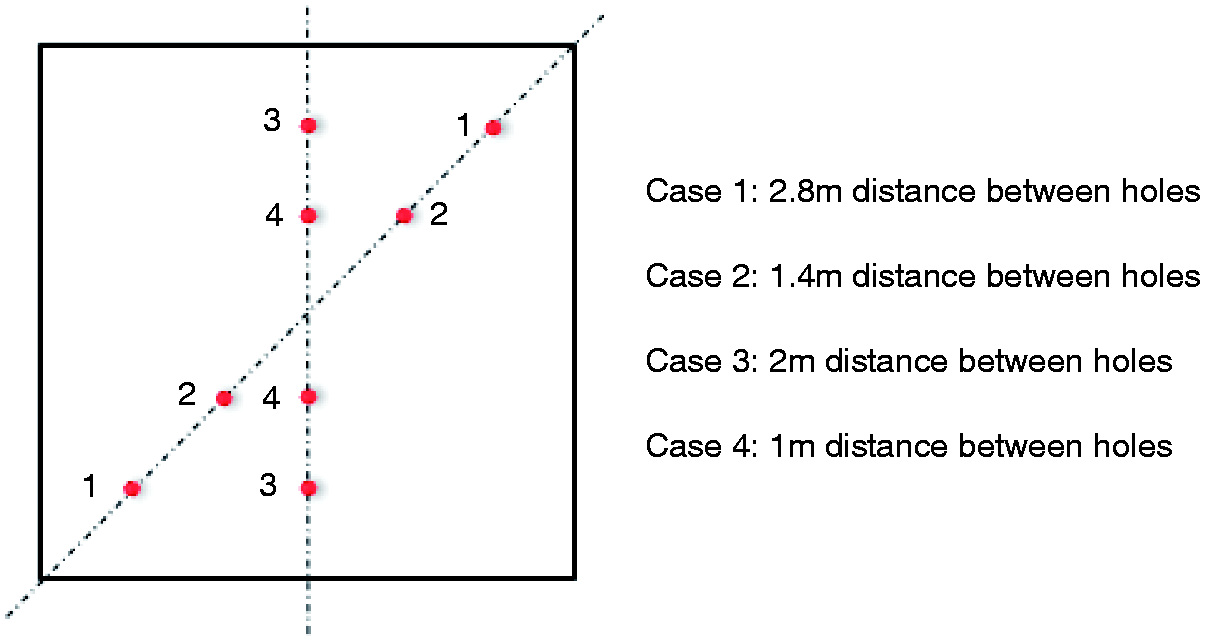
Representation of the location of the two holes in all four cases examined via a CFD analysis.
For each of the four different geometries, three simulations were carried out, each considering a different volumetric flow-rate at the outlet. For this set of simulations, the roughness height of the box’s walls was set to be 0 mm so that the surfaces are considered totally smooth. The airflow rate at the outlet was set to be 28.3 l/min, 20 l/min and 10 l/min, while in all cases, the inlet was set to be a pressure inlet at 1 atm. The specific airflow rate values were selected based on the airflow rates selected and tested by Efthymiopoulos et al.,29,31 who implemented the testing methodology on small scale experiments. It should be mentioned that the airflow of 28.3 l/min corresponds to the recommended by the manufacturer of the impactor. The other two airflow rates were selected so that the effect of lower flow rates on the sampling readings could be tested.
Considering that the texture of the material could potentially affect the airflow pattern created within the confined space, different sand grain roughness heights (ε) for the internal surfaces were introduced and studied through CFD modelling for all four geometries. Two different roughness heights were used to simulate the roughness of a totally smooth (0 mm) and a smooth concrete surface (0.04 mm), according to data provided by White, 32
The assumptions and boundary conditions applied in the CFD analysis are summarised in Table 1. Since the aim of the analyses was to develop a basic understanding of the airflow pattern, the velocity residual levels, which are indicative of the imbalance of the velocity in all control volumes created through the modelling process and contain information about the convergence of the iterative solution, were aimed to drop to a 1E-2 level.
Summary of all initial and boundary conditions along with the assumptions made for the CFD analysis.
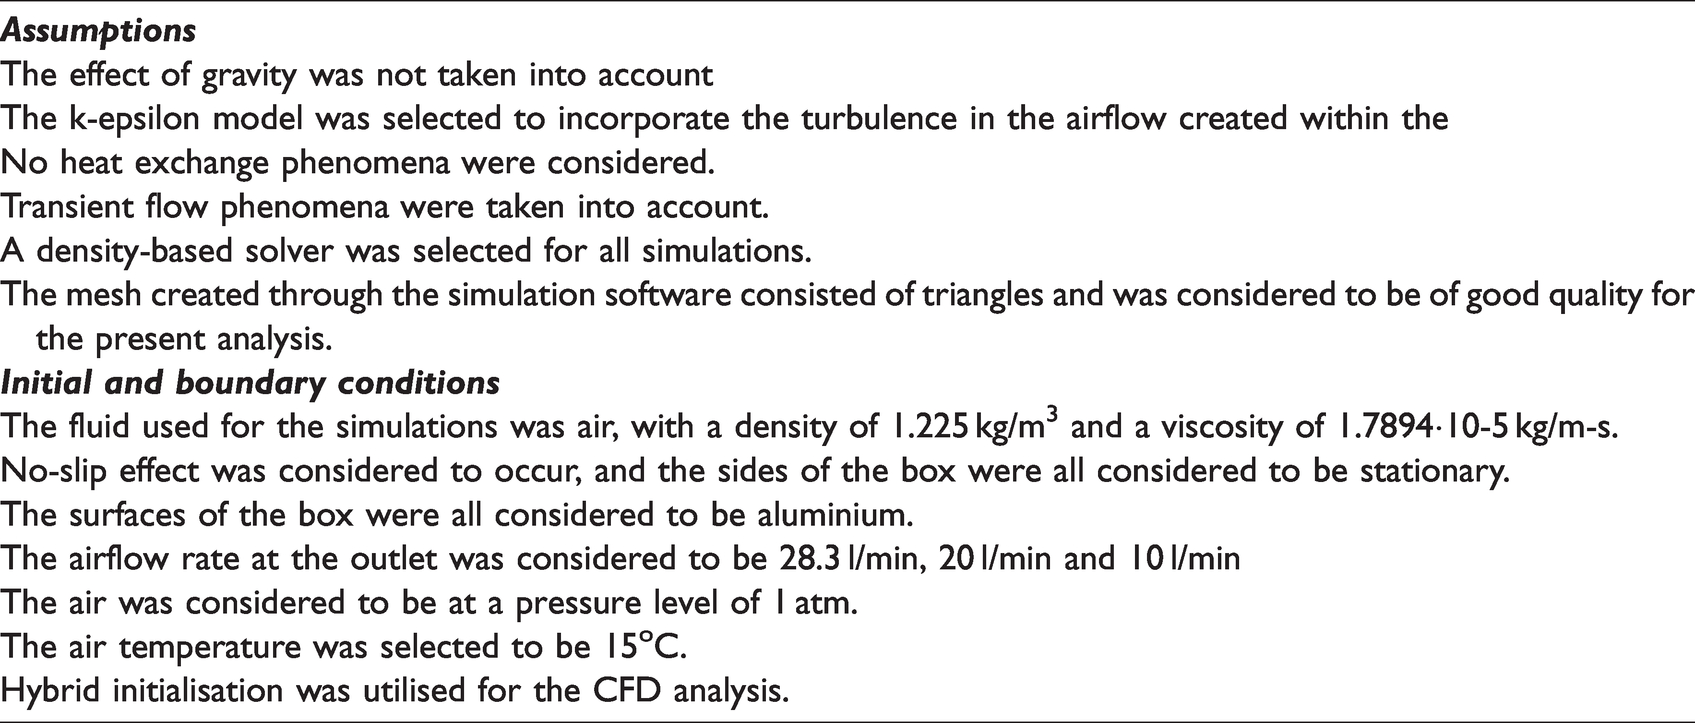
This study aimed to examine the effect of the holes’ configuration on the airflow pattern. To that end, some advanced calculations that might introduce a higher level of complexity to the problem were not carried out. The effect of the temperature on the airflow pattern was not considered; hence heat exchange phenomena were not studied.
Results analysis
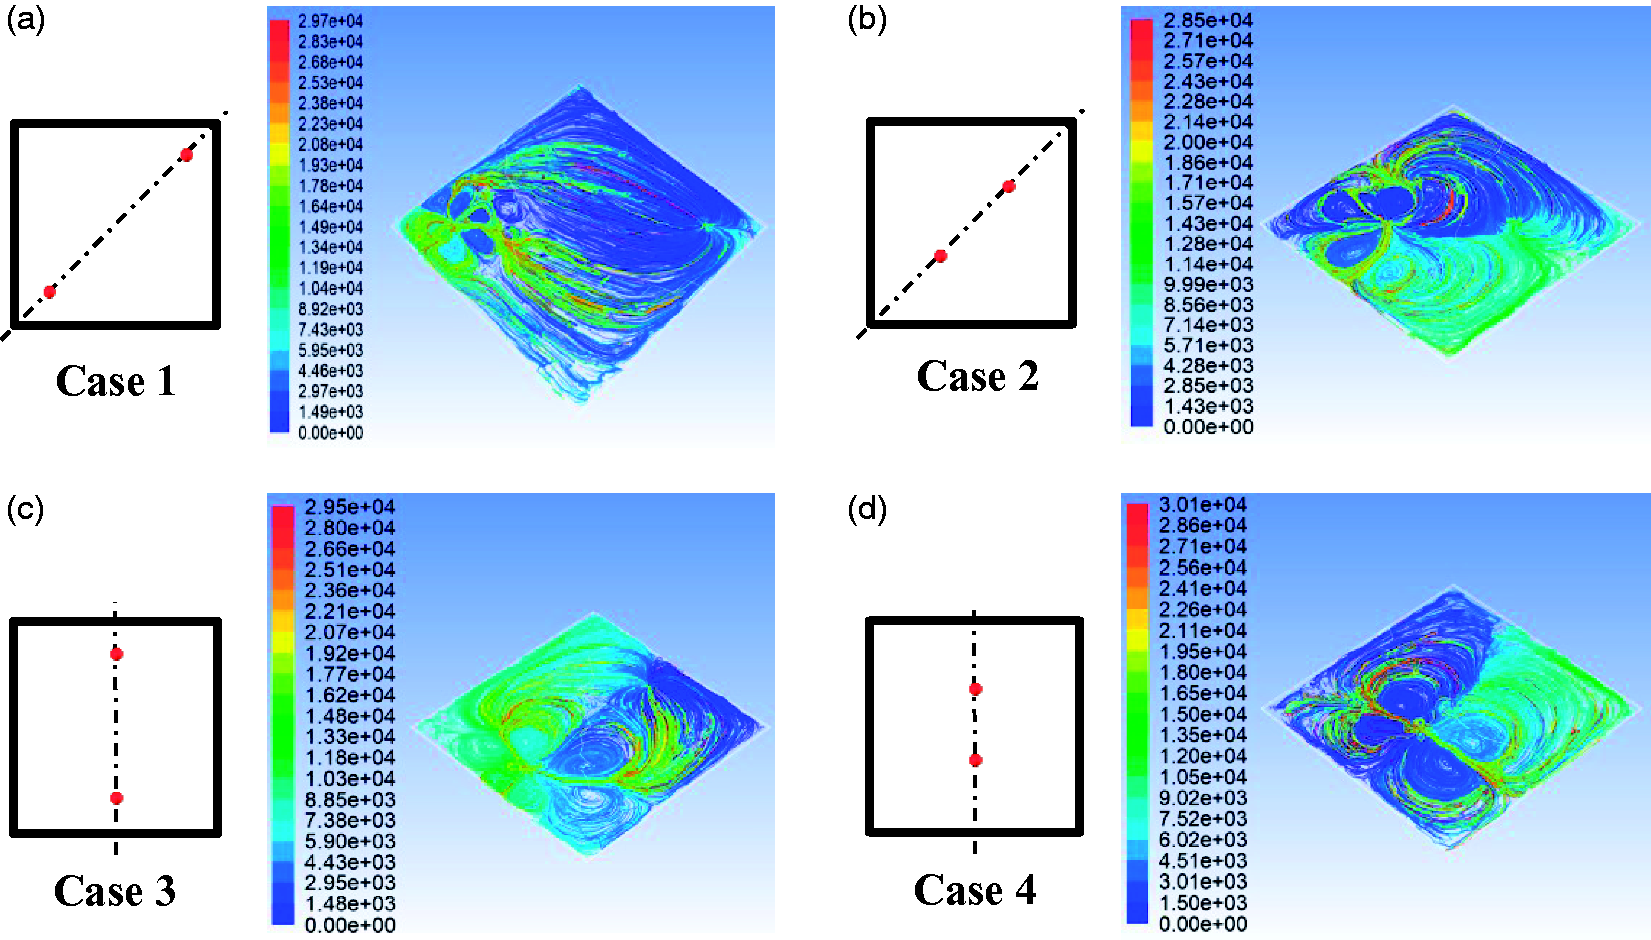
The airflow patterns for the four different hole configurations (Cases 1-4 shown in Figure 2) and three outlet airflow rates examined here (28.3, 20 and 10 l/min) are represented in Figure 3 below. Each figure represents the movement of the particles within the geometry modelled.
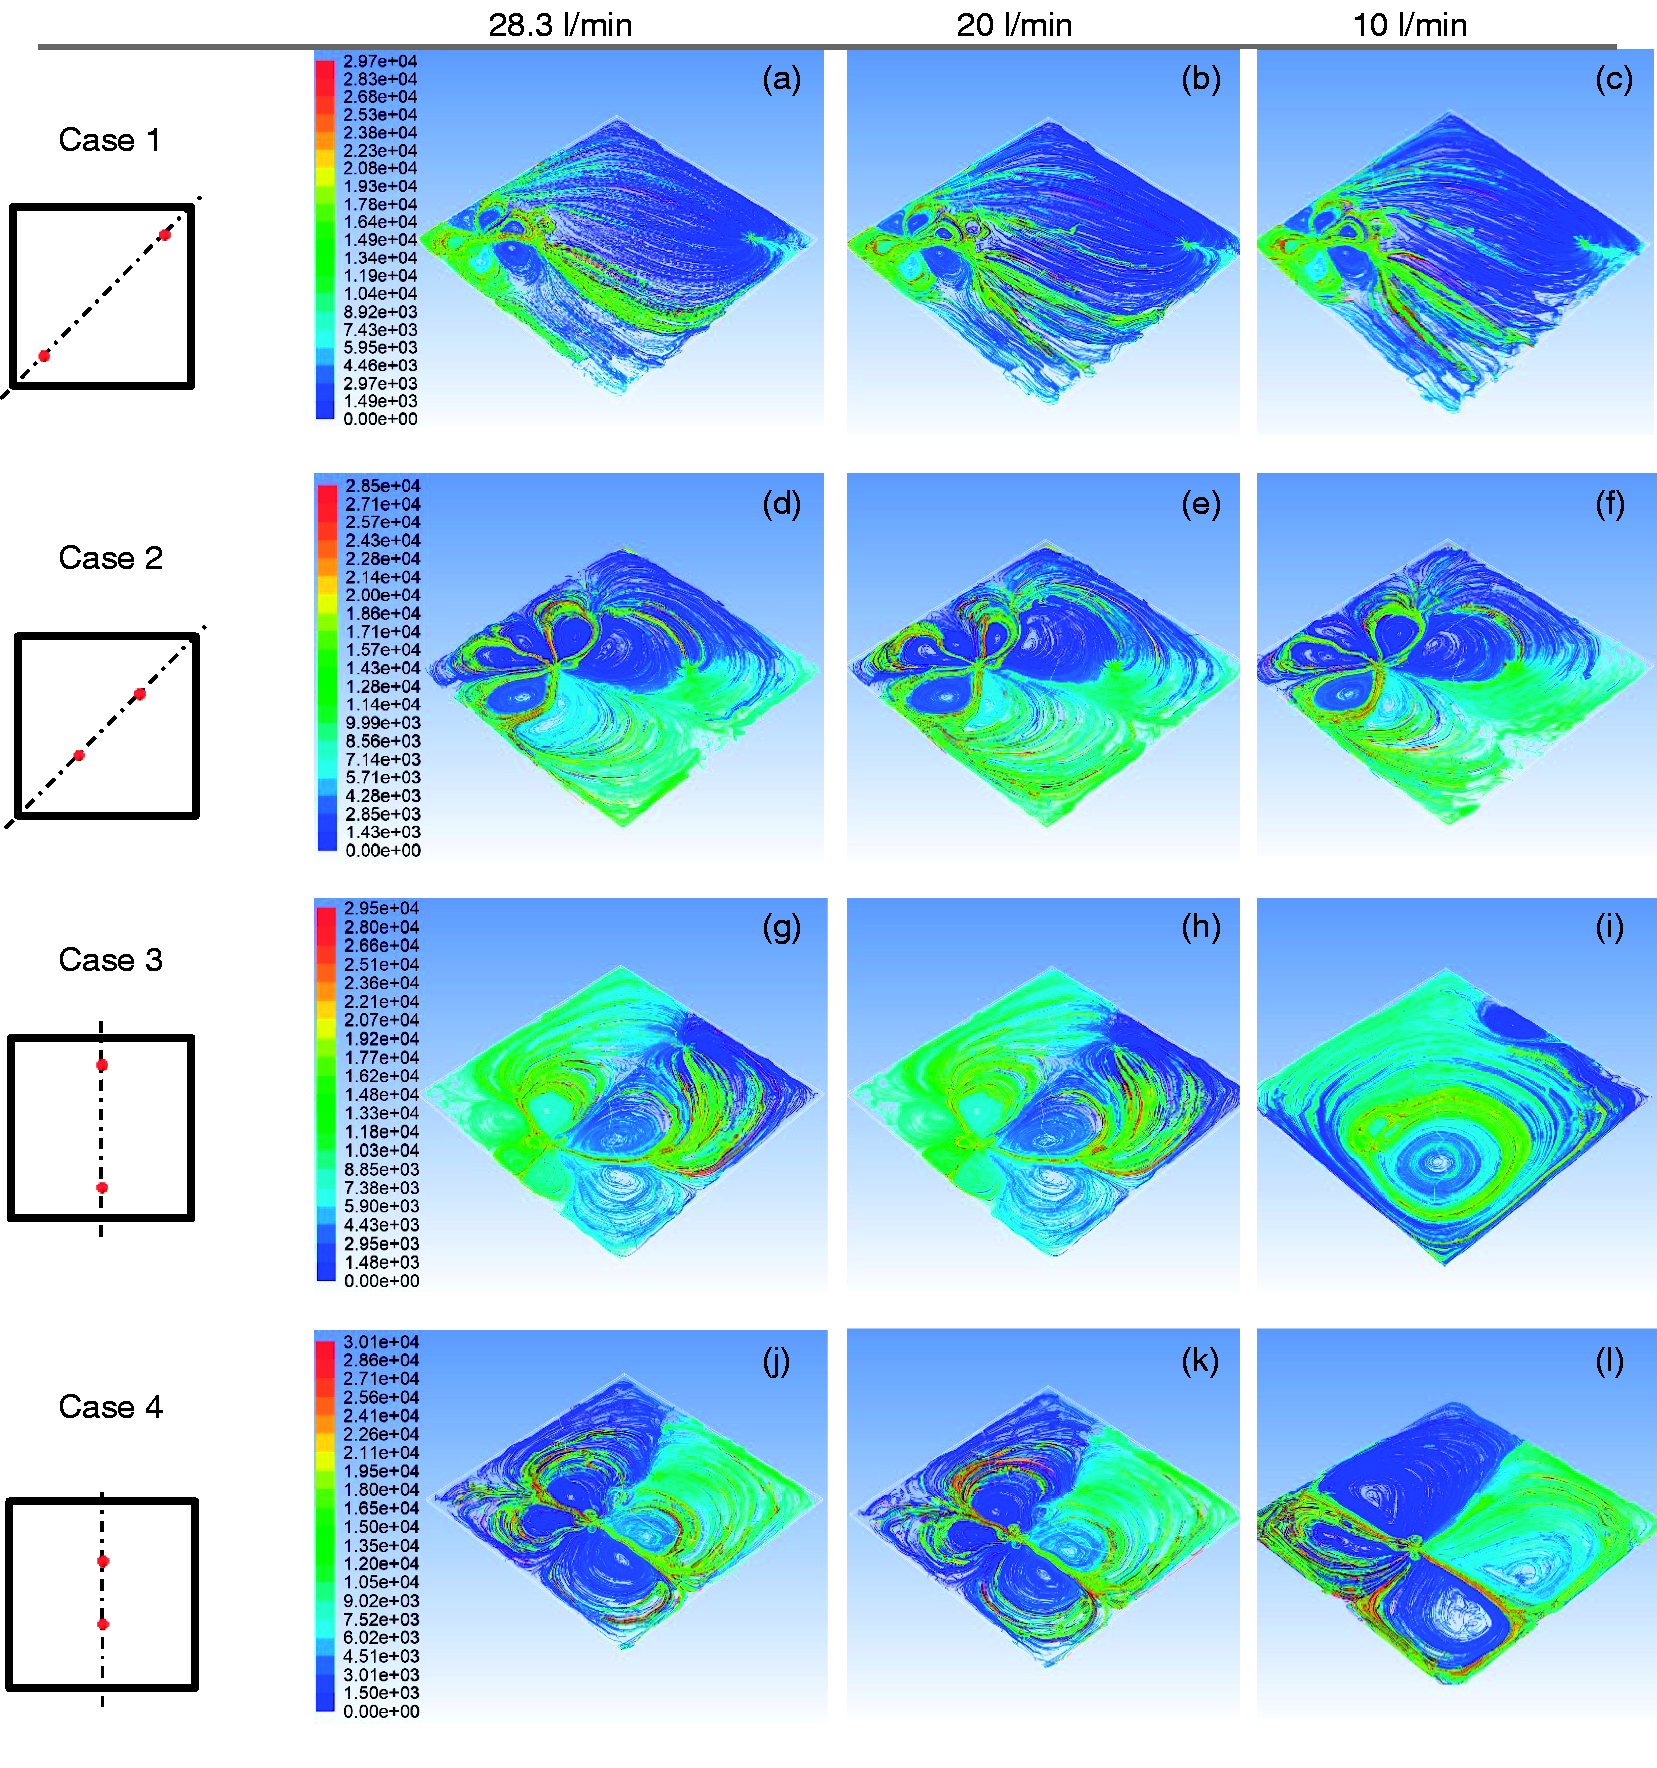
Representations of the airflow pattern for the four geometries analysed through CFD when the volumetric flow rate at the outlet was set 28.3 l/min, 20 l/min and 10 l/min.
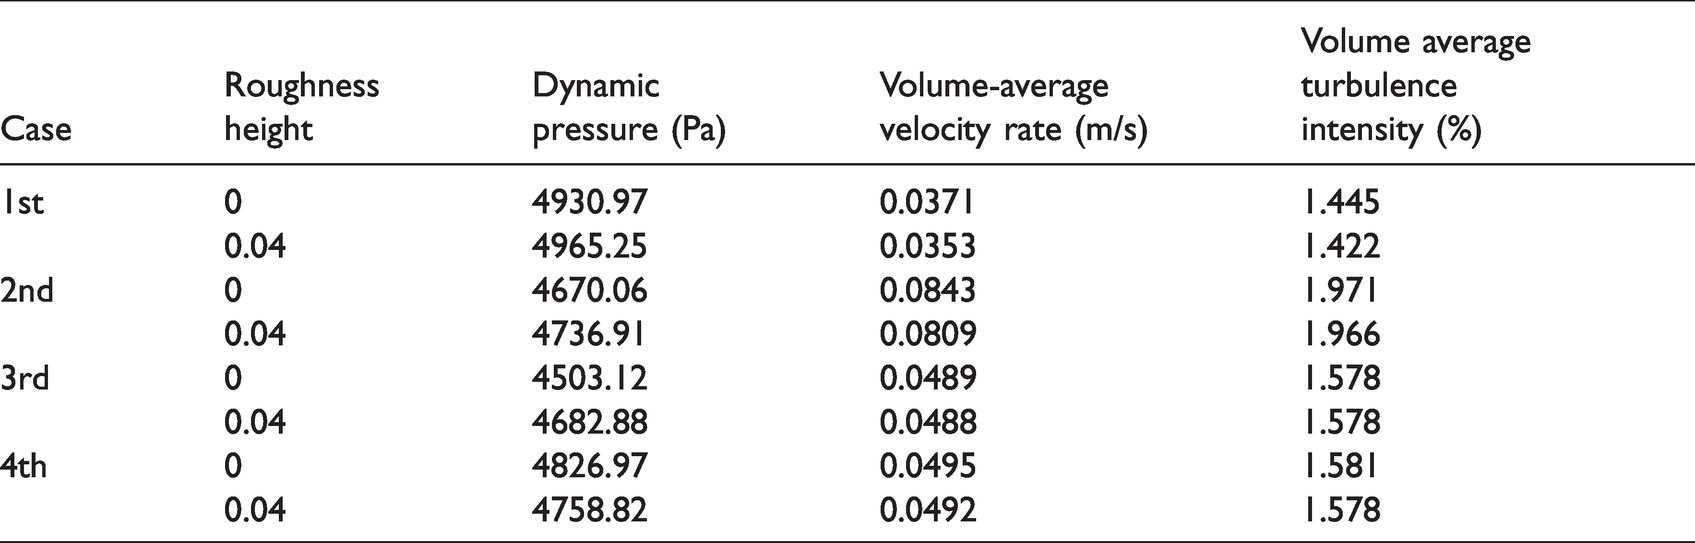
Each particle corresponds to one specific colour on the scale provided in each case. The results show that for Case 1 (Figure 3(a) to (c)) and Case 2 (Figure 3(d) to (f)) the difference in the volumetric flow rates did not noticeably affect the pattern of the airflow created within the cavity. On the other hand, with regards to the Case 3, Figure 3(g) to (i) indicates that the drop of the volumetric flow rate at the outlet from 20 l/min to 10 l/min results in major differences in the airflow pattern. Some variations in the airflow pattern were also observed for Case 4 (Figure 3(k) and (l)) when the flow rate was reduced from 20 l/min to 10 l/min. Furthermore, in Cases 3 and 4, no distinct differences were identified between the patterns when the flow rate was set to be 28.3 l/min and the corresponding ones when the rate was 20 l/min.The dynamic pressure applying to the simulated space walls, the volume-average velocity rate and the volume average turbulence intensity were examined for all cases and summarised in Table 2. With dynamic pressure being a measure of the force applied to a surface by the motion of the surrounding fluid, its study provides an understanding of the impaction potential of particles to the walls of the confined space. The results for Cases 1, 2 and 4 indicate that the dynamic pressure decreases when the volumetric flow rate reduced. However, the same pattern is not observed in Case 3, where the reduction of the flow rate from 20 l/min to 10 l/min resulted in an increase of the dynamic pressure value to a level even higher than the corresponding one for a flow rate of 28.3 l/min.
Summary of CFD results regarding of dynamic pressure, volume-average velocity and volume-average turbulence intensity number for different outlet flow rates.
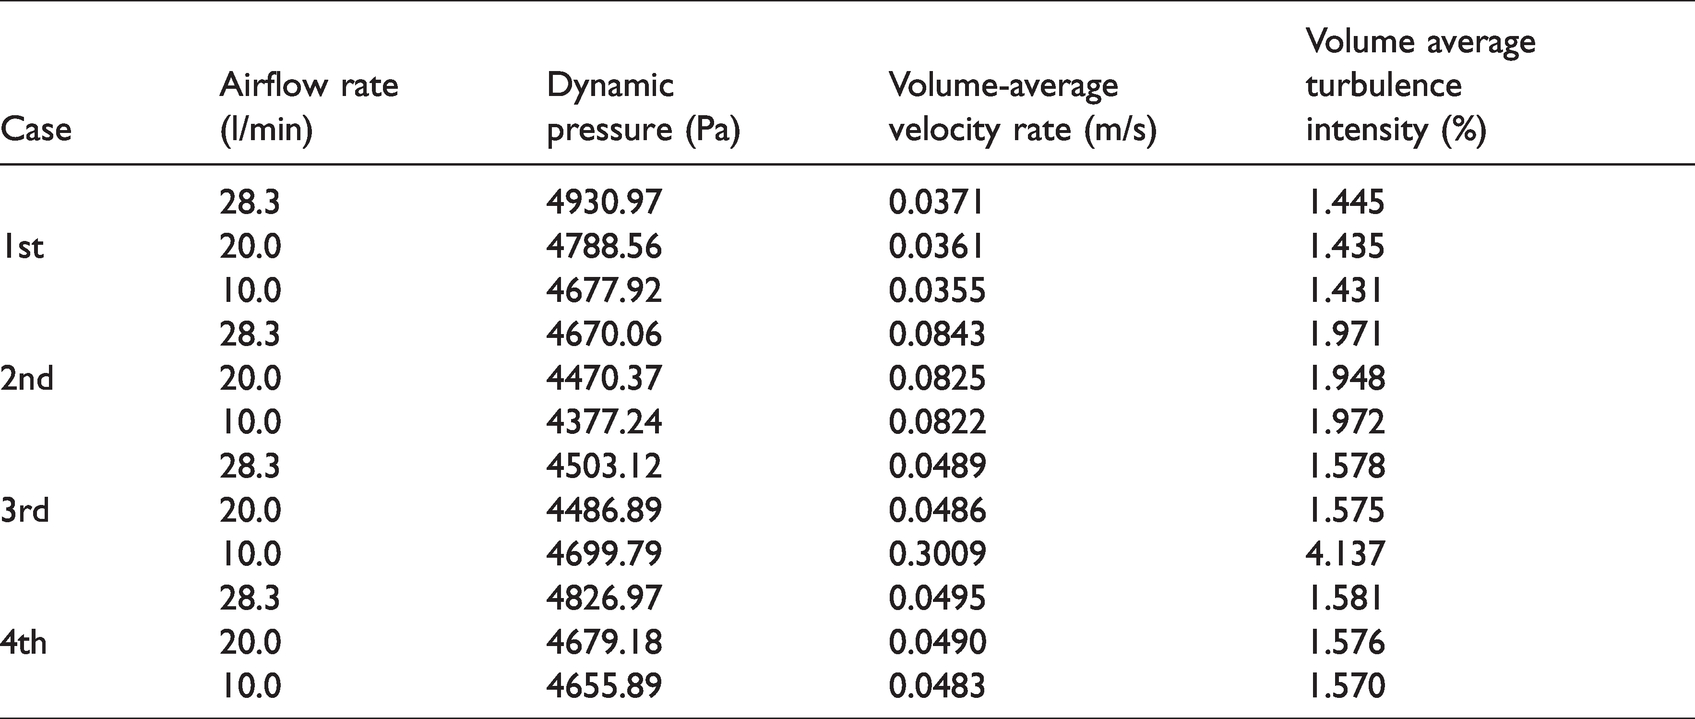
The volume-average air velocity rate indicates the volume-weighted average of the airflow velocity based on the velocity values calculated for each volume-cell created through the CFD simulations. For Cases 1 and 2, it can be seen that the decrease of the airflow rate led to a reduction of the volume-average air velocity. However, the same pattern was not observed in Case 3. Though the decrease in the volumetric flow rate from 28.3 l/min to 20 l/min led to a reduction of the volume-average air velocity, the decrease of flow rate from 20 l/min to 10 l/min did not lead to a similar outcome.
The turbulence created within the confined space was also examined to identify the velocity discrepancies observed in the volume-cell created through the simulations. The turbulence intensity values follow a similar pattern to the one with regards to the dynamic pressure. For Cases 1, 2, and 4, the reduction of the flow rate at the outlet was found to reduce the volume average turbulence intensity. However, the same trend was not observed in case 3. Along with the dynamic pressure and the volume average velocity, the turbulence intensity was found to increase after setting the outlet flow rate from 20 l/min to 10 l/min.
In all cases where no noticeable differences were identified between the airflow patterns, the reduction of the volumetric flow rate at the outlet from 28.3 l/min to 20 l/min and 10 l/min has led to a decrease of less than 7%, 6% and 1% in the dynamic pressure, the volume-average velocity rate and volume-average turbulence intensity respectively. On the other hand, the change in the airflow pattern led to considerable change in the trend mentioned above. Therefore, no general rule can be extracted regarding the effect of the air volumetric flow rate and the location of the holes on the dynamic pressure, volume-average air velocity and turbulence intensity values. The changes of the airflow features mentioned above are shown in Figure 4.
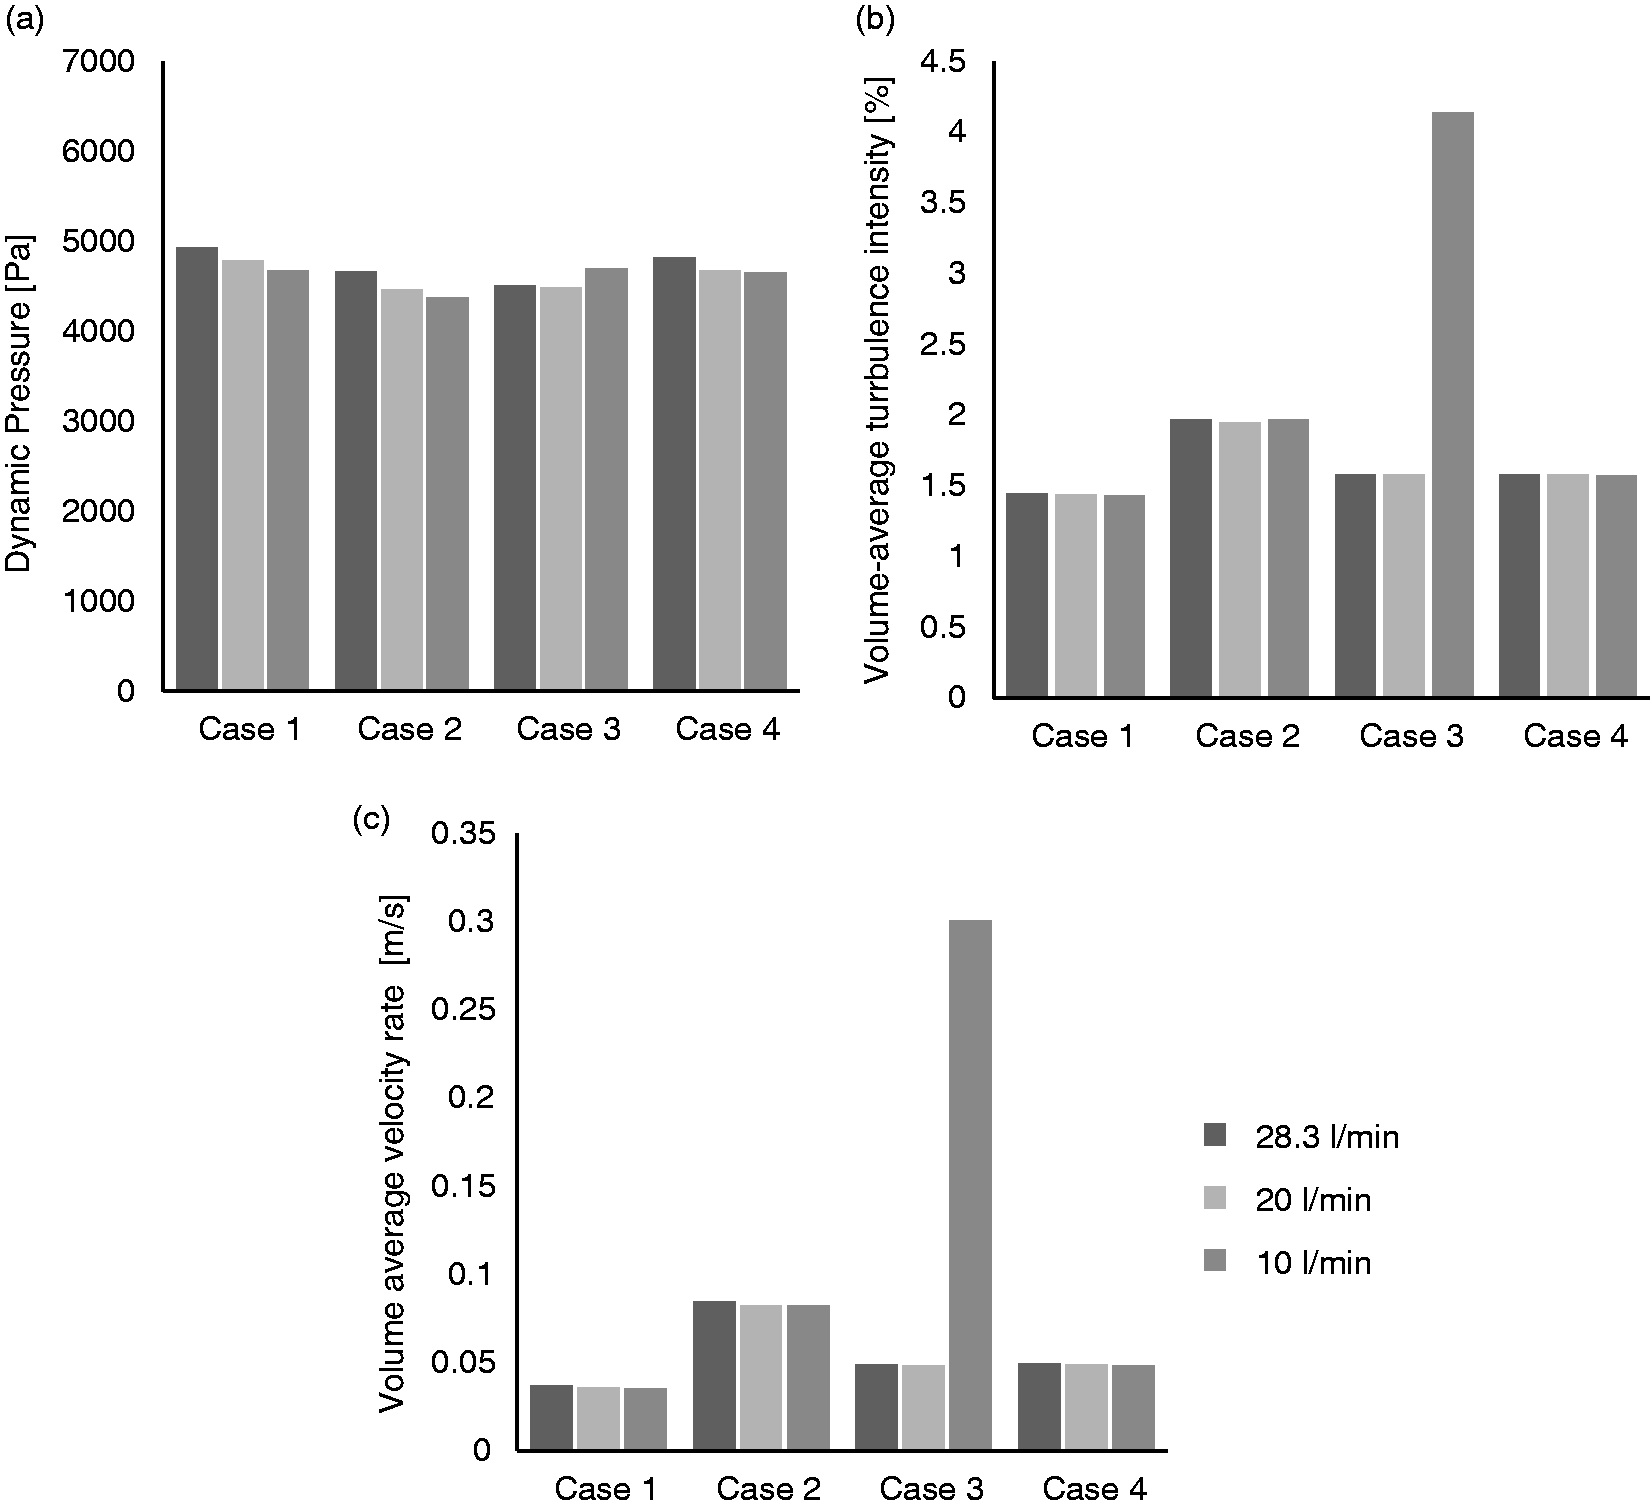
Results of dynamic pressure (a), volume-average turbulence intensity (b) and volume-average velocity rate (c) for each case examined through CFD.
The airflow patterns created when the flow rate at the outlet was set at 28.3 L/min and the roughness height for all four different hole configurations (Cases 1-4 shown in Figure 2) was set to be 0.04 mm and are depicted in Figure 5. The comparison between Figure 5 and the patterns from Figure 3(a), (d), (g), and (j), shows that the change of the roughness height has led to small variations in the airflow pattern near the inlet hole in Cases 1 and 2. On the other hand, the roughness height change seemed not to affect the airflow pattern in Cases 3 and 4.
Representations of the airflow pattern for the four cases analysed through CFD, when the roughness height was set to be 0.04 mm.
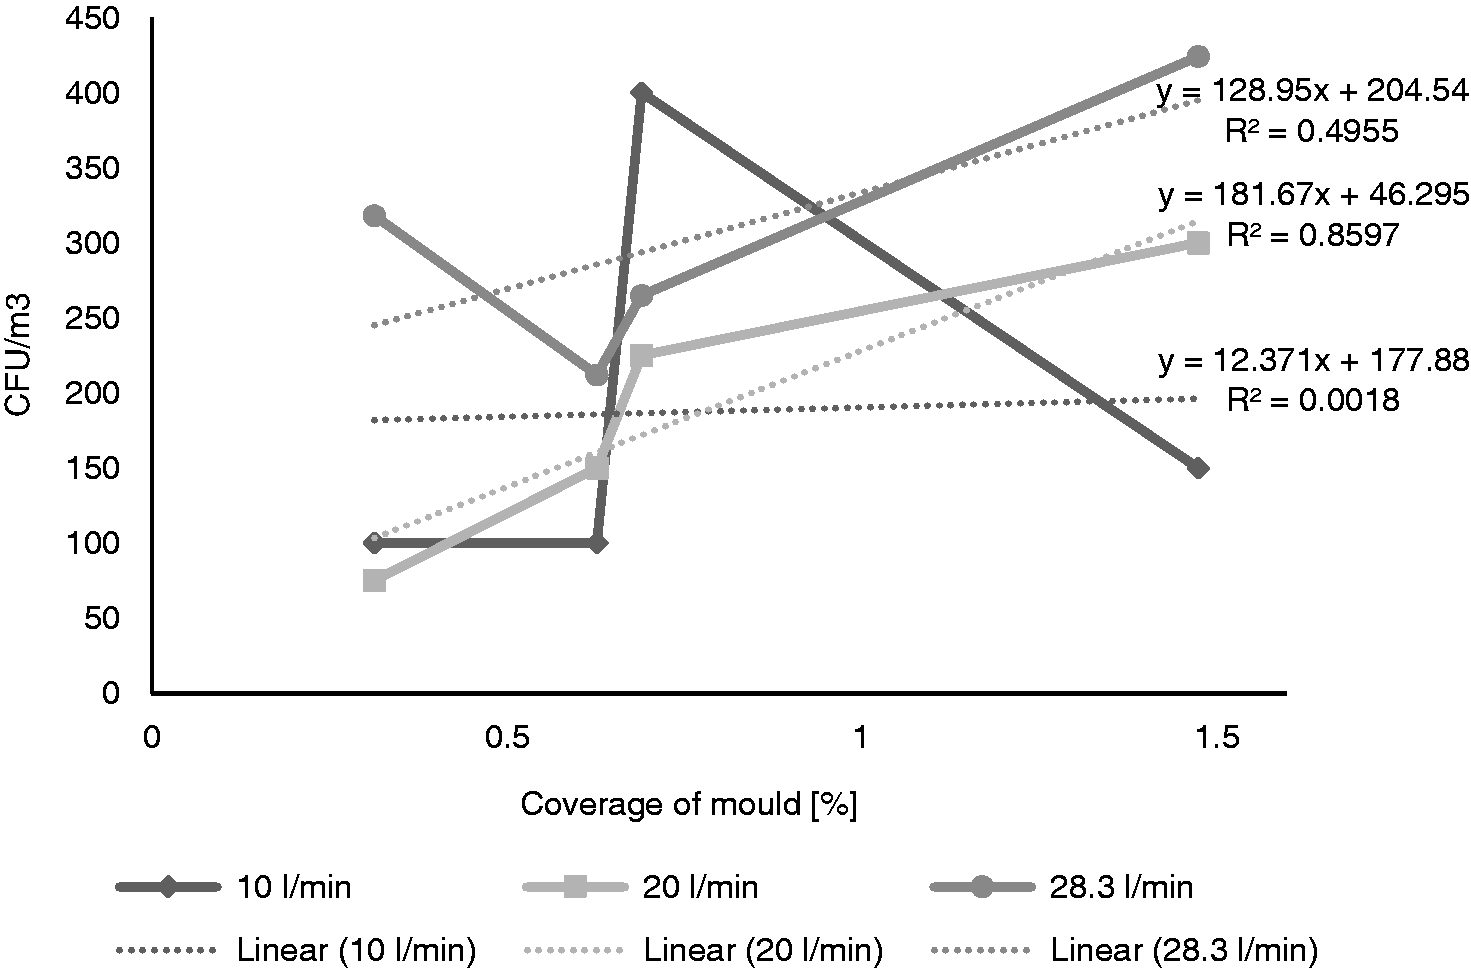
Results of CFU/m3 for the four different cases of mould coverage when the outlet flow rate is set to be 10 l/min, 20 l/min, and 28 l/min.
The results extracted by the CFD analysis for the increased roughness height indicate that the change of the dynamic pressure, the volume-average velocity rate, and the volume-average turbulence intensity was no more than 5% of the corresponding ones when the surfaces were simulated to be totally smooth. The dynamic pressure was found to increase by less than 4% in Cases 1-3, while a small reduction of approximately 1.5% was observed for Case 4. In all four cases, the increase of roughness led to an increase of the volume-average velocity rate, with the change being approximately 4.5% and 4% for Cases 1 and 2, respectively and less than 1% for Cases 3 and 4. It should be noted that in all cases, the volume-average turbulence intensity remained the same or decreased but did not deviate more than 1.6% from the values extracted when the roughness height was set to be 0. The results with regards to the variables mentioned earlier are summarized in Table 3.
Summary of CFD results regarding dynamic pressure, volume-average velocity and volume-average turbulence intensity number for different roughness heights.
Discussion
The collision of particles carried by an airstream to the surfaces that obstruct the airflow, leads to a change in their velocity and, therefore, in their momentum. This change is closely related to the fluid’s total pressure on the surfaces. The dynamic pressure is a measure of the force applied by the air’s motion under examination on the surfaces that obstruct the airflow streamlines. Hence, in the present study, the higher the dynamic pressure applied on the modelled geometry’s internal surfaces, the more likely it is that the suspended particles carried out by the airflow streamlines collide to these surfaces.
With respect to the interstitial mould assessment, the increase of the collision potential of particles to the internal surfaces of the wall with the increase of the dynamic pressure, could indicate a more frequent occurrence of the inertial impaction phenomenon. The phenomenon refers to the deviation of particles from the airflow streamlines due to their inertia and collision and attachment on surfaces other than the sampling medium, 33 leading to a smaller amount of captured fungal biomass. Hence, an increase of the inertial impaction frequency with an increase of the dynamic pressure could increase the recovery losses and consequently an underestimation of the fungal burden present in the air sample collected during testing.
The frequency of the phenomenon might also be connected to the turbulence created within the confined space. Table 2 shows that for Cases 1, 2 and 4, the reduction of the outlet volumetric flow rate results in a decrease of the weighted volume-average turbulence intensity. The only exception is Case 3, where the reduction of the flow rate from 20 l/min to 10 l/min led to an increase of the turbulence intensity. However, this observation might be connected to the flow pattern change. Nonetheless, the turbulence reduction is likely to reduce the frequency of the inertial impaction within the walls’ confined space.
The data given in Table 2 indicate that in all four hole configurations, a reduction of the volumetric flow rate at the outlet from 28.3 l/min to 20 l/min has reduced the dynamic pressure, the volume-average air velocity and volume-average turbulence intensity. A similar pattern was observed for Cases 1, 2 and 3 when the airflow rate dropped from 20 l/min to 10 l/min. However, a noticeable change was identified when the same airflow rate reduction was implemented for Case 3. In Case 3, an increase in the dynamic pressure, volume-average air velocity and volume-average turbulence intensity were identified, while some variations in the airflow pattern were observed compared to the ones where the flow rate was set to be 28.3 l/min and 20 l/min. Therefore, it can be inferred that depending on the location of the holes on the wall under examination, the selection of a sampling airflow rate of 10 l/min could lead to considerably different airflow patterns compared to the ones created when 20 l/min and 28.3 l/min flow rates are selected.
The changes in the trend regarding the features summarised in Table 2 when the airflow pattern changed, may explain the discrepancies in the sampling readings collected by Efthymiopoulos et al. 31 Their study considered small scale experiments to examine the effect of the flow rate on the sampling readings from a confined space for 4 different mould coverage cases. They used a 45 x 45 x 5 cm box containing agar plates with mould for different percentages of mould coverage on the 45x45 cm surface. The results of their experiments are shown in Figure 6. The data indicate an upward trend of the colony-forming units (CFU) per cubic metre of sampled air with the increase of mould coverage when the flow rate was selected to be 20 l/min and 28 l/min. On the other hand, no clear pattern can be seen when the flow rate at the outlet is set at 10 l/min, which is in broad agreement with the unstable flow patterns obtained through CFD analyses using this flow rate. The differences between the cases where the flow rate was set at 20 l/min and 28 l/min and the case where the flow rate was selected to be 10 l/min might be attributed to a change in the airflow pattern within the confined space. This change might be connected to changes in the dynamic and turbulence and thus changes in the frequency of the inertial impaction phenomena.
It should be noted that in both the CFD simulations and the small-scale experiments, the full extent of the effect of the texture of the material on the development of the airflow pattern was not studied. However, the material of the box used in the small-scale experiments has likely had some impact on the airflow pattern. In any case, the airflow pattern in real-scale constructions is sure to be affected by the building materials and the dynamic pressure is expected to increase with an increase of their roughness.
To the extent that the CFD analysis took into account the effect of the material’s roughness on the airflow, it was found that in all cases examined, the increase of the roughness height led to a decrease of the volume-average velocity rate, and no or a small reduction of the volume-average turbulence. On the other hand, in all cases except Case 4, the increase of the roughness height has led to an increase of the dynamic pressure. This particular increase could lead to the collision of an increased number of particles to the internal surfaces of the box, and thus cause a reduction of the volume-average velocity and turbulence intensity. However, the results from Case 4 constitute an exception to the rule. This might be attributed to creating an airflow where the particles follow a shorter circuit to the outlet due to the reduction of the volume-average velocity rate and the fact that the distance between the holes is half the corresponding one for Case 3 and less than 1/3 for Case 1. In any case, it should be noted that no specific trend was identified between the variables concerning the airflow and the location of the holes with the increase of the roughness height.
Conclusions
The present study was part of an exploratory research aiming to obtain insight on the applicability of air sampling for the assessment of interstitial mould in confined spaces such as air gaps between the IWI and exterior walls. To that end, the effect of the volumetric flow rate at the outlet and the holes’ location on the airflow pattern inside the confined space was studied. CFD analyses were carried out for scenarios based on four different inlet/outlet configurations and three different sampling flow rates (10 l/min, 20 l/min and 28.3 l/min).
From the analysis of the extracted data, it was observed that regardless of the hole configuration, maintaining the volumetric flow rate at the outlet between 20 l/min and 28.3 l/min did lead to stable airflow patterns within a 300×300×3 cm air gap. However, these flow rates increased the dynamic pressure, volume-average air velocity and volume-average turbulence intensity, more for certain hole configuration scenarios than the others. The study has shown that a cavity of a given size, using a higher outlet air flow rate (20-28.3 l/min), and inlet and outlets positioned at 1-1.4 m from each other (Case 2 and 4) would lead to the highest and most stable sampling potential. It was also found that the roughness height of the material has a limited impact on the airflow pattern and dynamic pressure, volume-average air velocity and volume-average turbulence intensity suggesting that the collection efficiency of particles through the implementation of the method is expected not to be affected considerably by the material roughness.
There are, however, some caveats on the general applicability of these findings. Though the effect of gravity, heat exchange phenomena and unexpected air infiltration through cracks to the airflow due to the suction of air from the indoor environment may be limited, the mentioned phenomena were not examined in this study. Simultaneously, though the effect of the texture of the material on the development of the flow was studied by incorporating the roughness height in the CFD simulations, the effect of the material properties such as the density and the porosity to the airflow was not studied. Consequently, the CFD simulations may not have incorporated all complexities taking place in real-scale scenarios, and future work should focus on deepening and validating findings reported here through a combined strategy bringing together more complex CFD simulations, monitoring and experimental work.
Footnotes
Declaration of conflicting interests
The author(s) declared no potential conflicts of interest with respect to the research, authorship, and/or publication of this article.
Funding
The author(s) received no financial support for the research, authorship, and/or publication of this article.