
Abstract
Negative pressure isolation rooms can accommodate and treat patients with highly infectious diseases (such as COVID-19). Airtight conditions in the isolation room protect against infectious diseases. To control airflow and minimize infection risk within the isolation room, this study proposes three exhaust outlet vents with three air change per hour (ACH) conditions, 12, 24 and 48 ACH, in a single-bed hospital room using a computational fluid dynamics (CFD) approach. Results show that using the same ACH air velocity is relatively unaffected by the type and location of the exhaust air vent. The current case, case 1 and case 2 had average velocities of 0.121, 0.130 and 0.116, respectively. When the ACH was increased to 48, the average velocity was decreased to 0.663 m/s in case 1 and 0.589 m/s in case 2, compared to 0.711 m/s in the current case. In terms of infection probability, the study found that in the scenario of 12 ACH, the infection probability for case 1 and case 2 was increased by 11.85% and 3.96%, respectively, compared to the current case. The exhaust air vent in case 2 could effectively prevent the spread of pollutants when it was set to 48 air changes per hour and had the lowest risk level at 10.11%.
Introduction
The interior environments of hospitals and healthcare facilities are characterized by a variety of elements due to the varying needs of patients and healthcare workers. General ward rooms, isolated rooms and operating rooms are examples of indoor environments. 1 As a result of the recent pandemic of coronavirus disease 2019 (COVID-19), healthcare facilities have been a prime location for airborne transmission due to the high density of communicable and highly susceptible individuals. 2
The COVID-19 pandemic has underscored the critical role of an isolated room in hospitals for containing the spread of the virus. Despite the commencement of mass vaccination operations in most countries almost 2 years after COVID-19 emerged, many societies and nations are still grappling with the pandemic’s outbreak.
3
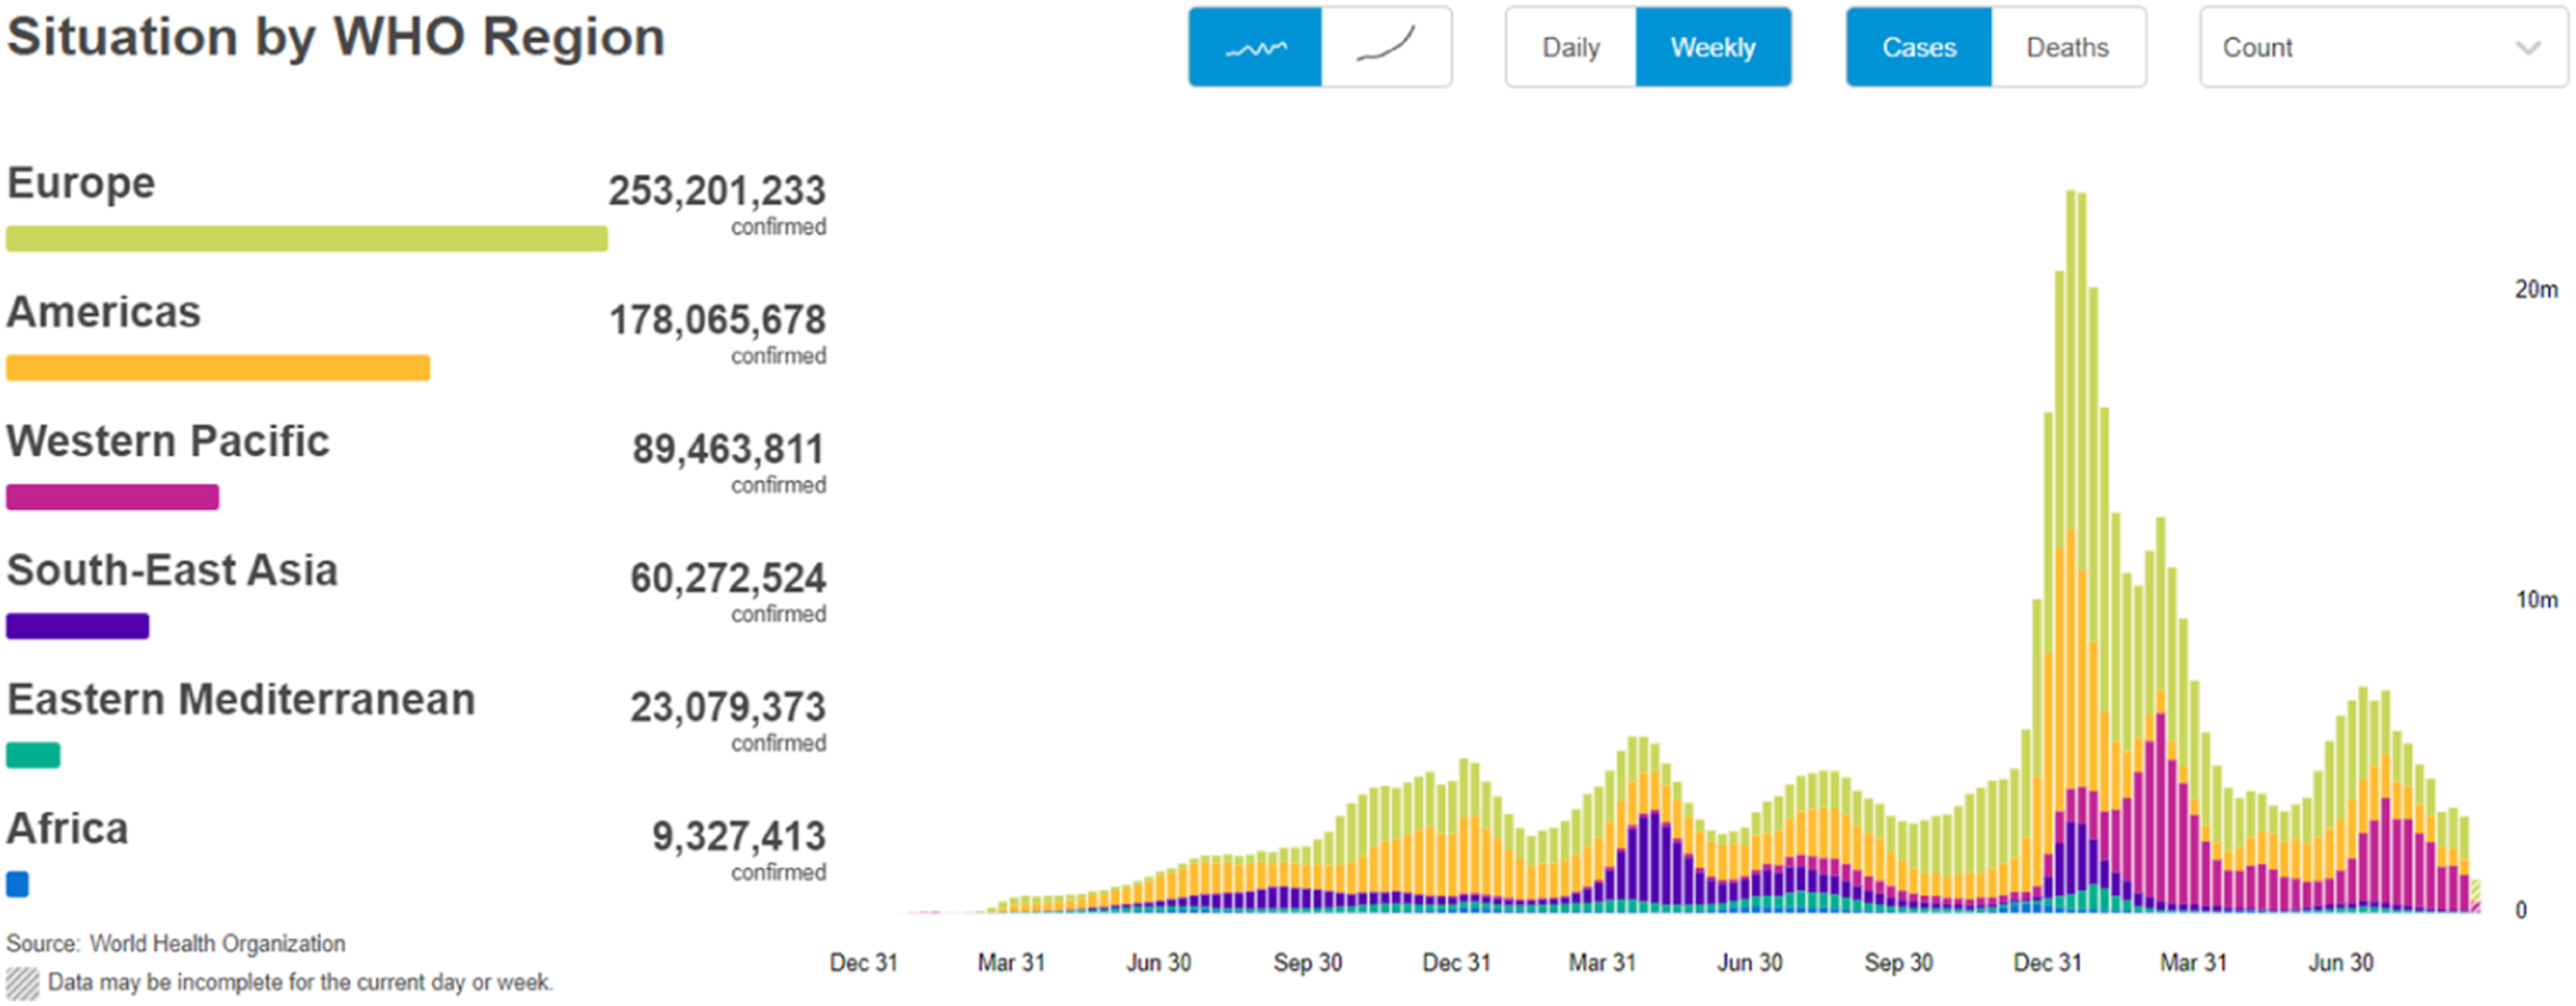
The ongoing COVID-19 pandemic has resulted in an enormous toll of morbidity and mortality worldwide. According to a report by the World Health Organization (WHO),
2
as of 28 September 2022, there were 613,410,796 confirmed cases of COVID-19, resulting in 6,518,749 deaths globally, as shown in Figure 1. By 13 March 2023, the number had surged to 760,361,956 confirmed cases and 7,117,477 deaths, representing an increase of 146,950,160 confirmed cases and 354,728 deaths. Medical agencies have reported that even physicians have succumbed to the virus.
4
Ing et al.
5
found that as of 4 April 2020, 198 physicians had died from COVID-19 in six countries. Therefore, the importance of an isolated room cannot be overemphasized as a key strategy for mitigating the transmission of COVID-19 and safeguarding public health. Globally, as of 28 September 2022, 613,410,796 confirmed cases of COVID-19, including 6,518,749 deaths.
2
Many reasons were cited, including hospital readiness in terms of protective equipment and ventilation system, which can help with disease removal. 6 Ventilation systems are an essential aspect of hospital and healthcare facility design due to the unique needs and requirements of hospital physicians, nurses and patients. These needs and requirements arise from their interactions with the indoor environment in various ways. Properly designed ventilation systems are critical to maintaining a safe and healthy environment in hospitals and other healthcare facilities. 7 In hospitals, ventilation design requires greater considerations than in most buildings, as it has a critical role in maintaining proper thermal comfort and indoor air quality for both patients and staff. Further investigation of ventilation strategies should be looked into and developed to mitigate infection risk with the consideration of thermal comfort and energy conservation.8–10
The hospital indoor environments vary from simple outpatient rooms to very complex rooms like intensive care units. The hospital design is complex, with a wide range of services and functional units. 11 Furthermore, the current pandemic of COVID-19 confirms a strong probability of airborne transmission by gathering vulnerable people in the hospital.12,13 Therefore, ventilation should be addressed simultaneously during the design stage.
Many studies confirmed that ventilation systems are an essential aspect of hospital and healthcare facility design due to the unique needs and requirements of hospital physicians, nurses and patients. These needs and requirements arise from their interactions with the indoor environment in various ways, including the need for safe and healthy air quality to prevent the spread of infectious diseases. Many indoor air quality issues can arise in hospitals, such as the presence of harmful airborne particles, unpleasant odours and high humidity levels, which can lead to discomfort and even health problems. Properly designed ventilation systems are critical to maintaining a safe and healthy environment in hospitals and other healthcare facilities, not only for patients but also for physicians and other healthcare workers who spend long hours working in these environments.14–16 In usual practice, the ventilation system for indoor spaces is determined by building regulations, specifications and codes that local authorities usually publish. These regulations differ from country to country, depending on the location, climate, culture, economy and special needs.
There are many benefits of indoor environmental control in hospitals, including wards, operating rooms and theatres. However, there is a need for ventilation investigations in the shared room or open facilities.
In general hospital wards, inadequate ventilation strategies contribute to an increase in infection rates. There is a general assumption that increasing the air change rate (ACH) will reduce infection risk. 17 In spite of this, some studies have demonstrated that the risk of infection can increase with an increase in ventilation rates due to an inappropriate ventilation strategy.18–22
The COVID-19 inpatient wards have specific ventilation requirements that are different from those of general hospital wards. An isolation room should be provided in the inpatient ward for COVID-19 patients to be subjected to negative pressure. Ideally, there should be a minimum of 12 ACH. 23 It is important that the isolation rooms have their windows sealed and self-closing doors should be installed in all rooms. An air filtration system should be installed in all outlets in the wards. Healthcare workers require a large amount of fresh air in their rooms, and pollutants should be collected at the outlets in the ward in an ideal ventilation strategy. Air filtration systems are capable of collecting pollutants in the air and disposing of them in a proper way.
The transmission of airborne contaminants between occupants in an indoor space is usually investigated using computational fluid dynamics (CFD) methods. Over the last few decades, CFD has become a more popular tool for analyzing indoor environments due to the advancement of computational techniques.24,25 There is an equation known as the Navier–Stokes equation that describes the airflow in a room quantitatively in CFD simulations. These equations are coupled differential equations that mathematically describe the flow in a room. Several types of turbulence models, such as k-ε, SST k-ω and v2-f, are required to simulate general airflow, such as a ventilated room. Several turbulence models have been validated with the help of benchmark experiments conducted by several researchers.26,27 As a result of these validations, CFD simulations have been extensively applied to many investigations of indoor air environments. The velocity, 28 CO2 and temperature 17 of indoor airflow were predicted by CFD simulations in some studies. As part of their study on contaminant flow in the microenvironment around people, Nielsen’s group performed many studies on wards simulations.29,30
An isolation room in a hospital was investigated by Cheong and Phua. 31 According to their study, the supply grilles located in the ceiling and the exhaust grille positioned next to the bed offered the most effective removal of pollution. Satheesan et al. 32 studied ventilation strategies in relation to infection risk reduction in general inpatient wards using numerical methods. As outlined by Xu et al., 7 multi-industry cooperation is necessary to fight COVID-19, including the medical industry, transportation, logistics, government and technology manufacturers. A virus control process includes (1) isolation of suspected and confirmed patients, (2) restriction of virus spread and (3) tracing the virus’ origin. In response to these urgent concerns, this paper attempts to examine the airflow patterns in an isolated hospital room using three different exhaust outlet vents with three different ACH conditions (12, 24 and 48 ACH) to control airflow and minimize infection risk within the room.
Materials and methods
The methodology of this study is split into two main phases as follows:
Study design
The configuration of the studied model is depicted in Figure 2. The room maintains negative pressure and has a dimension of 3.0 m (width), 2.4 m (height) and 3.0 m (length) on the X, Y and Z axis, respectively. To maintain the negative pressure inside the room, the isolation room door is designed with an air supply opening at the lower side as highlighted with blow arrows in Figure 2. A patient was placed on a bed at 0.6 m above the floor in the isolation room with a heat flux of 60 W/m2,
33
and 40 W/m2 of four fluorescent lights (10 W/m2 per one fluorescent light).
34
As shown in Figure 1, both sides of the bed were occupied by healthcare workers and medical equipment with heat dissipation of 60 W/m2 for the healthcare workers and 75 W/m2 for the medical equipment.
35
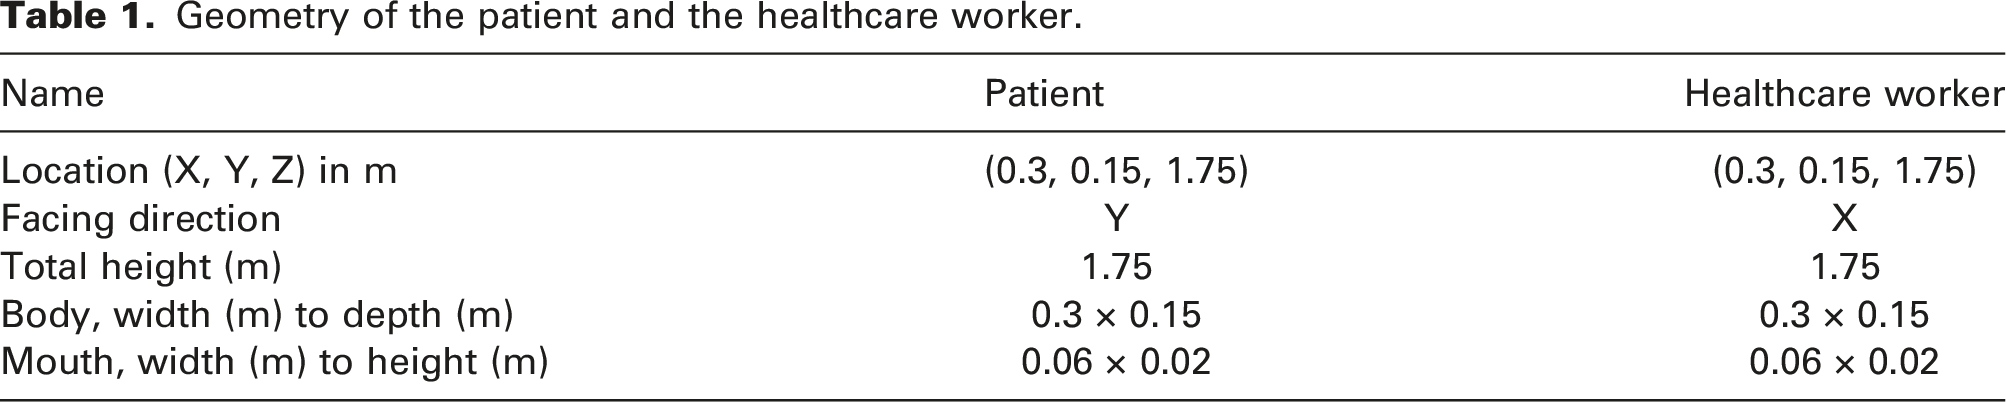
The geometrical information of the patient and the healthcare worker are shown in Table 1. Isometric view and details of the computational grid of the isolation rooms with different exhaust air vent locations (highlighted with red arrows): (a) current case, with exhaust air vent from the ceiling, (b) case 1, with exhaust air vent on the wall, and (c) case 2, with exhaust air vent surrounding the patient bed in ⋂ shape. Geometry of the patient and the healthcare worker.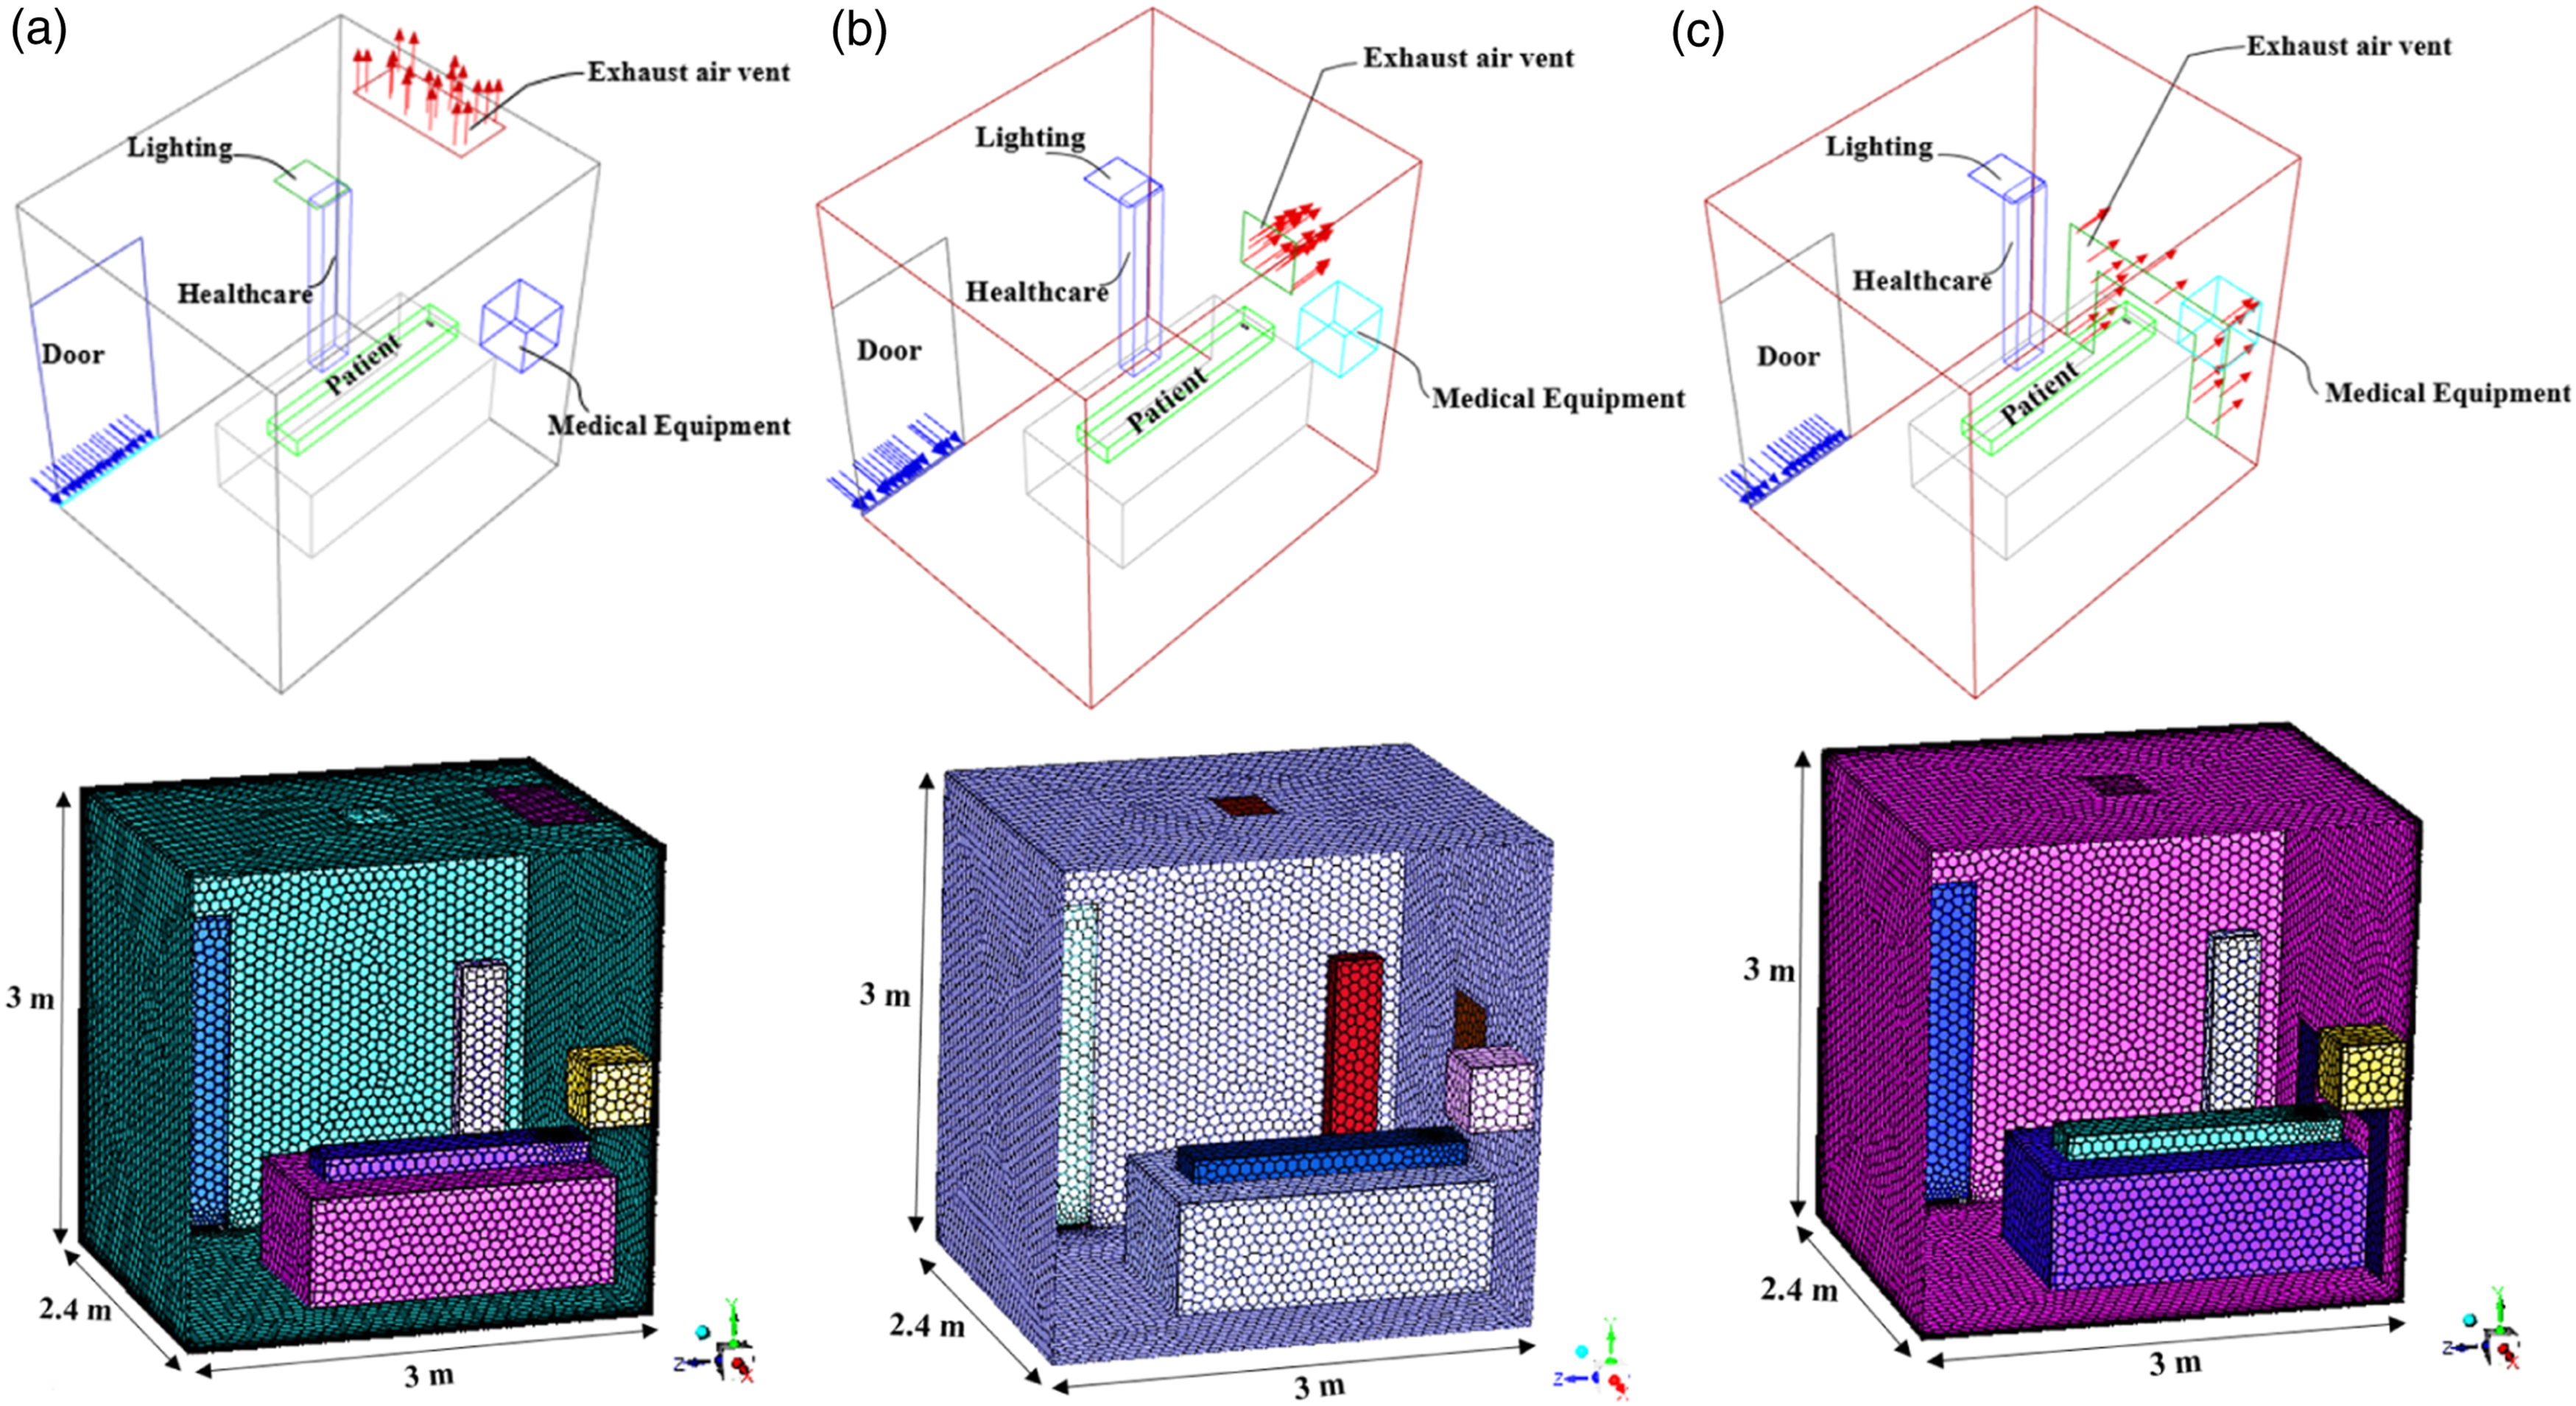
The gas released into the room was assumed to be air only, and it was released from the lower side of the door with a temperature of 20°C. The temperatures of the supplied outdoor air and persons were assumed to be 20°C and 37°C, respectively. The velocities at the supply air vent in the cases of 12, 24 and 48 ACH were simulated as a mass flow rate of 0.091829, 0.183658 and 0.367315 kg/sec, respectively. The mass flow rate of the supply air vent was calculated from the air change rate (ACH) by using equation (1):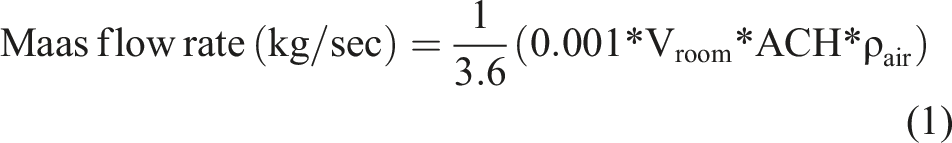
At the supply air vent (lower side of the door), the boundary condition of the mass flow velocity inlet was defined. A patient’s mouth was assigned as the boundary condition of the velocity inlet. By using boundary condition of the velocity inlet, the mass flow into the domain was computed and the fluxes of momentum, energy and species were measured. Ambient pressure was the measurement of pressure at the exhaust air vent. At the exhaust air vent, the boundary conditions of the pressure outlet were established. Fluent was used to extrapolate all other conditions from the interior of the domain at pressure outlets, where the boundary condition pressure input was utilized as the static pressure of the fluid at the outlet plane.
An exhaust air vent was used to specify the boundary condition of the pressure outlet. In order to extrapolate all other conditions from the interior of the domain, Ansys was used to interpret the boundary condition pressure input as the static pressure of the airflow at the outlet plane. In the model room, all boundary walls were assumed to be adiabatic. Moreover, the fluid’s characteristics were assumed to be continuous and incompressible, and the airflow was considered to be transient and three-dimensional. The transient simulations were run for a total of 100 s at a uniform constant time step of 0.01 s. For all the governing equations except the energy, the convergence criteria in this study identified that the scaled residuals were below 10−5, while the scaled residuals for energy were less than 10−6.
Numerical study
The CFD simulation software 36 was used to estimate the room airflow distribution, pattern and concentration fields in this study. The accuracy of the simulation could be improved by using a reliable turbulence model, numerical scheme and numerical method. The air distribution in the isolation room was simulated using a pressure-based solver with an absolute velocity formulation for the three ventilation systems. The governing equations were solved sequentially using the solution algorithm used by the pressure-based solver (i.e. segregated from one another). Due to the non-linearity and coupling of the governing equations, an iterative solution loop was required in order to get a converged numerical solution.
(SST) k-ω model
In this study, the shear-stress transport (SST) k-ω model, available in the Ansys CFD simulation software, was utilized.
37
The main features of the k-ω and k-ε models were combined in this hybrid model. In order to represent the turbulence flow in the boundary layer, k-ω equation models were also employed. The (SST) k-ω model was used instead of the k-ε model in the layers that are further from the wall because the (SST) k-ω model is more sensitive to the turbulent values in the free flow. In addition, this model is less sensitive to inlet conditions of a magnitude characterizing turbulence and models turbulence in the free flow well.
38
The desired characteristics of both modules were combined into one model, taking advantage of the fact that the standard k-ε model may be transformed into equations for k and ω due to the fact that ω is the appropriate dissipation of the kinetic energy of turbulence, thus ω = ε/k. The equations of this model are then multiplied by a function which has a value of 1 in free flow and 0 at the wall, while the standard k-ω model equation was multiplied by the function F1.
38
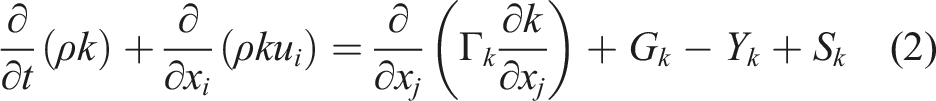
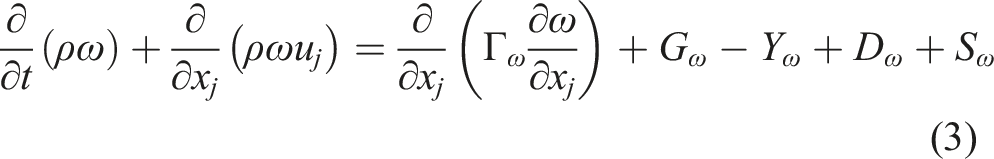
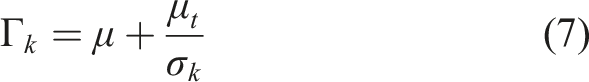
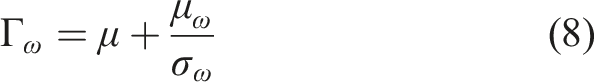
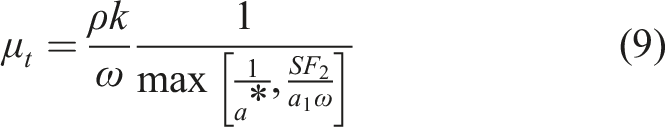
The turbulence kinetic energy, k, and the specific dissipation rate, ω, were obtained from transport equations (2) and (3): 1. Turbulent kinetic energy 2. Dissipation of turbulent kinetic energy

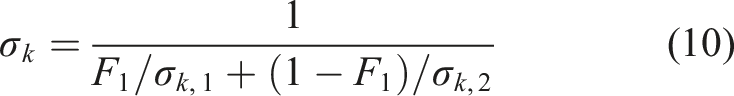
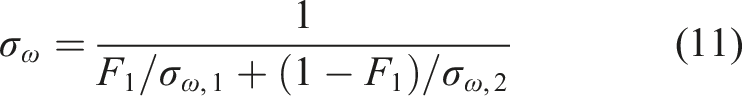
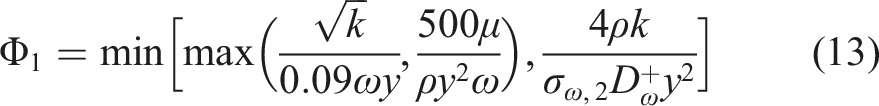
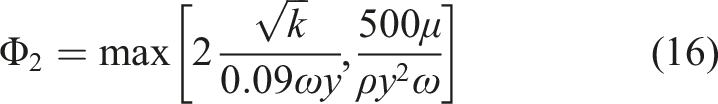
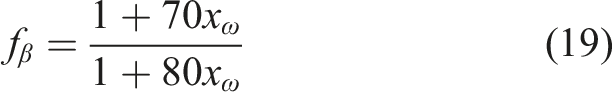
The blending functions, F1 and F2, were determined by equations (12)–(16):

Y
k
and Y
w
represent the dissipation of k and 

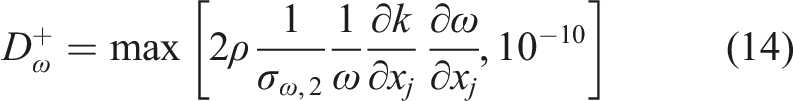
D
w
represents the cross-diffusion term, calculated as described by equation (20) below: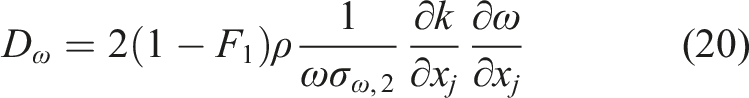
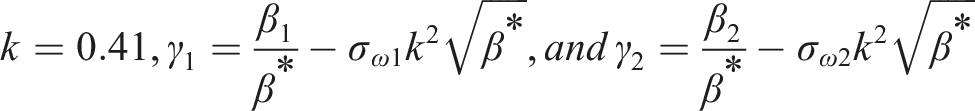
Model constants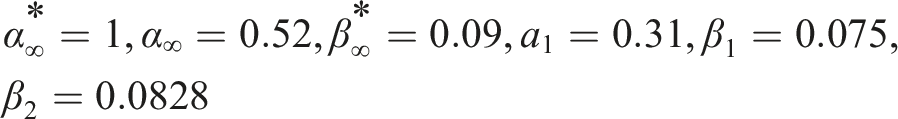

Numerical sensitivity analysis
Grid option for the grid-independent test.
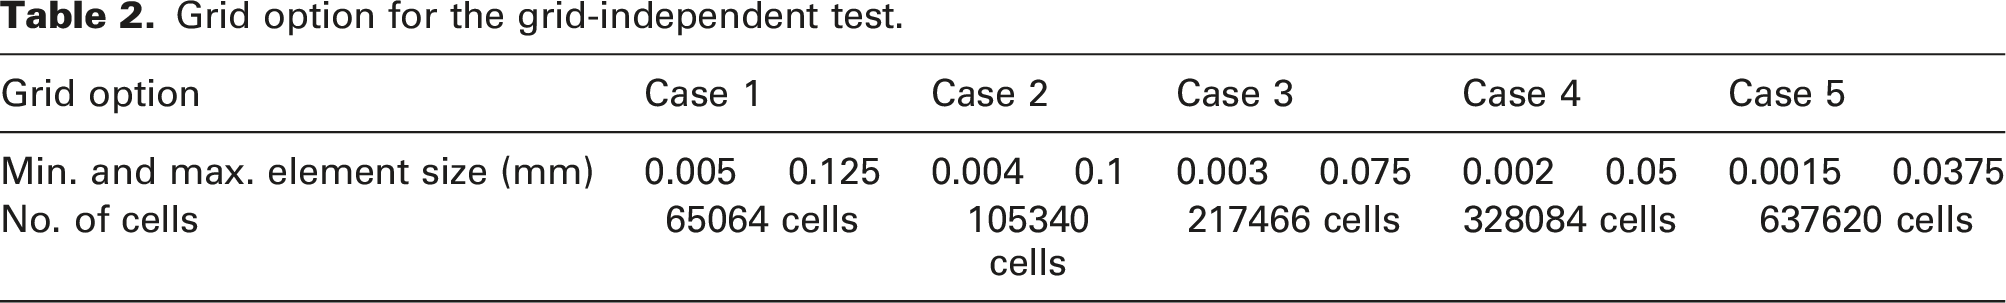
In order to perform the gird sensitivity study, five grid densities were investigated: grid cells case 1 with 65,064 cells, grid cells case 2 with 105,340 cells, grid cells case 3 with 217,466 cells, grid cells case 4 with 328,084 cells and grid cells case 5 with 637,620 cells.
The results of a grid-independent test are shown in Figure 3(a), while the relative error between cases is shown in Figure 3(b). At a specific location close to the patient, the V indicates the magnitude of the air velocity in the room, and the maximum velocity magnitude Vo is defined as the magnitude of the maximum air velocity at its boundary condition. Then V/Vo is a dimensionless velocity. Comparison analysis: (a) gird sensitivity test and (b) relative error between cases.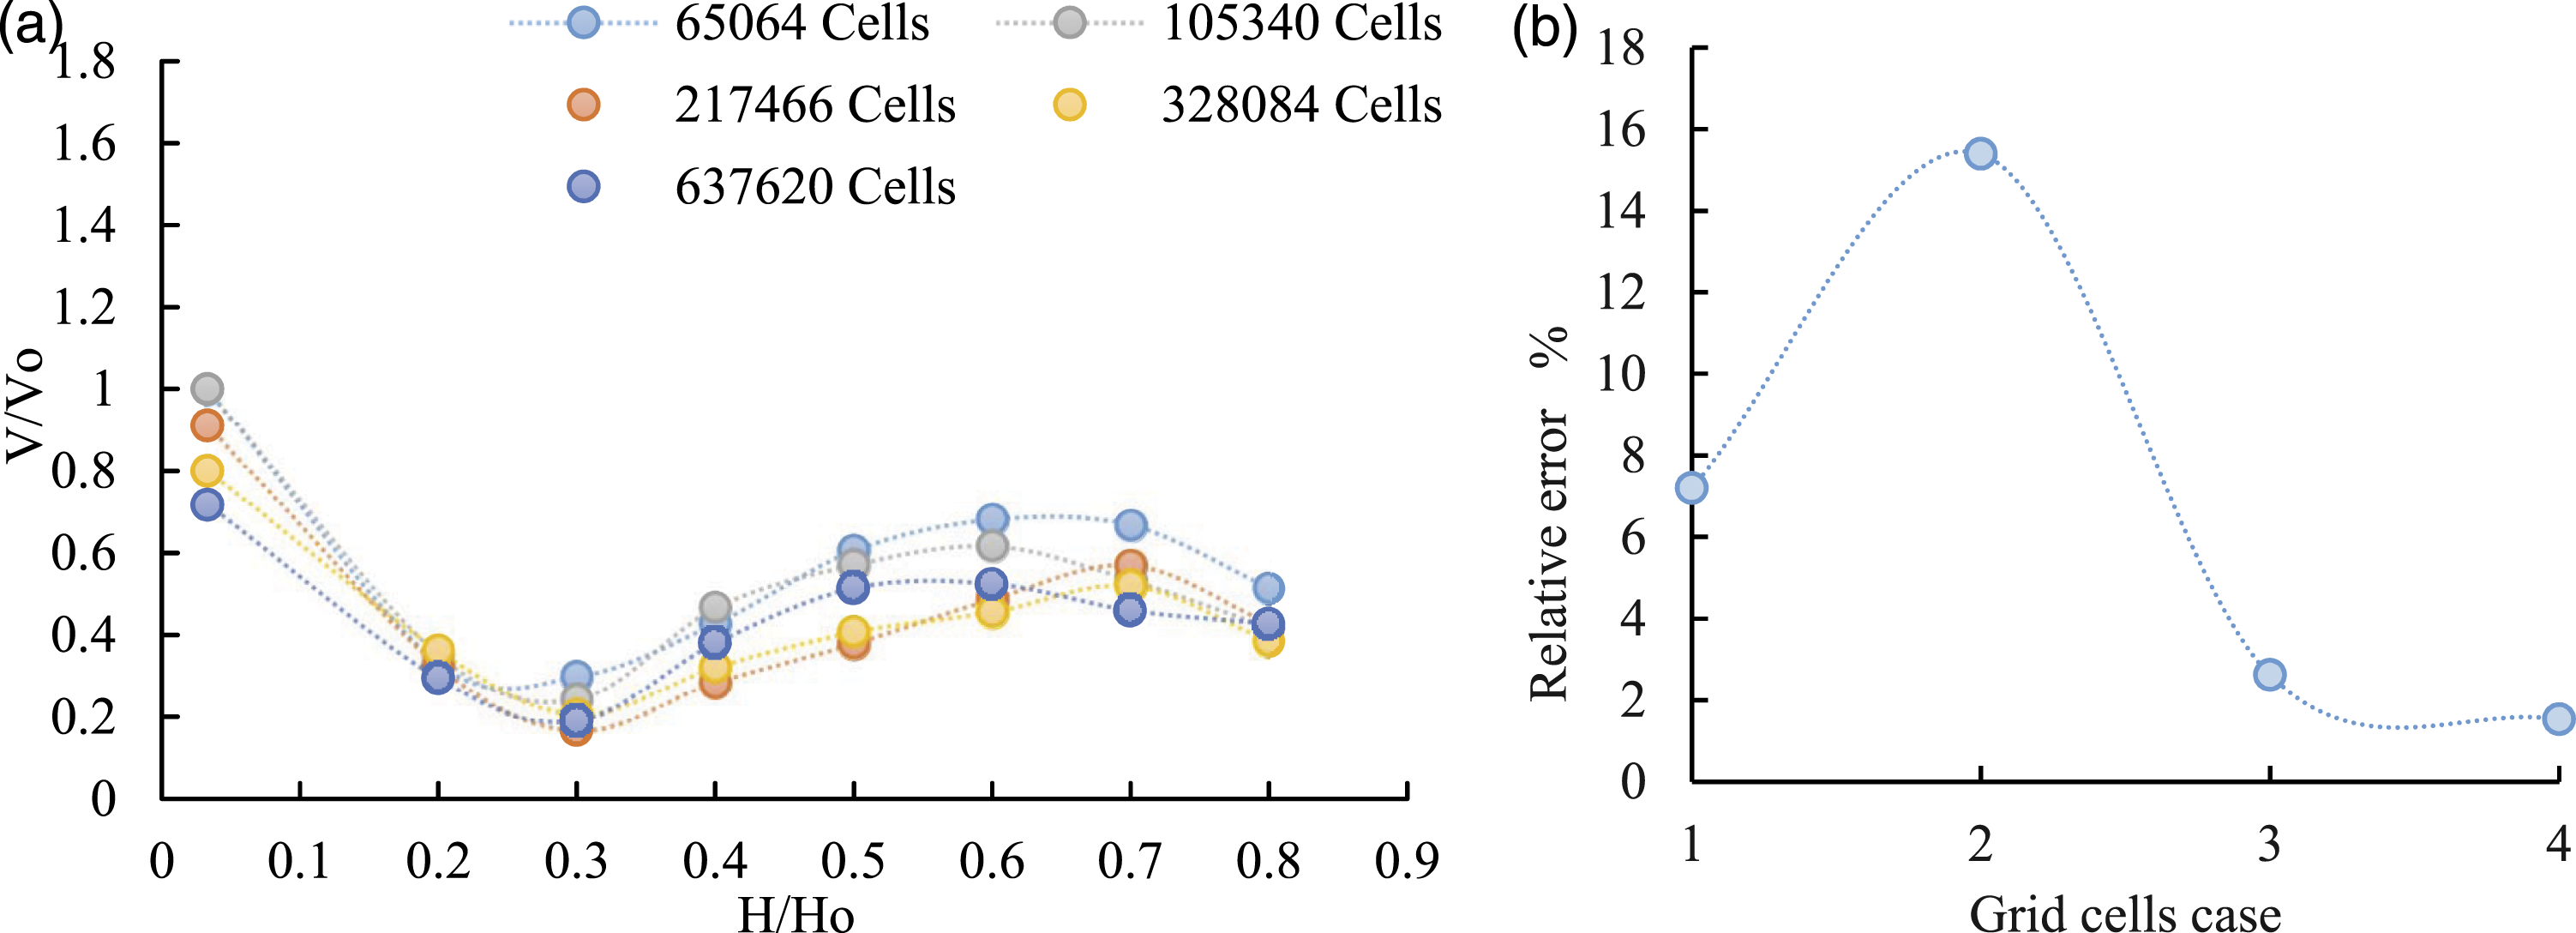
Besides, H represents the height of the monitored room air near the patient, while Ho represents the height of the entire room. As a result, the dimensionless velocity at the monitored points of 328,084 cells was quite similar to that of 637,620 cells; furthermore, it was reported that the relative error of the room air’s average dimensionless velocity was 7.2%, 15.39%, 2.51% and 1.53%, respectively, between cases 1 and 2, cases 2 and 3, cases 3 and 4 and cases 4 and 5. The grid system reached an independent solution because the difference between cases 4 and 5 was insignificant. Accordingly, 637,620 cells were deemed sufficient for this study. All computational grids were generated in ANSYS Fluent Meshing and consisted of a poly-hexcore mesh with five prismatic layers on the walls, which is adequate given the limited role played by viscous effects on the flow.
The infection risk
The spatial distribution of the pollutant (e.g. the virus) predicted by the CFD technique was employed in the Wells–Riley equation
35
to estimate the infection risk under various ventilation scenarios of the infected patient. By evaluating the quanta emission rate of a virus (such as SARS-CoV-2) produced by an infected patient, Ren et al.
39
adapted the Wells–Riley equation to evaluate the probability of infection. The infection risk may be seen as a function of the susceptible patient’s exposure period and pollutant concentration under the assumption of completely mixed ventilation as described by equation (21).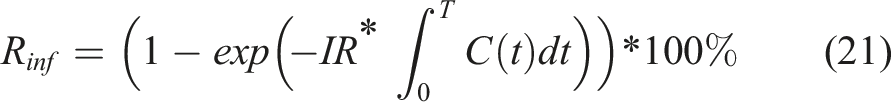
CO2 was utilized as an indication of airborne pollutants to simulate the transport of such contaminants via the air. The gases were expelled from the patient’s mouth at a temperature of 37°C, with the assumption that they included just air and CO2, and the velocity magnitude (V) was determined using equation (22):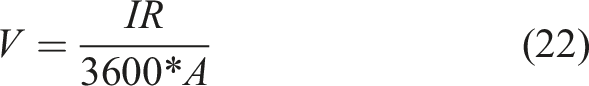
Result and discussion
The simulation results were validated using real data in four different locations of air temperature inside the current case (Figure 4). The airflow patterns of the current case were explained and analyzed with the three different ACH. After that, the simulation results of the effect of exhaust air vent location on the airflow distribution and velocity were presented and compared. Finally, further analysis of the infection risk and air mass remaining were highlighted. Streamlines plane of X = 0.35 m with computational domain of air temperature in the current case with 12 ACH at one location with different heights (0.6 m, 1.2 m, 1.8 m and 2.4 m).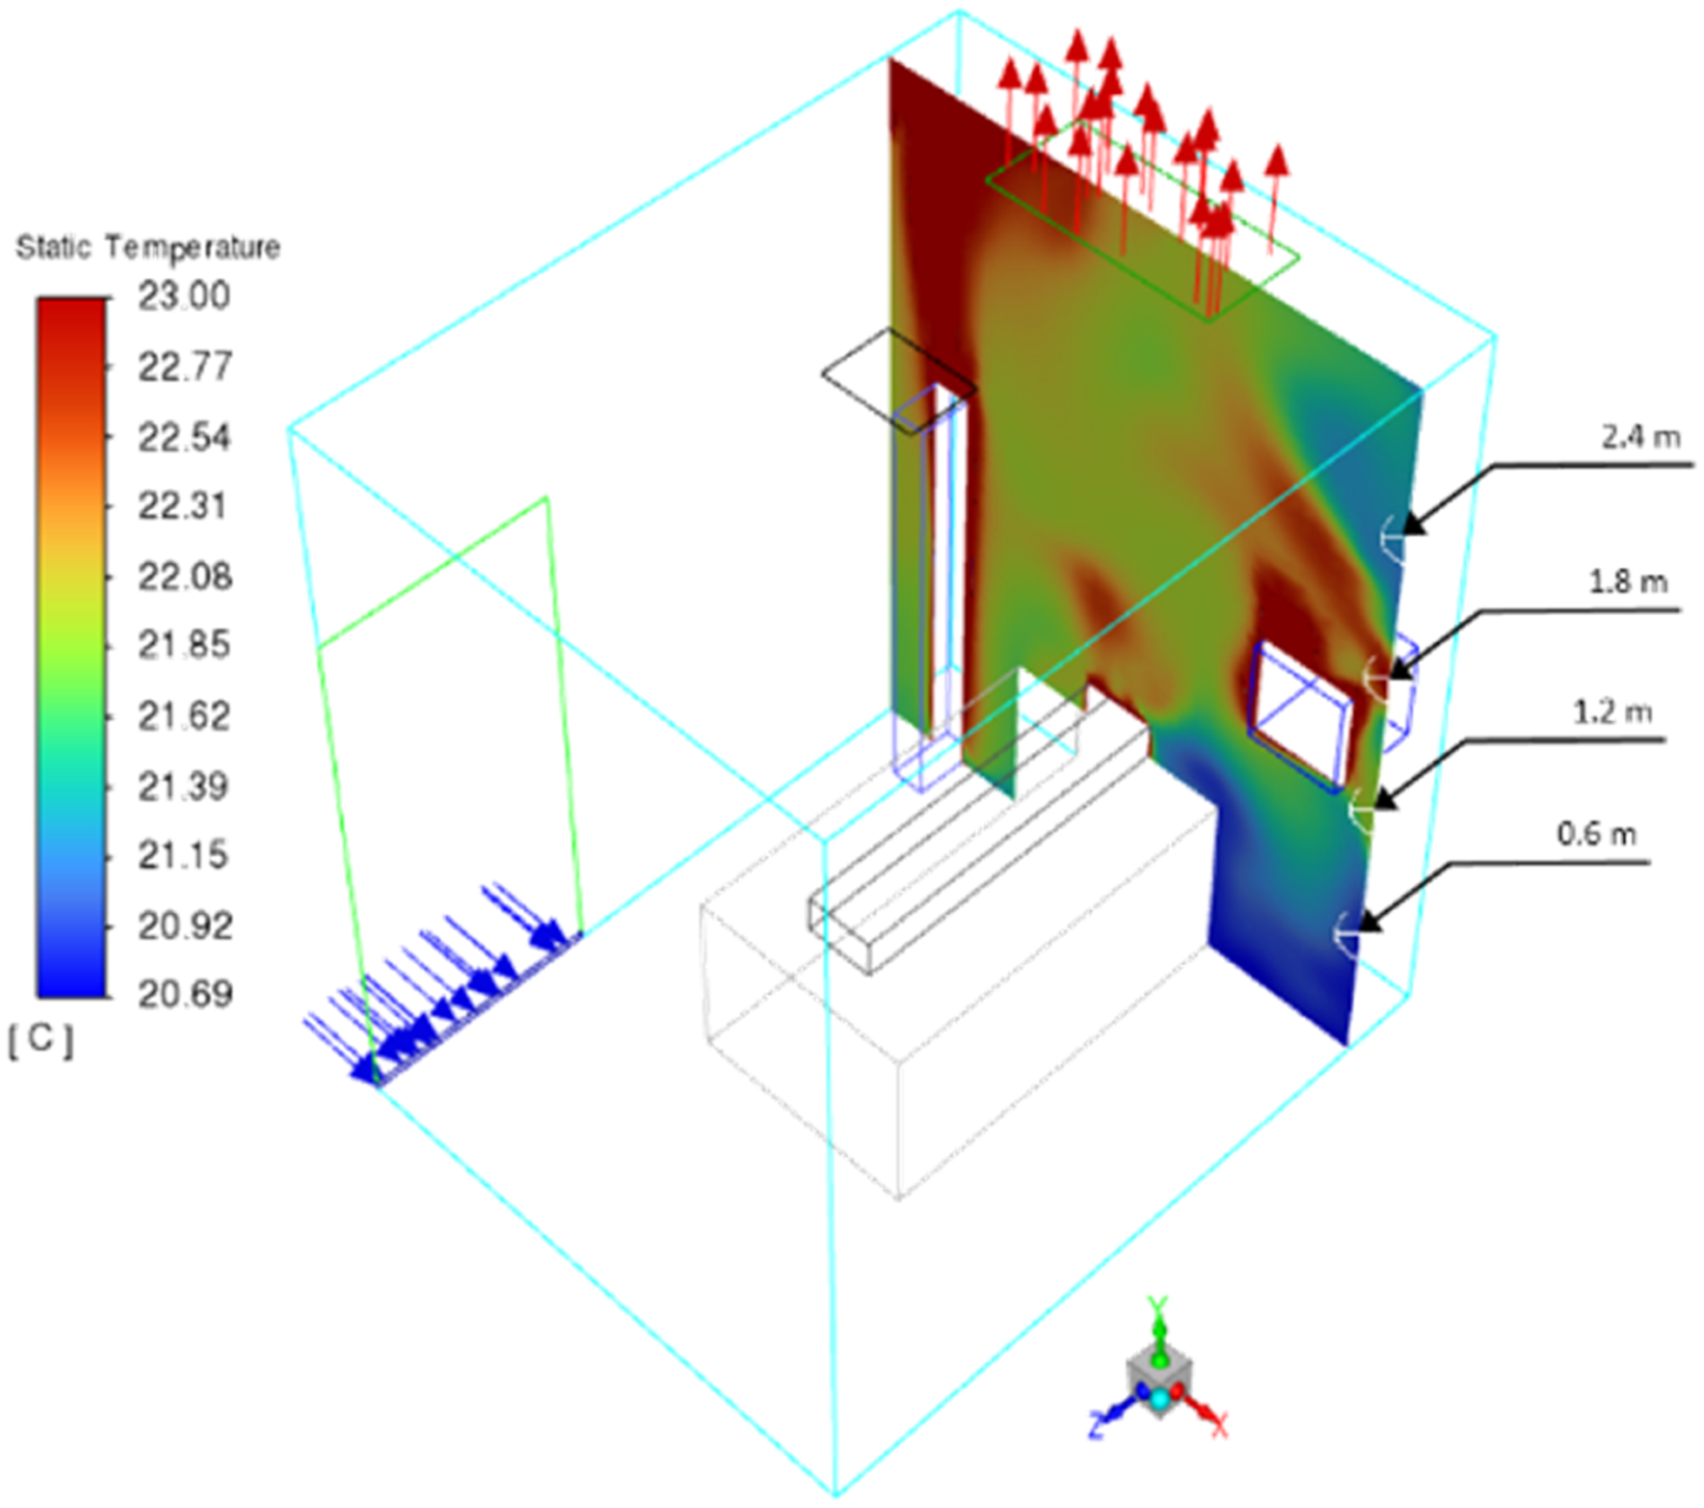
Model validation
In order to validate the model, the HOBO data logger was used to collect air temperature, as done by many studies including Al-Absi et al.,
44
Alam et al.
45
and Kuznik and Virgone,
46
inside the room at four different levels as illustrated in Figure 4. The correlation between the field and simulated data was calculated using the Pearson correlation coefficient to measure the error between the two datasets. As shown in Figure 5, the scatter plot shows a positive correlation (R2 = 0.896) between the simulated and collected indoor air temperature results. The correlation coefficient between room data and simulation data.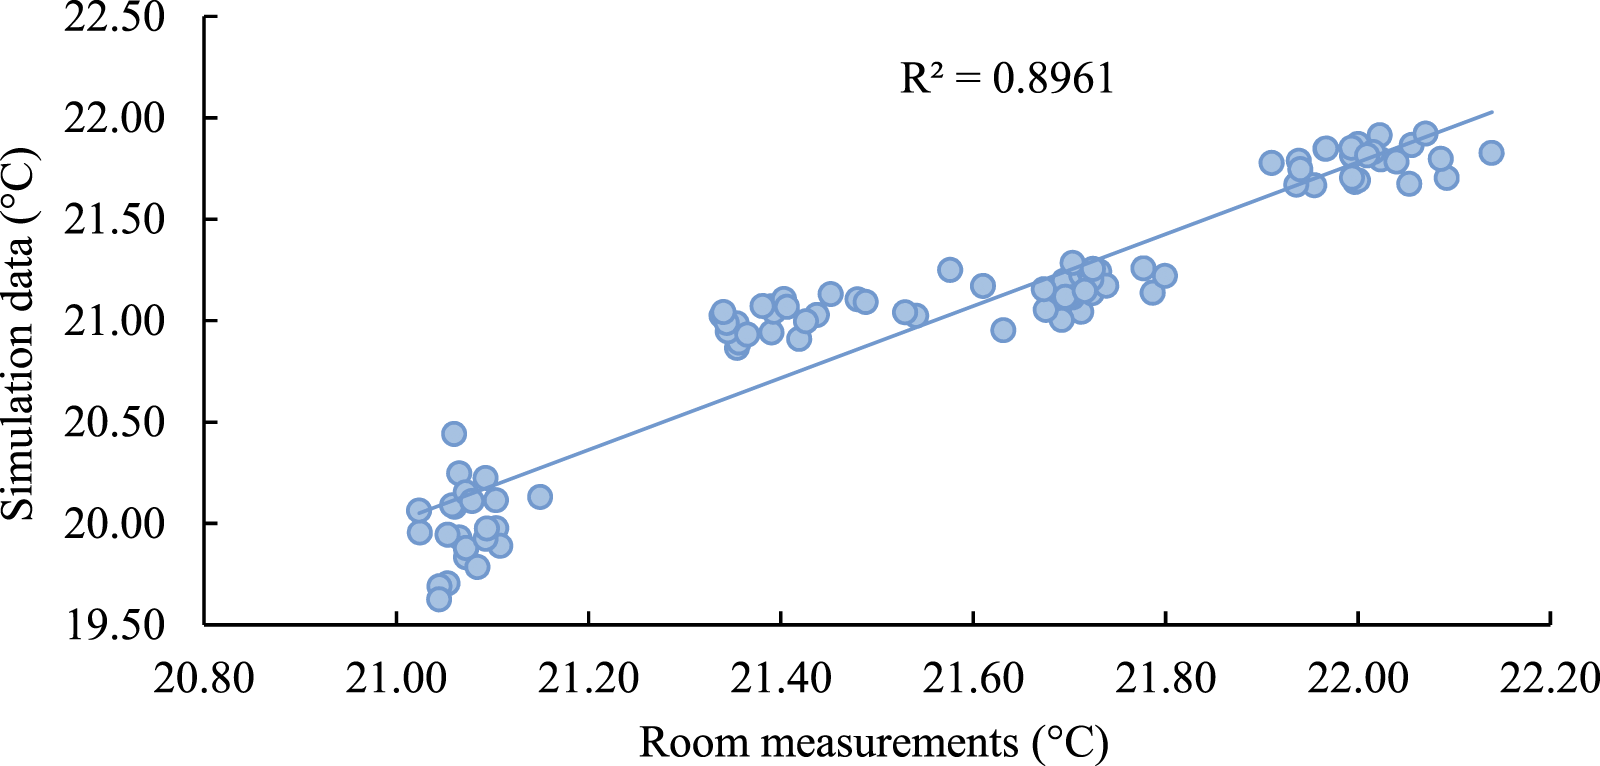
A substantial part of this validation is due to the robustness of the model used and the selection of the variables of interest to be used as drivers in the simulation model.
Airflow patterns of the current case
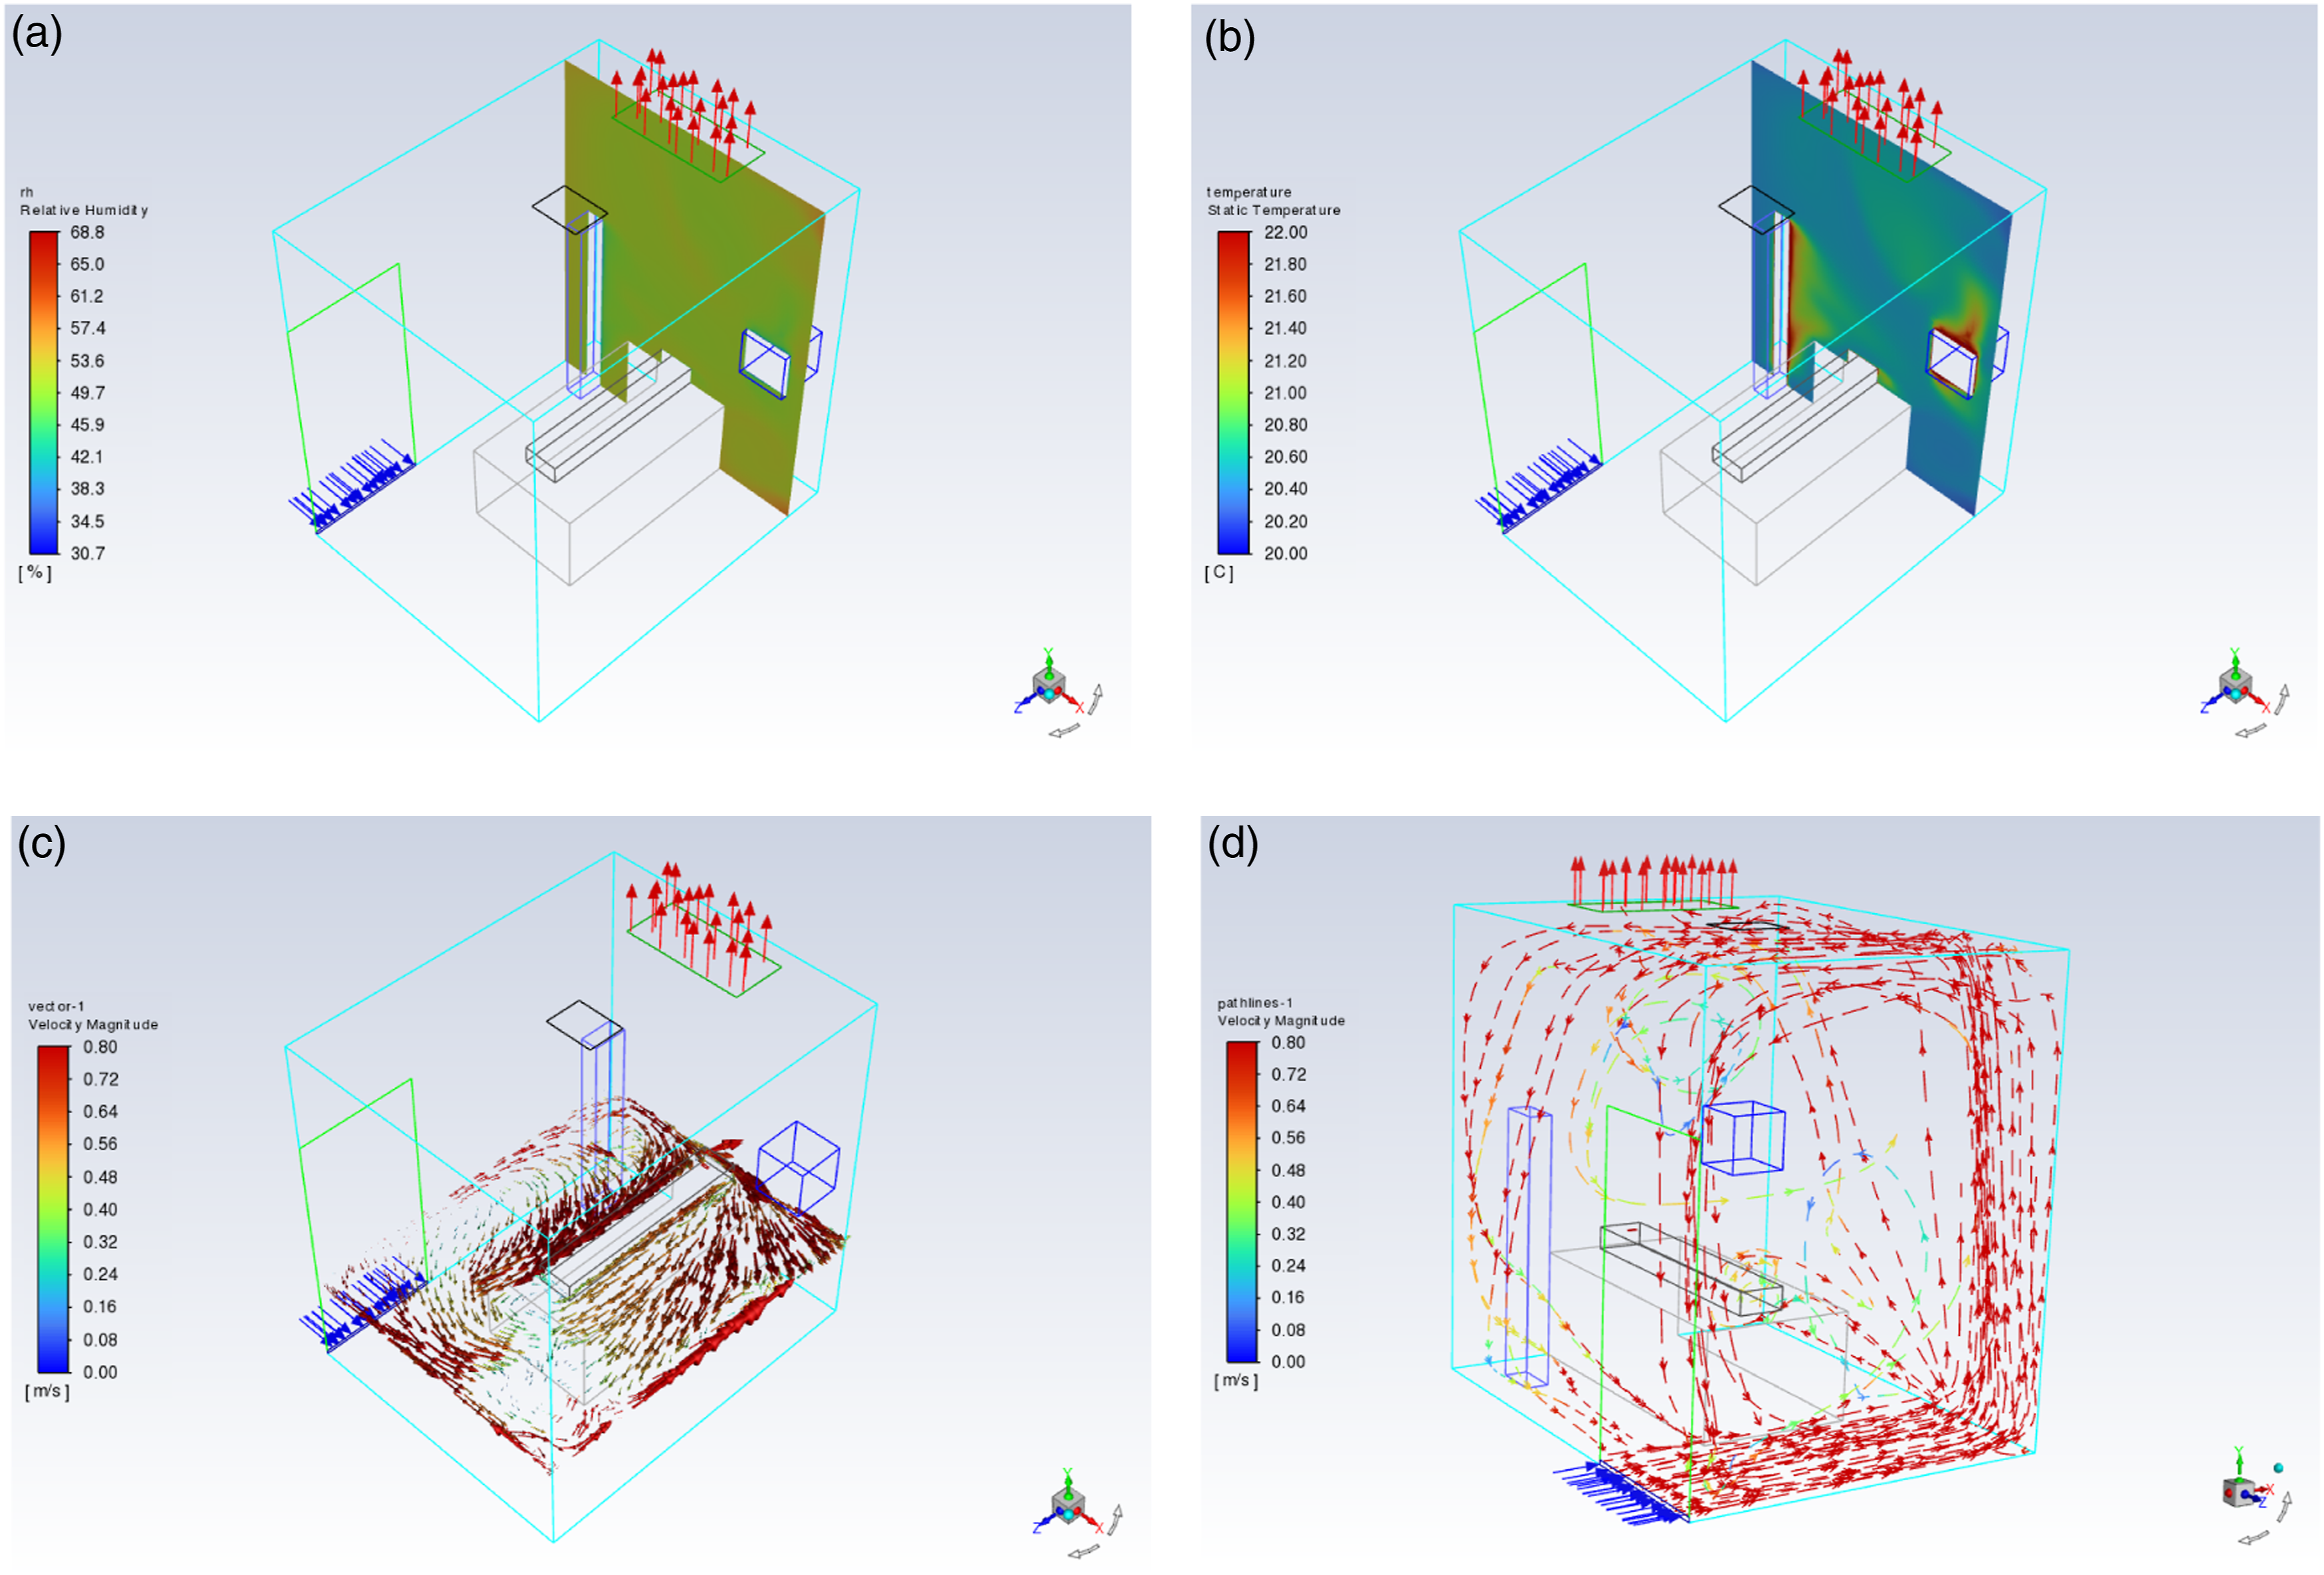
The air supply (at the lower side of the door) and exhaust (in the three cases, as explained in Figure 2) were located to provide controlled airflow patterns. Patients on the bed in parts of the room would receive clean air first, and then clean air would pass over the infectious source and into the exhaust system. The airflow into the room would come from a clean area to a place contaminated by the patient’s pollutants, and there must be no return of this air to the clean area. As seen in Figure 6, observations indicate a reversed airflow from the wall opposite the room door to the room door side, as a result of the effects of thermal buoyancy (Figure 6(a) and (b)) and the average temperature difference between the inside and outside of the room. Consequently, airborne pollutants may spread throughout the room before they could be exhausted through the ceiling exhaust air vent. Besides, opening the room door could spread airborne pollutants outside of the room. Airflow pattern of the current case with 12 ACH: (a) relative humidity, (b) air temperature distribution, (c) x-z cross-section airflow distribution around the patient and (d) airflow distribution in the whole room.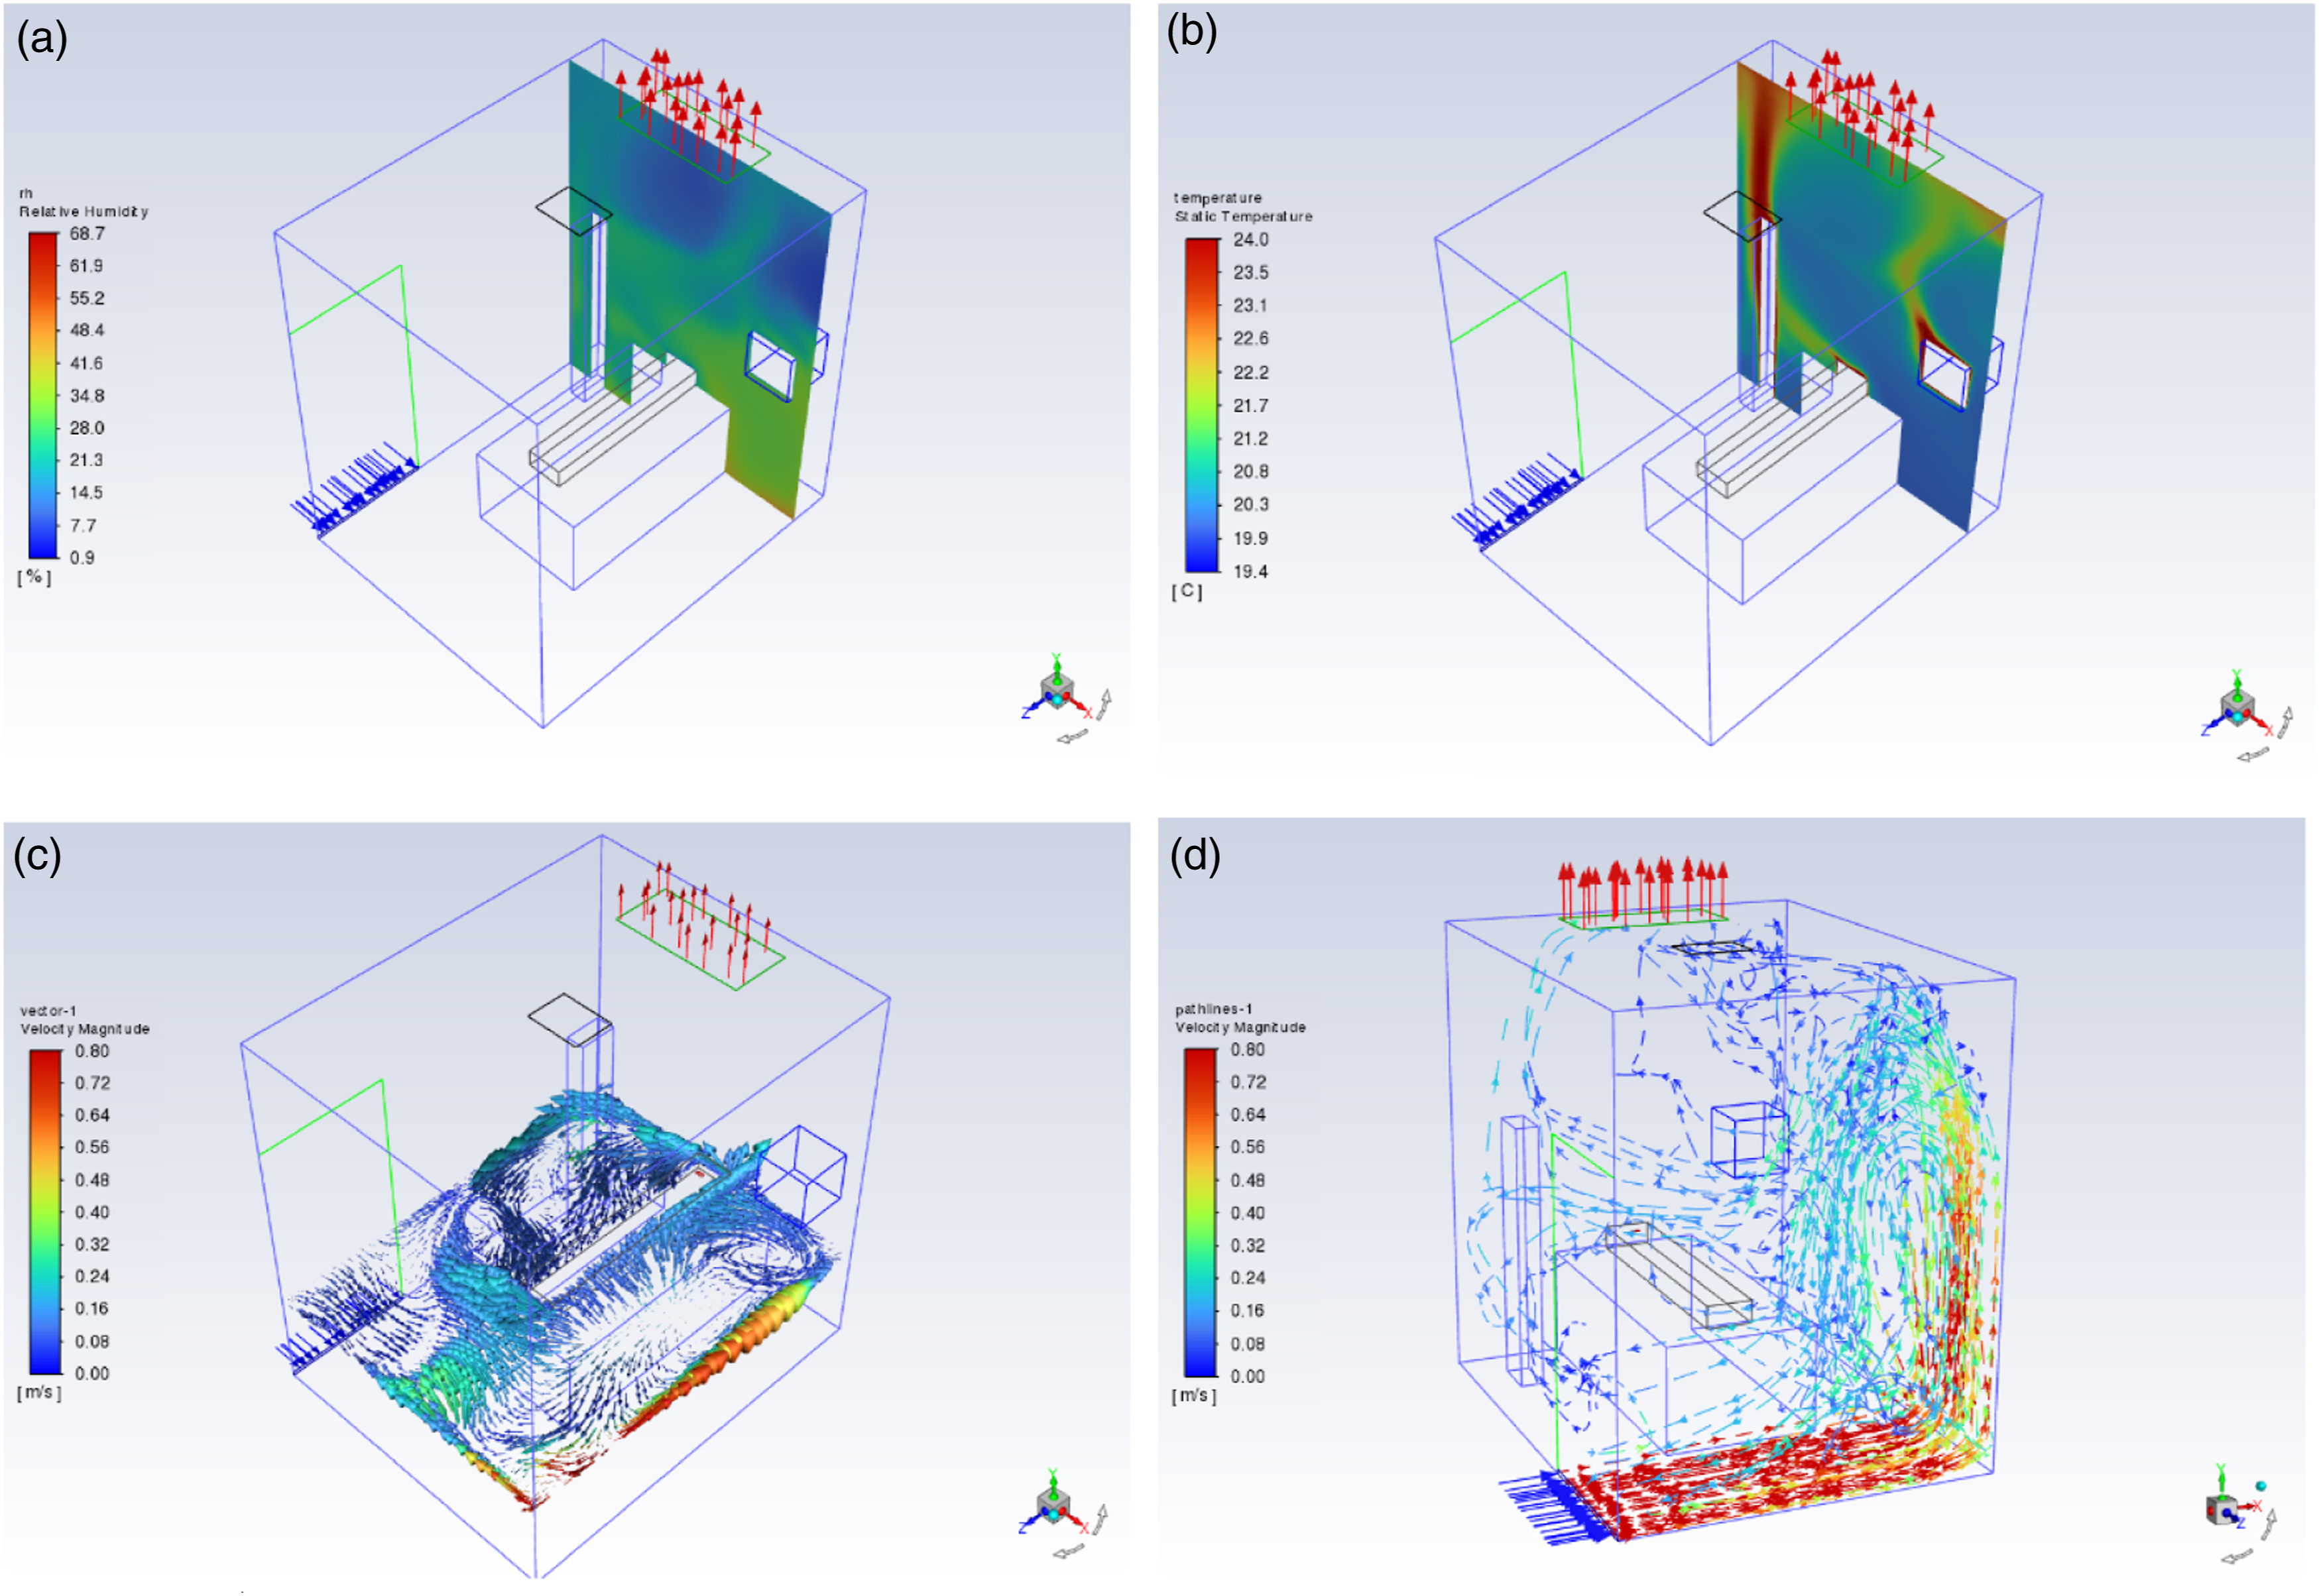
In addition, Figures 7 and 8 illustrate the airflow pattern in the current case with 24 and 48 ACH, respectively. Although the speed of the airflow was increased around the room compared to the current case with 12 ACH, the reversed airflow was still produced to the door side of the room. Airflow pattern at the current case with 24 ACH: (a) relative humidity, (b) air temperature distribution, (c) x-z cross-section airflow distribution around the patient and (d) airflow distribution in the whole room. Airflow pattern at the current case with 48 ACH: (a) relative humidity, (b) air temperature distribution, (c) x-z cross-section airflow distribution around the patient and (d) airflow distribution in the whole room.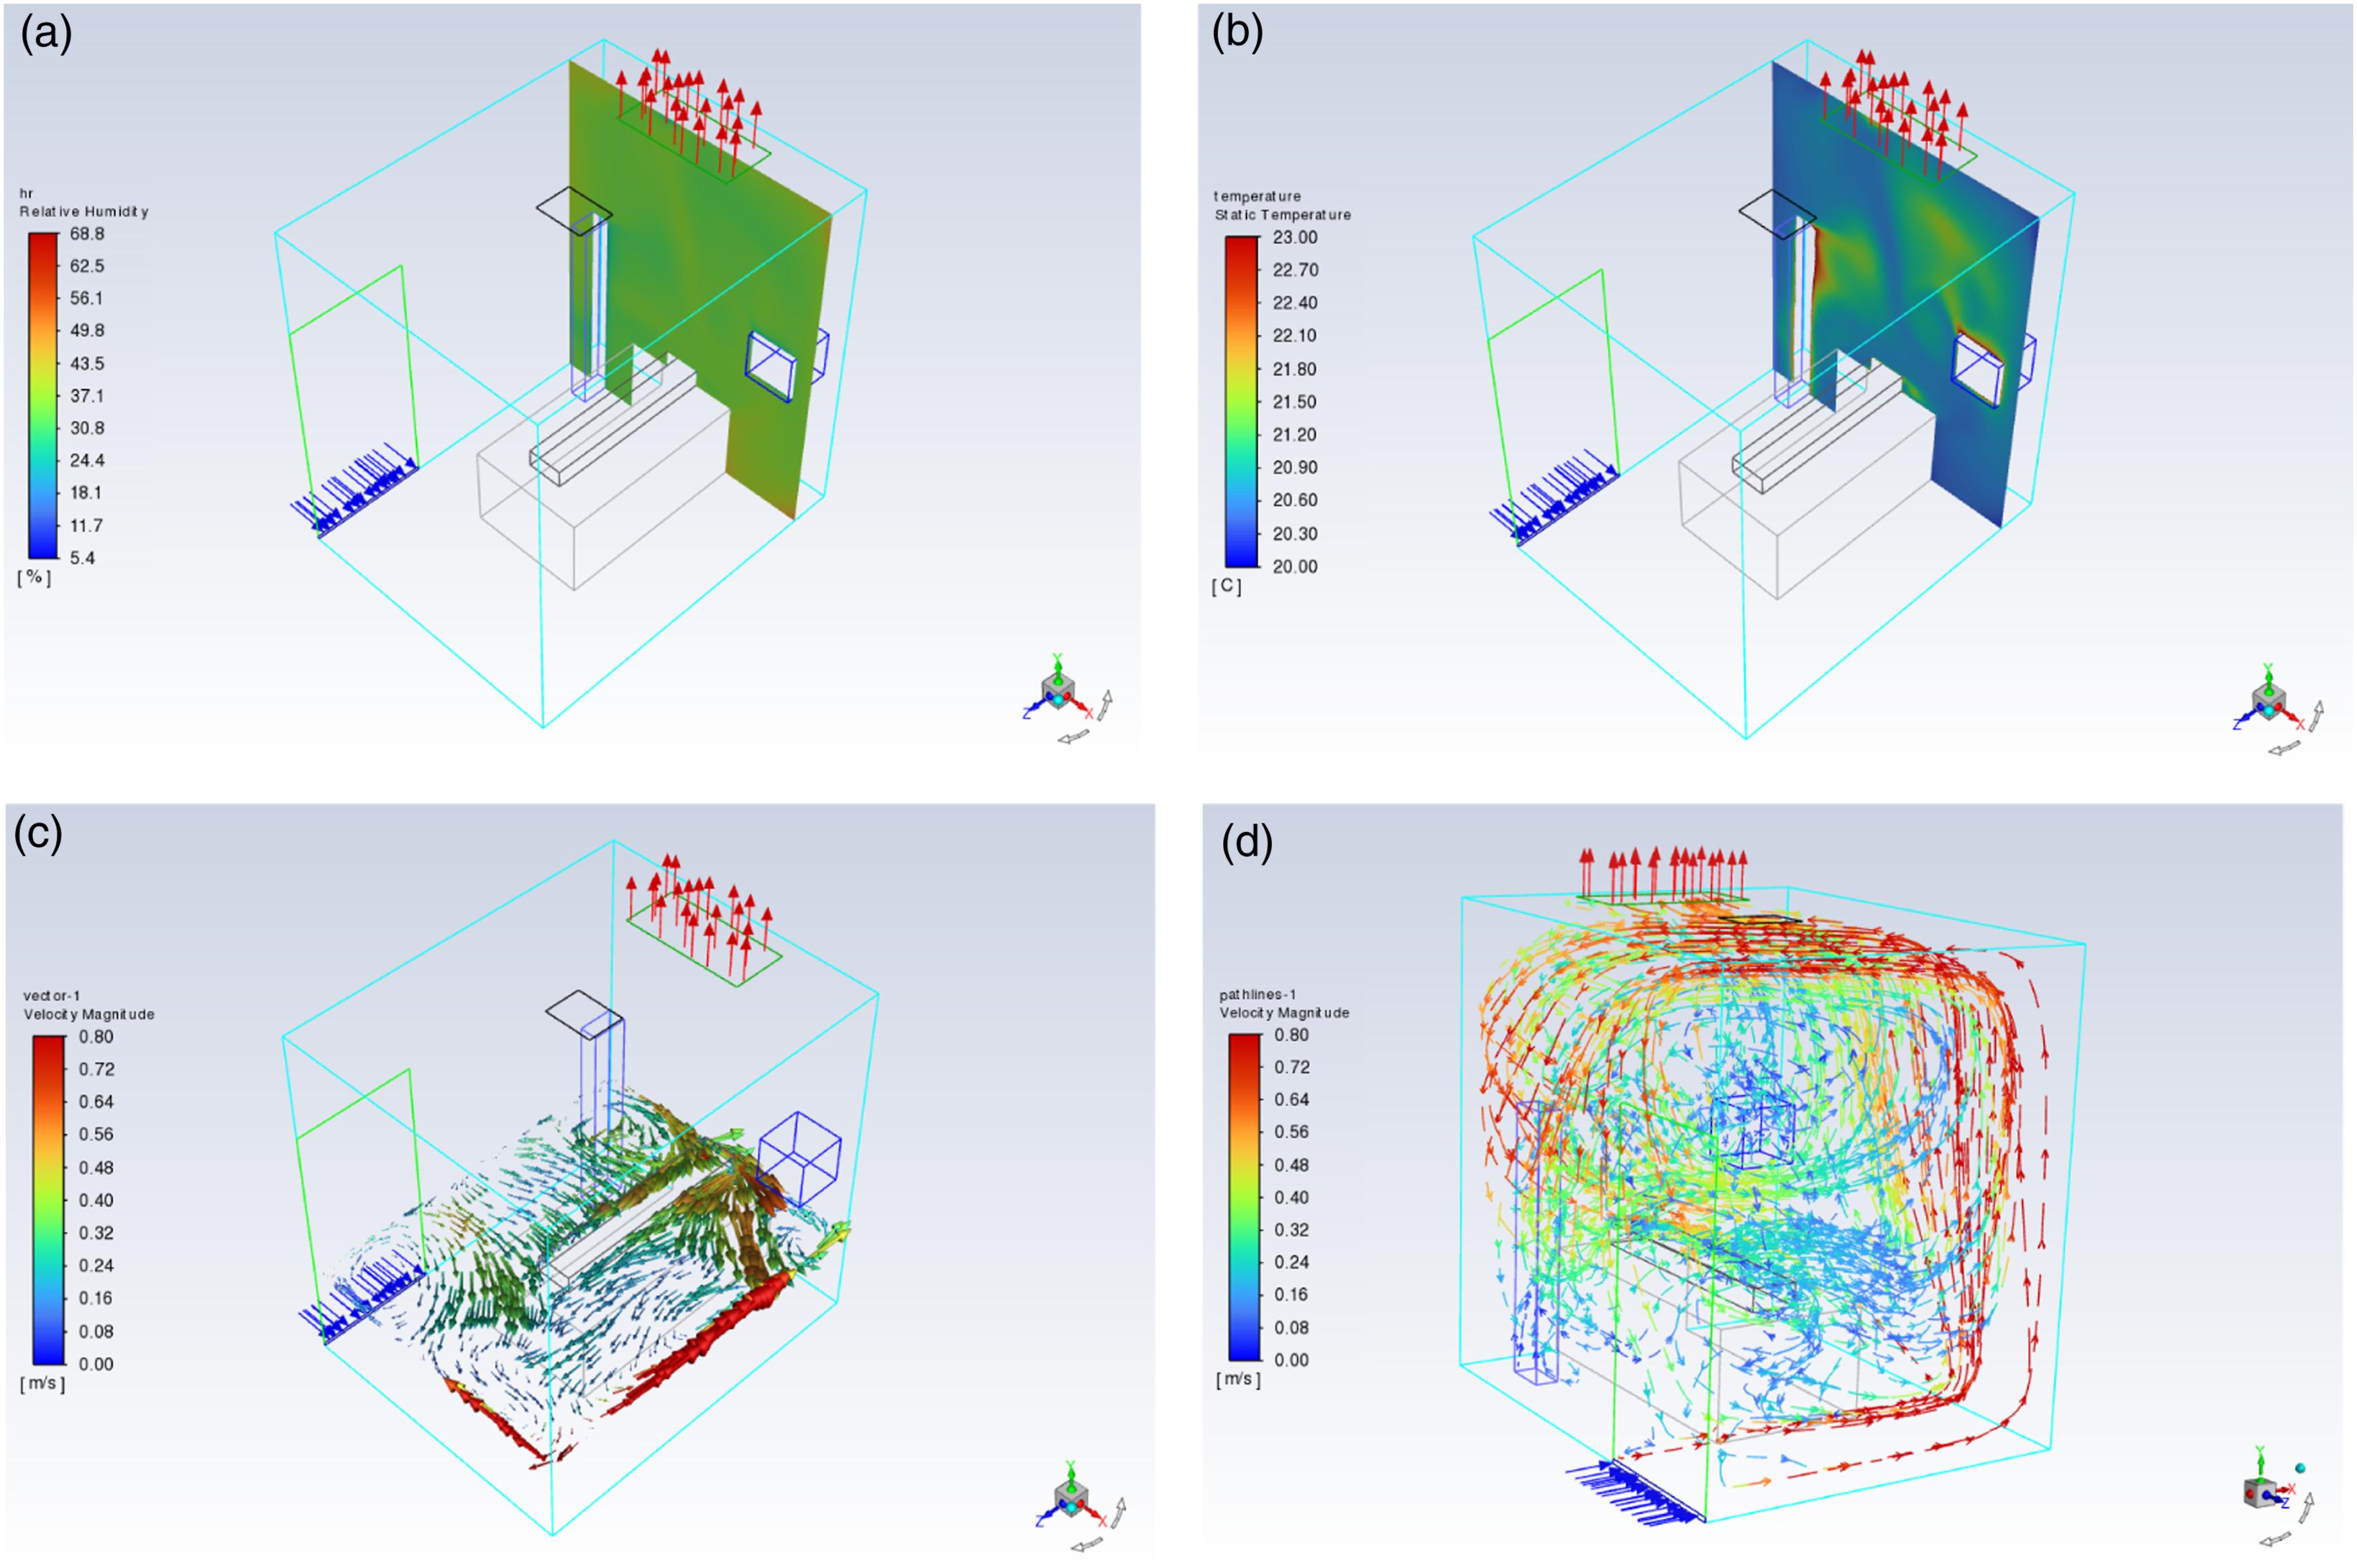
A substantial concentration of air movement occurred in a corner, and the isolation room remained on the opposite side of the room door. However, the velocity declined when the air reached the opposite side of the room as shown in Figure 6(d). However, in the second case (Figure 7(d)), an increase in the speed of the airflow was shown to reach the room ceiling and generated a clockwise swirl airflow reversely towards the room door side wall, and this increased the amount of air exhausted through the ceiling exhaust air vent compared to the previous case. Furthermore, looking at Figure 8, the speed of the airflow was further increased to reach almost all zones in the isolated room, specifically beside the patient. As seen in Figure 8(c) and (d), the airflow distribution created a clockwise swirl airflow towards the patient side which would minimize the possibility of pollutants exiting the isolation room due to the increased ACH.
On the other hand, the effect of healthcare workers and medical equipment on air temperature and relative humidity was decreased in the current case with 24 ACH compared to 12 ACH. Variations of air temperature and relative humidity were tempered when comparing Figure 7(a) and (b) and Figure 8(a) and (b). However, a tenuous correlation existed between air temperature and relative humidity in cases with 24 and 48 ACH.
Effect of exhaust air vent location on airflow distribution
As shown in Figure 2, three different locations and shapes of the exhaust air vent (outlet) were selected for this study. The current case represents the existing condition of the room in King Fahd Hospital (Figure 2(a)), case 1, where the exhaust air vent was located on the wall behind the patient (Figure 2(b)), and case 2, where the exhaust air vent was located around the patient bed and has the shape of Ո (Figure 2(c)).
Overall airflow distribution and an x-z cross-section at the height of the patient bed (y = 26.5 cm) with airflows of 12, 24 and 48 ACH at three different locations of exhaust air vent.
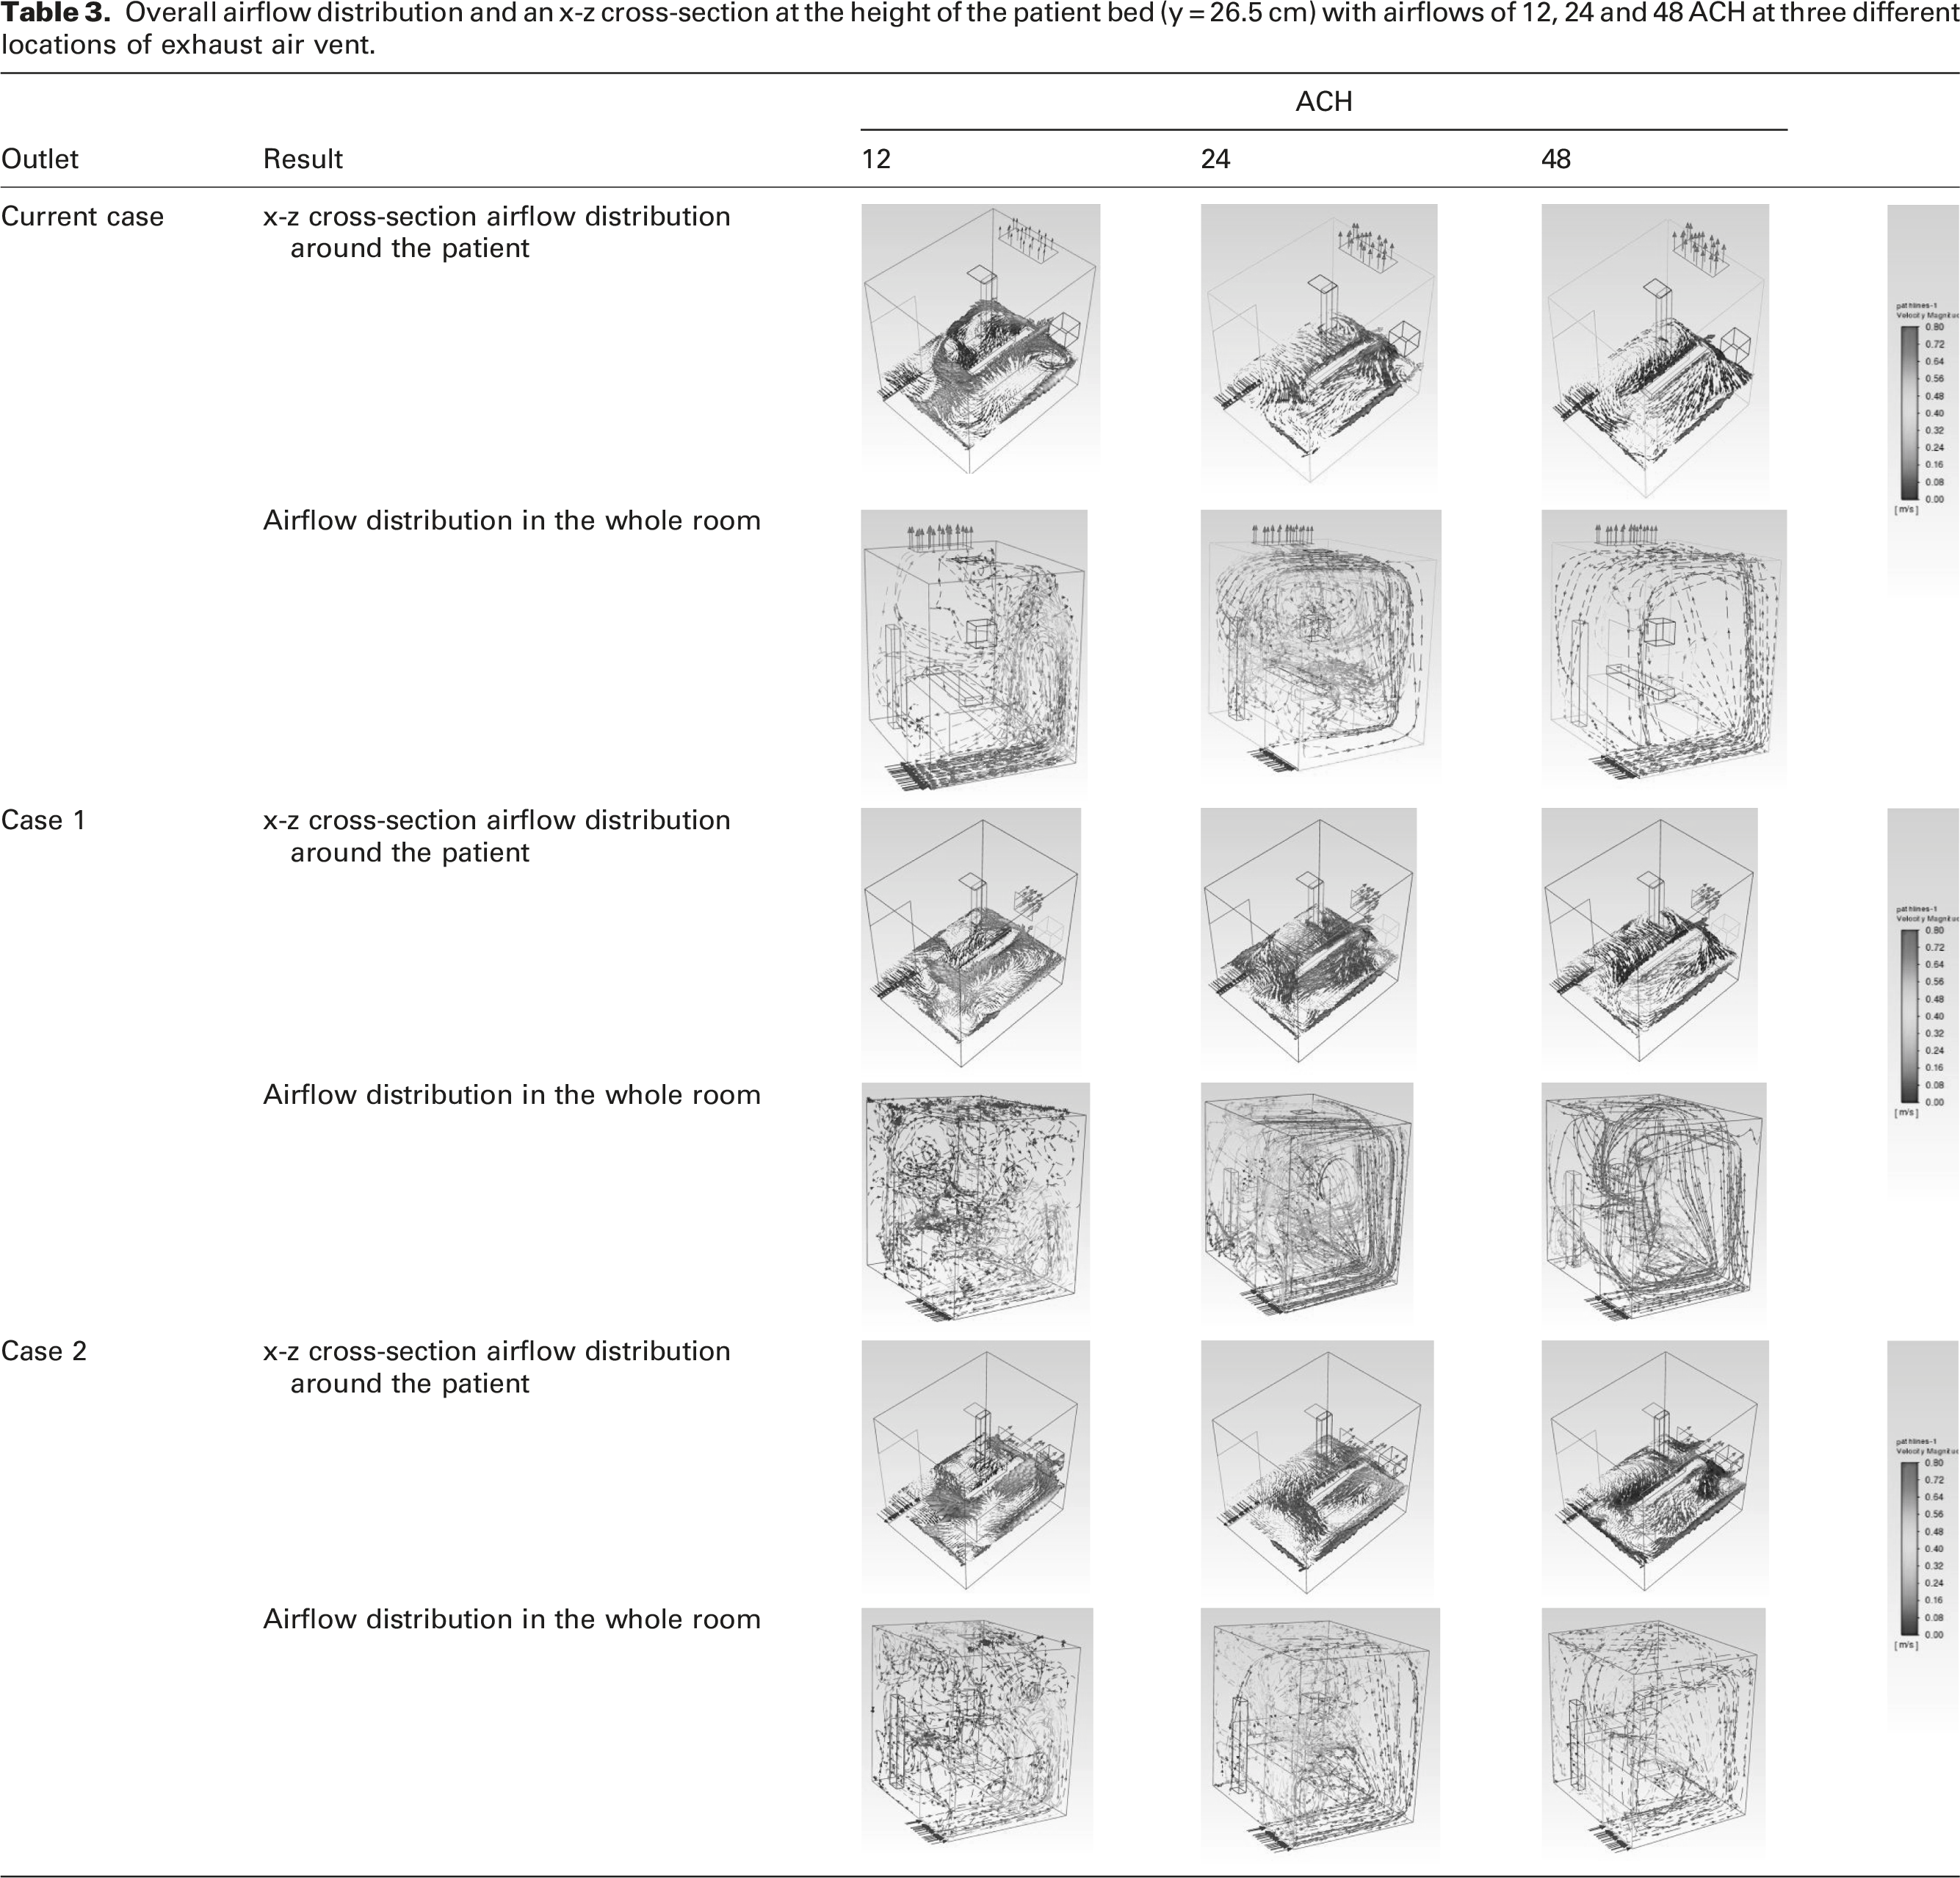
When the exhaust air vent was placed on the wall above the patient’s head, the air movement was improved with an airflow of 12 ACH, especially next to the patient, but the air movement was slower when viewed from the entire room due to the exhaust air vent placement.
However, there was an improvement in the airflow with 24 and 48 ACH, either at the level of the patient or in the overall room. In case 1, increasing the ACH to 24 and 48 can improve the air movement around the patient between 0.40 and 0.72 m/s and 0.72 and 0.80 m/s, respectively.
The situation slightly improved when looking at case 2 due to the fact that the exhaust air vent was situated around the patient’s bed in a Ո shape, which made the air velocity higher at the level of the patient on the bed. Even though the airflow was increased at the patient level with 12 ACH, the overall airflow in the room still appeared to be typical, even though it was improved at the patient level. Air movement around the patient can be improved by increasing the ACH to 24 and 48 in order to achieve a reasonable air movement of 0.72 m/s and 0.80 m/s, respectively.
Effect of exhaust air vent location on the average air velocity
Given the average air velocity inside the room, as seen in Figure 9, with 12 ACH, no significant effect of the type and location of the exhaust air vent was observed in the current case, case 1 and case 2, as the average air velocities were 0.121, 0.130 and 0.116, respectively. However, there are some specific zones where velocity could be amongst cases, as seen in Table 3. Nevertheless, the overall effect can be insignificant for the purification of the air inside the isolation room. There was an improvement in the average by nearly twice in the case of 24 ACH in comparison to 12 ACH. While the average velocity recorded in the current case was 0.282 m/s, the velocity was improved to 0.37 m/s in case 1 and declined to 0.280 m/s in case 2, which further demonstrated the insignificant effect of the location of the exhaust air vent. Average velocity inside the isolated room.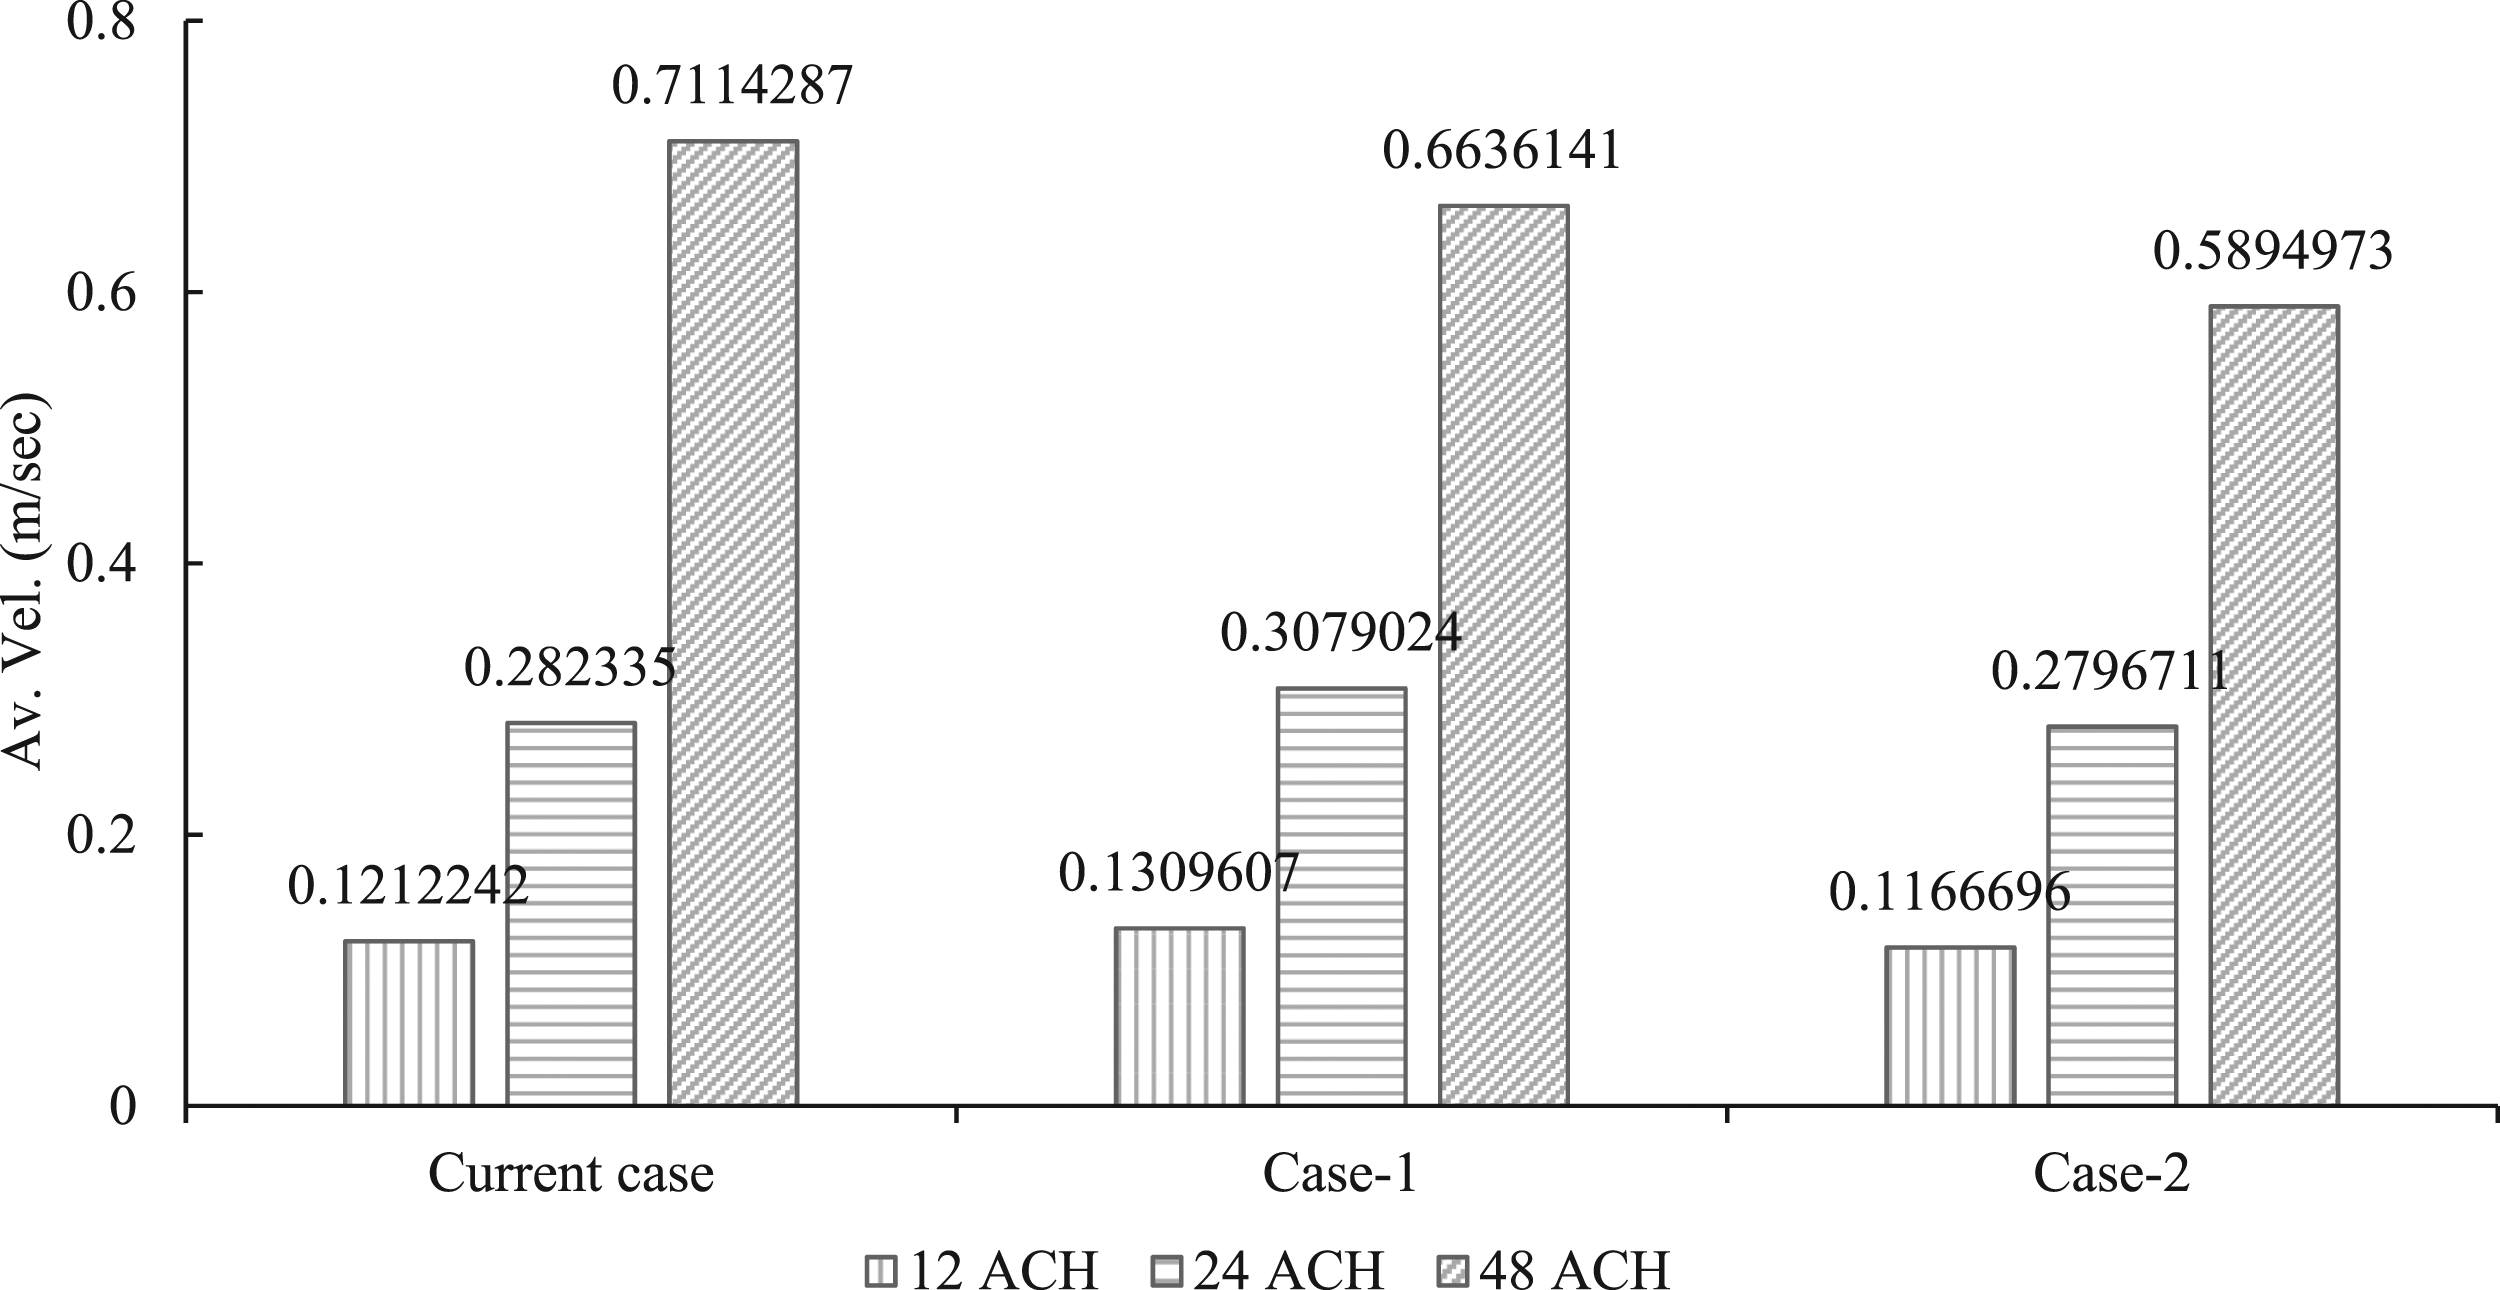
Contrary to the situation of 12 ACH and 24 ACH, in 48 ACH, there were decreasing values. For instance, the average velocity in the current case was 0.711 m/s, falling to 0.663 and 0.589, respectively, in case 1 and case 2.
Effect of exhaust air vent location on the infection risk
Air velocity within the isolation room is a reflection of the extent to which the air can be refreshed and therefore cleaned from pollutants emitted by the patient. Accordingly, Figure 10 illustrates the infection risk posed by the pollutant source at the patient location in all scenarios. There is a direct positive correlation between the amount of ACH introduced to the isolation room and the probability of infection. Based on the CFD analysis results shown in Table 3, this is consistent with the results of the airflow analysis. The infection risk with pollutant sources of patient location.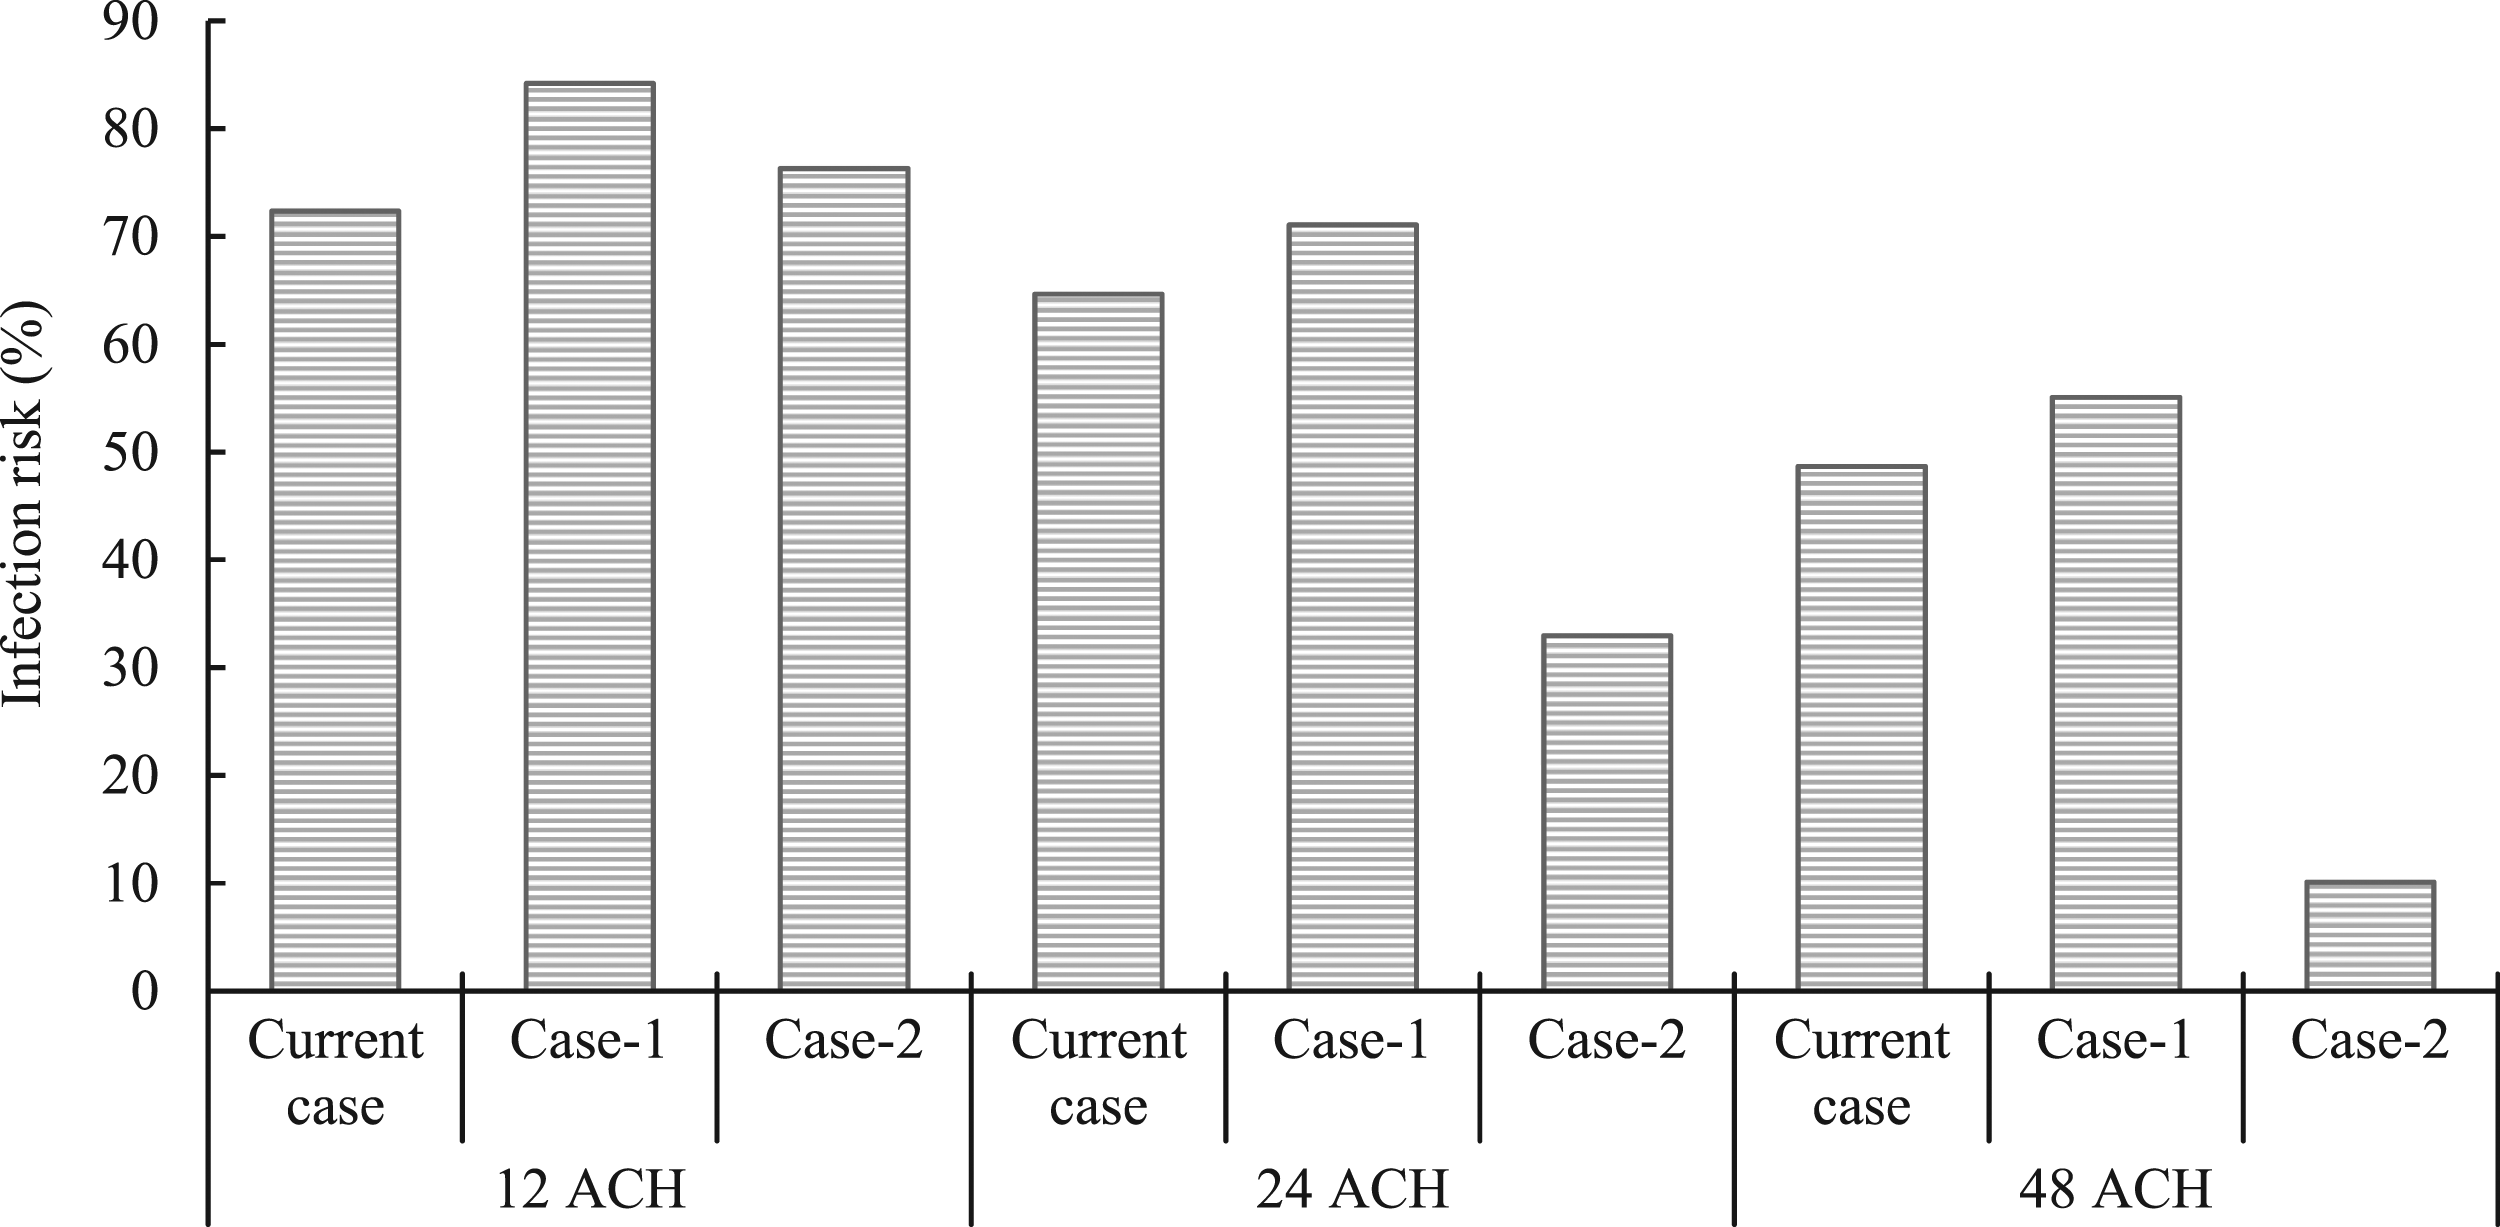
As seen in Figure 10, in the scenario of 12 ACH, the infection probability for case 1 and case 2 was increased by 11.85% and 3.96%, respectively, compared to the current case where the exhaust air vent location was located in the ceiling. Despite the fact that the 24 ACH system indicated a higher (doubled) air velocity inside the room than the 12 ACH system (Figure 9), no evidence was shown to indicate the air was totally refreshed during the first 1 hour and then exhausted via the exhaust air vent. This confirms that the air velocity should be integrated with the air mass exhausted from the isolation room for a more comprehensive assessment as stated by many previous studies.18–22
Based on the results shown in Figure 10, the improvement of the risk infection between 12 ACH and 24 ACH was not as significant as the improvement between 24 ACH and 48 ACH systems in each scenario. The minimum risk of 10.11% was recorded when the 48 ACH occurred in case 2. Although the indication risk was increased considerably to 32.96% in case 2 with 24 ACH, both are still in the lower range among other scenarios. Besides, unlike the situation in 24 ACH and 48 ACH, case 2 recorded infection risk higher (3.96%) than the current case in the 12 ACH system.
On the other hand, case 1 was obviously the worst design solution that could be used as an exhaust air vent, where the location was behind the patient, on the wall, as seen in Figure 2(b). Although the infection risk was lowered by 13.13% and 29.12% with 24 ACH and 48 ACH systems compared to the 12 ACH system in case 1, it is still the worst compared with the current case and case 2 within the same ACH system. This indicated the sensitivity of the ACH system selection for the appropriate exhaust air vent design and location within the isolated room.
This reflects that the ⋂ shape of the exhaust air vent performed well with all types of ACH, except for the current case of 12 ACH system, regardless of the average air velocity presented in Figure 9.
Conclusions
In this study, three exhaust outlet vent designs were evaluated in three different conditions of air flow rate, namely, 12, 24 and 48 ACH. A set of conditions was established in order to control airflow and infection risk inside the isolation room during a specific period of time. Inpatient wards for COVID-19 comply with the requirement of at least 12 air change rates per hour. This study could serve as a reference for the design and renovation of hospital wards or isolation rooms during outbreaks.
Increasing the ACH to 48 led to a decline in the air velocity in all three cases studied. The average velocities recorded were 0.711 m/s in the current case, 0.663 m/s in case 1 and 0.589 m/s in case 2.
Moreover, the study found that the infection probability was increased as the ACH was decreased. In particular, the infection probabilities for case 1 and case 2 were increased by 11.85% and 3.96%, respectively, in the scenario of 12 ACH compared to the current case. The study also identified that case 1 was the worst design solution as an exhaust air vent, due to its location behind the patient on the wall. On the other hand, the optimum solution was found to be case 2, where the 48 ACH system resulted in a minimum risk of 10.11%. The ⋂ shape of the exhaust air vent in case 2 performed well with all types of ACH, except for the current case in the 12 ACH system, regardless of the average air velocity presented.
Our findings regarding exhaust vent design and air change rates can be applied to the design and renovation of hospital wards or isolation rooms during outbreaks of various infectious diseases, not just limited to COVID-19. The results of this study can serve as a reference for architects, engineers and healthcare professionals in the design and construction of hospital facilities that prioritize infection control and prevention measures. By implementing the optimal exhaust vent design and air change rates identified in this study, the risk of infection transmission within hospital settings can be reduced, ultimately leading to better health outcomes for patients and healthcare workers alike.
Footnotes
Author contributions
All authors contributed equally in the preparation of this manuscript.
Declaration of conflicting interests
The author(s) declared no potential conflicts of interest with respect to the research, authorship, and/or publication of this article.
Funding
The authors gratefully acknowledge Qassim University, represented by the Deanship of Scientific Research, for the financial support for this research under the number (10220-adc1-2020-1-3-I) during the academic year 1441AH/2020AD.
Correction (September 2023)
The Funding section of the article has been updated since its original publication.