
Abstract
The Covid-19 outbreak has resulted in new patterns of home occupancy, the implications of which for indoor air quality (IAQ) and energy use are not well-known. In this context, the present study investigates 8 flats in London to uncover if during a lockdown, (a) IAQ in the monitored flats deteriorated, (b) the patterns of window operation by occupants changed, and (c) more effective ventilation patterns could enhance IAQ without significant increases in heating energy demand. To this end, one-year’s worth of monitored data on indoor and outdoor environment along with occupant use of windows has been used to analyse the impact of lockdown on IAQ and infer probabilistic models of window operation behaviour. Moreover, using on-site CO2 data, monitored occupancy and operation of windows, the team has calibrated a thermal performance model of one of the flats to investigate the implications of alternative ventilation strategies. The results suggest that despite the extended occupancy during lockdown, occupants relied less on natural ventilation, which led to an increase of median CO2 concentration by up to 300 ppm. However, simple natural ventilation patterns or use of mechanical ventilation with heat recovery proves to be very effective to maintain acceptable IAQ.
Keywords
Introduction
The Covid-19 lockdowns across the globe mean that people spend much more time in their homes, where concentrations of several pollutants, including human associated particulate matter (PM), volatile organic compounds (VOCs), carbon monoxide (CO), and carbon dioxide (CO2) can be several times higher than outdoor air, depending upon outdoor levels, building envelope air tightness and indoor sources, indicating a significant potential for detrimental health impacts.1–3
There are two factors that make CO2 concentrations relevant to ventilation and IAQ standards: their relation to indoor levels of bioeffluents and associated odours (an important factor in perceived air quality and occupant satisfaction), and their relation to ventilation rates per person. Specifically, concentrations of CO2 in occupied indoor spaces are often higher than concentrations found outdoors because people produce and exhale CO2. Declining air change rates per person increase the magnitude of this indoor–outdoor difference in CO2 concentration allowing for peak indoor CO2 concentrations above outdoor levels to be used as rough, albeit imperfect indicators for outdoor-air ventilation rate per occupant. 4
Direct health effects of CO2 on humans have been reported at concentrations much higher than those found in normal indoor settings. For example, Lipsett et al. 5 suggest that CO2 concentrations higher than 20,000 ppm cause changes in breathing. According to epidemiologic and intervention studies, higher levels of CO2 within the range found in normal indoor settings (i.e. up to 5000 ppm), are associated with perceptions of poor air quality, increased prevalence of acute health symptoms (e.g. headache, poorer work performance, and increased absenteeism (e.g.).6–8 It is debated whether these associations exist because the higher indoor CO2 concentrations are correlated with higher levels of other indoor-generated pollutants which are the causative agents of the adverse effects.9,10 Yet, as suggested by Chatzidiakou et al., 11 CO2 concentration can be used as a useful proxy for occupant-related contaminants.
Moreover, other studies have underlined the direct negative impacts of CO2 on occupants, in the range of concentrations typically found in buildings. For example, Kajtar et al. 12 reported that controlled human exposures to CO2 between 2000 ppm and 5000 ppm, with ventilation rates unchanged, were positively associated with perception of wellbeing and performance on some reading tasks. More recently, a study by Xu et al. 13 found that sleep quality was negatively affected by increasing concentrations of CO2 up to 3000 ppm. Moreover, Mishra et al. 14 showed that with lower CO2 levels, the number of awakenings throughout the night tended to decrease. Another study found that seven of nine aspects of work performance were significantly and negatively impacted by a CO2 level of 2500 ppm. 15 It should be noted, however, that two small studies (one with 10 healthy college-aged volunteers and another with 25 similarly aged participants) presented findings that did not demonstrate an increase in physical symptoms or in a decline in office related tasks from levels of CO2 (without bioeffluents) of up to 5000 ppm.16,17
In another strand of research, to address the challenges of modelling energy demand and IAQ with building performance simulation tools, understanding and modelling of occupants’ operation of windows has gained momentum in the last two decades.14,18,19 Specifically, a number of studies have introduced probabilistic models of window operation, which could explain the occupants’ interactions with windows based on statistically significant indoor and outdoor environmental parameters.20,21
Arguably, the above-mentioned studies have become especially relevant as the extraordinary circumstances associated with the Covid-19 outbreak has resulted in unprecedented patterns of household occupancy. If people continue to spend more time at home following the 2020 global pandemic, it will be more critical to ensure that IAQ in houses meets the recommended standards without excessive energy use. To this end, the present study benefits from one-year’s worth of monitored data to reveal the impact of the lockdown on IAQ and patterns of opening and closing windows by occupants. Moreover, the study deploys calibrated building performance simulation to investigate the potential of different ventilation strategies. For the purpose of the present paper, the monitoring-based study explores the concentrations of CO2, PM10 and PM2.5 and the simulation-based tests focus on CO2 concentration as a proxy for IAQ.
Method
Monitored data
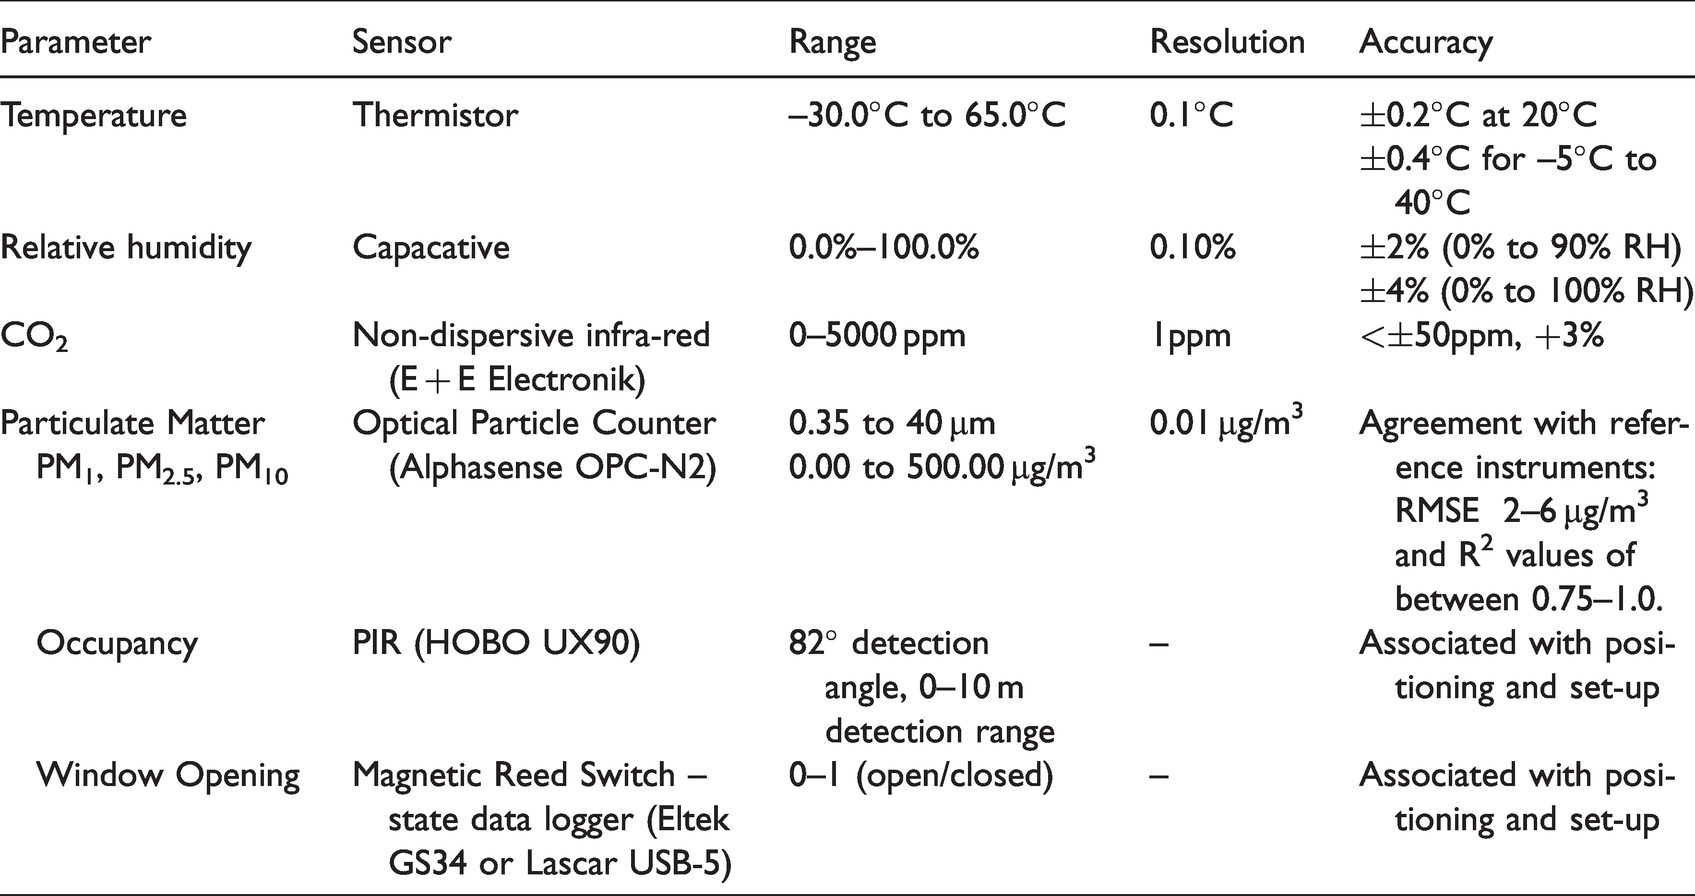
During the first enforced lockdown in London in spring 2020, the authors took advantage of remote access to a set of monitoring devices in eight occupied flats in East London, which were part of an investigation since before the outbreak (see Table 1). The flats were located within three buildings at two sites in a dense urban area near major, highly trafficked, roadways. Mean annual PM2.5 levels in these locations is greater than 20–22 µg/m3 and mean nitrogen dioxide levels can exceed 50 µg/m3 according to publicly available monitoring at the sites by Imperial College London. The study used a dataset collected from July 2019 to June 2020 including solar irradiance, wind speed and wind direction, indoor and outdoor air temperature, relative humidity, concentrations of CO2, PM10 and PM2.5 along with occupancy state in bedrooms and living rooms (as detected by PIR sensors) and operation of windows (as captured by contact sensors) at 5-min intervals.
The monitoring equipment and specifications.
The data analysis examined the impact of the lockdown at two scales. The first fortnight of lockdown was compared with the fortnight prior, to quantify the immediate impact of the lockdown. Then, to get a broader understanding of the overall effect, a 3-month period mid-lockdown has been compared with a 3-month period in the previous year with similar weather conditions.
Window operation analysis and modelling
Prior to modelling the occupant interactions with windows, three metrics are used to capture the key characteristics of window operation by occupants in pre-lockdown and lockdown periods: Overall fraction of open state [−] Median open state duration [h] Opening rate in occupied intervals [h−1]
Addressing the state of windows, the first metric gives an overall picture of window openings and the second metric captures the typical duration of window opening instances. The third metric, however, encapsulates the opening actions and normalises them based on the duration of time when the room is occupied. 22
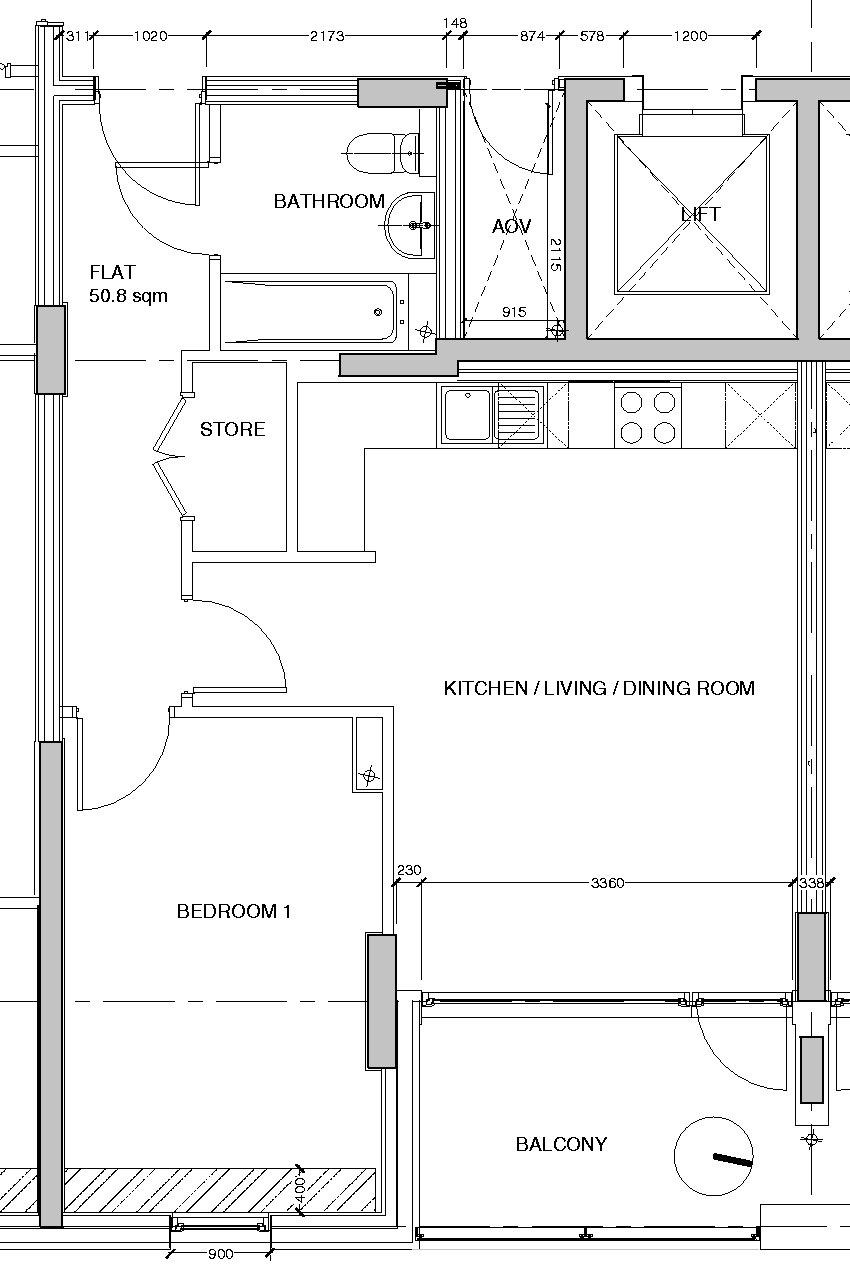
To develop models of occupant behaviour, the authors examined a range of measured indoor and outdoor parameters in terms of their potential to explain the monitored window operation (Table 2). Thereby, to minimise multicollinearity, a pairwise correlation check was conducted as an initial variable selection process. Subsequently, using the non-correlated independent variables, logistic regression models of window opening and closing actions for all monitored windows were developed. This process involved estimating the regression coefficient (β1) and intercept (β0) in equation (1), where P is the probability of opening or closing windows and x refers to different independent variables. P-value was used to judge the statistical significance of each variable at 0.05 significance level.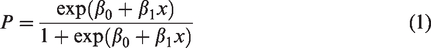
The parameters examined to explain occupants’ operation of windows.
The calibrated building model
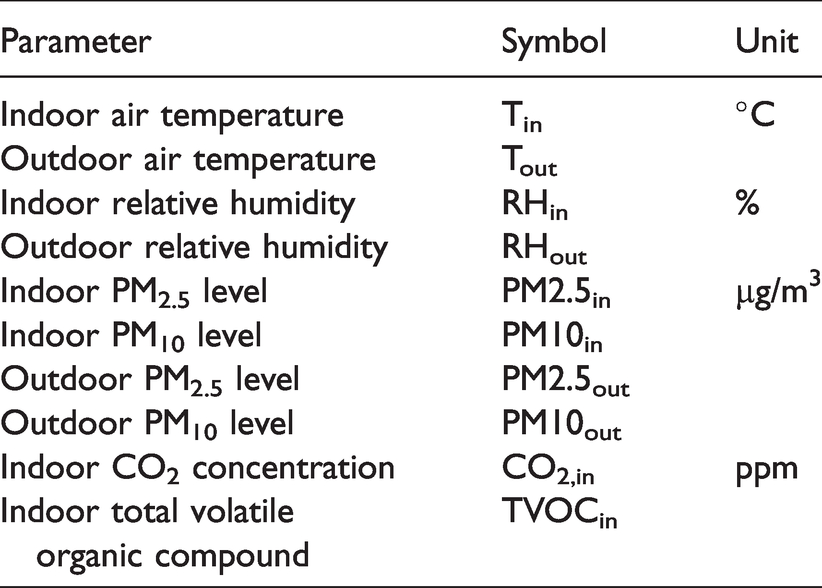
The authors modelled one of the monitored flats (flat 4) in the building simulation tool EnergyPlus 9.4. This is a 50.8 m2 one-bedroom flat with one-sided ventilation through two east-facing windows in the bedroom and living room (see Figure 1). The building envelope is highly insulated with U-Values of 0.18, 0.92, 0.13 and 0.12 [W/m2.k] for the walls, windows, ceilings and floors respectively. The building is also equipped with mechanical ventilation with heat recovery (MVHR). In the simulation test case number 7 (see next section), MVHR operates night and day in the heating season, providing 7 L/s.person outdoor air with a sensible heat recovery effectiveness of 0.75.
The floor plan of the modelled flat.
For the purpose of current study, the EnergyPlus building model is mainly indented to estimate indoor CO2 concentrations under different ventilation scenarios. The model comprises of five thermal zones including bedroom, living room, store, corridor and bathroom. The airflow through the windows and across the zones is simulated using the multi-zone airflow network model of EnergyPlus. The walls, floor and ceiling, adjacent to the neighbouring flats, are assumed to be adiabatic.
Whereas previous efforts have predominantly relied on energy use data or monitored indoor temperatures to calibrate building thermal performance models (e.g.),23,24 the present study uses monitored CO2 concentrations directly to calibrate a building model tailored for indoor air quality assessments. More specifically, the following steps were carried out to prepare an initial thermal performance model of the flat for calibration: The calibration period was set to 15 July to 31 October 2019, during which time the MVHR system was not operating in the flat. Thermal properties of the building fabric elements and internal heat gain sources (other than occupants) were defined based on the best information available to the modellers. Monitored data on occupancy, window states and on-site outdoor CO2 concentration from the calibration period were incorporated into the EnergyPlus model to reduce the number of unknown parameters in the underdetermined calibration problem. Hourly outdoor environmental data from the same period (including air temperature, air relative humidity, global, diffuse and direct irradiance along with wind speed and direction) were used to create real-year weather data for the purpose of model calibration.
To produce a more reliable building model, the key input parameters governing the air flow model and CO2 generation were subjected to calibration. These were opening factors for the open state of windows and interior doors, air mass flow through closed openings, and occupants’ activity level and CO2 generation rate. As given in Table 3, for the initial model, the opening factors and air mass flow through closed openings were set based on the values in DesignBuilder software library for medium-tight openings and cracks. The initial activity level value was assumed based on the modeller’s estimation, and the initial occupant carbon dioxide generation rate was set to EnergyPlus default value. Subsequently, an iterative process of minimizing the errors in the predicted CO2 concentrations was conducted. Two error metrics, namely Mean Bias Error (MBE) and Root Mean Square Error (RMSE) captured the model predictive potential in the calibration period. The authors also largely benefitted from visualizations of model predictions in the process, so that the resulting calibrated model could better predict the patterns of CO2 decay and build-up in different rooms.
Model inputs subjected to calibration.
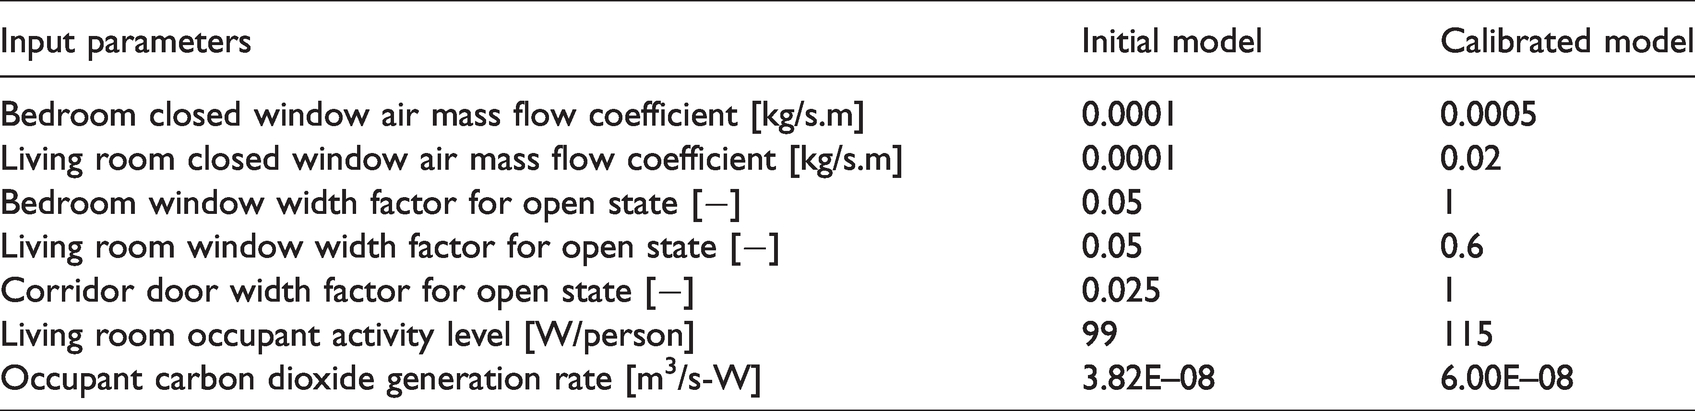
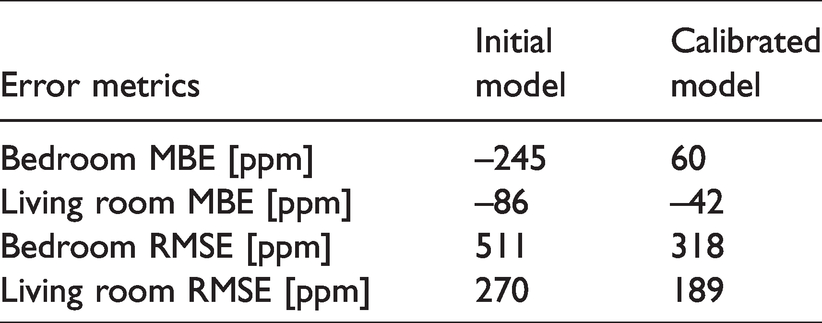
Figure 2 illustrates a 2-day section of the estimated CO2 concentrations in the living room obtained from the initial and calibrated building models compared with the monitored concentrations. Table 3 lists the calibration variables and their values in the initial and calibrated models and Table 4 gives the obtained error metrics for the estimated CO2 concentrations by the initial and calibrated models in the bedroom and the living room.
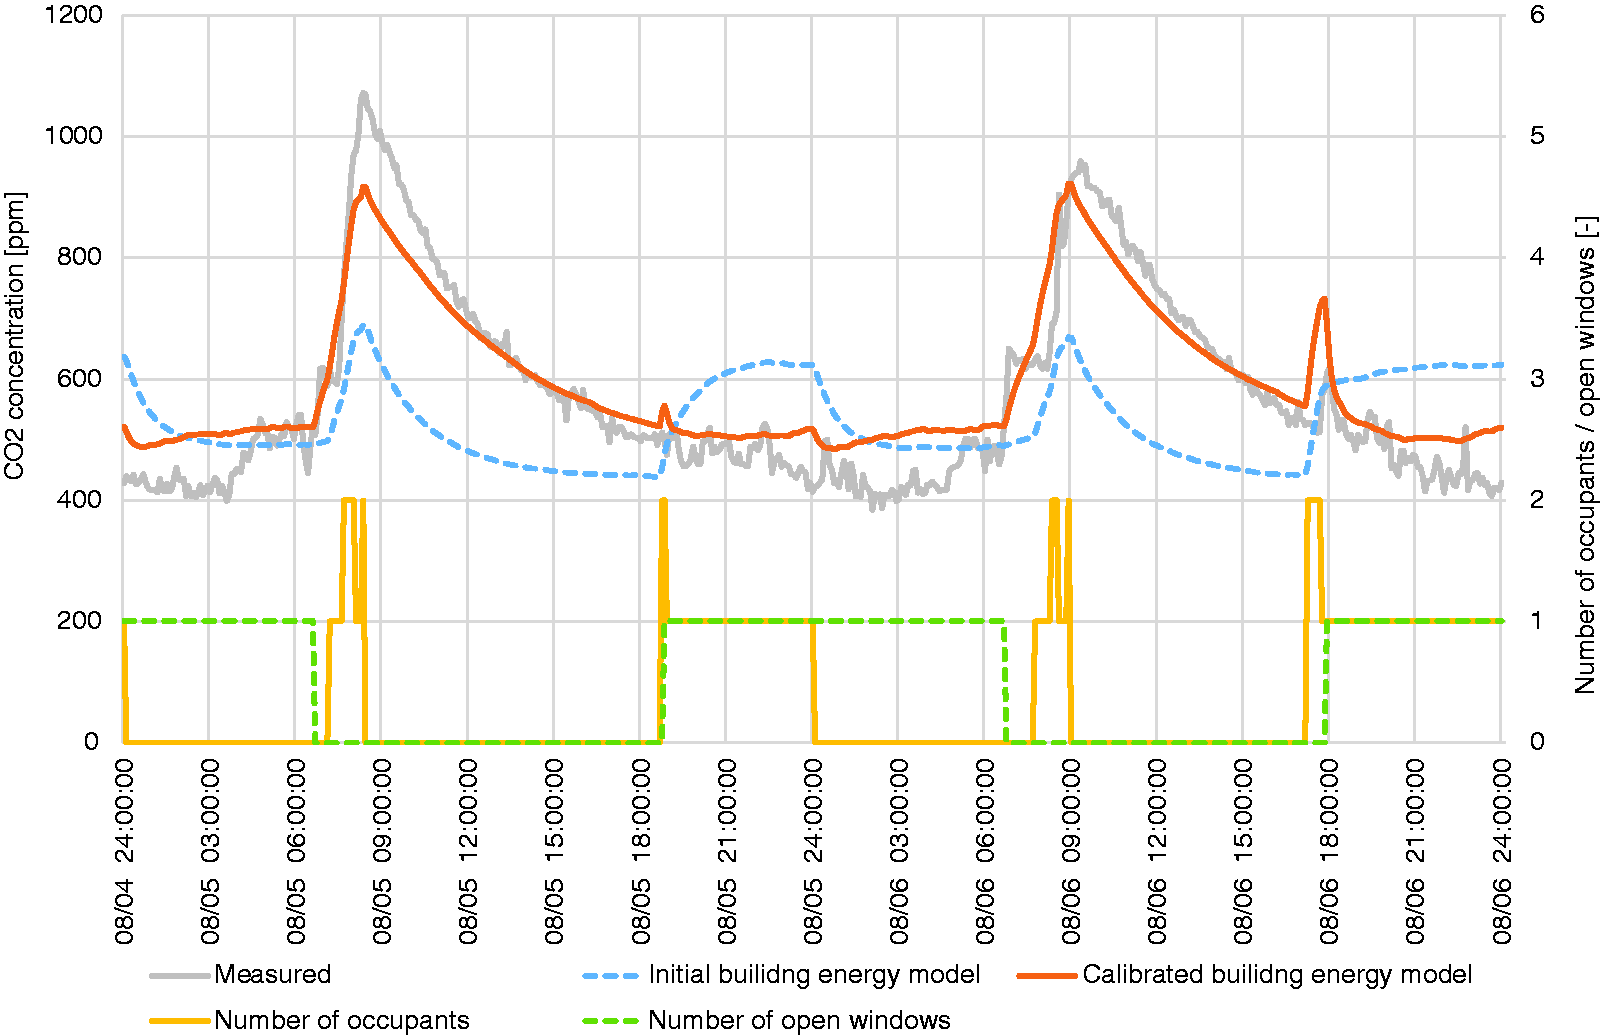
A two-day section of predicted living room CO2 concentrations by the initial and calibrated building energy models in comparison with the measured values.
Errors from the initial and calibrated models.
Building simulation test cases
Using the calibrated thermal performance model, the authors examined a number of occupancy and ventilation scenarios to get a better picture of the impact of lockdown on IAQ and the mitigating potential of different ventilation strategies. To this end, two occupancy patterns were considered, namely a common home occupancy schedule before the outbreak (referred to as normal occupancy, in this case involving 2 occupants in the flat from 18:00 to 8:00 (+1) on weekdays and from 13:00 to 10:00 (+1) on weekends), and a constant full occupancy (referred to as lockdown occupancy). In terms of ventilation, a worst case scenario of no window operation, two effective patterns of natural ventilation in free-running and heating seasons, and use of MVHR system were studied. Thus, the simulation-based study involved the following simulation test cases: Non-heating season, normal occupancy, no window operation or mechanical ventilation Non-heating season, lockdown occupancy, no window operation or mechanical ventilation Non-heating season, lockdown occupancy, bedroom window open for 1 hour in the morning, living room window open in waking hours Heating season, normal occupancy, no window operation or mechanical ventilation Heating season, lockdown occupancy, no window operation or mechanical ventilation Heating season, lockdown occupancy, 1 to 2 windows open for 15 min every 4 waking hours Heating season, lockdown occupancy, MVHR providing 7 L/s.person outdoor air.
Building performance metrics
To capture the occupants’ exposure to relatively high levels of CO2 concentration, the following building performance metrics were obtained for each simulation test: Peak CO2 concentration in each room [ppm] Sleeping time CO2 above 2500 [%]: This is the percentage of sleeping hours in the bedroom with CO2 concentrations above 2500 ppm. Active time CO2 above 2500 [%]: This is the percentage of occupied hours in the living room with CO2 concentrations above 2500 ppm.
The threshold of 2500 ppm is set based on the aforementioned study by Satish et al. 15 on the impact of low to moderate CO2 concentrations on human decision-making performance. While, for bedrooms, Mishra et al., 14 as an example, suggest a CO2 threshold close to 1150 ppm (beyond which sleep of healthy young adults may start getting compromised), for the purpose of the current study we utilized a single threshold for both rooms. Furthermore, to study the implications of different ventilation strategies for building energy use, the building heating energy load in kWh/m2 was estimated for each heating season test case. A heating setpoint of 22°C has been used when calculating the heating energy load.
Results and discussion
Monitored air quality and window operation
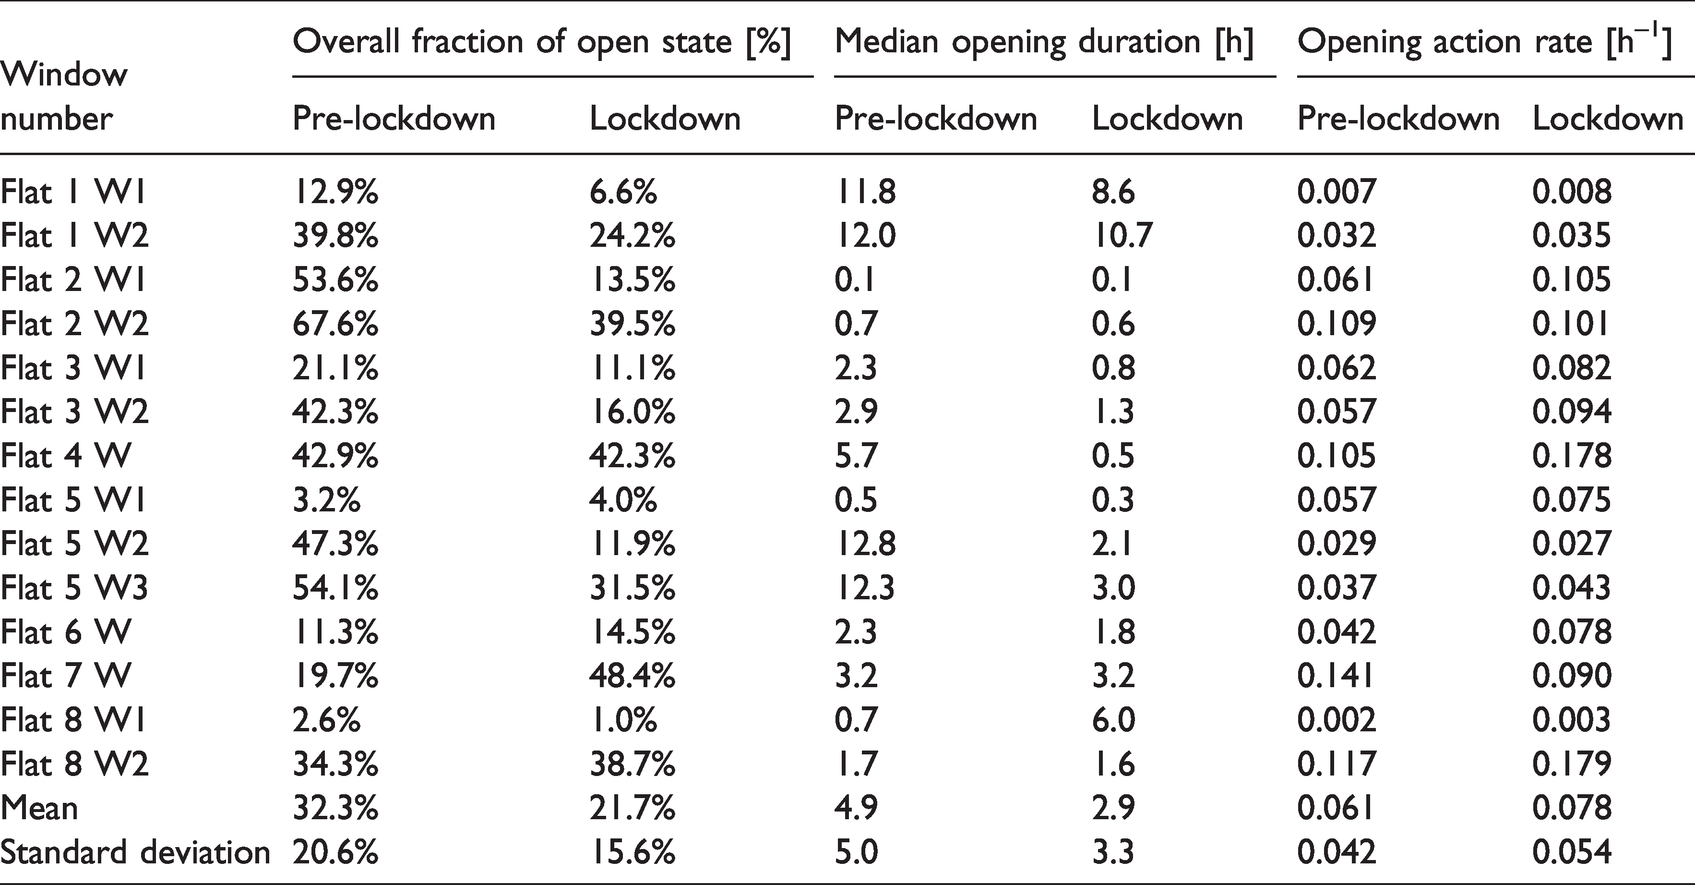
The monitored data – not surprisingly – revealed a substantial increase of occupancy levels in the studied flats especially on weekdays, as shown in Figure 3. Nonetheless, rather unexpectedly, occupants have relied less on natural ventilation (Figure 4). Table 5 suggests that during the lockdown period occupants have opened the windows for far shorter periods of time (a mean value of 2.9 versus 4.9 h) resulting in a lower overall fraction of open window state (21.7% versus 32.3%). While this can be partly explained by the slightly higher outdoor temperatures in the selected pre-lockdown period, the data from the fortnights around the lockdown (with very similar weather conditions) confirms the decreased level of night-time natural ventilation by occupants. The outcome of this higher occupancy and lower natural ventilation can be clearly seen in Figure 5, which shows that the living room median CO2 concentration has increased up to 300 ppm at specific hours. Figure 6 also reveals that, despite the lower outdoor PM10 concentrations on weekdays during the lockdown, indoor PM10 concentrations rose on weekdays (as well as on weekends) in this period.
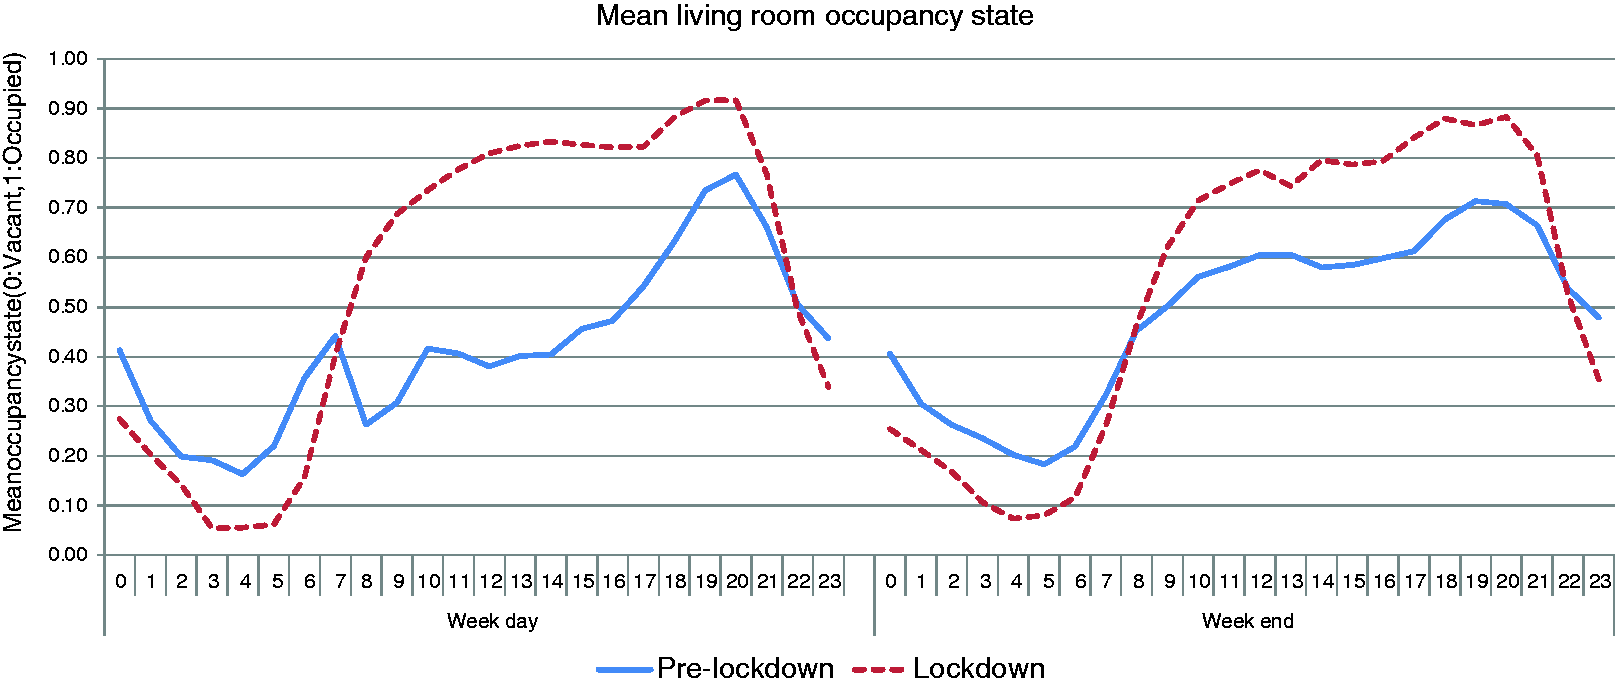
Mean living room occupancy state on weekdays and weekends of two 3-month periods prior to and during lockdown.
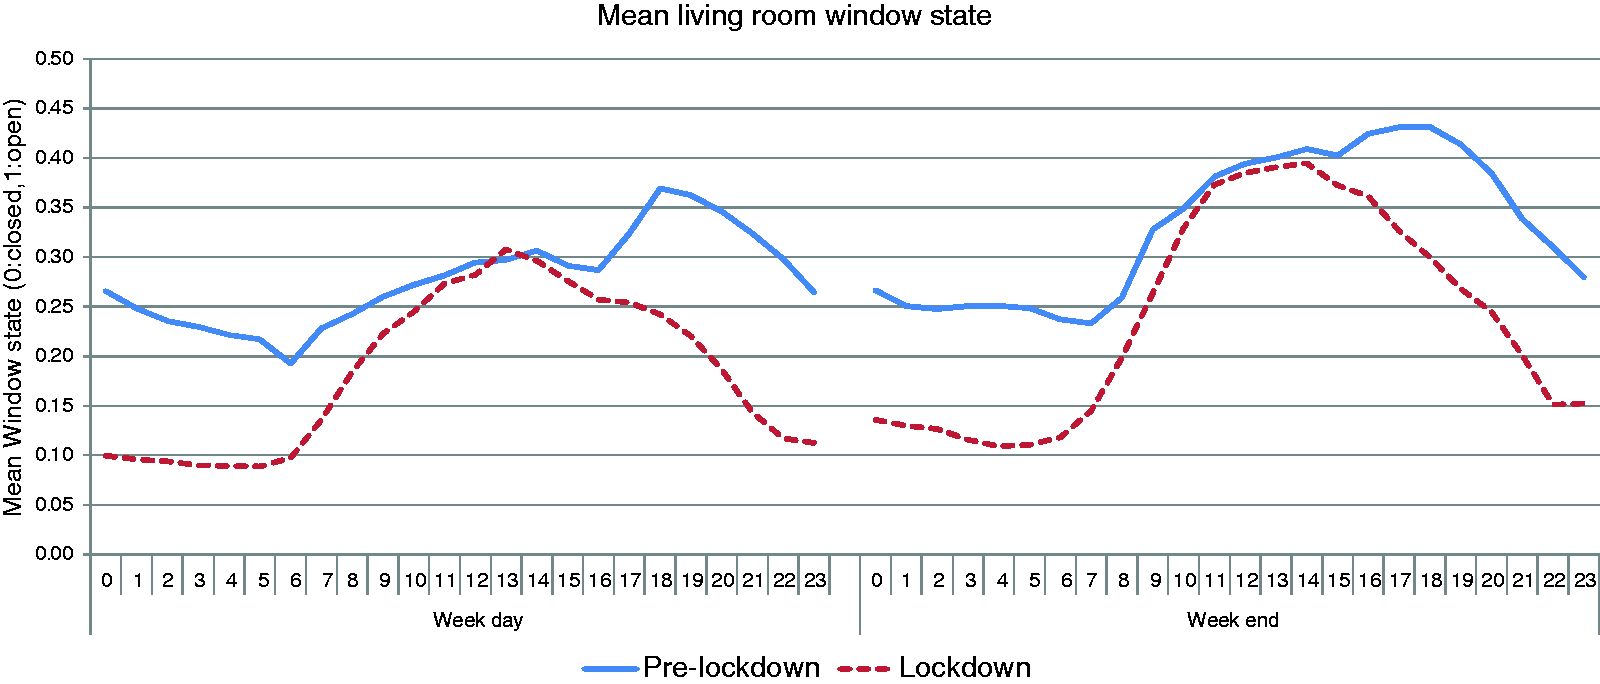
Mean living room window state on weekdays and weekends of two 3-month periods prior to and during lockdown.
Window operation metrics.
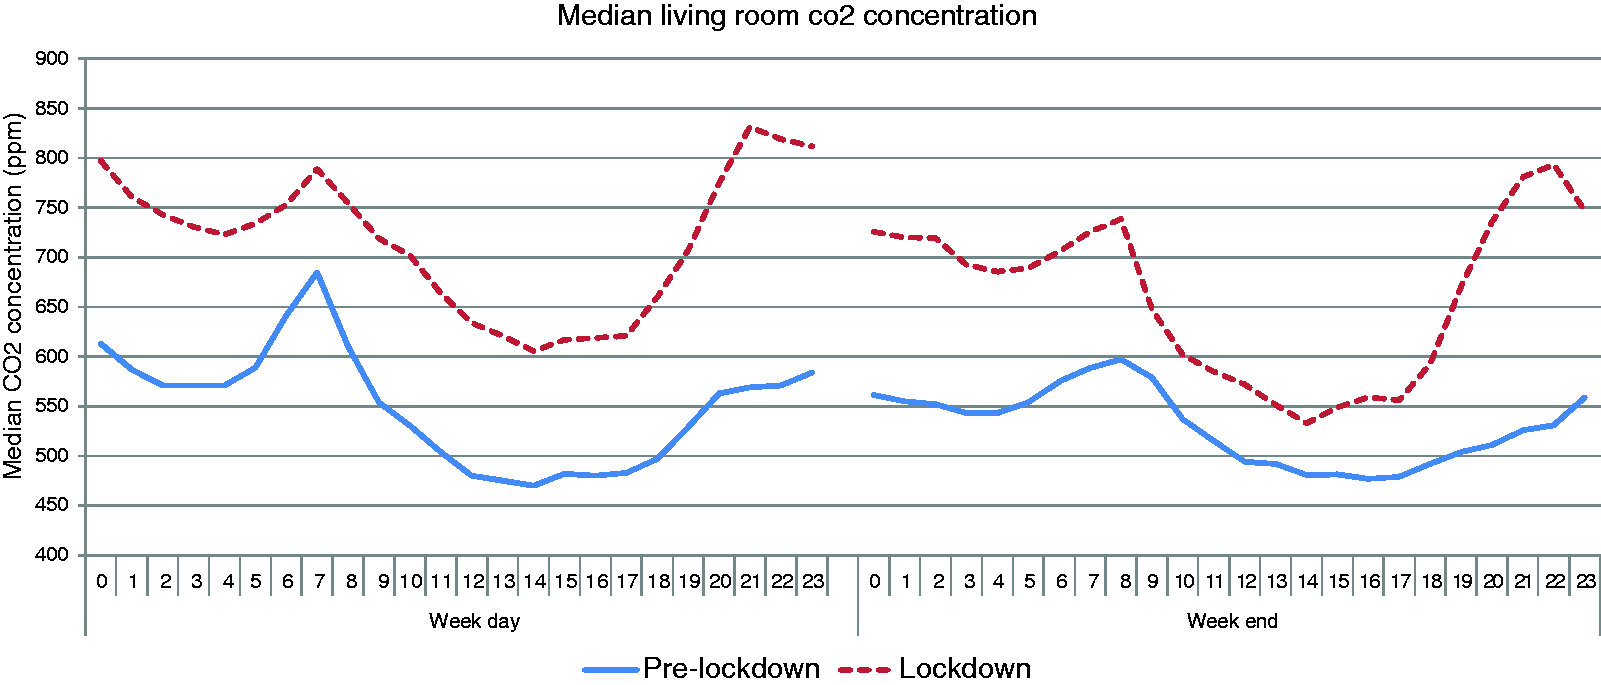
Median living room CO2 concentration on weekdays and weekends of two 3-month periods prior to and during lockdown.
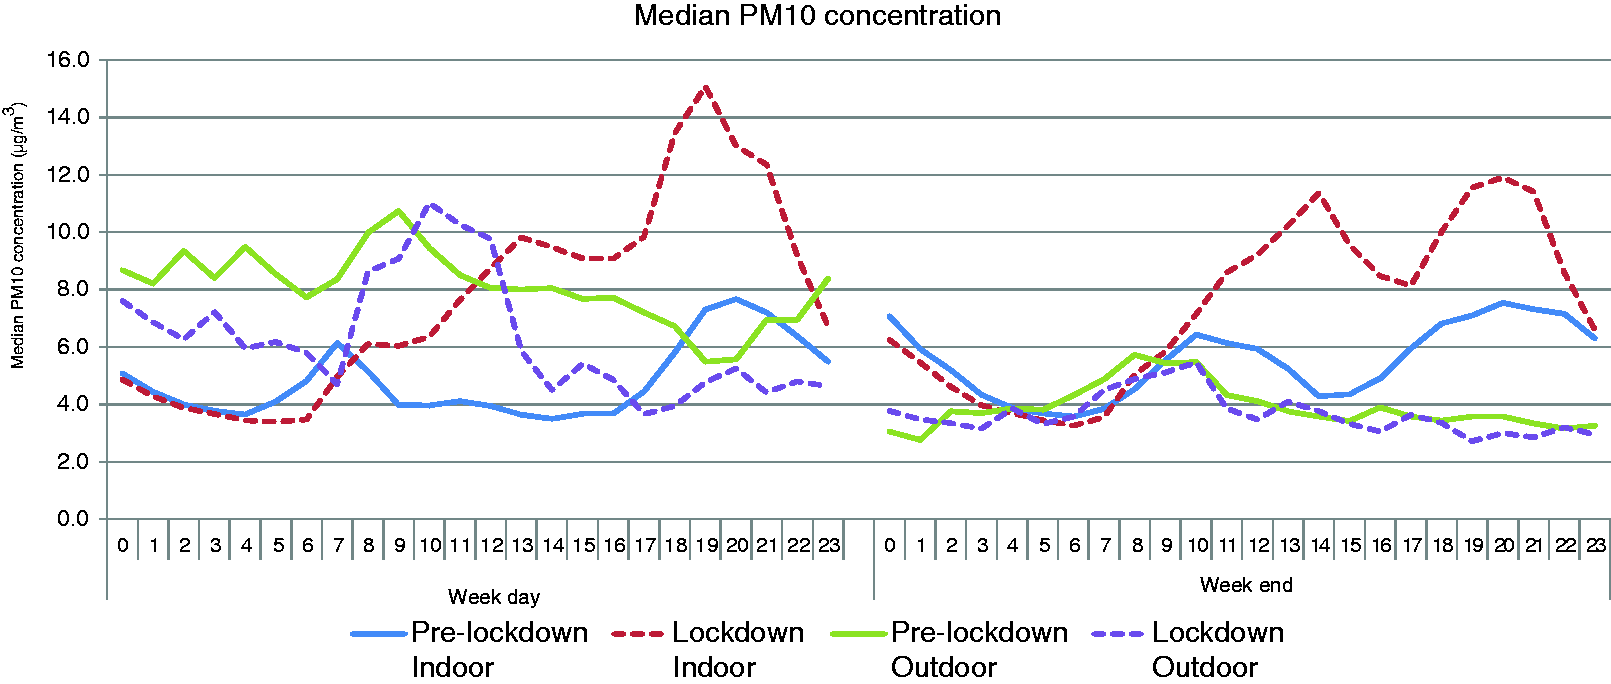
Median indoor and outdoor PM10 concentration on weekdays and weekends of two 3-month periods prior to and during lockdown.
Window operation driving factors
Before identifying the main driving environmental factors behind the operation of windows by occupants, the correlation analysis detected highly correlated parameters of Tin and Tout, RHin and RHout, PM2.5,in and PM10,in, and PM2.5,out and PM10,out. Therefore, to minimise multicollinearity, the subsequent variable selection procedure (based on statistical significant test) was applied to a subset of measured parameters including Tin, RHin, CO2,in, PM2.5out, PM2.5in, and TVOCin.
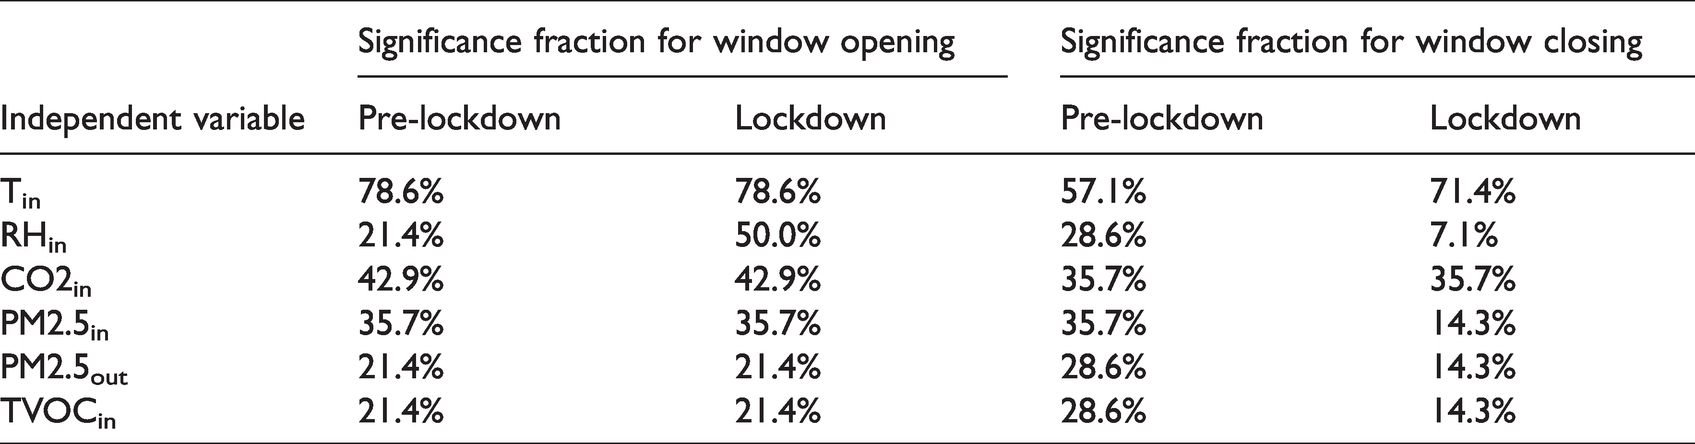
Table 6 summarizes the results of the statistical significance test. It gives the fraction of 14 monitored windows in 8 studied flats, where each independent variable is statistically significant to explain the opening and closing actions. These fractions clearly suggest that indoor temperature is the main driving factor for opening and closing windows in both pre-lockdown and lockdown periods. In contrast, the variables representing indoor air quality do not explain the operation of windows in the majority of flats. Given the rather similar significance fractions in the pre-lockdown and lockdown periods, one can argue that the thermal comfort-driven window operation behaviour of occupants has not changed during the lockdown.
The statistical significance fraction of different environmental parameters to explain window opening and closing actions across the studied flats.
Window operation models
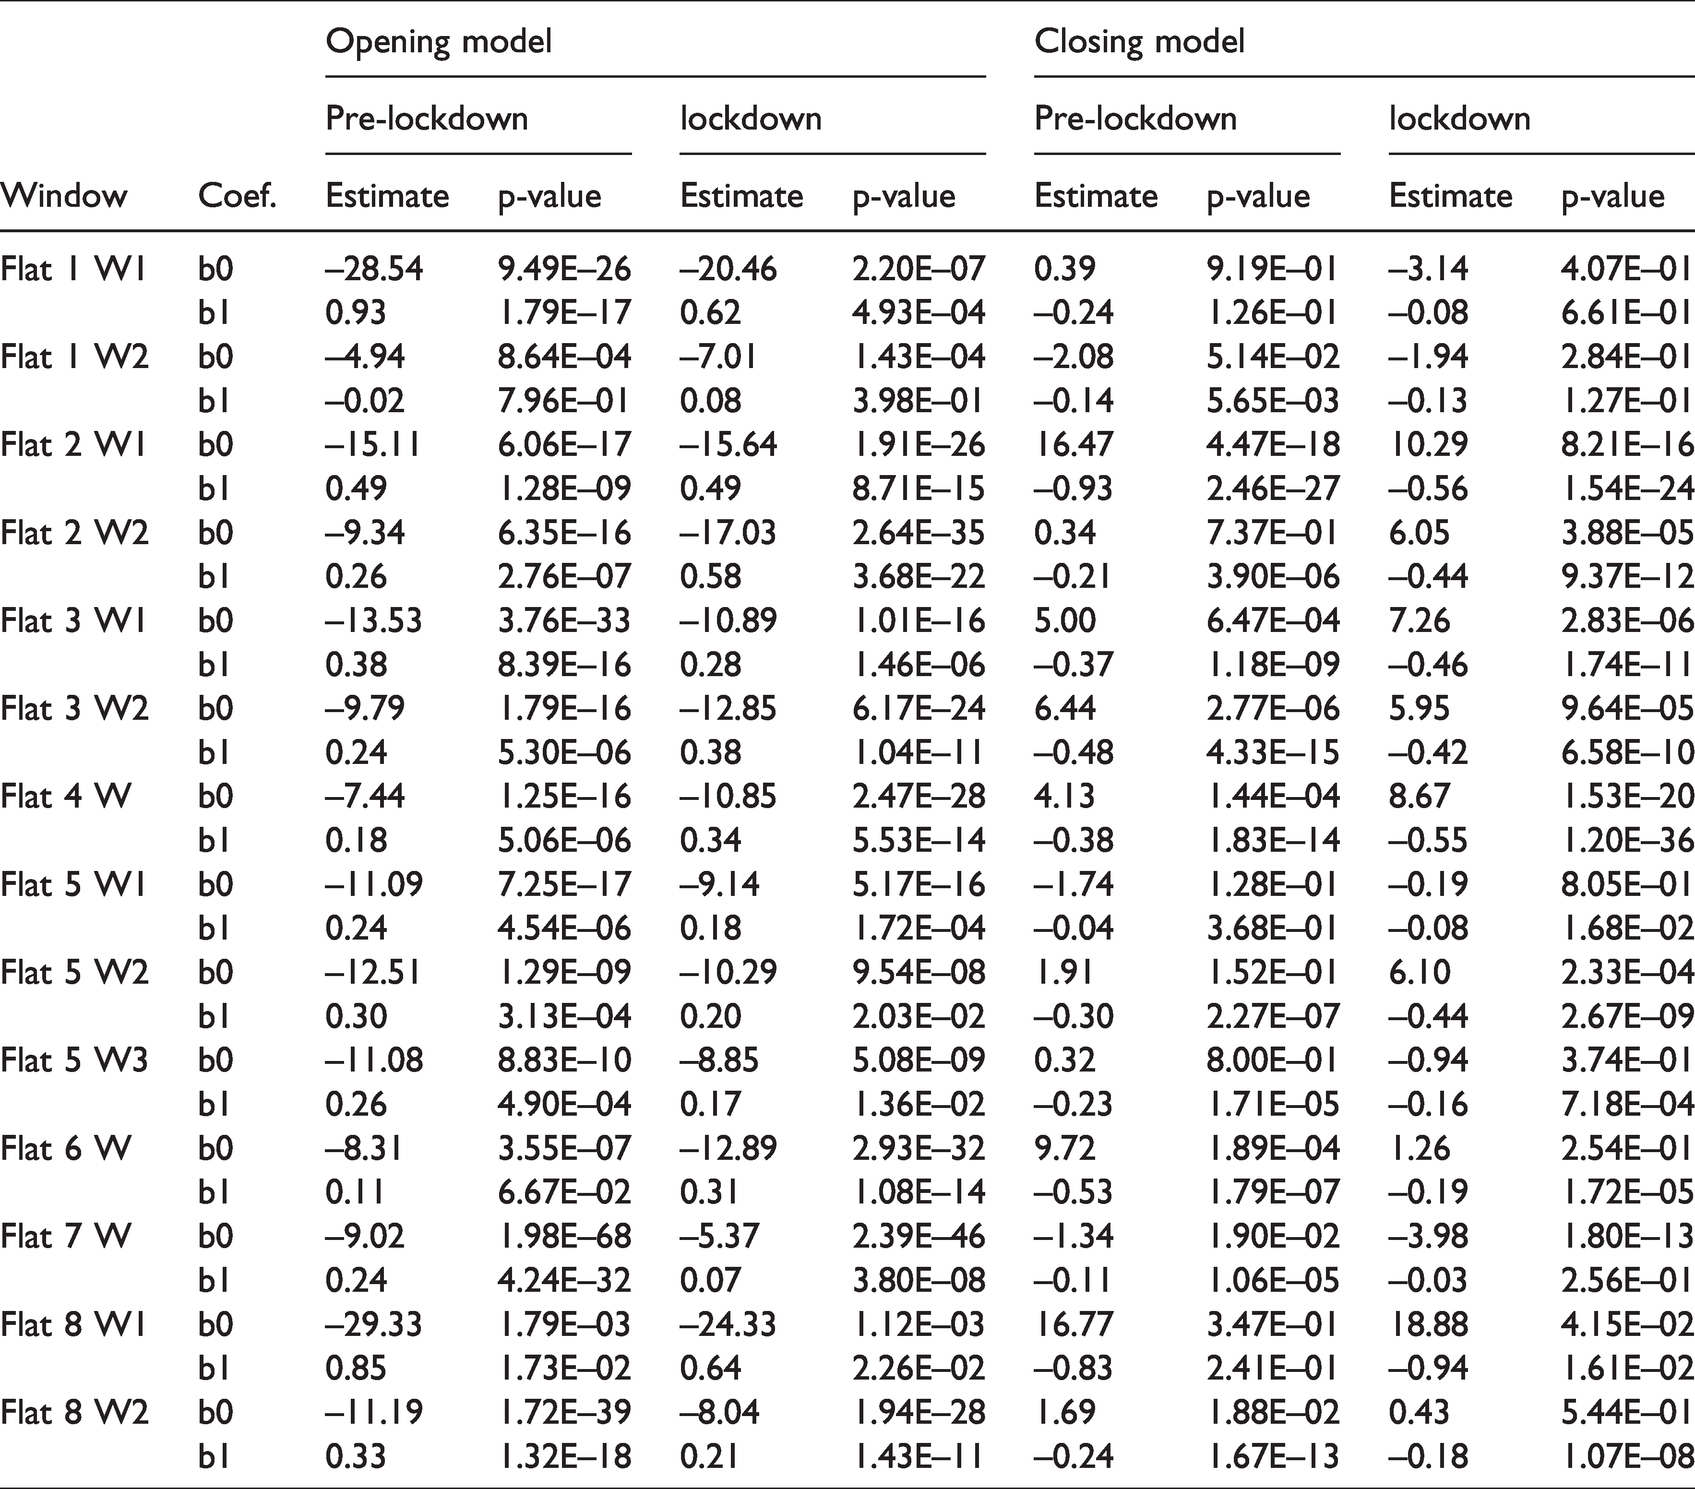
Given the dominance of indoor temperature to explain window operation across the monitored flats, for the purpose of the current study, only indoor temperature-based univariate models of window opening and closing actions are presented in Figure 7. Moreover, the estimated coefficients of these models are given in Table 7. These models give the probability of opening and closing windows at different indoor temperatures in the studied flats. As can be seen clearly in Figure 7, the window opening and closing trend remains the same in the pre-lockdown and lockdown periods: People are more likely to open windows at higher indoor temperatures and close them at lower indoor temperatures. However, the resulting models suggest that at any given indoor temperature, it is slightly more likely for occupants to close the windows during the lockdown.
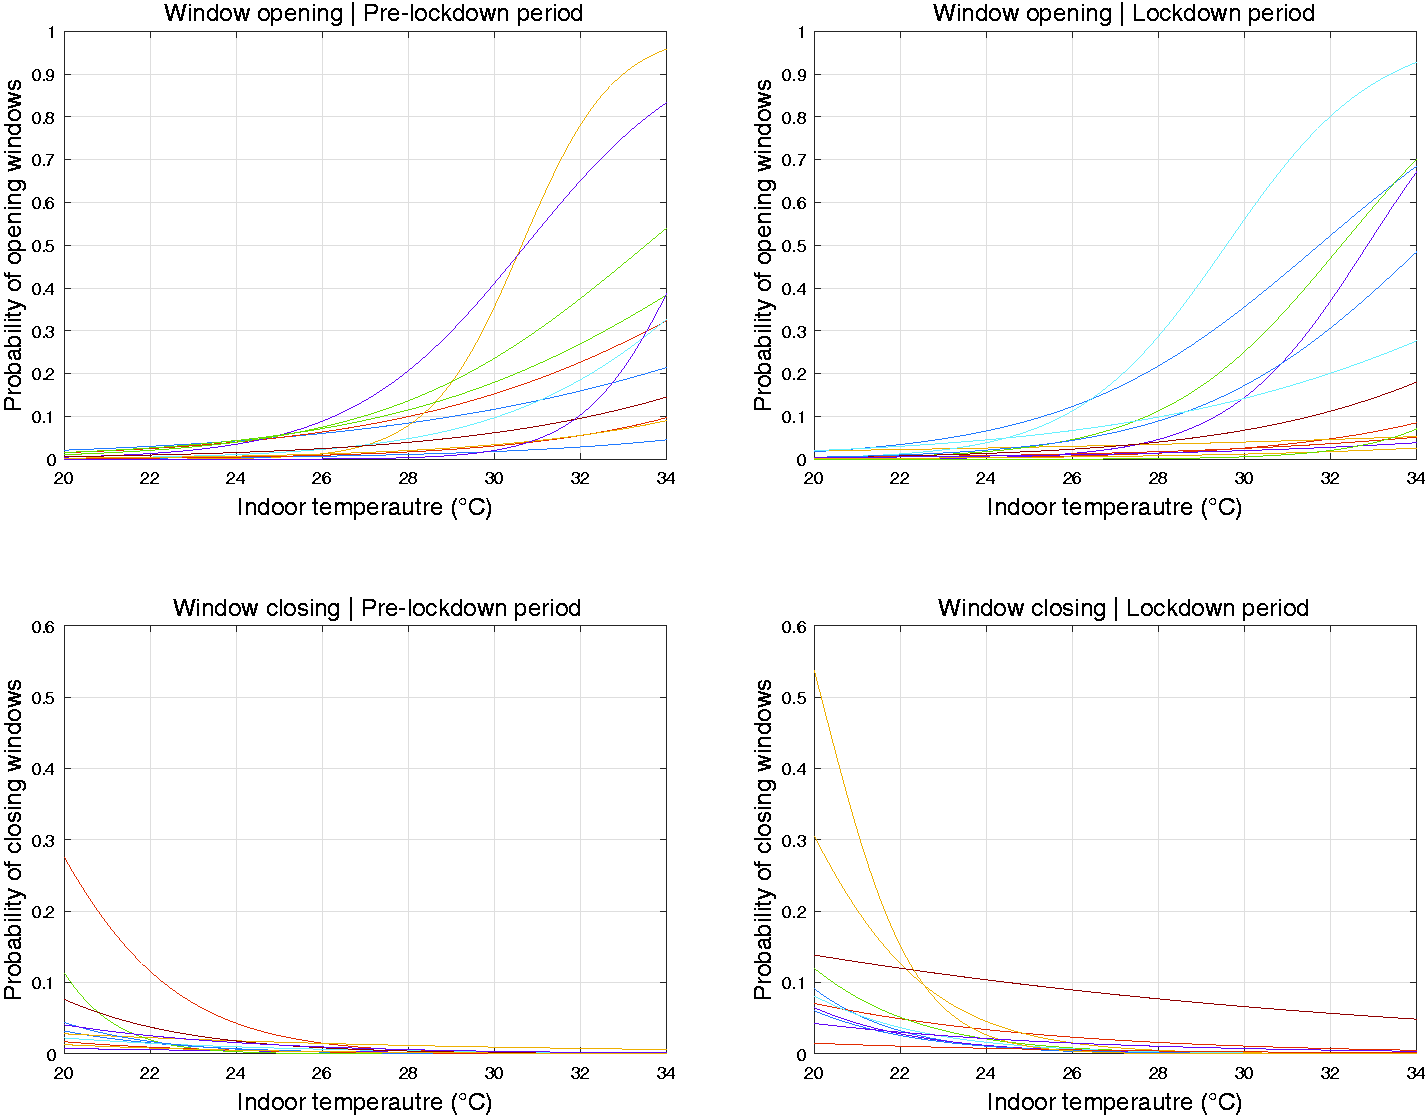
Window opening and closing models.
The estimated coefficients for univariate window opening and closing models.
Simulation-based investigations
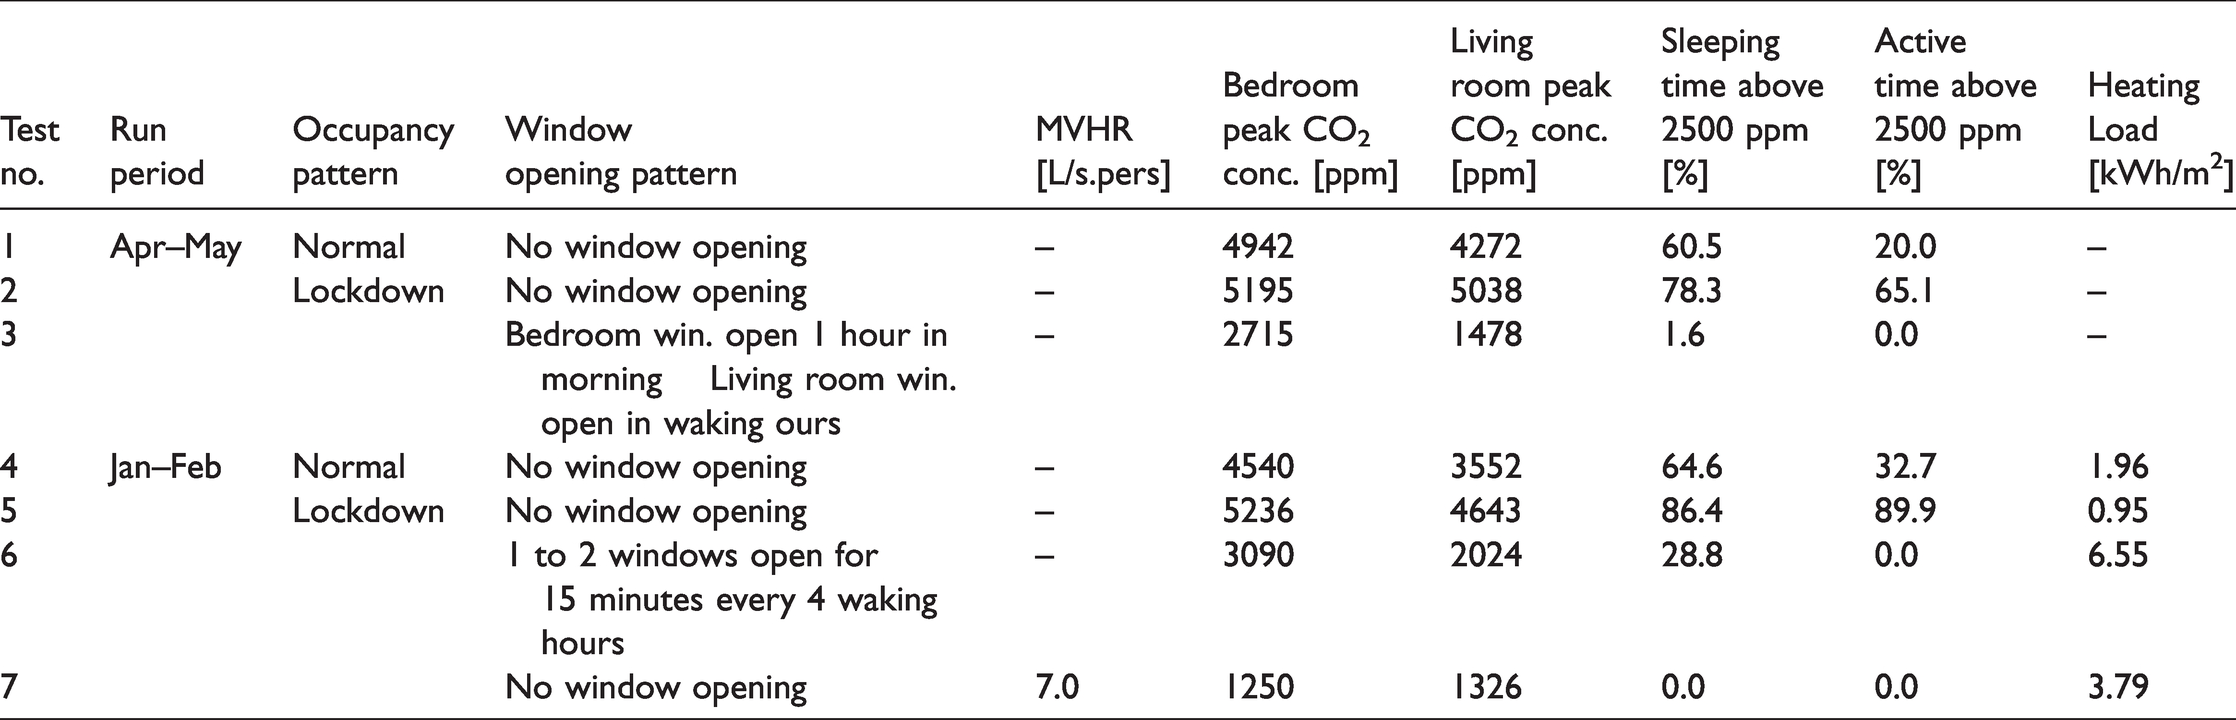
Firstly, considering the worst-case scenarios, the simulation results suggest that the extended occupancy hours during a lockdown can significantly increase occupants’ exposure to CO2 (see Table 8, tests number 1, 2, 4 and 5). For example, during a lockdown in the heating season, occupants could face CO2 concentrations of above 2500 ppm for almost 90% of the time that they spend in the living room, compared to only 33% with a normal occupancy pattern. As illustrated in Figures 8 and 9, the impact of lockdown occupancy on CO2 levels can be seen clearly in both the living room and bedroom, even though the bedroom occupancy patterns are assumed to be identical in the normal and lockdown scenarios.
The simulation tests and the obtained IAQ and thermal performance metrics.
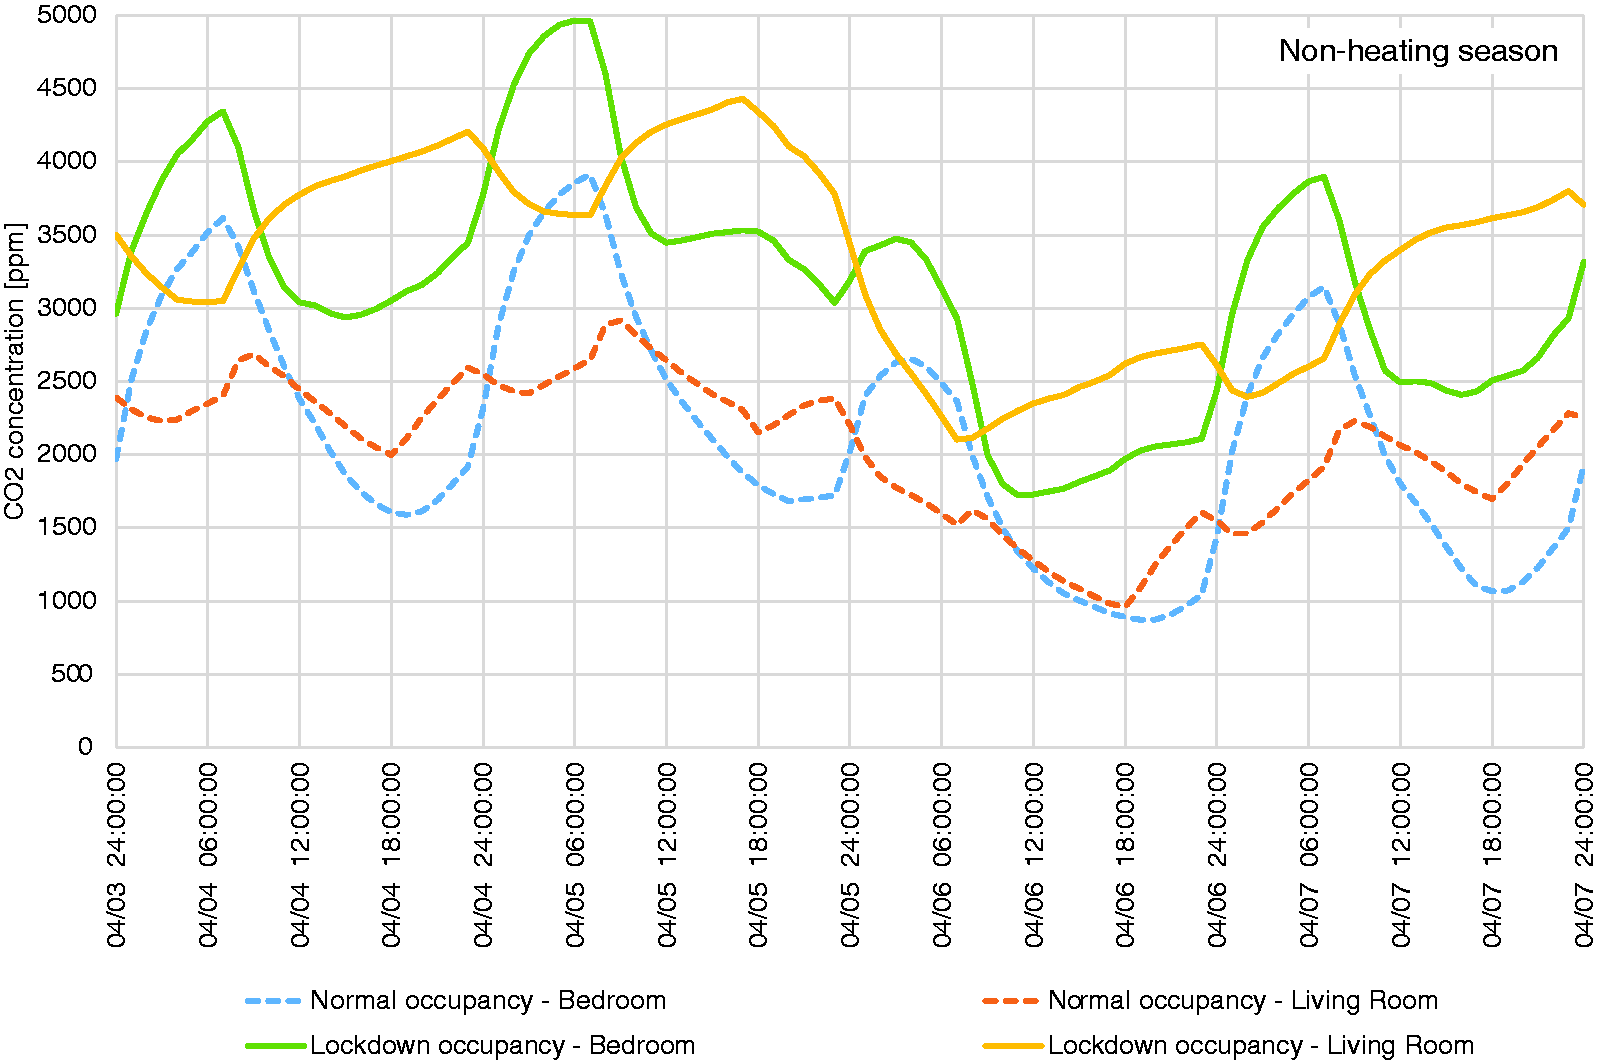
A 4-day section of simulation tests 1 & 2 – Worst-case CO2 concentration in non-heating season without window operation and mechanical ventilation for normal and lockdown occupancy patterns.
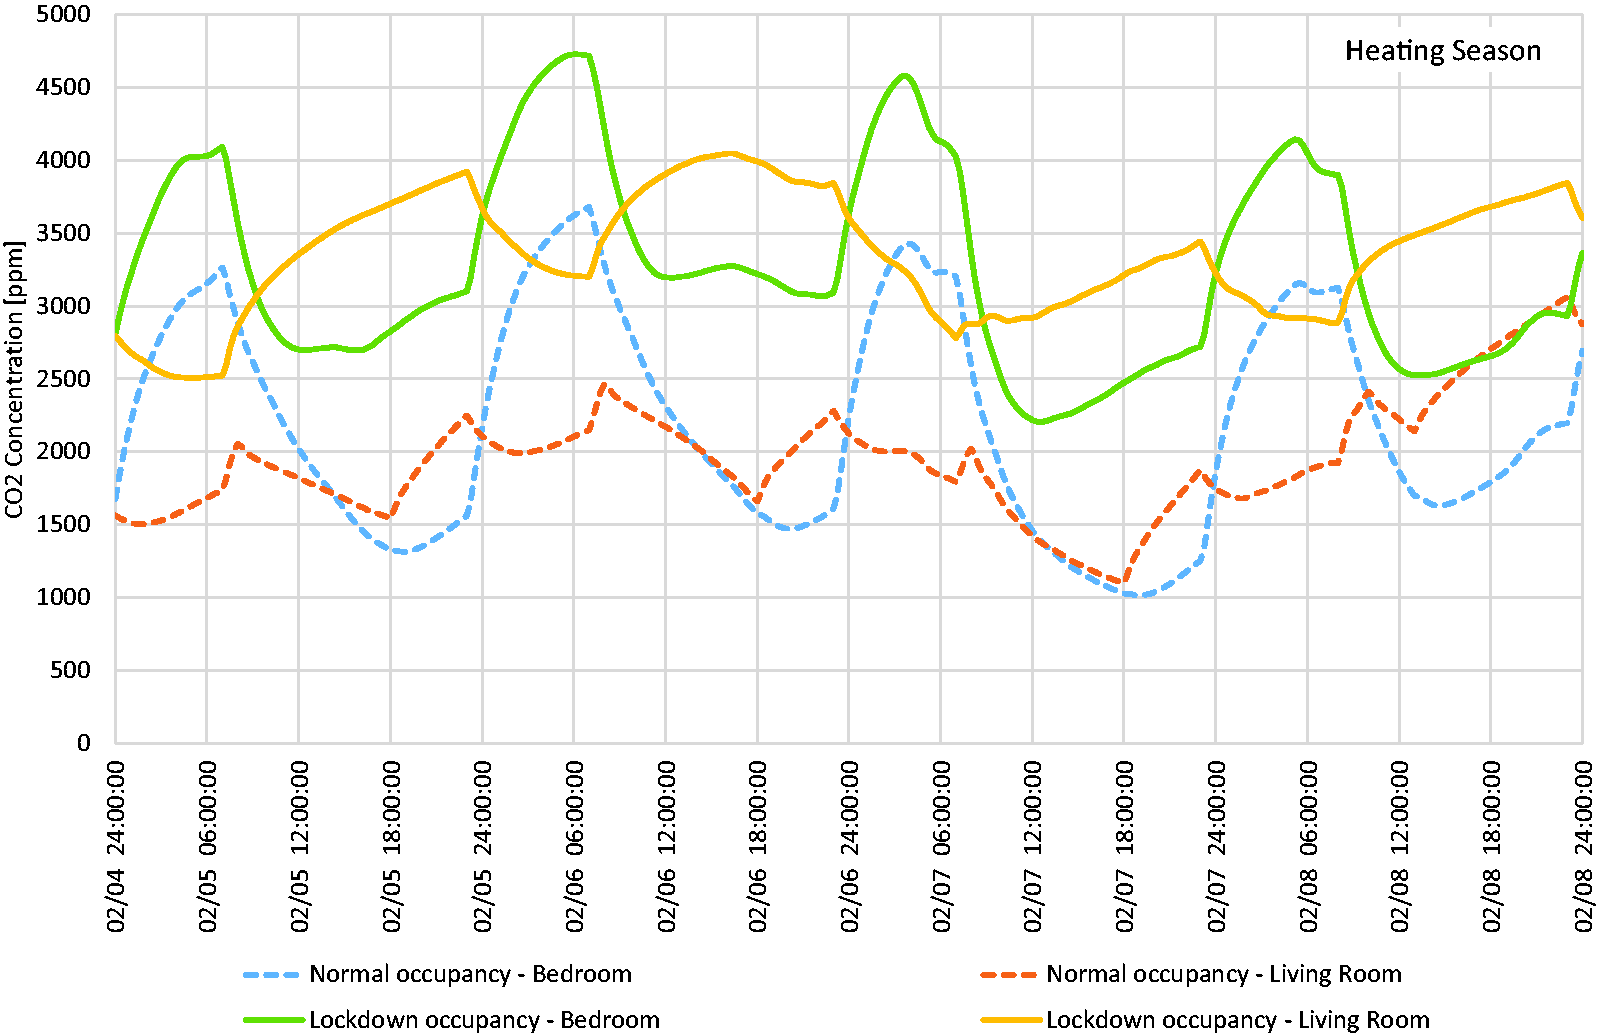
A 4-day section of simulation tests 4 & 5 – Worst-case CO2 concentration in heating season without window operation and mechanical ventilation for normal and lockdown occupancy patterns.
Secondly, as can be seen in Table 8 and Figure 10, the selected natural ventilation strategy for a lockdown during a non-heating season (test number 3) seems to be very effective to reduce CO2. In the living room, the CO2 concentrations never exceed the 2500 ppm threshold. In the bedroom, this happens for less than 2 percent of occupied time, even though the windows in both the bedroom and living room are assumed to be closed during the sleeping time.
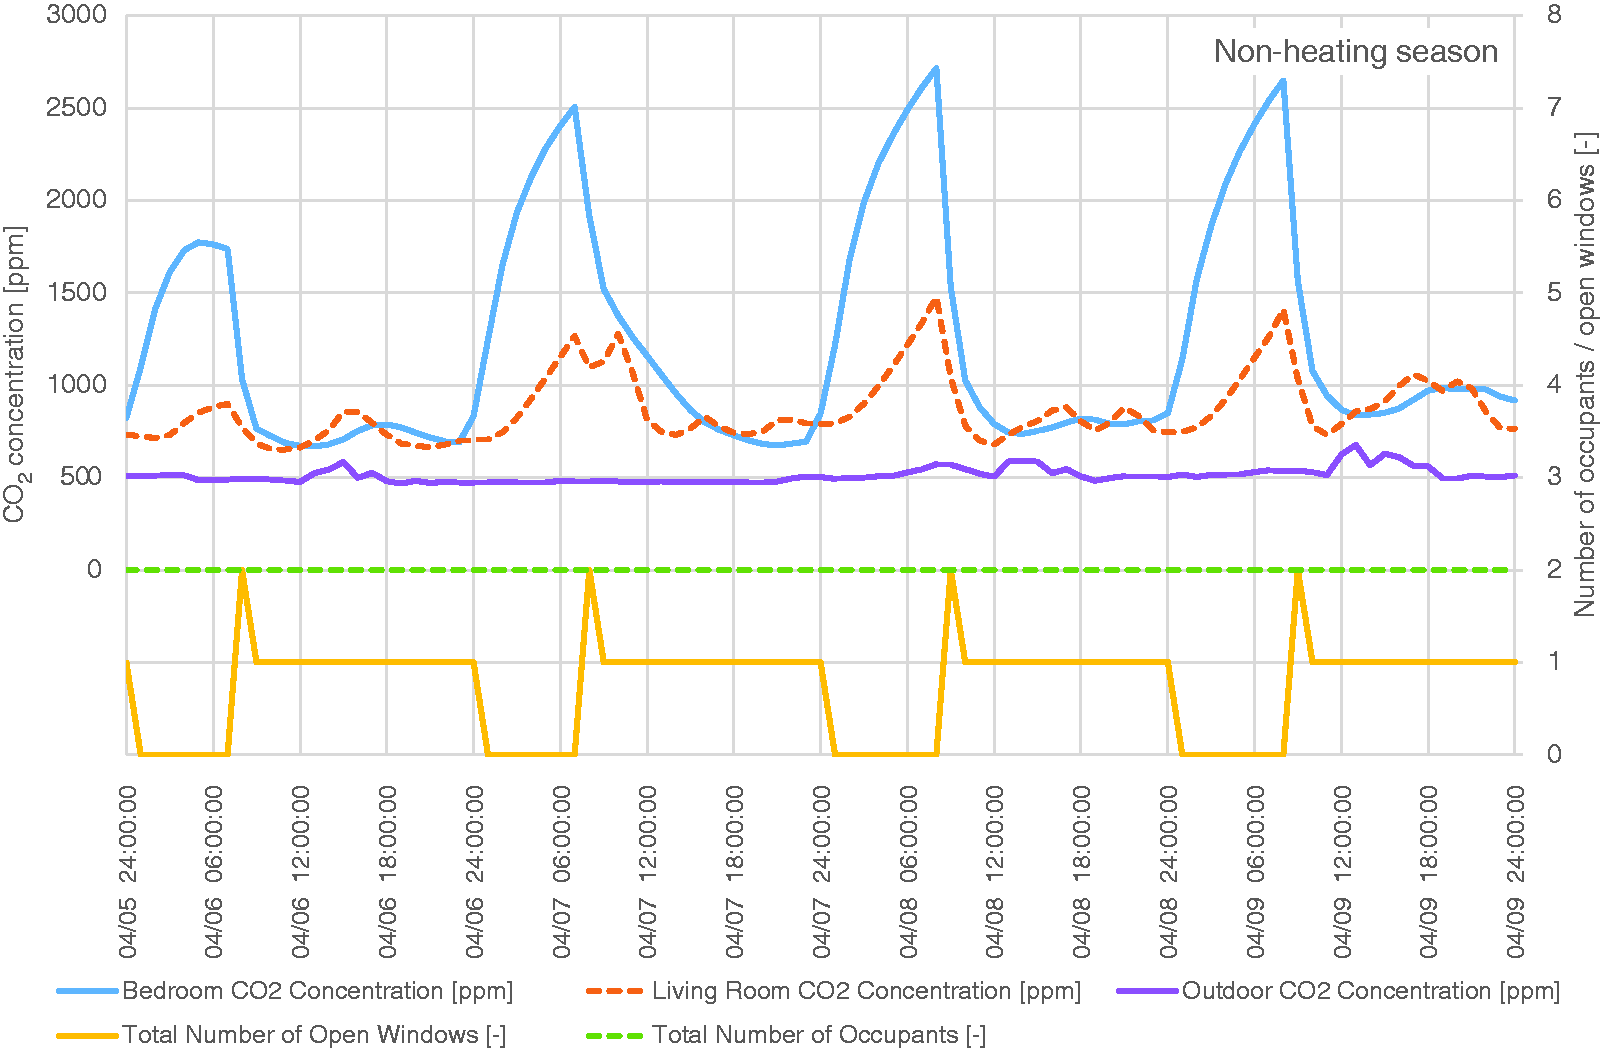
A 4-day section of simulation test 3 – Monitored outdoor and predicted indoor CO2 concentrations in non-heating season with lockdown occupancy pattern and opening of 1 to 2 windows during the day.
Thirdly, although the natural ventilation pattern suggested for the heating season relies on much shorter window openings (test number 6), it manages to noticeably reduce the CO2 levels (see Table 8 and Figure 11). That is, the living room CO2 concentrations never reach the threshold of 2500 ppm and the bedroom CO2 levels exceed this level for only 29% of sleeping hours. However, unsurprisingly, while this window operation during the heating season improves IAQ considerably, there is also an adverse effect on heating demand for this highly-insulated flat (a heating load of 6.55 kWh/m2 for months of January and February compared to that of 0.95 kWh/m2 when windows remained closed in these months). Needless to say, this challenging trade-off between IAQ and heating energy demand, is one of the key arguments for greater use of mechanical ventilation with heat recovery. As can be seen in Table 8 and Figure 12, test number 7 demonstrates that a MHVR system (with a sensible heat recovery effectiveness of 0.75 and providing 7 L/s.person outdoor air), can maintain the CO2 concentrations in both rooms below 1400 ppm. It also reduces the heating demand by more than 40% compared to the solution based on natural ventilation in test number 6.
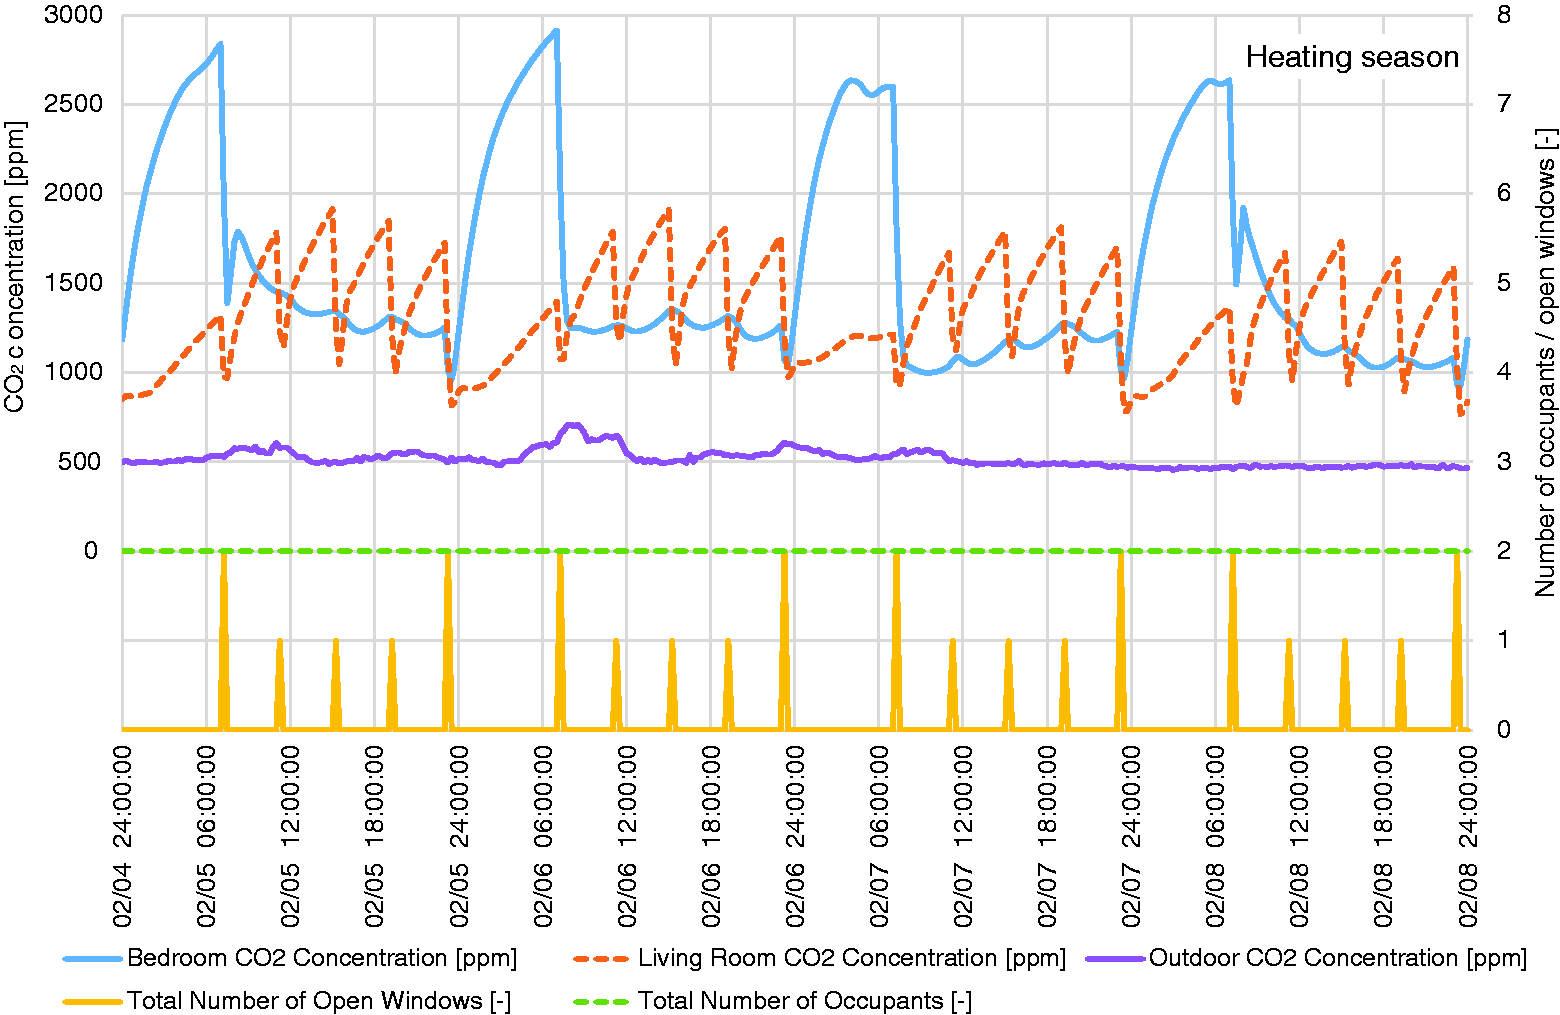
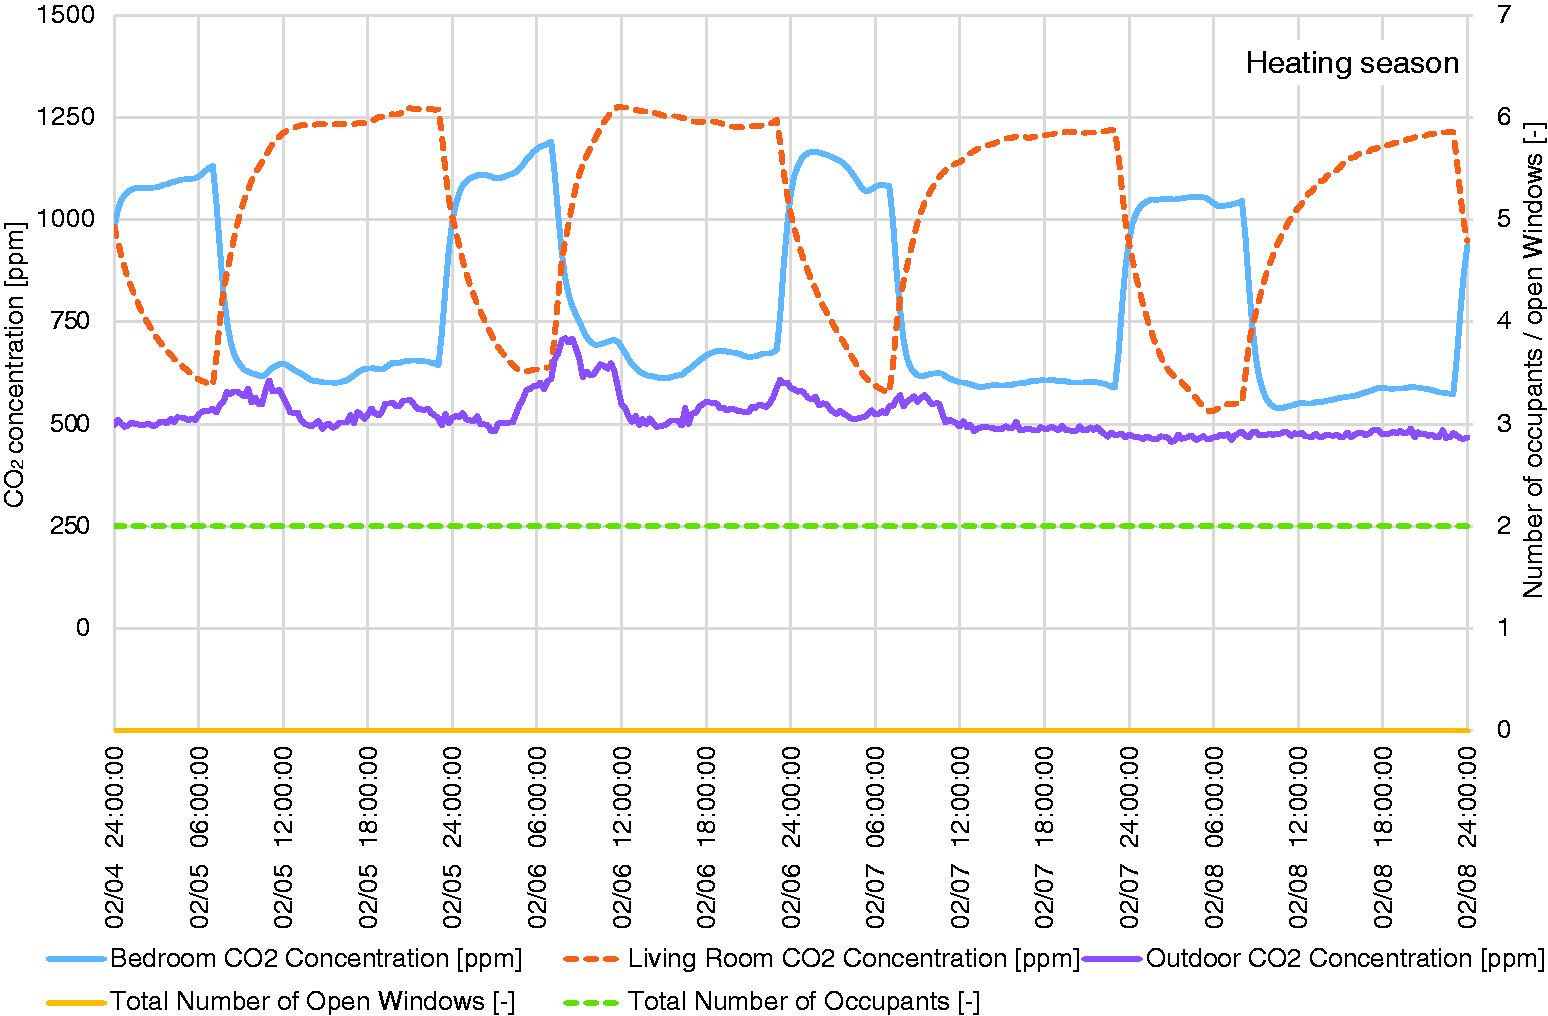
A 4-day section of simulation test 6 – Monitored outdoor and predicted CO2 concentrations in heating season with lockdown occupancy pattern and daytime opening of 1 to 2 windows for periods of 15 min every 4 h.
A 4-day section of simulation test 7 – Monitored outdoor and predicted CO2 concentrations in heating season with lockdown occupancy pattern and operation of MVHR delivering 7 L/s.person outdoor air.
Conclusion
This paper has shown that with the changing home occupancy patterns after the Covid-19 outbreak, indoor CO2 concentrations can rise significantly. At the same time, the results of the study suggested that the main environmental driving factor for window operation in both pre-lockdown and lockdown periods was indoor temperature. Nonetheless, the natural ventilation strategies tested on a flat with one-sided openings and the use of MVHR proved to be very effective to maintain acceptable IAQ at home.
Footnotes
Declaration of conflicting interests
The author(s) declared no potential conflicts of interest with respect to the research, authorship, and/or publication of this article.
Funding
The author(s) disclosed receipt of the following financial support for the research, authorship, and/or publication of this article: The study presented in this paper is funded by EPSRC IAA (Project number 559487) and CIBSE Support for Research.