
Abstract
The UK’s social housing stock is widely recognised to be in poor condition, yet there remains a significant lack of empirical data on the indoor environments experienced by residents—many of whom are vulnerable due to financial hardship or health conditions. This study presents a longitudinal assessment of indoor environmental conditions in 23 EPC D- or E-rated social housing dwellings in Warwickshire, monitored over two consecutive winters (2021/22 and 2022/23). Temperature, relative humidity (RH), and carbon dioxide (CO2) concentrations were continuously recorded in bedrooms and living rooms, while a subset of 13 homes was additionally monitored for particulate matter (PM2.5, PM10) and volatile organic compounds (VOCs) in living rooms. Findings reveal a marked deterioration in thermal conditions during the second winter. Average living room temperatures fell by 0.7°C (from 19.2°C to 18.5°C) and bedroom temperatures by 1.9°C (from 19.0°C to 17.1°C), likely due to reduced heating use in response to rising energy costs and poor insulation. Indoor air quality (IAQ) was similarly concerning: CO2 concentrations exceeded the 900 ppm benchmark for over 95% of occupied hours in nearly all rooms across both seasons, with average levels rising from 1193 to 1519 ppm. Limited ventilation and increased time spent indoors, as residents sought to conserve warmth, contributed to these conditions. Elevated PM and VOC concentrations were associated with occupant characteristics (smoking and pet ownership) and household activities, providing further evidence of insufficient air exchange. These results highlight the urgent need for holistic retrofit strategies that address both energy efficiency and IAQ. Prioritising improvements to building fabric and ventilation before heating system upgrades will be essential to safeguard occupant health, comfort, and well-being. The study provides rare empirical evidence and offers insights to inform policy and retrofit design for the UK’s most vulnerable households.
Introduction
To achieve net zero carbon emissions by 2050, the UK government has introduced the Social Housing Decarbonisation Fund (SHDF), a 10-year initiative aiming to upgrade a substantial portion of England’s social housing stock to an Energy Performance Certificate (EPC) rating of band C or higher by 2030 (DESNZ, 2023b). As of 2023, social housing accounted for 16% of all English households (approximately 4 million), with over half (56%) of these households including at least one resident with a long-term illness or disability (MHCLG, 2024). Nearly half (47%) of social renters fall within the lowest income quintile and face the highest unemployment rate (7%) compared to private renters and owner-occupiers (MHCLG, 2024). Social housing provides essential accommodation for low-income and vulnerable populations; however, the housing conditions are frequently substandard, exacerbating residents’ vulnerability.
According to the National Social Housing Residents Survey (DLUHC, 2022), 21% of residents expressed dissatisfaction with the maintenance and safety of their homes, with 55% of complaints citing mould, damp, and condensation—factors linked to respiratory issues, skin irritation, and other health risks Underheating remains a persistent issue in UK social housing during the winter months (Beizaee et al., 2021; Huebner et al., 2019). Empirical studies show many homes fail to maintain the minimum healthy winter indoor temperature of 18°C (Public Health England (PHE), 2014), particularly those in older, poorly insulated housing stock (Stamp et al., 2022).
These vulnerabilities were worsened by the 2021–2023 cost-of-living (CoL) crisis: UK inflation peaked at 11% in October 2022, largely driven by energy prices post-pandemic recovery, and geopolitical instability (DESNZ, 2023a; Harari et al., 2024). This significantly impacted low-income households, particularly those in poorly insulated homes. Despite colder weather conditions in 2023, domestic gas and electricity consumption fell by 8% and 10% respectively, indicating constrained heating use (Bolton and Stewart, 2024). Studies have shown that many households report setting lower thermostat temperatures, heating fewer rooms, and reducing heating run-times, indicating that energy conservation often takes precedence over thermal comfort (Huebner et al., 2023; Zapata-Webborn et al., 2024). Increasing climate variability and more frequent extremes, such as winter cold snaps and summer heatwaves (winter cold snaps and summer heatwaves) further exacerbate thermal stress in inadequately insulated and ventilated homes, particularly in vulnerable settings (UKHSA, 2023).
With people spending 80%–90% of their time indoors, primarily at home (Klepeis et al., 2001; Mannan and Al-Ghamdi, 2021), indoor air quality (IAQ) plays a critical role in health and well-being. While outdoor pollution has been extensively studied, IAQ remains less well understood, particularly in relation to housing characteristics and seasonal changes (Bedi and Bhattacharya, 2021; Rohra and Taneja, 2016). IAQ is associated with respiratory and cardiovascular diseases, allergic reactions, and premature mortality (WHO, 2021), posing particular risks for vulnerable groups such as children, the elderly, and those with pre-existing conditions (Huebner et al., 2023).
Despite growing recognition of these public health concerns, strategies to mitigate indoor air pollution are hindered by a lack of empirical, seasonally disaggregated data across UK housing types. Addressing this gap, the present study investigates longitudinal changes in indoor environmental conditions across 23 social housing dwellings over two winters, (December–February) in 2021/2022 (Season 1) and 2022/2023 (Season 2), during the CoL crisis, with a focus on underheating, ventilation, and the need for fabric-first retrofit interventions. Temperature, RH, and CO2 concentrations were continuously recorded in bedrooms and living rooms, while a subset of 13 homes was additionally monitored for PM2.5, PM10, and volatile organic compounds (VOCs) in living rooms.
Evidence to date
Fuel poverty and thermal discomfort are well-documented challenges in social housing across the globe (Ascione et al., 2024; Avanzini et al., 2022; Department for Business, Energy & Industrial Strategy (BEIS), 2021). Daly et al. (2021) examined energy use and thermal performance in 42 social housing dwellings in New South Wales, Australia, and found that 52% experienced temperatures below the WHO-recommended minimum of 18°C for over half the winter period. Such underheating, even in temperate climates, presents significant health risks for low-income households.
Similarly, Haddad et al. (2022) reported that indoor temperatures in 106 low-income Australian homes ranged from 5°C to 39.8°C, frequently exceeding WHO thermal comfort limits in both summer and winter, underscoring the need for improved building performance and heat resilience strategies. Sansom et al. (2023) further observed that in 36 Australian social housing dwellings, indoor temperatures fell outside the 18°C–24°C comfort range for 35% of a spring monitoring period.
Collectively, these studies highlight the critical role of building performance and energy affordability in shaping thermal comfort. Many occupants reported cold indoor conditions, unaffordable energy costs, and inadequate insulation and heating systems—issues that strongly resonate with the UK context.
In the UK, similar patterns have been reported across the social housing stock, where IAQ issues are compounded by ageing buildings, poor ventilation, and inadequate insulation (Stamp et al., 2022). Huebner et al. (2019) found that many UK homes failed to maintain the minimum healthy indoor temperature of 18°C, particularly older dwellings and those with single occupancy. Beizaee et al. (2021) reported that temperatures in 124 social homes fell below 18°C for over 39% of occupied hours in living rooms and 46% in bedrooms, especially in homes built before 1982. Similarly, Gupta and Berry (2023a) found widespread underheating in 42 poorly insulated West Midlands social homes during winter, with mean living room CO2 concentrations of 1198 ppm (range: 400–4999 ppm). Peaks were associated with evening occupancy and limited window opening during colder periods, indicating under-ventilation as a means of conserving heat. Comparable patterns were observed in bedrooms, where UK social housing studies consistently report elevated winter CO2 levels linked to reduced window opening for heat conservation (Gupta and Zahiri, 2022).
Elevated CO2 levels in domestic environments may indicate inadequate ventilation, which is often associated with poorer indoor air quality (Lowther et al., 2021; Seppänen and Fisk, 2004). High CO2 concentrations not only reflect poor air exchange but can also impair sleep quality and cognitive performance (Fan et al., 2023), while prolonged exposure may contribute to more serious long-term health effects. Several studies have reported that increasing CO2 levels are associated with reduced sleep quietness and satisfaction, shorter sleep duration (de Jode, 2024), and more frequent self-reported symptoms such as throat discomfort, dyspnoea, dry or itchy skin, difficulty falling or staying asleep, nasal congestion, and perceptions of stale air (Wang et al., 2023). These findings emphasise the importance of adequate ventilation in homes, particularly for vulnerable groups.
Beyond this, damp and mould present critical risks in UK social housing. Dampness and mould are consistently linked with respiratory illness, skin irritation, and mental health impacts (Boomsma et al., 2017; Jevons et al., 2016). Public Health England (PHE, 2014) highlights that high indoor humidity—particularly in cold, poorly ventilated homes—exacerbates condensation and microbial growth. National condition data from the English Housing Survey (EHS) show that 14% of homes in England fail to meet the Decent Homes Standard, with damp remaining more prevalent among renters. In 2022–2023, damp affected around 7% of social sector homes in England (7% of local authority and 4% of housing association dwellings). The 2022 National Social Housing Residents Survey reported that 55% of complaints concerned mould, damp, and condensation (DLUHC, 2022), underscoring the scale of the problem.
A wide range of indoor pollutant sources has been identified. The most significant include tobacco smoking and various cooking activities such as grilling, frying, and roasting, alongside the use of oils and ingredients that generate particulates (Amouei Torkmahalleh et al., 2017; Pikmann et al., 2024; Zhang et al., 2010). Wood burning, re-suspension by occupants and pets, cleaning activities (e.g. dusting and vacuuming), showering, and outdoor air infiltration also contribute (He et al., 2004; Yen et al., 2019). In UK social housing, studies consistently identify indoor smoking and cooking practices as dominant drivers of elevated particulate matter (PM).
In a study of 279 social housing properties in Cornwall, 25% of homes exceeded WHO ambient PM2.5 guidelines, with smoking identified as the main driver—producing concentrations approximately 9–12 µg/m3 higher than in non-smoking homes (Johnes et al., 2023). A Scottish study reported median PM2.5 levels of 31 µg/m3 in smoking homes and 3 µg/m3 in non-smoking homes, with non-smokers living with smokers experiencing exposures more than three times higher than the WHO annual exposure limit (Semple et al., 2015). In another study of West Midlands social homes, PM2.5 concentrations spiked to 202 µg/m3 during smoking events (Gupta and Berry, 2023a). The UK Air Quality Expert Group (AQEG) (2022) similarly identifies smoking, cooking, and the use of cleaning and personal care products as major indoor sources, which can produce higher pollutant concentrations indoors than outdoors when ventilation is insufficient.
Volatile organic compounds (VOCs) released from household cleaning products, furnishings, building materials, and occupant activities also contribute to adverse health effects (Shen et al., 2020). Cooking activities account for approximately 24% of formaldehyde and 25% of total VOC emissions, with stir-frying using oil among the most polluting methods (Shen et al., 2020). VOC monitoring in UK social housing remains limited, with most existing research focussing on new or low-energy developments rather than older, pre-retrofit stock (Gupta and Berry, 2023). These conditions collectively point to insufficient air exchange and highlight the ongoing tension between conserving warmth and maintaining adequate ventilation.
The recent CoL crisis has further exacerbated energy affordability issues. Huebner et al. (2023), in a survey of over 5000 British households, reported increased efforts to reduce heating use during winter 2022/2023, such as lowering thermostat settings and heating fewer rooms. Lower well-being was strongly associated with difficulties in maintaining thermal comfort. Hanmer and Zapata-Webborn (2023) noted a sharp rise in the proportion of households setting thermostats below 18°C, from 6.7% in 2020/2021 to 15.2% in 2022/2023. Likewise, Zapata-Webborn et al. (2024) found the greatest energy reductions among fuel-poor households, many of whom experienced underheating. Switchee (2023) reported that one in four social housing households in the UK went without heating at some point during the winter, largely due to unaffordable energy costs. Given that more than half of social renters include someone with a long-term illness or disability (MHCLG, 2024), the health implications of cold homes are a growing concern for policymakers.
Retrofitting offers a promising pathway. Bray et al. (2017) found that warmth-related improvements, such as new boilers and double-glazing, reduced NHS costs by 16% per household. Gupta and Zahiri (2022) observed more stable temperatures and lower pollutant levels following heat pump installations in five UK social housing flats. Gupta and Howard (2022) reported similar IAQ improvements post-retrofit, although the levels of PM2.5 and PM10 remained elevated, often due to occupant activities like smoking. These findings underscore the need for retrofits that not only reduce energy demand but also address ventilation and IAQ concerns.
While studies on IAQ have often focussed on new low-carbon developments or contexts outside the UK (Ascione et al., 2024), the specific challenges of pre-retrofit conditions in existing UK social housing remain underexplored. Despite growing policy interest in large-scale retrofitting, empirical evidence on IAQ in pre-retrofit UK social housing remains limited. There is also a general lack of awareness of IAQ-related health risks, especially among vulnerable populations. Moreover, few studies provide seasonally resolved data or account for variations across different housing types.
Against this backdrop, the present study adopts a socio-technical approach to investigate indoor environmental conditions in 23 social housing dwellings in Warwickshire, UK, across two winter seasons. By monitoring temperature, RH, CO2, PM2.5, PM10, and VOCs alongside resident surveys, it aims to identify patterns of underheating, assess IAQ, and evaluate the need for fabric-first energy efficiency interventions.
Methods and case study
Methods
A socio-technical approach was adopted in this study to investigate trends in IAQ and thermal conditions in 23 free-running social housing dwellings over two consecutive winter periods: 1 December 2021 to 28 February 2022 (Season 1) and 1 December 2022 to 28 February 2023 (Season 2). Both primary and secondary data were collected. In-person surveys were conducted with at least one resident in each dwelling to understand household socio-demographics, occupancy patterns, ventilation habits, and contextual factors such as window use and appliance operation. Informed consent was obtained from all participants.
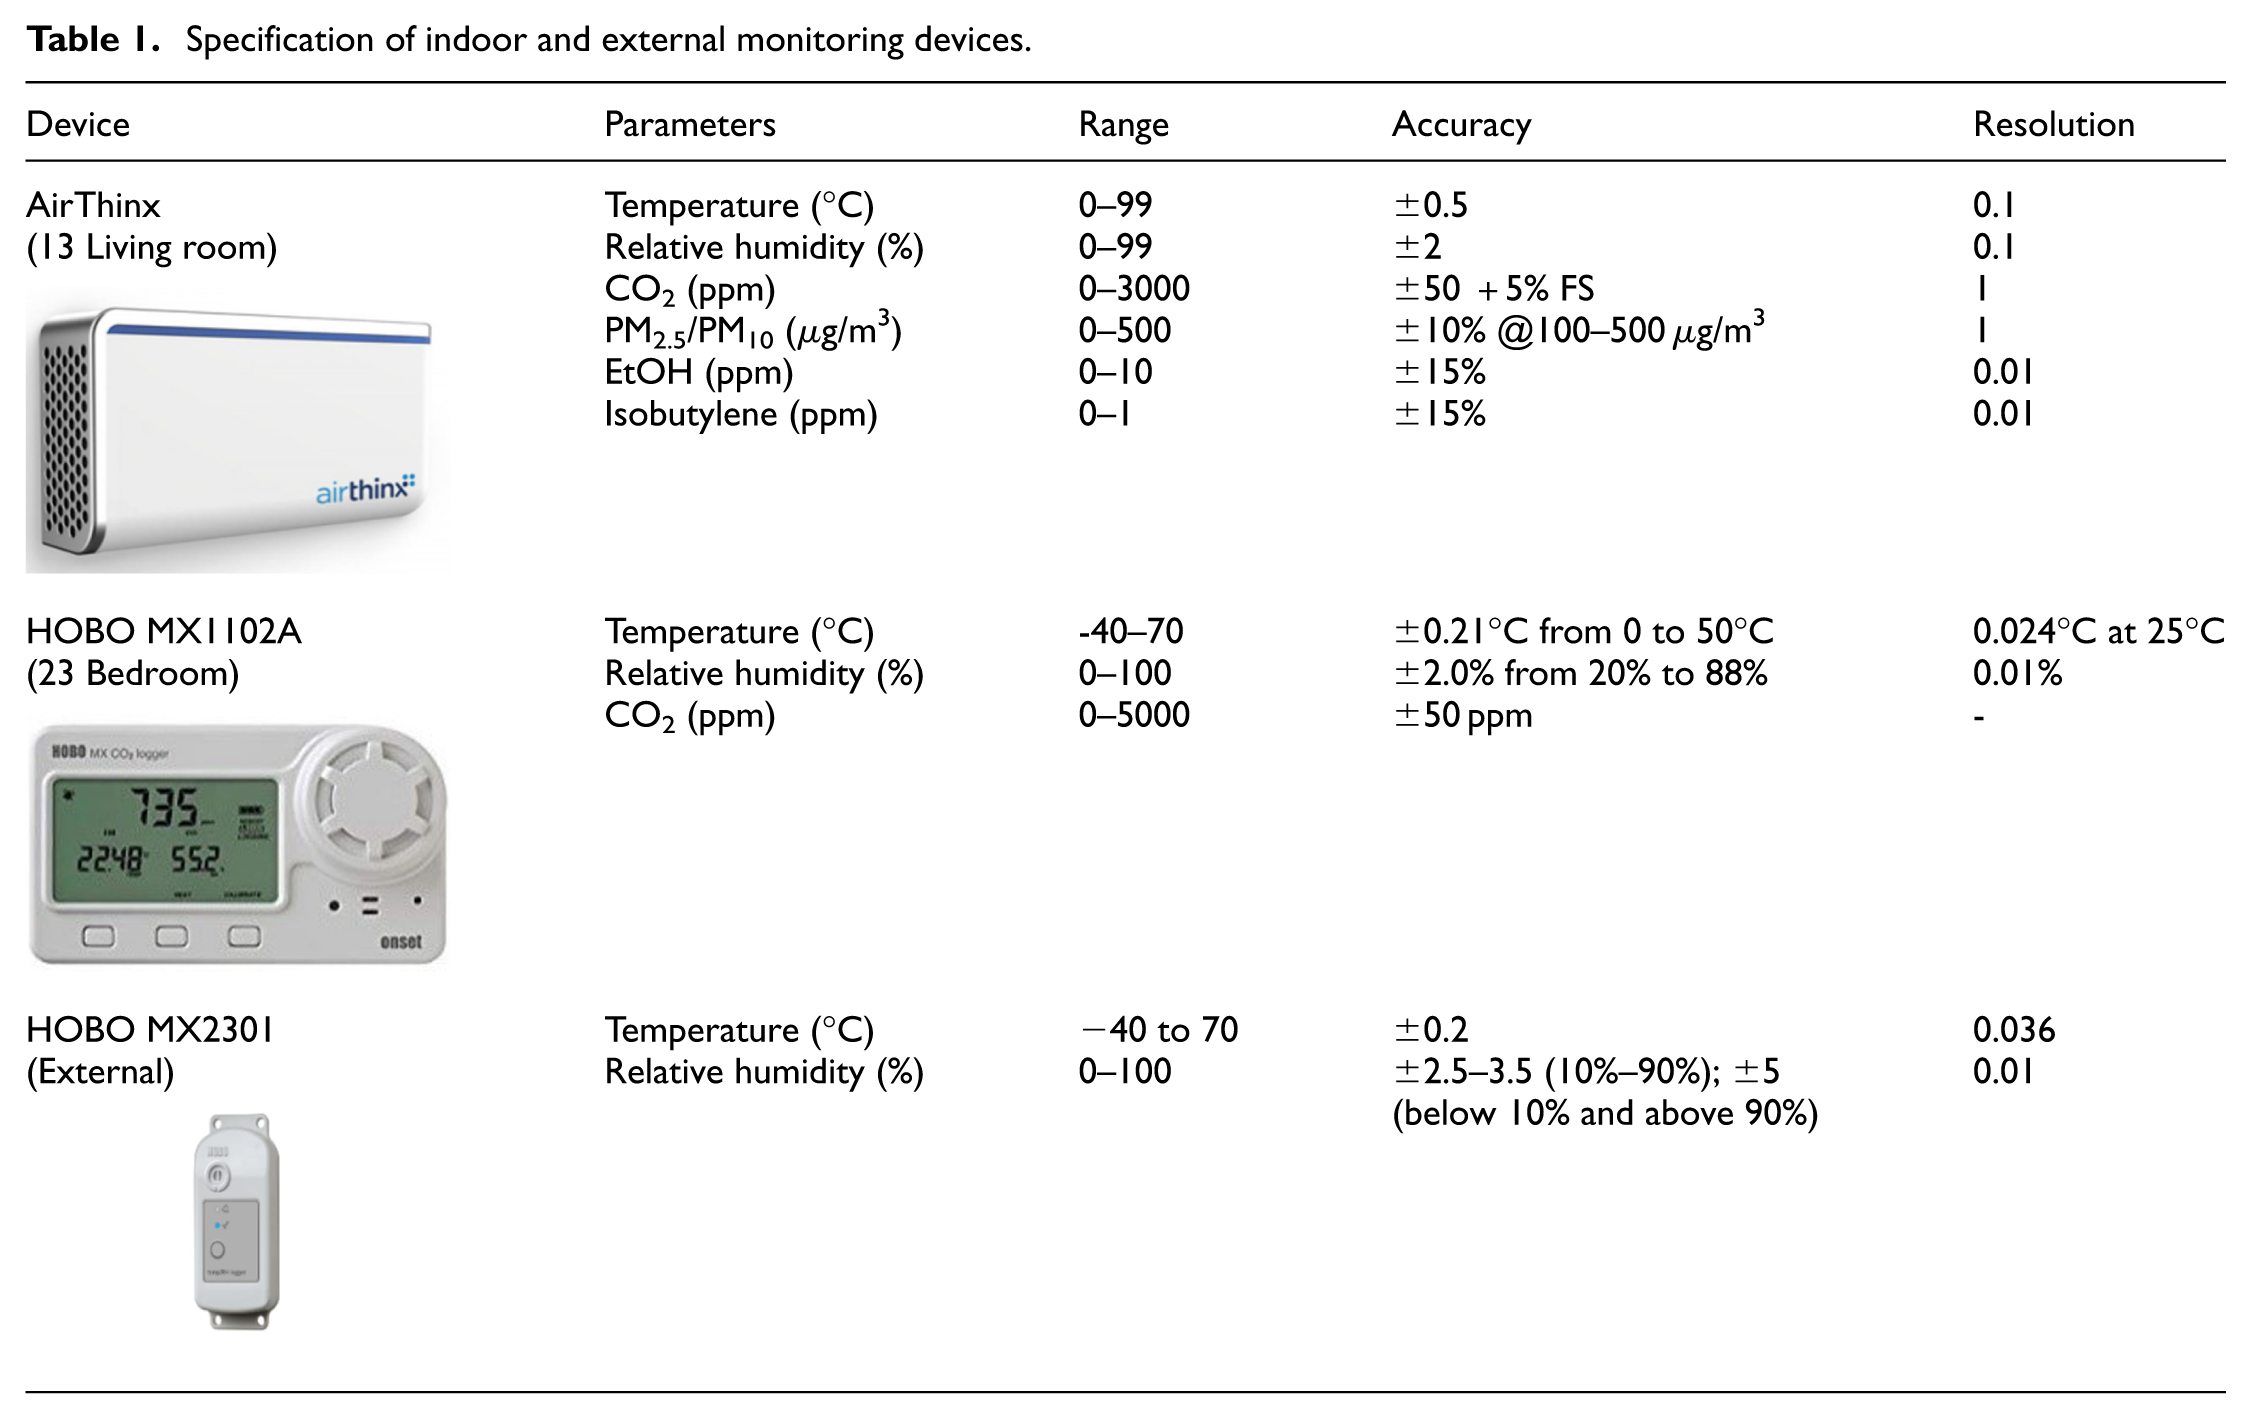
Dwelling characteristics, including built form, floor area, construction year, and EPC ratings, were sourced from official Energy Performance Certificates (EPCs). Empirical time series data of indoor temperature, RH and CO2 levels were continuously monitored in the bedrooms of all 23 dwellings over the two consecutive winter periods using internet-enabled HOBO MX1102A devices at 15-min intervals. With the agreement from a subset of 13 dwellings, additional IAQ parameters—PM2.5, PM10, and VOCs, including ethanol and isobutylene—were continuously recorded in living rooms using AirThinx sensors, which are factory-calibrated to global institutional standards and have reported correlations above 90% with reference instruments. External temperature and RH were measured using HOBO MX2301 loggers. Device specifications are provided in Table 1.
Specification of indoor and external monitoring devices.
A controlled preliminary experiment was conducted by placing the AirThinx and HOBO MX1102A devices side by side and recording data at 1-min intervals. Pearson’s correlation analysis showed very strong agreement for temperature (R = 0.99), relative humidity (R = 0.99), and CO2 (R = 0.83), indicating minimal variation between instruments and confirming that this did not affect the reliability of the study’s findings.
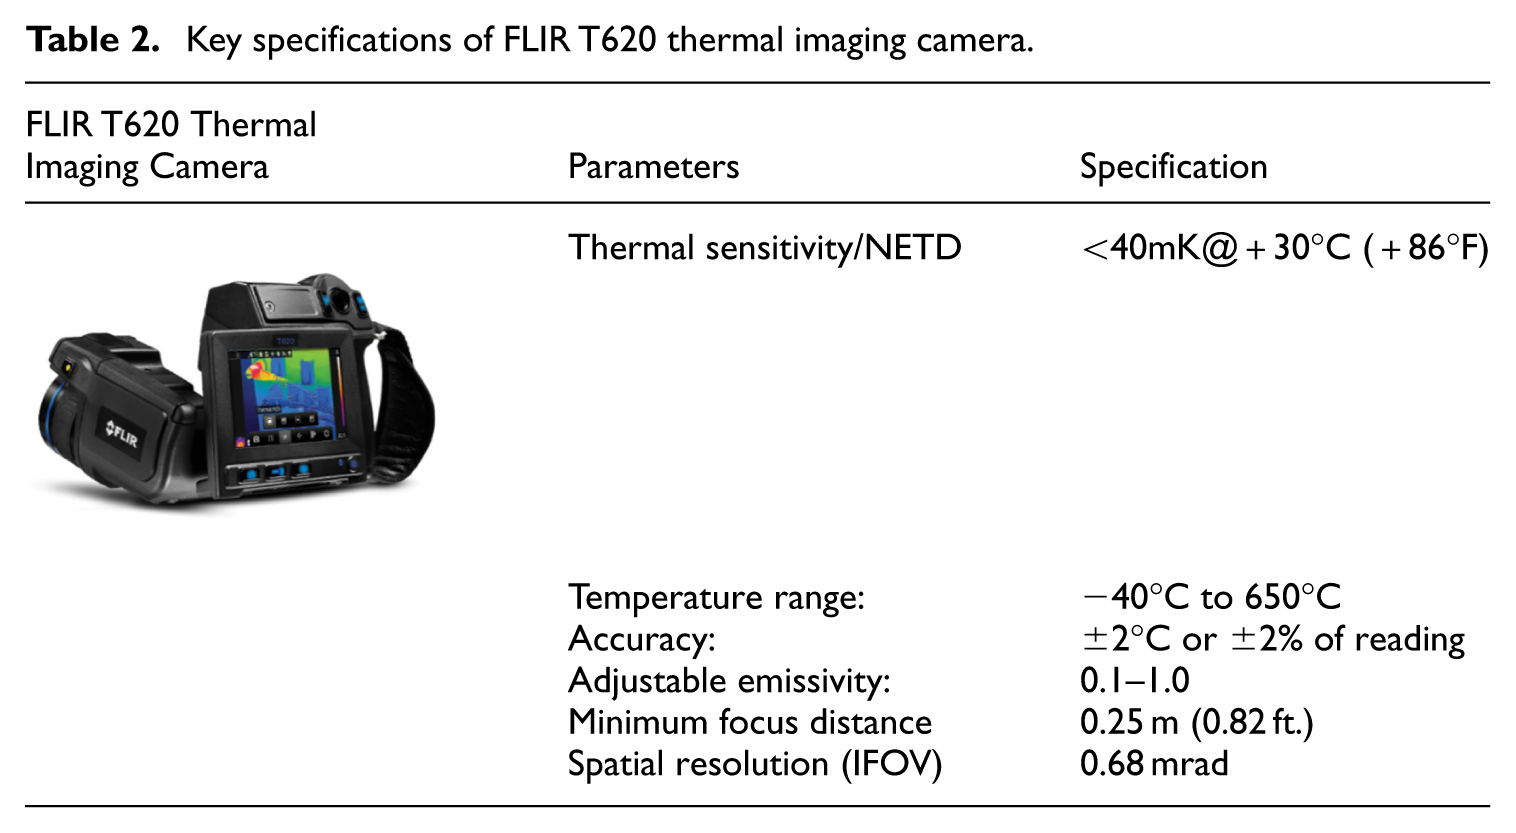
To qualitatively assess thermal performance, thermal imaging surveys were conducted during Season 1, both internally and externally. Images were captured under conditions with at least a 10°C temperature differential between indoors and outdoors, avoiding direct sunlight and precipitation. This method identified areas of heat loss, inadequate insulation, and air infiltration—particularly around windows, joints, and vents. The FLIR T620 thermal imaging camera specifications are summarised in Table 2.
Key specifications of FLIR T620 thermal imaging camera.
Characteristics of case study dwellings
The 23 social housing dwellings, all located in Warwickshire, UK, were categorised into three typologies based on built form: three bungalows, 18 semi-detached dwellings, and two terraced dwellings. These homes were selected due to their poor energy performance (EPC rating D or E), with future plans to upgrade to EPC Band B or C. Floor areas varied: 41 m2 for bungalows, 67–77 m2 for terraced homes, and 79–96 m2 for semi-detached dwellings. While the bungalows were single-storey, all other homes were two-storey dwellings with typical layouts including living rooms, kitchens, and hallways.
Construction years varied significantly: the bungalows (1976–1982) generally had cavity wall and loft insulation, whereas the semi-detached dwellings (1900–1966) exhibited minimal insulation. Residents in all typologies expressed concerns about insufficient thermal performance. Wall U-values ranged from 0.37 to 0.49 W/m2K, and roof U-values from 0.18 to 0.45 W/m2K. Despite the presence of double glazing, all homes displayed air permeability values above Building Regulations guidance (15 m3/h·m2 at 50 Pa compared to the target 10 m3/h·m2), indicating poor airtightness.
The average household size was three residents, ranging from single-occupancy to families of seven. Approximately 61% of homes were occupied continuously, with the remainder primarily occupied during evenings and weekends. Fourteen homes housed pets, with one home (SD05) accommodating 10 animals. Most households relied on gas boilers for space heating (operational between 3 and 8 months annually), with electric or gas/electric combinations used for cooking. Over 60% of households reported high energy costs, contributing to underheating. Damp and mould were reported in 57% of homes, often associated with health complaints such as coughs and chest infections.
Window opening was the dominant ventilation strategy, though usage decreased during colder months. In semi-detached dwellings, wall grilles were commonly present, and researchers observed that several were partially or fully obscured by residents’ furnishings (e.g. wardrobes, items placed on top of cupboards), and some appeared deliberately covered to reduce perceived draught-related discomfort—reflecting resistance to passive ventilation. Full household and dwelling characteristics are outlined in Table 3.
Household and building characteristics for housing typologies.
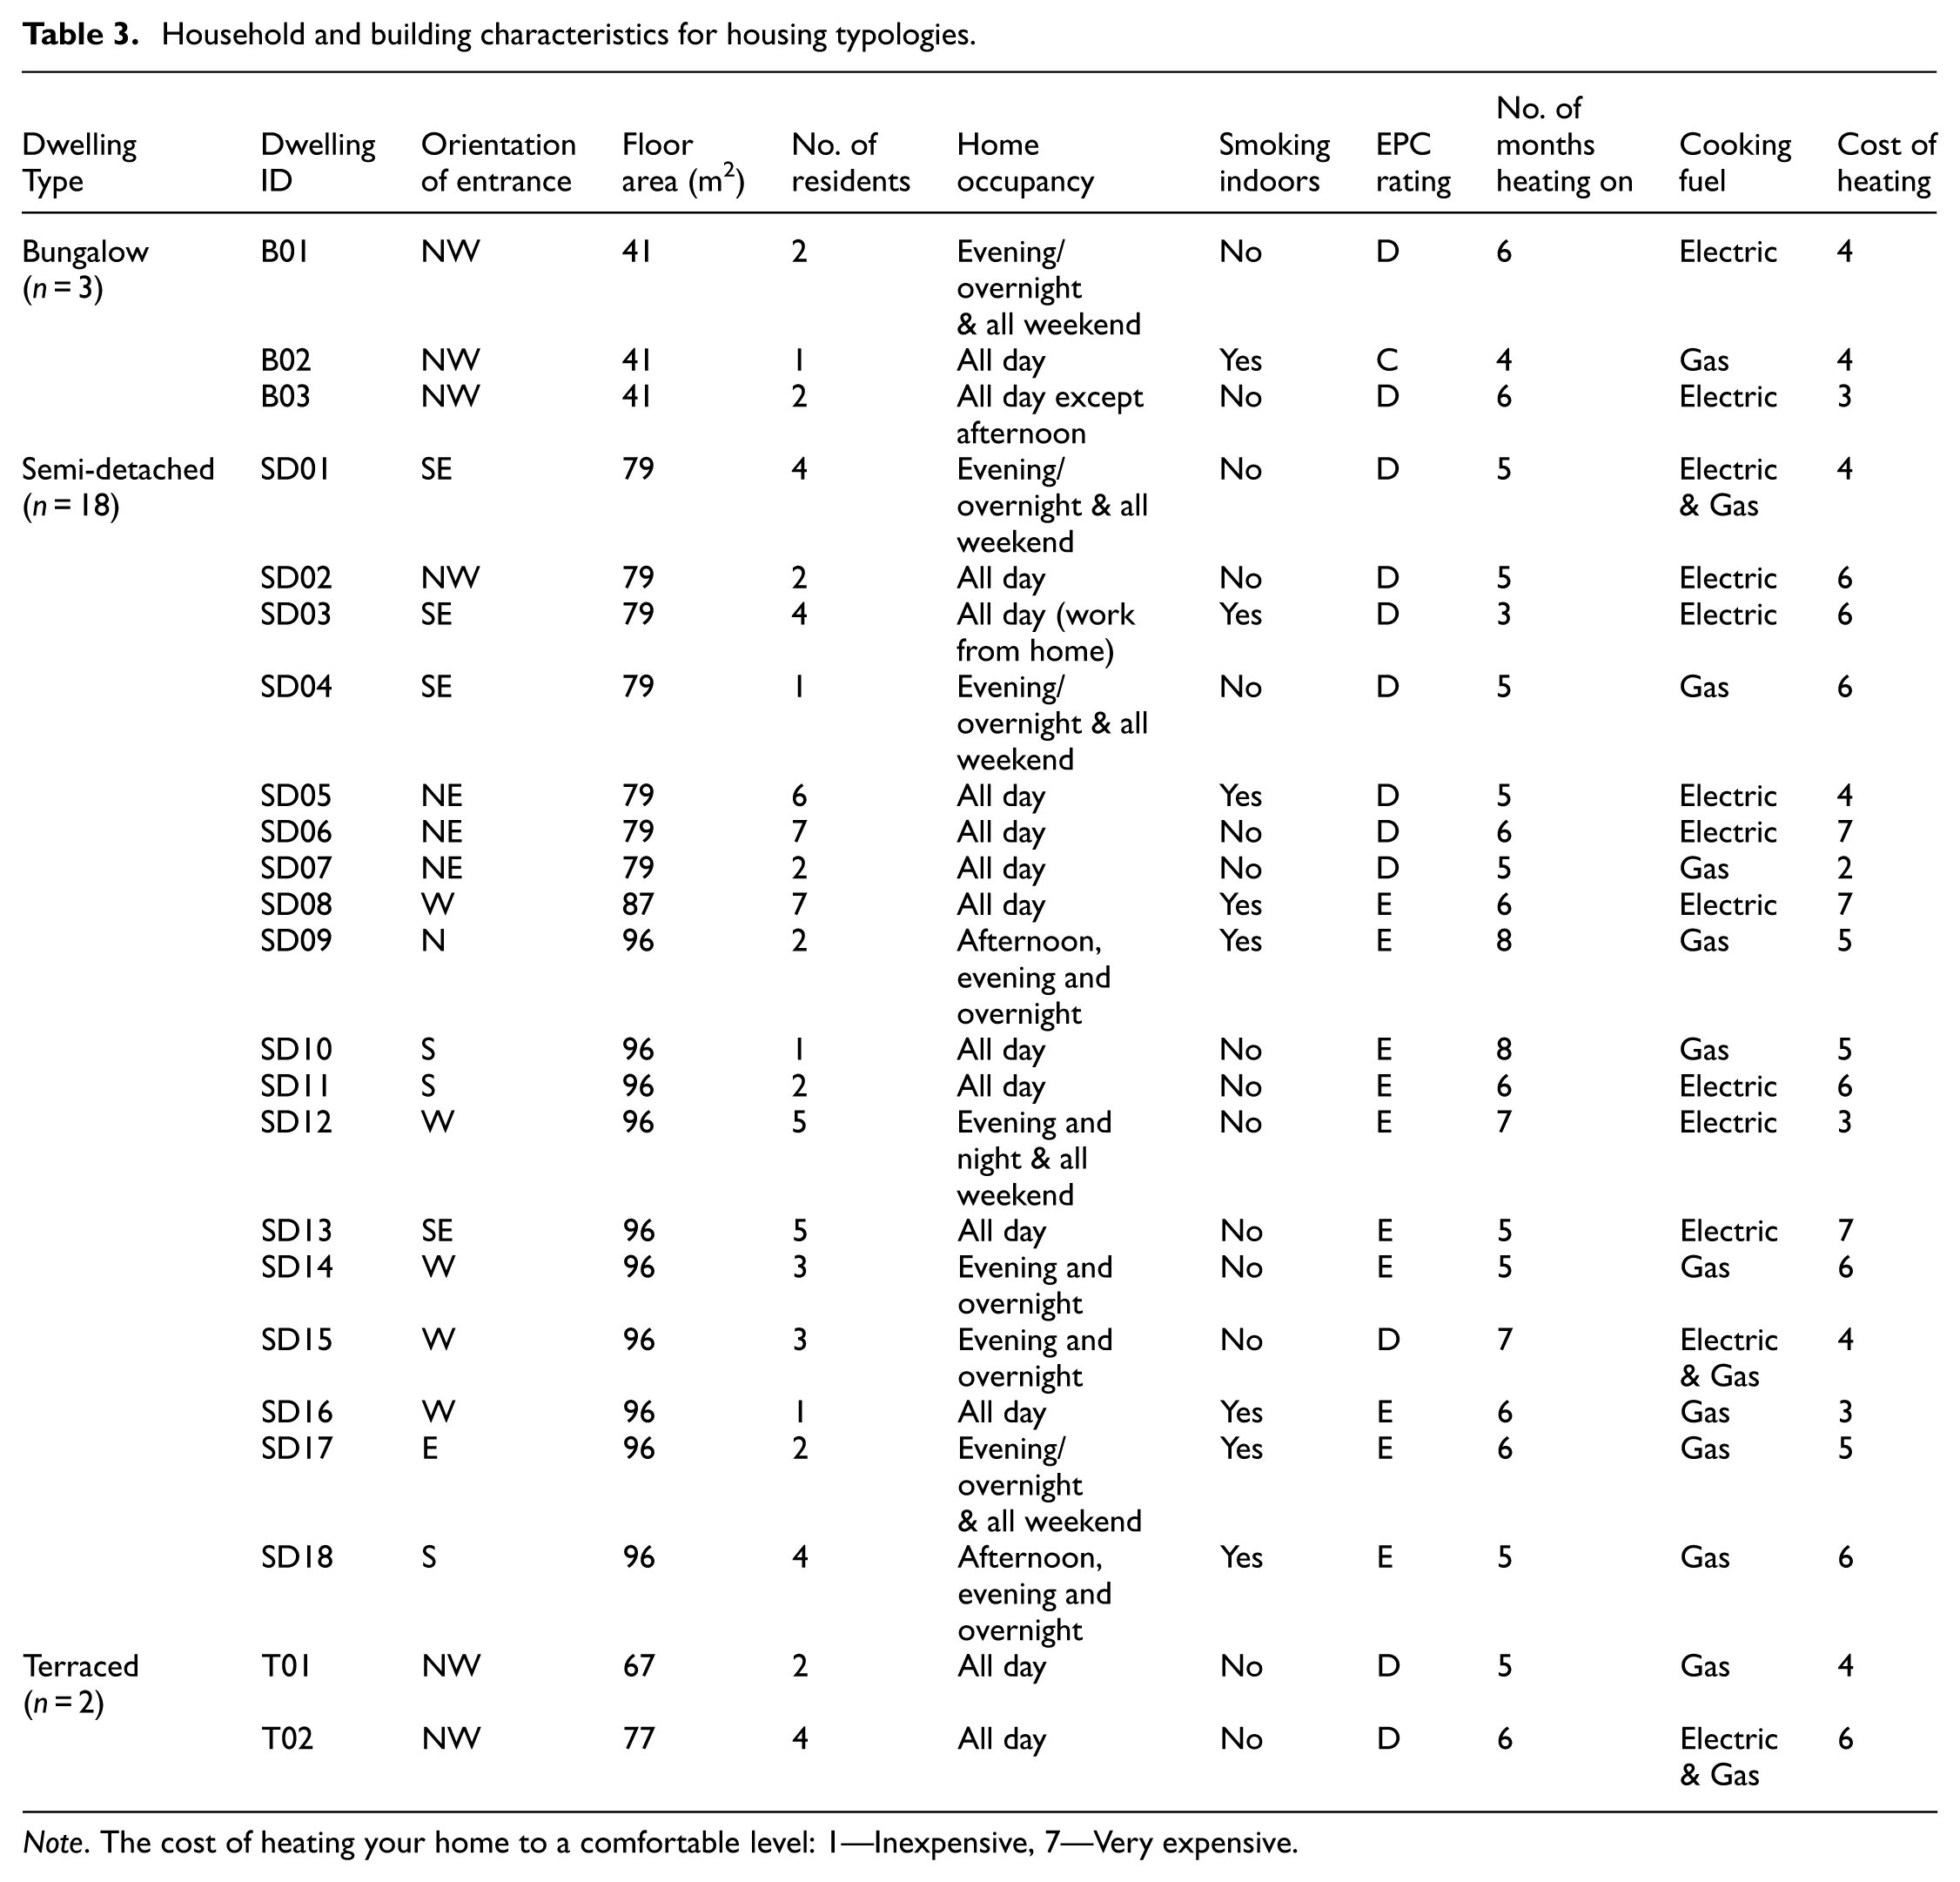
Note. The cost of heating your home to a comfortable level: 1—Inexpensive, 7—Very expensive.
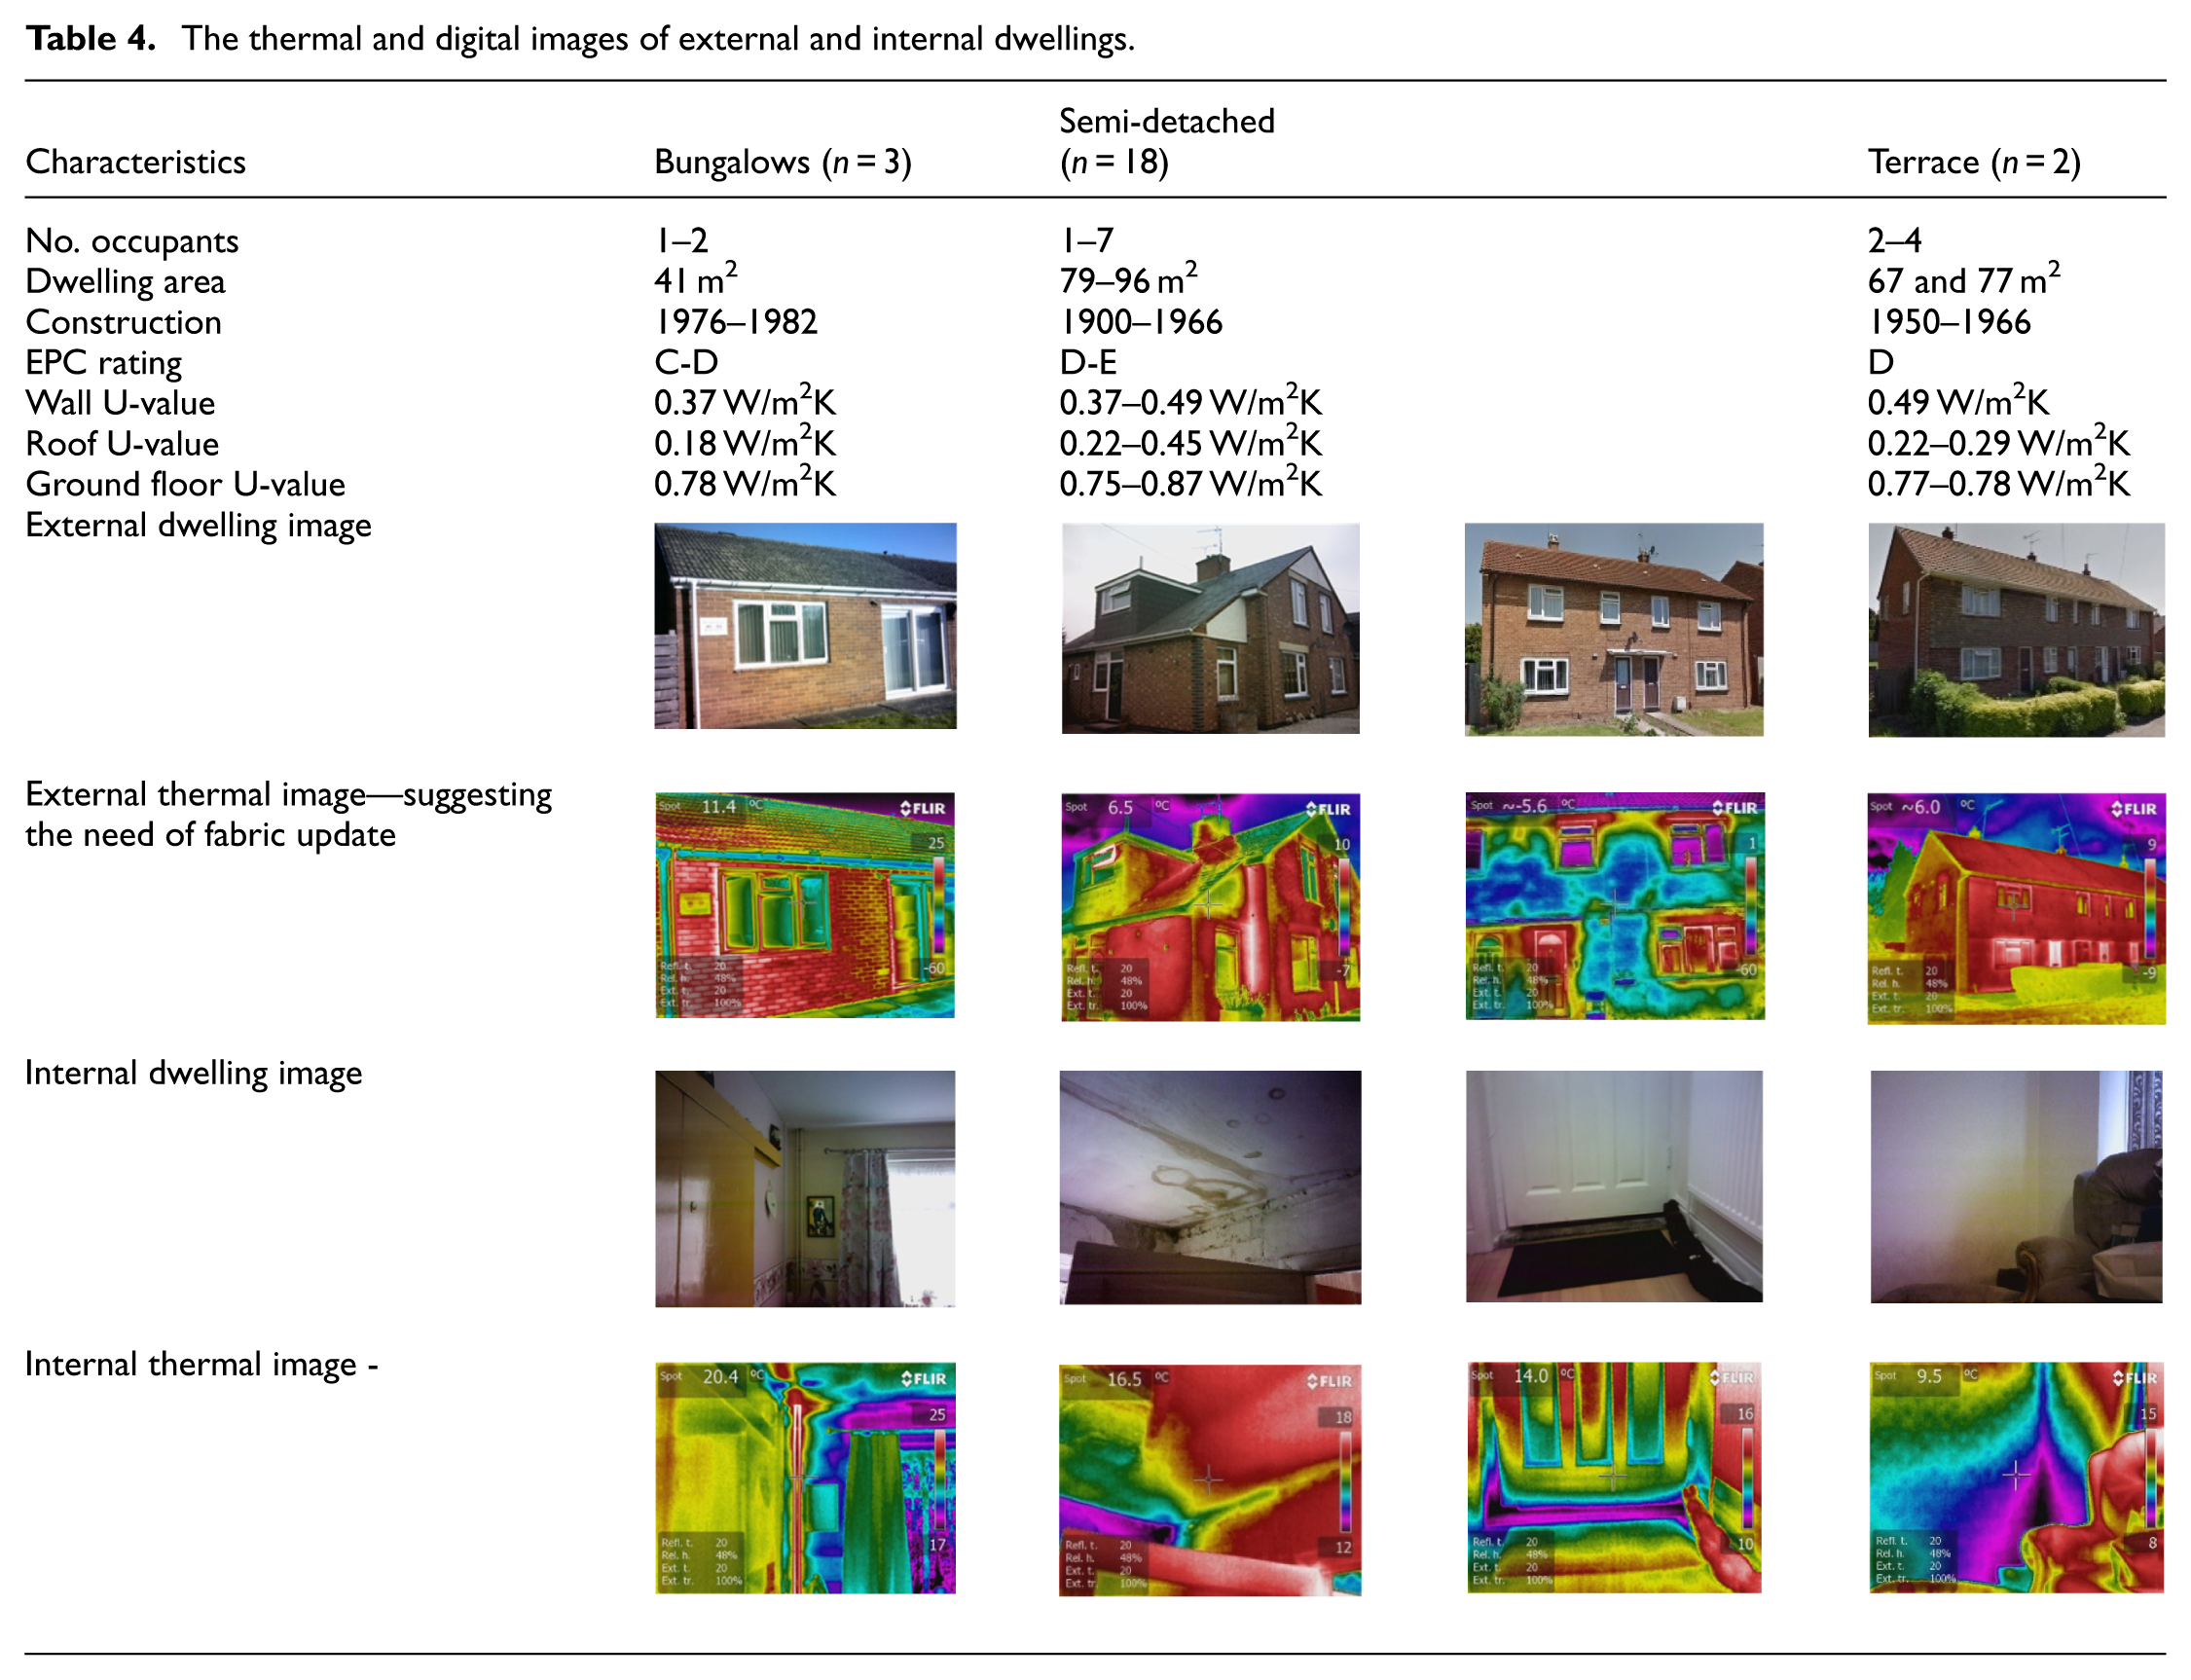
The building fabric was further evaluated through internal and external thermal imaging in Season 1 (see Table 4). The semi-detached homes exhibited the poorest thermal performance due to ageing construction and limited insulation. Heat loss was consistently identified around door frames, window seals, joints, and vents, with thermal bridging and draughts observed across all dwelling types. Internally, uninsulated pipes, cold spots from trickle vents, and condensation-prone surfaces were common. One semi-detached dwelling (SD18) also exhibited visible damp patches and a roof leak.
The thermal and digital images of external and internal dwellings.
Results
Overview of temperature and RH
Descriptive statistics for indoor and outdoor temperatures and RH across two winter monitoring periods are summarised in Table 5.
Descriptive statistics for indoor temperature and RH of bedrooms and living rooms over two winter seasons.
In bedrooms:
The mean indoor temperature was 19.0°C (range: 11.6°C–27.6°C; SD = 2.1) in Season 1 and 17.1°C (range: 7.1°C–26.4°C; SD = 2.6) in Season 2.
In living rooms (a subset of 13 dwellings):
Mean temperatures were 19.2°C (range: 9.2°C–28.1°C; SD = 2.2) in Season 1 and 18.5°C (range: 8.7°C–24.5°C; SD = 2.2) in Season 2.
Outdoor conditions were colder in Season 2 (mean: 4.8°C, range: −8.3°C to 16.4°C) compared to Season 1 (mean: 6.2°C, range: −3.3°C to 16.2°C), correlating with the observed decrease in indoor temperatures.
Across both seasons, mean bedroom temperatures were lower than those in living rooms. The difference was more pronounced in Season 2, where the average bedroom temperature declined by 1.9°C compared with the previous year, while living room temperatures fell by 0.7°C. These trends correspond with lower external temperatures in Season 2 (mean 4.8°C, range: −8.3°C to 16.4°C) compared with Season 1 (mean 6.2°C, range: −3.3°C to 16.2°C), and suggest reduced heating use, likely influenced by rising energy costs and energy-saving behaviours. Although Season 2 was colder, it did not represent an exceptional deviation from recent UK climatic averages. The mean bedroom temperature in Season 2 fell below the UKHSA (UK Health Security Agency) recommended minimum of 18°C. According to CIBSE guidelines, winter temperature ranges should be 17°C–19°C for bedrooms and 22°C–23°C for living rooms, indicating that recommended levels were not consistently achieved.
Bedroom indoor environment
Temperature and RH
The diurnal temperature profiles of bedrooms across the two monitored winter seasons are illustrated in Figure 1. These show clear seasonal differences in thermal conditions. In Season 1, bedroom temperatures remained consistently within the CIBSE recommended range of 17°C–19°C and above the PHE threshold of 18°C, fluctuating between 18°C and 20°C throughout the day. In contrast, during Season 2, bedrooms were significantly underheated, with diurnal temperatures remaining consistently below 18°C, fluctuating between 16°C and 18°C. This 2°C drop compared to Season 1 indicates a higher likelihood of thermal discomfort, particularly for vulnerable residents. Over the 90-day monitoring period, the mean daily temperature in bedrooms fell below 18°C for up to 89% of the time in Season 2. Resident surveys revealed that many occupants considered energy bills to be unaffordable, and 70% of homes reported either lowering thermostat temperatures to around 20°C or below, or heating fewer rooms, leading to prioritisation of financial needs over thermal comfort. The daily temperature profile showed a consistent trend: indoor temperatures began rising from around 06:00, peaking near 21:00, and then declining overnight to their lowest between 04:00 and 06:00. This reflected typical heating schedules, with many residents turning off heating at night to conserve energy, combined with colder external night-time temperatures.
Diurnal variations of indoor and outdoor temperature (a) and RH (b), and bedroom temperature distributions (c) across 23 dwellings over the monitoring period. Shaded area indicates typical occupied hours.
Despite the limited sample size, mean bedroom temperatures in all dwelling types exceeded 18°C in Season 1: terraced dwellings averaged 18.2°C, semi-detached 19.0°C, and bungalows 19.5°C. However, in Season 2, none of the dwelling types reached this threshold. Terraced homes recorded the lowest mean temperature at 16.3°C, partly due to architectural factors such as large north-facing windows, externally tiled first-floor walls, and long heat-up times. Residents also reported draughts and affordability constraints that prevented them from adequately heating large bedrooms. Bungalows, typically housing older or retired residents, recorded an average of 17.4°C—down 2.1°C from the previous year. These results are particularly concerning given the vulnerability of this demographic to cold-related health risks. The distribution of bedroom temperatures further confirmed a decline in thermal comfort during Season 2: while only two dwellings fell below the CIBSE minimum of 17°C in Season 1, 11 dwellings did so in Season 2. Notably, dwelling T01 recorded the lowest average bedroom temperature at 13.7°C, with temperatures dropping to 11.8°C overnight. Although heating increased temperatures by 5.8°C during the day, this occurred during unoccupied hours, undermining the thermal benefit.
In this study, the room occupancy patterns were derived from baseline household surveys. For the analysis, assumed occupied hours were applied: 22:00–07:00 for bedrooms and 07:00–22:00 for living rooms, based on BEIS (2021) averages. For bedrooms, the mean occupied-hour temperatures dropped from 18.9°C (SD = 2.0) in Season 1 to 16.9°C (SD = 2.6) in Season 2. During this time, bedrooms failed to meet the 18°C threshold for 31% of hours in Season 1 and 66% in Season 2. In Season 1, 10 dwellings recorded temperatures below 18°C during occupied hours, and eight dwellings (35%) experienced such conditions for over half of the occupied time. Three dwellings—SD04, SD15, and T01—failed to meet the 18°C threshold throughout the entire occupied period. By Season 2, underheating had worsened: only four dwellings (SD01, SD03, SD06, and T02) met the 18°C standard during occupied hours. Twelve dwellings did not reach this level at any time during occupied hours, and 13 (57%) recorded mean occupied-hour temperatures below 17°C, with T01 dropping to 12.5°C.
In contrast to temperature trends, RH levels increased in Season 2, with a sample mean of 59% (SD = 9), up from 54% (SD = 7) in Season 1. This inverse relationship between indoor temperature and RH is supported by a moderate negative correlation (r = −0.373), indicating that lower temperatures are associated with higher RH. Indoor RH was weakly correlated with outdoor humidity (r = 0.103), reinforcing the dominance of indoor thermal conditions as a driver. In Season 2, more than half the dwellings recorded RH levels above 60%. The highest RH was found in dwellings SD18 and T01, averaging 74% and 72%, respectively, with levels exceeding 80% for 22%–25% of the monitoring period. During occupied hours, RH remained above 73% in both dwellings. These levels exceed the recommended upper limit of 70% and suggest an increased risk of condensation and mould, particularly in colder, poorly ventilated homes. Conversely, dwelling B02 recorded the lowest RH levels (mean 47%), staying below 50% for 75% of the monitoring period and under 40% for 10%. This was attributed to higher indoor temperatures and regular ventilation from indoor smoking. B02 also maintained the lowest RH (47%) during occupied hours in Season 2, highlighting how occupant behaviour and internal conditions significantly affect IAQ outcomes.
CO2 levels
Indoor CO2 concentrations, primarily generated through human respiration, serve as a useful indicator of occupancy patterns and, more critically, ventilation adequacy (Lowther et al., 2021; Parliamentary Office of Science and Technology (POST), 2023; Seppänen and Fisk, 2004). Elevated CO2 concentrations in homes may signal insufficient air exchange and potential accumulation of other indoor pollutants, which are often associated with poorer air quality (Lowther et al., 2021; Seppänen and Fisk, 2004).
Throughout the monitoring period, CO2 levels in bedrooms varied considerably, with several dwellings reaching the upper detection limit of the monitoring equipment (5000 ppm) in both seasons. At the sample level, however, the seasonal mean CO2 concentrations were broadly similar, recorded at 1032 ppm in Season 1 and 1012 ppm in Season 2. Despite the similar averages, the diurnal CO2 profiles (Figure 2(b)) revealed clear links with occupancy behaviours. CO2 levels typically rose from around 17:00, peaked near 06:00, and remained elevated throughout the assumed main occupied hours of 22:00–07:00. In both seasons, mean CO2 levels during these hours consistently exceeded the CIBSE (2021) recommended 900 ppm threshold (representing “medium” air quality) by at least 100 ppm across all dwellings (Figure 2(b)).
The descriptive statistics (a), profiles (b), and distributions (c) of indoor CO2 levels in the bedroom across 23 dwellings over two winter seasons. The shaded area represents the occupied hours of the bedroom.
Dwelling-level variation was substantial. SD04 recorded the lowest mean CO2 concentration, approximately 550 ppm in both seasons, corresponding with single occupancy and intermittent room use, particularly on weekdays. In contrast, B03, which had continuous bedroom occupancy and limited window ventilation, recorded the highest mean CO2 level in Season 1 at 1573 ppm. In Season 2, the highest mean value was observed in SD06, where concentrations peaked at 1902 ppm. Notably, this dwelling experienced dense, continuous occupancy and minimal ventilation, suggesting a strong correlation between prolonged presence, limited air exchange, and elevated CO2 levels.
A more granular analysis of CO2 concentrations during the main bedroom occupied hours (22:00–07:00) showed that 14 out of 23 dwellings (61%) exceeded the 900 ppm threshold in both seasons, indicating sustained periods of inadequate ventilation overnight. Night-time profiles (Figure 2(b)) showed higher and longer-duration plateaus than daytime values. Disaggregated by dwelling type, this included 33% of bungalows, 61% of semi-detached homes, and all terraced homes. SD06 presented the most severe case, with occupied-hour CO2 levels reaching an average of 1846 ppm in Season 1—more than double the recommended limit—and an even higher average of 2526 ppm in Season 2, nearly tripling the acceptable threshold. Such levels clearly indicate inadequate ventilation, particularly during the heating season when windows are less frequently opened due to cold weather. In this context, the desire to retain heat often conflicts with the need for fresh air exchange, exacerbating IAQ risks.
Living room indoor environment
Temperature and RH
At the sample level, indoor living room temperatures reached a maximum of 28.1°C with a daily mean of 19.2°C (SD = 2.2) during Season 1, and a maximum of 24.5°C with a daily mean of 18.5°C (SD = 2.6) in Season 2 (see Table 5). Evidence of underheating was observed in Season 2, coinciding with lower external temperatures. While mean daily temperatures in Season 1 consistently exceeded the PHE (2014) suggested minimum of 18°C for healthy indoor conditions, Season 2 recorded temperatures below this threshold on 21 out of 90 days (23% of the time), with the largest daily shortfall reaching 2.5°C. In Season 1, indoor temperatures exhibited a weak positive correlation with external temperatures, whereas in Season 2, colder external conditions—compounded by the ongoing CoL crisis—likely contributed to lower indoor temperatures as occupants curtailed heating use to manage rising energy costs.
The diurnal temperature profiles in Figure 3(a) reflect typical occupancy and heating patterns, with indoor temperatures dipping between 05:00 and 09:00 following prolonged inactivity and heating being switched off overnight. Peak temperatures occurred around 22:00, reaching 20.0°C in Season 1 and 19.3°C in Season 2. The lowest diurnal temperatures were 18.6°C and 17.7°C, respectively, suggesting a consistent pattern of reduced heating or heat retention in the second winter. Notably, the difference between indoor and outdoor temperatures at midday was slightly greater in Season 2 (11.3°C) compared to Season 1 (10.6°C), suggesting a similar insulation performance despite lower indoor baselines. Analysis by the EPC band showed that dwellings rated EPC E consistently had lower mean living room temperatures—18.7°C (Season 1) and 17.9°C (Season 2)—compared to EPC D rated homes (19.6°C and 19.1°C, respectively), highlighting the impact of building performance on thermal comfort.
Diurnal variations and distributions of living room indoor and outdoor temperature (a and c) and RH (b and d), across 13 dwellings over the monitoring period. Shaded area indicates the typical occupied hours.
Dwelling-level data revealed considerable variability. SD15 recorded the highest mean living room temperature across both winters, averaging 22.8°C. This was attributed to a combination of behavioural and physical factors: the living room windows were rarely opened for privacy reasons, and curtains remained closed throughout the day (reducing heat loss), while a dark, uninsulated roof caused increased solar heat gains, further warming up the room. Interestingly, SD15 also had the lowest mean bedroom temperature, which thermal imaging confirmed was due to substantial heat loss at the junction between the bedroom walls and roof, especially around the window frame—areas where surface temperatures fell below 15°C. In contrast, SD11 and T01 recorded the lowest mean living room temperatures, averaging 15.9°C in Season 1 and 14.3°C in Season 2. In SD11, a retired resident reported wearing multiple layers to remain warm, with temperature drops to 13.8°C observed during early morning hours. Site visits and thermal imaging confirmed significant heat loss through window frames, glazing, and wall joints, with visible cracks further compromising airtightness.
Based on assumed living room occupied hours (07:00–22:00, BEIS, 2021), the mean temperature during occupied periods was 19.2°C in Season 1 and 18.5°C in Season 2—substantially lower than the CIBSE (2021) recommended minimum of 22°C for thermal comfort in living rooms. Indoor temperatures fell below 18°C during 24% of occupied hours in Season 1 and 36% in Season 2. Across both seasons, 85% of dwellings recorded temperatures below 18°C during occupied hours. In Season 1, only two dwellings (SD11 and T01) remained consistently below this threshold during all occupied hours, but this number rose to five in Season 2, reflecting the cumulative impact of colder external temperatures and constrained energy use. SD11 experienced the most significant underheating, with a mean living room temperature of just 14.4°C during occupied hours in Season 2.
In terms of indoor RH, there was no significant difference between the two winters at the sample level, with overall averages remaining within the recommended 40%–60% range (CIBSE, 2021). Figure 3(b) illustrates the diurnal RH profiles, which remained stable between 45% and 50% across both seasons. However, variation was evident at the dwelling level. SD15, which maintained the highest indoor temperatures, had the lowest RH levels—averaging 31% in Season 1 and 29% in Season 2. RH in SD15 remained below 40% for 73% of the time in Season 1 and nearly all of Season 2, even dropping below 30% for 35% and 55% of the respective monitoring periods. Conversely, T01 and SD07 recorded the highest RH levels at 59% in Season 1 and Season 2, respectively. Despite these extremes, RH levels across the sample were generally within acceptable ranges and did not show a statistically significant difference between occupied and unoccupied hours.
CO2 levels
CO2 concentrations were consistently higher in the living rooms than in the bedrooms across both winter seasons. At the sample level, the mean CO2 concentration in living rooms was 1193 ppm in Season 1 and increased markedly to 1519 ppm in Season 2 (Figure 4(a)). These elevated levels are likely due to increased occupancy of living rooms during daytime hours, combined with inadequate ventilation. Diurnal profiles (Figure 4(b)) demonstrated a clear correlation between CO2 levels and occupancy, with concentrations rising sharply in the evening and falling to their lowest levels during the early morning hours (approximately 05:00–07:00), following extended periods of vacancy and, potentially, passive air exchange.
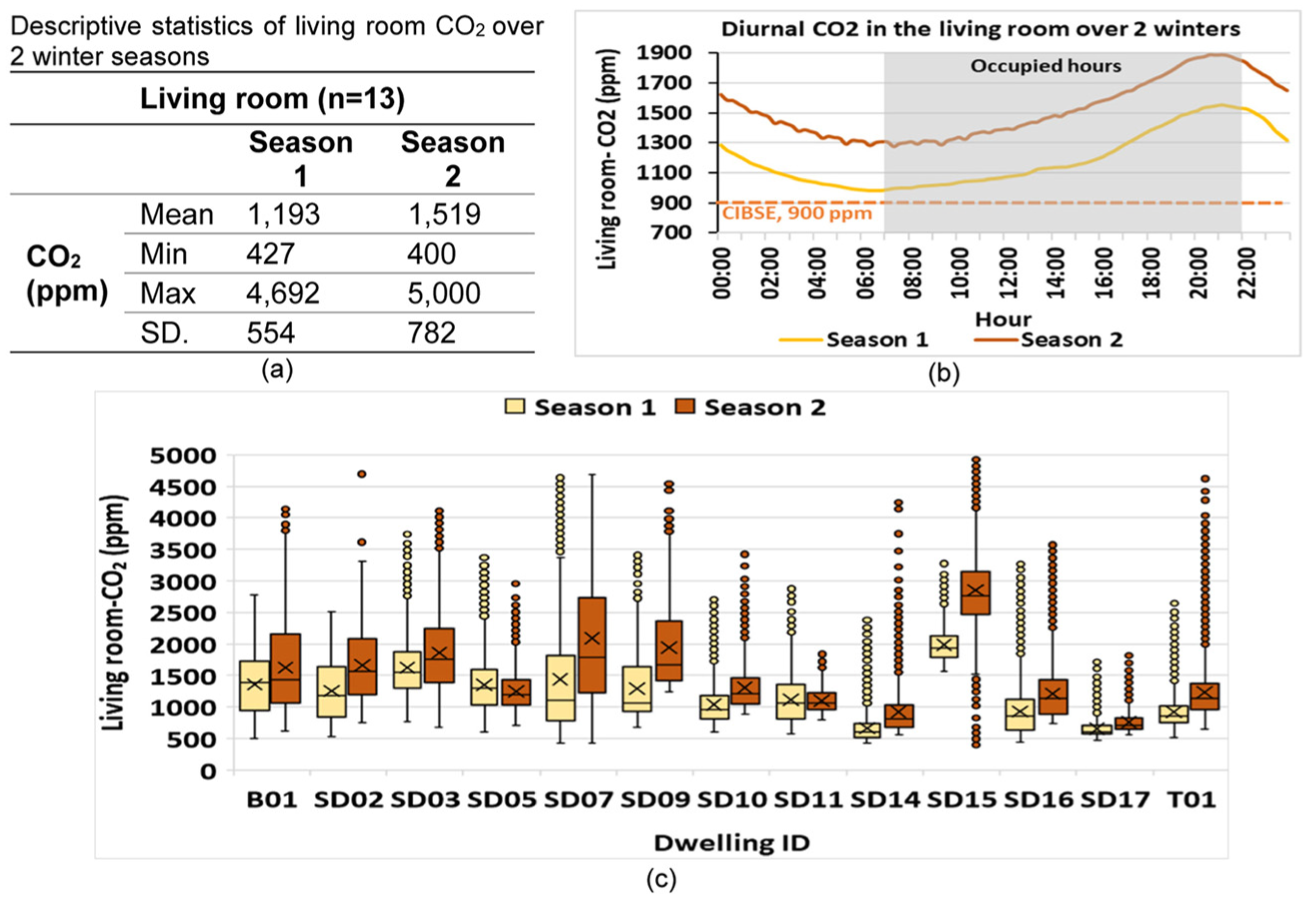
The descriptive statistics (a), profiles (b), and distributions (c) of indoor CO2 levels in the living room across a subset of 13 dwellings over two winter seasons. The shaded area represents the occupied hours of the living room.
CO2 concentrations varied widely between dwellings. SD15 recorded the highest CO2 levels across both winters, with mean concentrations of 1985 ppm in Season 1 and 2856 ppm in Season 2. Levels in this dwelling frequently exceeded 2000 ppm and remained consistently within the 1900–2200 ppm range in Season 1, and 2600–3300 ppm in Season 2. Diurnal peaks reached the monitor’s upper limit of 5000 ppm, indicating a severe lack of background ventilation. Residents reported no window-opening behaviours to improve air quality, and site visits revealed that curtains in the living room were kept closed throughout the day, likely impeding airflow from trickle vents and windows. Interestingly, SD15 also recorded the highest indoor temperatures and lowest RH levels, highlighting the complex interplay between heating behaviour, ventilation, and air quality.
In contrast, SD14, an adjoining dwelling with similar structural characteristics, recorded much lower CO2 levels, with mean values of 663 ppm and 924 ppm in Seasons 1 and 2, respectively. This was attributed to the occupants’ preference for frequent natural ventilation through window openings. Similarly, SD17 had the lowest average CO2 concentrations, maintaining mean levels of 659 ppm in Season 1 and 758 ppm in Season 2. During visits, windows were observed to be partially open during the heating season, suggesting effective passive ventilation strategies. However, it is worth noting that the ventilation practices in SD17 were not significantly different from those in higher-CO2 dwellings, indicating that other behavioural factors—such as duration of occupancy, appliance use, and number of residents—also influence IAQ.
During the designated living room occupied hours (07:00–22:00), 85% of dwellings recorded mean CO2 concentrations above the CIBSE (2021) recommended threshold of 900 ppm. In fact, in both seasons, over 95% of occupied hours in these homes exceeded this benchmark. SD15, in particular, exhibited CO2 concentrations 2–3 times higher than the recommended limit, reflecting poor air exchange and a likely absence of night-time or trickle ventilation.
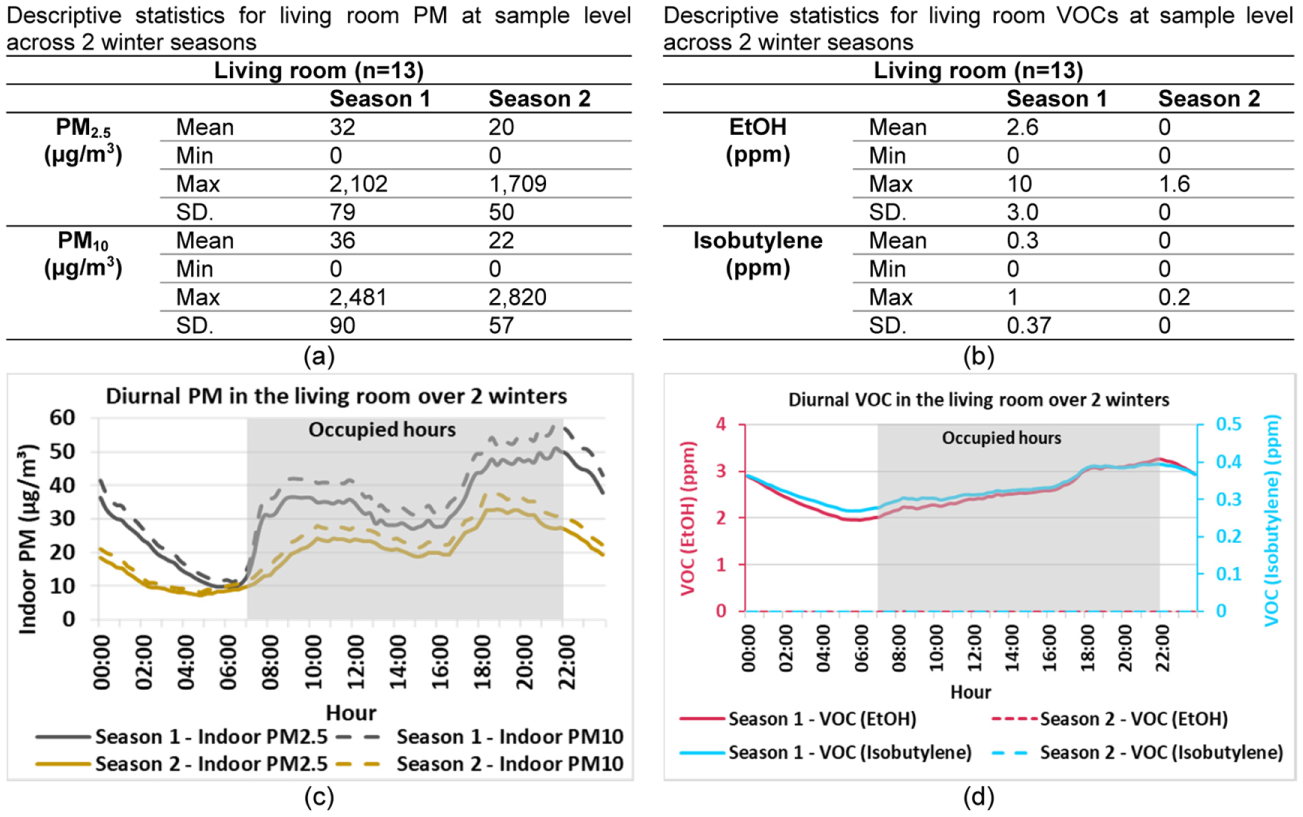
PM2.5, PM10 and VOCs (EtOH and isobutylene)
Across the two winter seasons, indoor concentrations of PM2.5 and PM10 in the living rooms of the monitored dwellings revealed marked seasonal differences. In Season 1, mean concentrations were higher across the sample—averaging 32 µg/m3 (SD = 79) for PM2.5 and 36 µg/m3 (SD = 90) for PM10—compared to Season 2, where values decreased to 20 µg/m3 (SD = 50) and 22 µg/m3 (SD = 57), respectively (Figure 5(a)). This reduction may be attributed to behavioural shifts in household activity during the CoL crisis. National survey data indicated that 19% of adults reported increased consumption of ready meals or processed foods, while 17% reduced cooking from scratch (REHIS, 2023)—activities which are known to contribute to indoor PM emissions.
Descriptive statistics for living room PM levels (a) and VOCs (b) and profiles of PM (c) and VOCs (d) across a subset of 13 dwellings over two winter seasons. Shaded area represents occupied hours of living rooms.
In Season 1, nearly half (46%) of the dwellings had mean PM2.5 concentrations exceeding the WHO (2021) 24-h guideline limit of 15 µg/m3. Only two dwellings, SD05 and SD07, exceeded the recommended PM10 limit of 45 µg/m3. Notably, SD05 recorded the highest concentrations across both PM types, with mean levels of 173 µg/m3 (PM2.5) and 200 µg/m3 (PM10). These elevated levels were likely the result of multiple indoor sources, including combustion from indoor smoking, re-suspension of particles by people and pets, intensive cooking, and cleaning activities (vacuuming/sweeping), compounded by poor ventilation. SD05 housed six occupants, including at least three smokers and up to 10 pets, with limited window use reported—conditions which collectively contributed to severe indoor pollution. By contrast, SD09 consistently reported the lowest PM levels (5 µg/m3 for PM2.5 and 6 µg/m3 for PM10), despite the presence of a smoker. The comparatively low concentrations suggested a high level of ventilation, potentially due to smoking being confined to a different, well-ventilated area or reduced activity in shared spaces. This home was primarily occupied by older residents (aged 67 and over) who reported minimal indoor activity.
In Season 2, seven dwellings exceeded the WHO PM2.5 guideline, while only two surpassed the PM10 limit. The highest mean PM concentrations were again found in SD07 (44 µg/m3 for PM2.5; 52 µg/m3 for PM10), while SD09 continued to show the lowest levels (3 and 4 µg/m3, respectively). Diurnal profiles (Figure 5(c)) demonstrated clear patterns tied to occupant behaviour, with PM levels increasing throughout the day, peaking between 19:00 and 22:00—coinciding with evening cooking and social activities. PM concentrations were lowest in the early morning, particularly around 06:00–07:00, following overnight vacancy. This behaviour-driven pattern was consistent across both seasons, although more pronounced in Season 1. Over 85% of the monitored period in Season 1 and 70% in Season 2 saw PM2.5 levels exceed the WHO 15 µg/m3 guideline. However, PM10 levels only exceeded the 45 µg/m3 threshold for 26% of the time in Season 1, indicating that PM10 levels remained more consistently within acceptable limits.
A strong positive correlation was observed between PM2.5 and PM10 concentrations (Pearson r = 0.997, p < 0.01), suggesting common sources for both pollutants. Occupant activity, particularly cooking, was found to be a significant contributor. Survey data indicated that 8 of the 13 monitored dwellings used gas for cooking, yet none were equipped with mechanical extraction above the hob. Furthermore, the absence of mechanical ventilation systems in living areas likely contributed to the accumulation of PM, especially during peak activity periods.
In relation to VOCs, readings for EtOH (ethanol) and isobutylene in Season 1 showed relatively high variation across the sample. Mean concentrations were 2.6 ppm (SD = 3.0) for EtOH and 0.3 ppm (SD = 0.37) for isobutylene, with some dwellings reaching the device’s maximum detection limits (10 and 1 ppm, respectively; Figure 5(b)). By contrast, VOC data for Season 2 recorded almost exclusively zero values, with maximum concentrations of only 1.6 ppm for EtOH and 0.2 ppm for isobutylene. This suggests either a substantial reduction in pollutant-generating activities or, more likely, technical failure of the monitoring equipment in Season 2, rendering the VOC dataset from that period ineligible for further analysis.
In Season 1, EtOH and isobutylene displayed similar diurnal trends (Figure 5(d)), with lowest levels observed around 06:00 after overnight vacancy and peaking near 22:00—aligning with occupant activity such as cleaning or use of scented products. A very strong correlation was found between EtOH and isobutylene concentrations (Pearson r = 0.983, p < 0.01), indicating common sources. Five of the 13 dwellings (38%) reported VOC levels higher than the sample mean. SD03 exhibited the highest average VOC concentrations (6.1 ppm for EtOH and 0.7 ppm for isobutylene), potentially due to off-gassing from furniture, construction materials, or the use of air fresheners, as the dwelling also had reported tobacco use. In contrast, SD09 recorded the lowest average VOC levels (0.5 and 0.1 ppm, respectively), in line with its minimal PM readings and strong ventilation practices.
Comparative analysis by smoking status and pet ownership showed that smoking households exhibited higher two-season average pollutant levels than non-smoking homes (PM2.5: 32.9 µg/m3 vs 20.9 µg/m3; PM10: 38.3 µg/m3 vs 23.5 µg/m3; EtOH: 1.52 ppm vs 1.11 ppm; isobutylene: 0.19 ppm vs 0.13 ppm). Similarly, homes with pets also displayed higher pollutant levels than those without (PM2.5: 35.1 µg/m3 vs 17.9 µg/m3; PM10: 40.0 µg/m3 vs 20.6 µg/m3; EtOH: 1.84 ppm vs 0.80 ppm; isobutylene: 0.21 ppm vs 0.10 ppm). These differences represent increases of 58%–96% for particulate matter and 37%–130% for VOCs, indicating measurable effects of smoking and pet ownership on indoor pollutant concentrations. The magnitude and direction of these differences are consistent with UK evidence identifying smoking and cooking or other household activities as dominant indoor PM sources in social housing.
Interestingly, the average two-season PM levels were higher in homes using electricity for cooking than in those using gas (PM2.5: 35.9 µg/m3 vs 19.4 µg/m3; PM10: 41.3 µg/m3 vs 22.1 µg/m3). Within the electricity-cooking group, mean PM2.5 concentrations declined markedly from 49.3 µg/m3 in Season 1 to 21.1 µg/m3 in Season 2, while gas-cooking homes showed only a slight reduction (20.2 to 18.6 µg/m3). This pattern likely reflects variations in cooking methods and ventilation practices, with cooking techniques and ingredients exerting a particularly strong influence on emission levels (Pikmann et al., 2024; Zhang et al., 2010).
Discussion
This study extends the limited evidence on multi-parameter, longitudinal assessments of indoor air quality (IAQ) and thermal conditions in pre-retrofit UK social housing. By examining 23 EPC D- or E-rated dwellings in Warwickshire across two consecutive winters marked by rising energy prices, it provides critical, policy-relevant baselines for the Social Housing Decarbonisation Fund (SHDF). The findings highlight the compounded vulnerabilities of social housing residents—many of whom are elderly, on low incomes, or have pre-existing health conditions—amid the cost-of-living (CoL) crisis and substandard building performance.
Thermal conditions and behavioural adaptation
Underheating was widespread, with a pronounced decline in mean indoor temperatures during the second winter (2022–2023): bedrooms fell by 1.9°C and living rooms by 0.7°C compared to the previous year. Extended periods below 18°C are consistent with national evidence of difficulty maintaining health-based indoor temperatures, particularly in older, poorly insulated stock (Beizaee et al., 2021; Huebner et al., 2019). These reductions, coupled with survey findings showing that 70% of homes maintained thermostat settings below or around 20°C, reflect behavioural adaptations in response to energy price pressures. This pattern aligns with national trends showing households lowering thermostats, heating fewer rooms, or reducing run times to manage costs (Huebner et al., 2023; Zapata-Webborn et al., 2024).
While such adaptations may conserve energy, they increase exposure to thermal discomfort and cold-related health risks, including respiratory infections, cardiovascular strain, and elevated blood pressure.
Spatial and structural variability
More concerning is the spatial variability observed in thermal conditions both across and within dwellings—even among identical construction types—indicating inconsistencies in insulation quality and heating system performance. For example, dwelling SD15 maintained high living room temperatures but exhibited one of the coldest bedrooms. Thermal imaging revealed significant heat loss at external wall joints and window junctions, explaining this intra-dwelling disparity. These findings underscore the inadequacy of piecemeal heating strategies and reinforce the need for whole-house, fabric-first retrofit approaches that prioritise insulation, airtightness, and consistent thermal protection throughout the dwelling (Gupta and Berry, 2023a).
Over 60% of households reported prohibitively high energy bills, which correlated with widespread underheating and frequent reports of damp and mould, particularly in bedrooms, kitchens, and bathrooms. Poor thermal performance and inadequate ventilation are known to exacerbate health issues such as respiratory illness and cardiovascular stress (Boomsma et al., 2017; Jevons et al., 2016). The combination of low temperatures and elevated relative humidity (RH) levels reinforces these risks and highlights the urgent need to upgrade building envelopes to reduce heat loss and improve moisture control.
Retrofit and heating interventions
These findings strongly support targeted structural interventions. Measures such as cavity wall and loft insulation, floor insulation, airtight sealing, and high-performance glazing would substantially enhance thermal performance. Integrating low-carbon heating systems, such as ground source heat pumps, alongside improved building fabric, could deliver stable indoor temperatures while reducing energy costs (Gupta and Zahiri, 2022). Such strategies simultaneously address two key policy objectives: reducing energy demand and mitigating health risks linked to fuel poverty.
IAQ and ventilation
IAQ assessments revealed persistent exceedances of the CIBSE-recommended CO2 benchmark of 900 ppm during occupied hours, particularly in living rooms (evenings) and bedrooms (overnight). This indicates insufficient background ventilation due to reduced window opening, as residents sought to retain heat and maintain security. These results are consistent with previous findings in similar housing stock, where limited window opening during winter restricts air exchange and contributes to CO2 accumulation (Gupta and Howard, 2022; Gupta and Zahiri, 2022). The observed increase in living room CO2 levels between winters, despite colder outdoor conditions, suggests that ventilation practices tightened further under the CoL context (Huebner et al., 2023; Zapata-Webborn et al., 2024).
Although reductions in PM2.5 and PM10 levels were observed in Season 2—likely due to behavioural changes such as less frequent cooking—certain dwellings with indoor smoking and cleaning activities displayed persistently elevated particulate and VOC concentrations. Homes such as SD05 and SD03 exhibited extreme pollutant levels, highlighting the intersection between occupant behaviour, indoor activity patterns, and environmental health risks.
Consistent with previous research, the type and quantity of emissions are strongly influenced by cooking methods (e.g. grilling, frying, roasting, boiling), ingredients, fuel type, and ventilation practice, rather than fuel type alone (Pikmann et al., 2024; Zhang et al., 2010). Ensuring adequate ventilation during cooking is therefore essential to reduce exposure to cooking aerosols. Future work should employ kitchen co-location, event-based analysis, and indoor–outdoor monitoring pairs to improve source attribution.
Higher PM and VOC levels in smoking and pet-owning households align with established indoor pollutant source profiles—tobacco smoke, pet dander, dust, and cleaning products—and may be exacerbated by restricted ventilation. Given the small sub-sample (n = 13 dwellings), the absence of outdoor PM data, and sensitivity to device placement, these results are presented as descriptive rather than inferential. Future studies should include co-located outdoor monitoring, detailed room metadata (volume and real-time occupancy), and larger samples to enable robust statistical modelling.
Implications for retrofit design and policy
The findings clearly indicate that ventilation must be central to future retrofit strategies. Current approaches—predominantly reliant on window opening—are compromised during colder months, when residents prioritise heat retention and security. The widespread absence of mechanical ventilation, trickle vents, or extract systems in key rooms (such as kitchens and living areas) contributes to pollutant accumulation. Retrofit programmes should therefore integrate passive or demand-controlled ventilation systems that maintain air quality while minimising heat loss. Equally important is resident education on safe and effective ventilation practices that do not undermine thermal comfort or exacerbate energy costs (Stamp et al., 2022).
The strong correlations observed between CO2, PM, and VOC levels reflect their shared dependence on ventilation effectiveness. The synchronised evening peaks of these pollutants highlight the need for integrated retrofit strategies that balance energy efficiency with IAQ management (DESNZ, 2023b). Technical upgrades alone are insufficient; successful retrofit programmes must also address occupant behaviour, usage patterns, and preferences - particularly in households with high occupancy density and limited financial flexibility.
Limitations and future research
This study has some limitations. Room occupancy periods were estimated based on BEIS (2021) averages rather than direct observation, which may introduce minor uncertainties in exposure estimates. Pollutant concentrations may be sensitive to sensor placement (e.g. near doors vs stagnant zones) and unmeasured room-level characteristics such as size, volume, and occupancy. VOC data from Season 2 were also affected by equipment malfunction, constraining analysis. Furthermore, the lack of outdoor PM data limits the ability to distinguish between indoor-generated and outdoor-infiltrated particulates.
Future work should therefore employ concurrent indoor–outdoor monitoring, record sensor locations and room volumes, and collect time-resolved occupancy data to improve source attribution. Year-round monitoring and qualitative insights into residents’ heating and ventilation decision-making would further contextualise the quantitative findings and strengthen the evidence base for policy and retrofit design.
Conclusion
This study adopted a socio-technical approach to examine pre-retrofit indoor environmental conditions in 23 social housing dwellings in Warwickshire, UK. Monitoring across two consecutive winters, including the 2022–2023 heating season at the height of the cost-of-living crisis, revealed widespread underheating, particularly in bedrooms, driven by poor insulation, inefficient building fabric, rising energy costs, and adaptive occupant behaviours aimed at conserving energy. Concurrently, elevated CO2 and PM concentrations during occupied hours indicated inadequate ventilation, while persistent low temperatures and high humidity contributed to damp and mould in over half of the dwellings. Together, these deficiencies pose a significant threat to occupant health, especially for vulnerable households.
The findings strongly reinforce the need for a fabric-first retrofit strategy, beginning with improvements to insulation (walls, roofs, and floors), airtightness, and window performance. These measures should precede, or occur alongside, heating system upgrades and be complemented by occupant guidance and low-cost ventilation solutions such as trickle vents or demand-controlled systems. This sequencing reduces heating demand, supports thermal comfort, and prevents pollutant build-up, ensuring that retrofits deliver both energy efficiency and healthier indoor environments.
This research provides an evidence-based case for a holistic, occupant-centred retrofit approach in the UK social housing sector, one that advances decarbonisation while prioritising health, comfort, and resilience. As energy prices continue to rise and climatic conditions become more extreme, future-proofing social housing must be recognised as a national health and equity imperative. Retrofit interventions should not solely target carbon reduction, but also deliver tangible wellbeing benefits to residents who are often among the most financially and physically vulnerable.
While this study offers valuable insights, several limitations remain. The relatively small sample size and short-term monitoring period constrain the generalisability of findings and limit the ability to capture full seasonal variability. Future research should prioritise longitudinal, large-scale, measurement-based studies that track IAQ and thermal comfort over time, incorporating detailed occupancy and behavioural data. Such approaches would enable more robust identification of retrofit needs and the development of tailored, context-specific solutions that reflect both technical performance and lived experience.
Empirical evidence of this kind is vital to inform retrofit design for similar housing typologies. It can help identify where energy savings and health co-benefits are most achievable, ensuring interventions are both technically effective and socially responsive. Within the framework of the UK Government’s SHDF programme and wider climate objectives, national and local policymakers must commit to delivering clear retrofit guidance, enforceable IAQ standards, and consistent implementation support. Only through such integrated, occupant-focussed strategies can retrofit programmes achieve the triple aim of climate mitigation, energy affordability, and the creation of healthy, liveable homes for all.
Footnotes
Acknowledgements
This study is part of the REFINE project funded by the UK Government’s Social Housing Decarbonisation Fund (SHDF) Demonstrator Grant No. 31/5281. We are grateful to the occupants for their help and support in conducting the study.
Ethical Considerations
The study was conducted in accordance with the Oxford Brookes University Research Ethics Committee (UREC registration no. 201498).
Consent to Participate
Informed consent was obtained from all subjects involved in the study.
Funding
The authors disclosed receipt of the following financial support for the research, authorship, and/or publication of this article: This study is part of the REFINE project funded by the UK Government’s Social Housing Decarbonisation Fund (SHDF) Demonstrator Grant No. 31/5281.
Declaration of Conflicting Interests
The authors declared no potential conflicts of interest with respect to the research, authorship, and/or publication of this article.
Data Availability Statement
Data is contained within this article.