
Abstract
Considering the alarming rise in the rate of asthma and respiratory diseases among school children, it is of great importance to investigate all probable causes. Outside of the home, children spend most of their time in school. Many studies have researched the indoor environmental quality of primary and secondary school buildings to determine the exposure of school children to indoor air pollution. However, studies of very young children in nurseries are scarce. Unlike at elementary schools or universities, children in nurseries are more vulnerable due to their physiology, inability to articulate discomfort and to adapt their behaviour to avoid exposures. This article reviews current studies on the indoor environment in nurseries. It summarizes air pollution levels and related environmental and behavioural factors in nurseries that have been reported in the literature. Additionally, exposure to indoor air pollution and related potential health outcomes are examined. This review concludes that indoor air pollution in nurseries often exceeds current guidelines, and designers and policymakers should be made aware of the impact on the health and wellbeing of children in nurseries. Proper interventions and guidelines should be considered to create a healthy indoor environment for nursery children.
Keywords
Introduction
Outdoor air pollution is recognized as a severe problem worldwide. Epidemiological evidence indicates that air pollutants contribute to increasing mortality rates and hospital admissions. 1 In recent decades, researchers have paid more attention to indoor air quality because people spend about 90% of their time indoors leaving them at risk for higher periods of exposure. 2 However, monitoring and analysis of indoor environments can be challenging due to several factors, including; building characteristics, occupant behaviours, and pollutants from outdoor sources. Building characteristics include conditions such as ventilation rates, envelope ‘leakiness’, and age of the structure. With such a wide variety of building types, establishing rigorous and repeatable protocols for monitoring pollutants is difficult. Occupant behaviour has nearly as many varieties as there are occupants, and includes indoor activities such as cooking, as well as, patterns of use (e.g. time spent at home). Sources of pollutants also vary widely by location and building use. For example, buildings located along a busy urban road will have a different profile of pollutants than a suburban school in a greenfield. Due to the myriad building and occupancy configurations, generalizability is limited, and analysis is a challenge. However, studies have shown that indoor air can be more polluted than outdoor air, and poor indoor air quality has been linked to negative health outcomes.
Children, especially those under six years old, are more vulnerable than adults to environmental pollutants because their immune and respiratory systems are not fully developed; children have a larger surface area to volume ratio; and a faster rate of respiration. Furthermore, children spend more time in the indoors, averaging 7–11 h per weekday in classrooms alone. 3 It has been shown that indoor air pollutants have the potential to damage children’s central nervous system. 4 Also, exposures to air pollutants before the age of one-year may contribute to the development of childhood asthma. 5 The evidence gathered for these observed outcomes has been primarily focussed on offices and residential buildings. The research on schools tends to be on primary and secondary schools, and there is a substantial and important lack of data and guidance on the indoor air quality of nurseries.
In this review we identified 33 studies (Table 1) that focussed on indoor air quality in nursery settings. These studies found that many children are in nurseries that have poor indoor environmental quality. Most of the studies only focussed on one or two specific aspects of indoor air quality (e.g. particulate matter, carbon dioxide, allergens), and only a few of them attempted to give an overall analysis of the indoor environmental quality in nurseries.
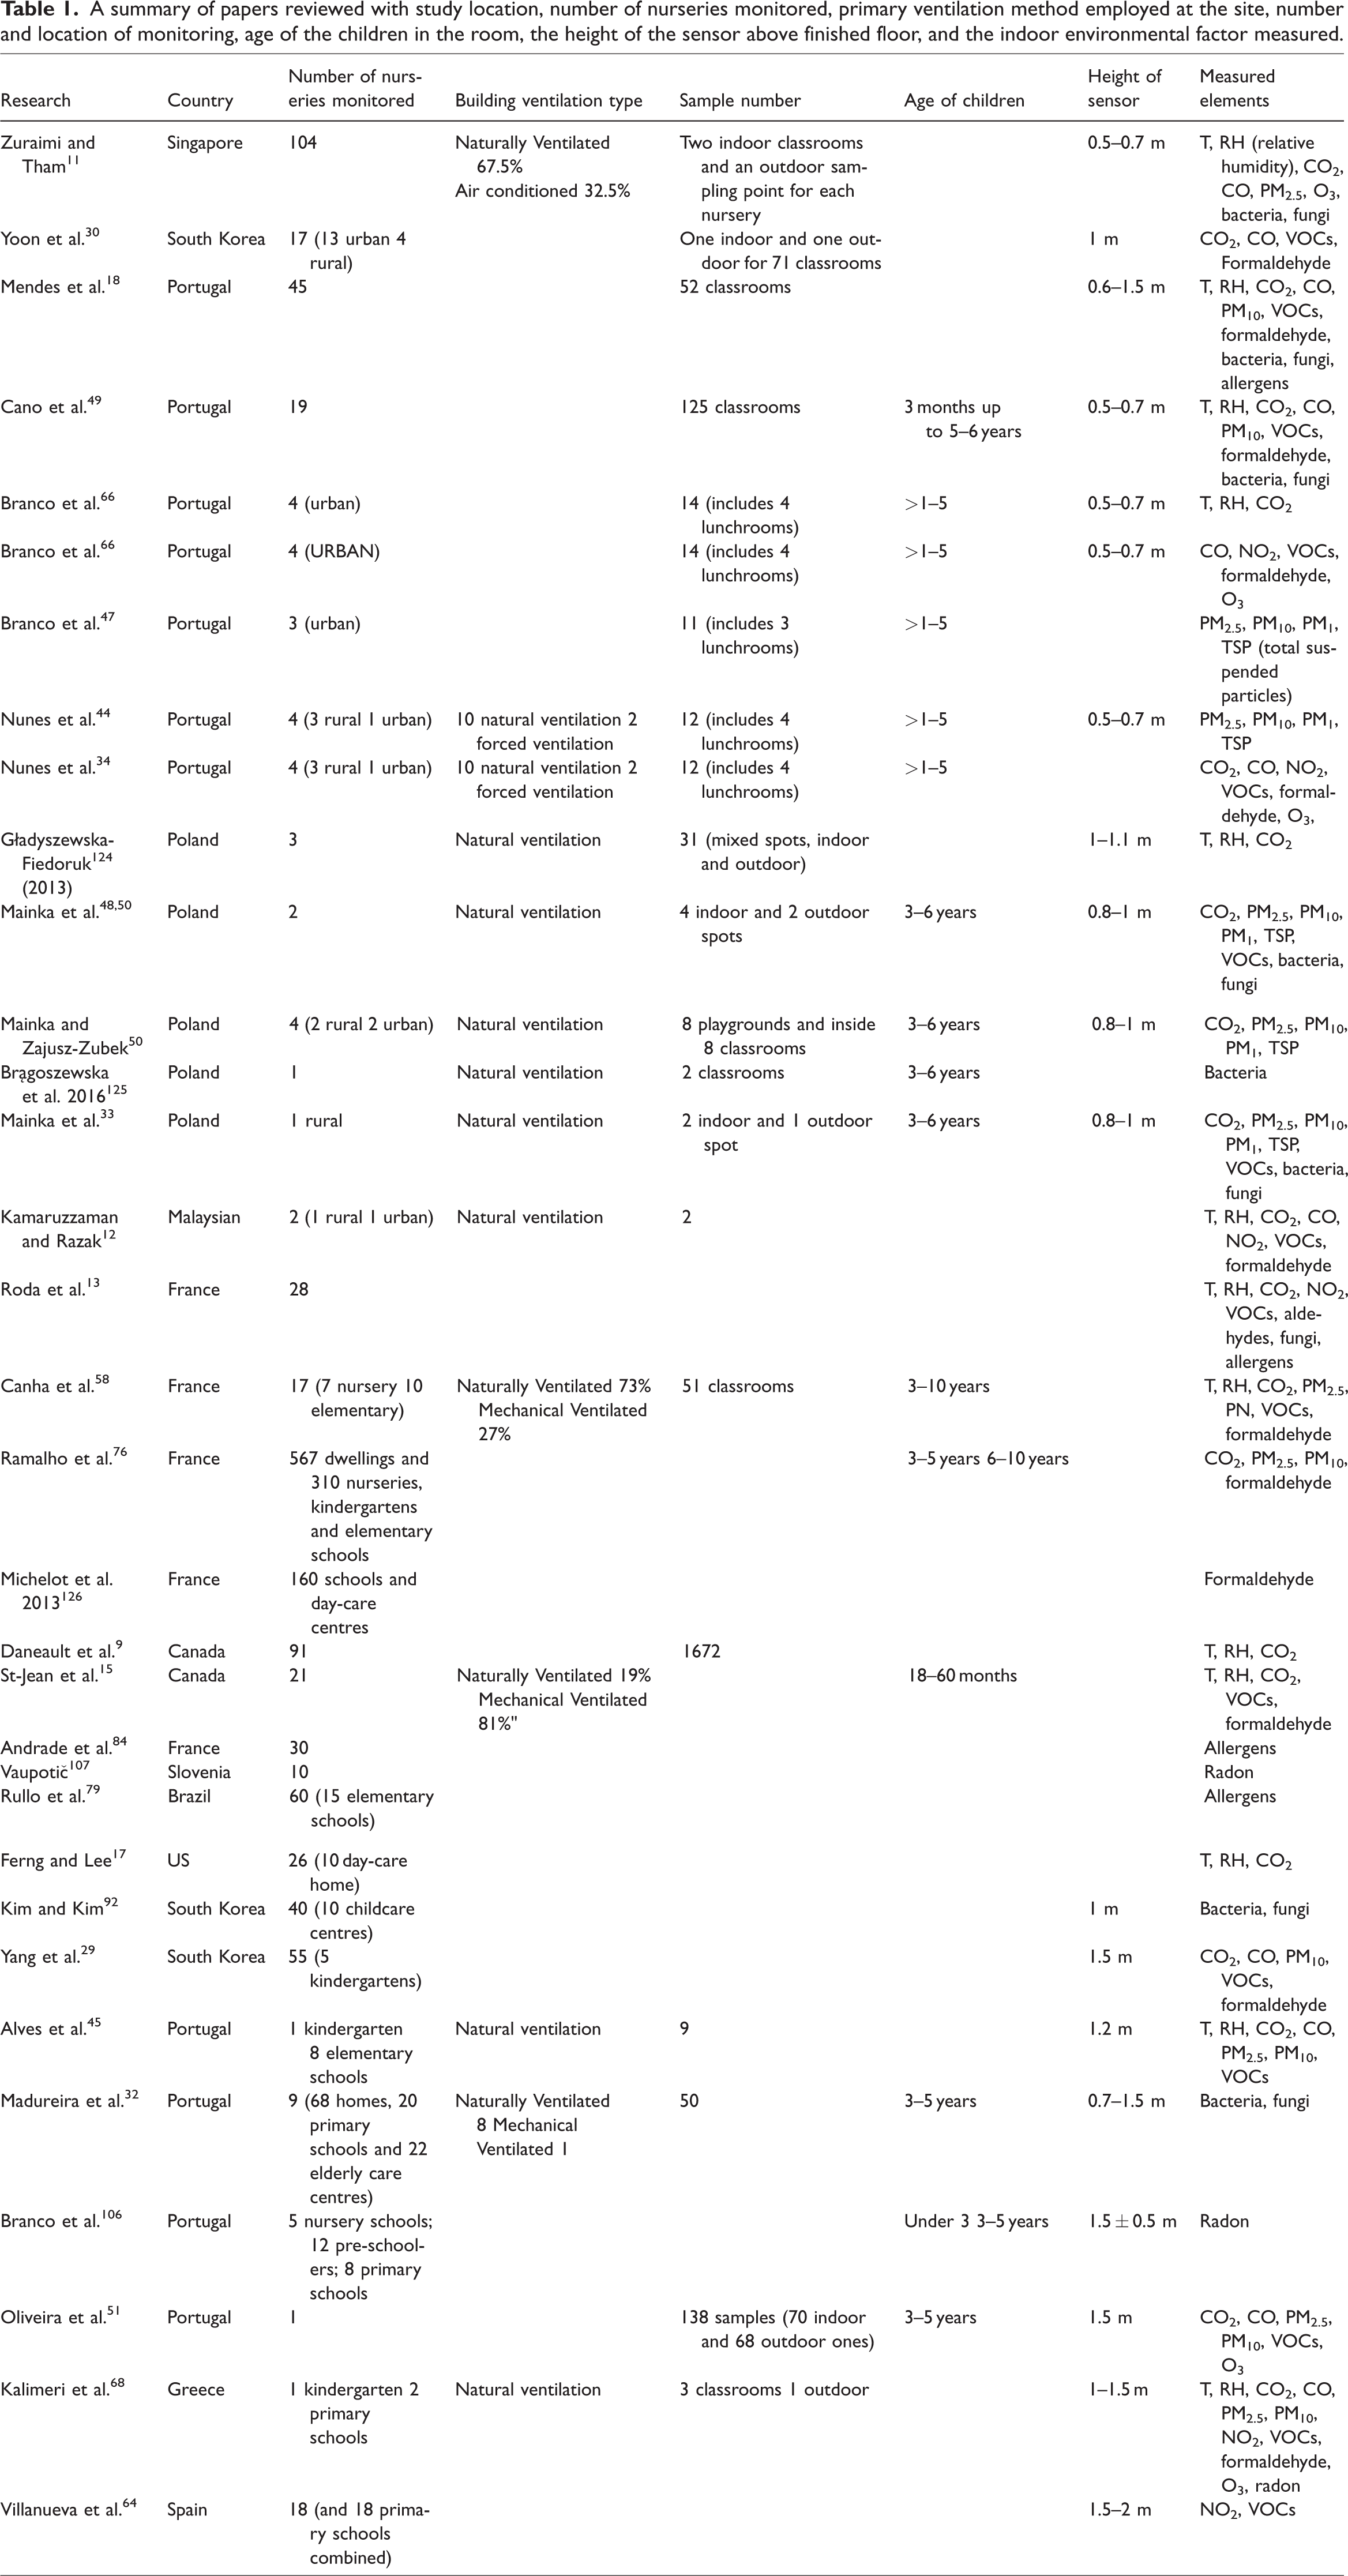
A summary of papers reviewed with study location, number of nurseries monitored, primary ventilation method employed at the site, number and location of monitoring, age of the children in the room, the height of the sensor above finished floor, and the indoor environmental factor measured.
In the future, buildings should be designed or retrofitted with a comprehensive approach that integrates physical characteristics, occupant behaviour patterns, and avoidance of harmful microbial and chemical exposures in their design and operation. 6 The aims of this paper are: first, explore the perception of thermal comfort of nursery children; second, describe the current ventilation strategies in nurseries; third, identify the type and scale of exposure of children to pollutants in nursery environments. This review aims to provide scientific evidence to guide policymakers, design professionals and researchers to a better understanding of current indoor environmental quality in nursery settings.
Research overview
Studies focusing on indoor air quality in nursery environments were conducted in Europe, including Portugal, France and Poland, as well as in South Korea, Singapore and Canada, only a few studies were available from developing countries. As shown in Table 1, many studies focussed solely on a single parameter of indoor air quality. Temperature, humidity, CO2, particulate matter (PM), and volatile organic compounds (VOCs) were the parameters most often studied. The number of nurseries monitored varied from 1 to 310, and classroom sizes also varied between studies. Most of the investigated classrooms were naturally ventilated, and the age of children was mainly older than three years. For studies conducted in a location with a varied climate, few included any observed seasonal differences. Most studies only measured for one day during occupied hours. Few studies measured for more than one day, and for those that did the measurement periods lasted from two to nine days. Sensors were generally placed at a height of 0.5–1.5 m, in the breathing zone for children less than six years old.
The measuring methods used in the studies can be found in the appendix. Most studies employed active sampling methods to measure different indoor air quality (IAQ) parameters, with some studies using passive sampling methods for gas pollutants (VOCs, NO2, etc.). However, there are several limitations in the IAQ monitoring methods used. For instance, many studies had insufficient measuring periods, or the measuring time/date was inconsistent between monitored nurseries. Some studies did not include outdoor pollutant levels, or if they did, used publicly available monitoring data as their outdoor reference. No study used both active and passive sampling methods for gas pollutants, and any room height difference of indoor PM levels was not determined.
This review categorizes IAQ into two themes; environmental conditions and IAQ control solutions. Environmental conditions include thermal comfort, ventilation rate and CO2 level and indoor air pollutants (e.g. PM, chemical concentrations). Research outcomes within the same theme were analysed to get a general understanding of the indoor air quality conditions in nurseries.
Environmental conditions
Thermal comfort
According to ASHRAE (American Society of Heating, Refrigeration and Air Conditioning Engineers) Standard 55-2017, 7 the recommended indoor temperature range is around 19–27°C, and the recommended indoor relative humidity is between 30 and 60%. 8 Some studies measured the indoor air temperature and relative humidity in nurseries and compared the outcomes with current guidelines. Temperature (Figure 1) and relative humidity (Figure 2) in most nurseries fell within the comfort range.9–16 A notable exception to the adherence to temperature and relative humidity guidelines is one study that measured four nurseries in Portugal. The conditions there may have been due to a poorly constructed or ageing building (e.g. insufficient thermal insulation and water intrusion), and the inappropriate use of heaters or air conditioning systems. 14 Another study investigated 26 nurseries in the western United States. They reported that 42% of the monitored nurseries were outside of the temperature comfort zone (34.6% lower and 7.7% higher), and during naptime, 26.1% of the nurseries have a higher relative humidity than the comfort zone. 17 In Poland, a study found higher than recommended indoor temperatures, ranging from 24.0 to 29.6°C during the daytime. 16 However, comparisons between studies are tricky because the measuring periods, climate, countries and building characteristics were different.
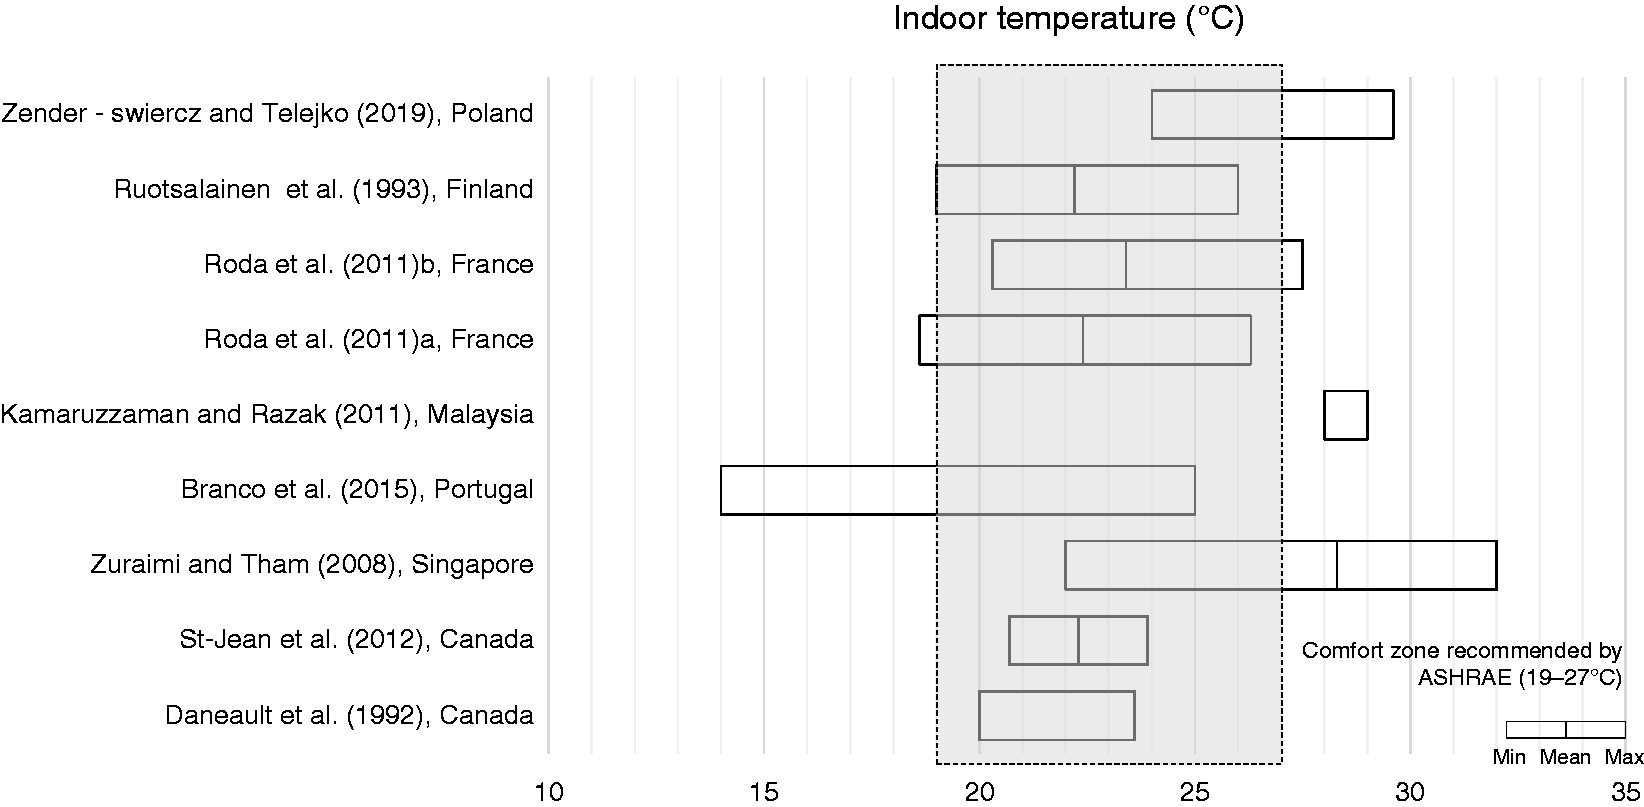
Summary of reported indoor temperature means and ranges.
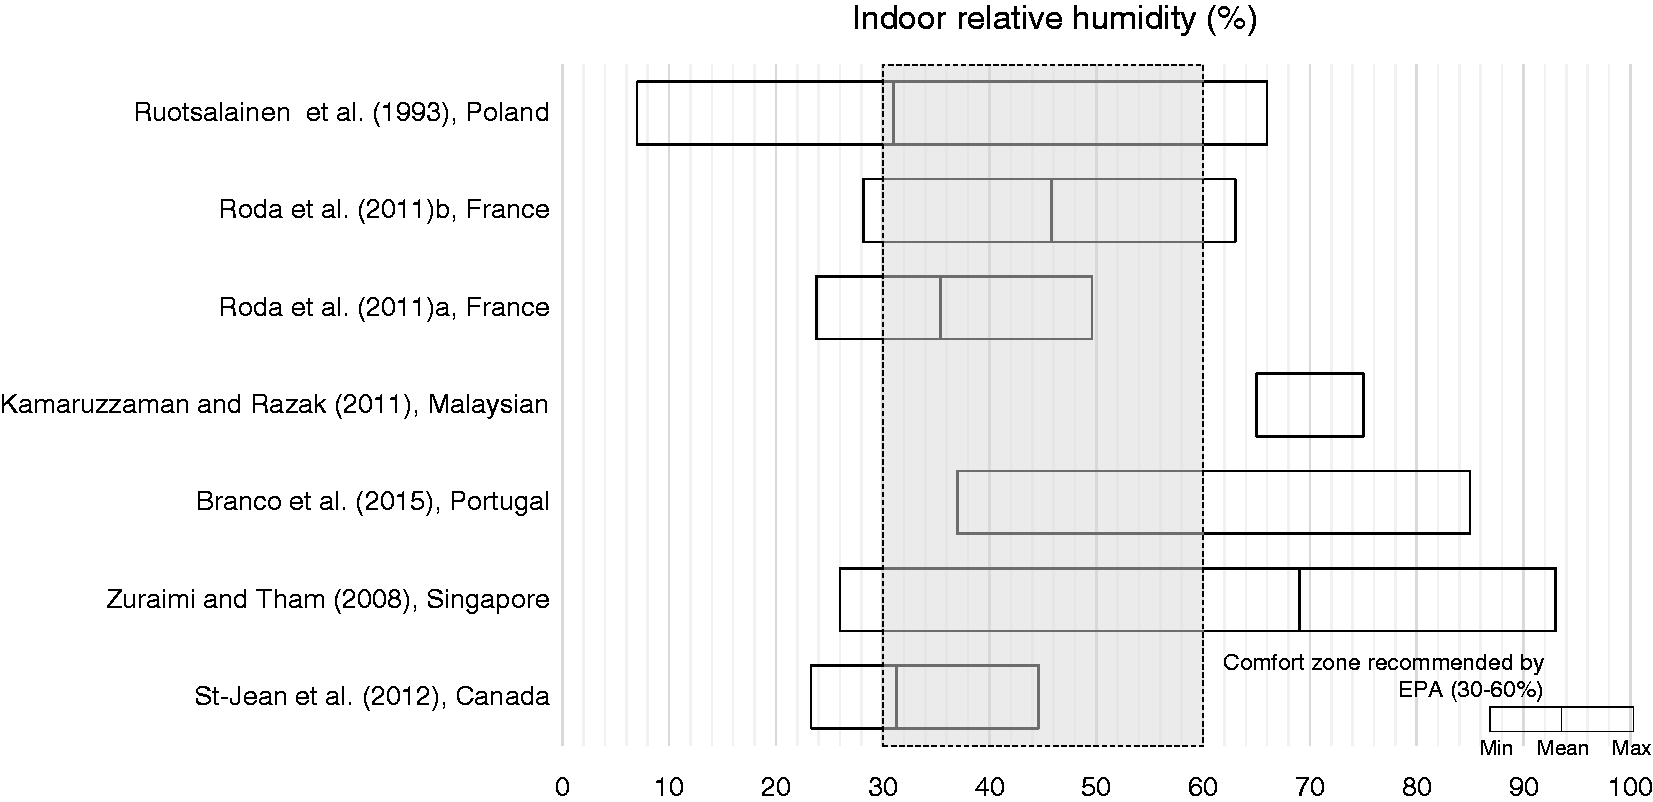
Summary of reported indoor relative humidity (RH) means and ranges.
In addition to collecting temperature and relative humidity data from nurseries, researchers assessed the thermal comfort of the children there. Children have higher metabolic rates than adults, and when they are unsatisfied with the thermal conditions, they do not necessarily behave like adults to adapt to the environment (e.g. take off/add clothes, open/close windows). One study focussed on the thermal comfort in nurseries in winter and spring. 18 They reported a predicted mean vote (PMV) between “neutral” (0) and “slightly cool” (≤–1), on the thermal sensation scale of −2 to 2. In Korea, a study reported that children prefer lower temperatures (about 3°C lower) than adults and girls prefer temperatures about 1°C lower than boys of nursery age. 19
All in all, temperature and humidity are important elements in the studies of indoor environmental quality. It has been well demonstrated that temperature and humidity have a strong influence on the perception of indoor air quality and on the volatilisation of chemicals used indoors.20–22 More studies focussed on overheating as a problem, due to global climate change. High indoor temperatures can have many adverse impacts on human health, causing problems such as heatstroke and aggravating chronic conditions like cardiovascular and respiratory diseases. 23 Low indoor relative humidity can cause problems such as dry eyes, nose, ears and throat, and high indoor relative humidity is associated with dust mites and fungal moulds. 24
Ventilation rate and CO2 level
The indoor concentration of CO2 can be used as an indicator of ventilation rate and indoor air quality. However, it is a poor indicator of outdoor-associated pollutants (e.g. traffic-related pollutants and fungi species). As mentioned by BB101 (2018), several factors can affect the concentration of CO2 in indoor environments, including the ventilation rate, occupant density, activity level of occupants, and the occupied time. 25 ASHRAE Standard 62.1-2016 recommends that indoor CO2 concentrations should not exceed 700 ppm above the outdoor concentration (typically around 400 ppm), 26 and when mechanical ventilation is used, indoor CO2 concentrations in schools should be maintained at/or below 1000 ppm. 25
Studies commonly report that CO2 concentrations in nurseries are high. Published results from several studies found 75% (out of 6 schools), 89.3% (out of 28 samples) and 90% (out of 91 schools) of measured indoor CO2 concentrations exceeded 1000 ppm.9,27,28 Across numerous studies measured indoor CO2 concentrations ranged from 377 to 2750 ppm.9,13,15,18,27–32 However, as monitoring methods (e.g. monitoring periods) used in the studies was different, comparing the results is difficult. This range provides a snapshot of the CO2 concentration published in the current research. As shown in Figure 3, indoor CO2 concentrations are relatively high in most studies. However, low CO2 concentrations (below 1000 ppm) do not guarantee acceptable indoor air quality. As one study done in South Korea reported, 41% of rural schools exceeded the South Korean IAQ standard for TVOC concentrations (400 µg/m3), even though the average CO2 concentration was 607.8 ppm in these same nurseries. 30
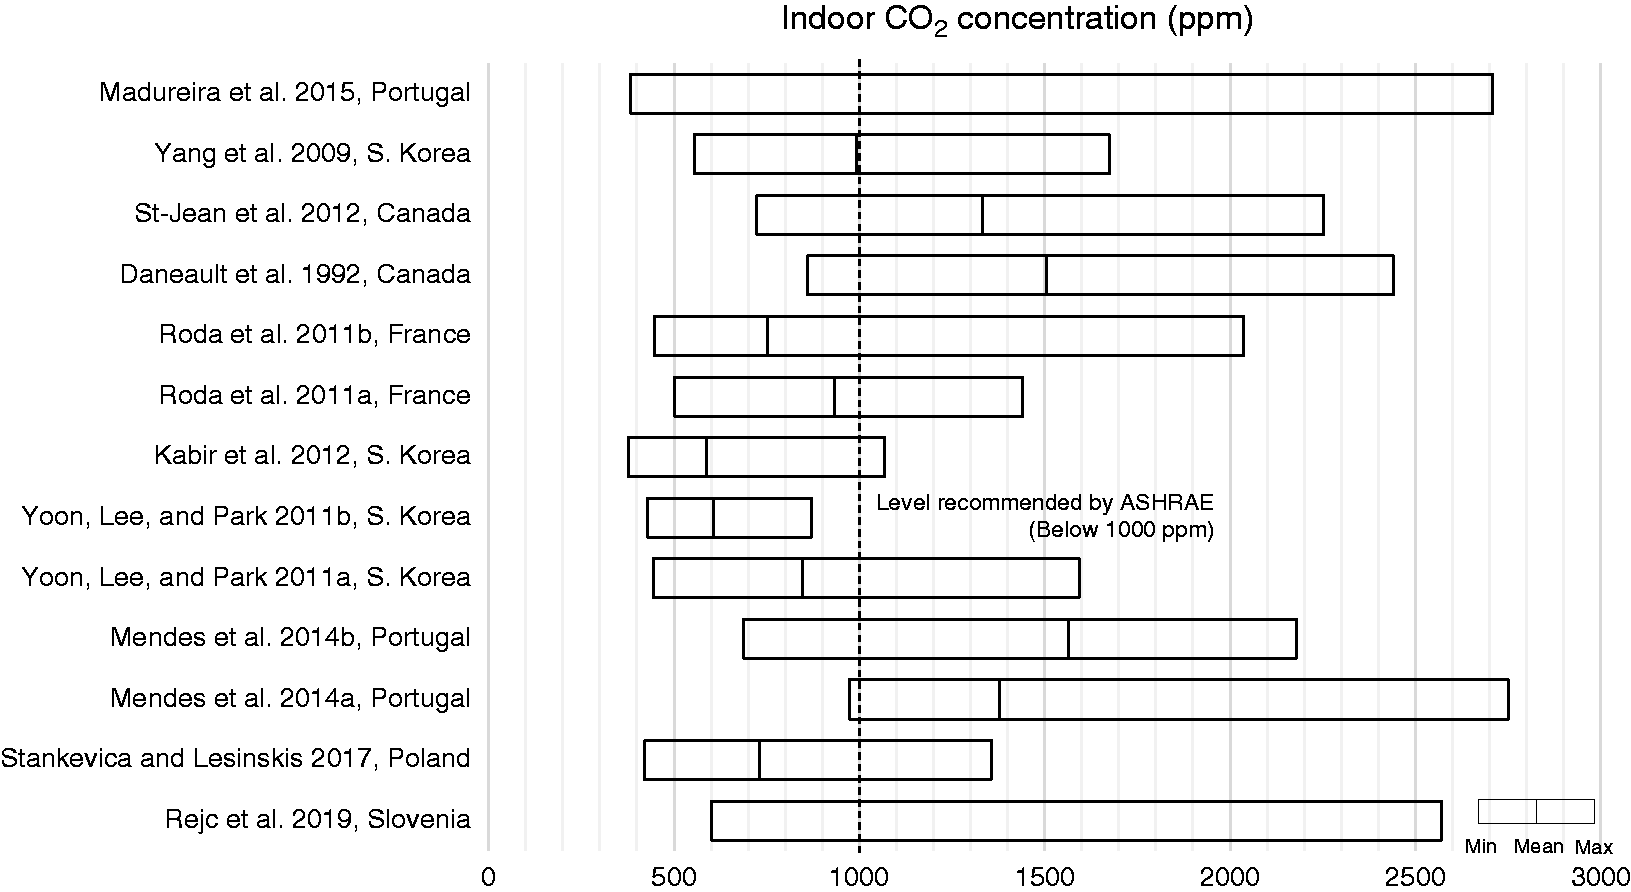
Summary of reported indoor CO2 concentration means and ranges.
It is worth noting, studies reported that classrooms of younger children tend to have a higher CO2 concentration than classrooms of older children. Also, higher CO2 concentrations occur during nap-time, with about 104 ppm higher than non-nap-times.17,18,33 Urban nurseries tend to have a higher concentration than rural nurseries,30,34 and publicly managed nurseries have poorer indoor air quality than privately managed nurseries. 14
The effect of inadequate ventilation on human health and performance includes; respiratory illnesses, allergies and asthma, sick building syndrome symptoms (SBS), reductions in performance and productivity and perceived air quality. 35 Previous meta-analyses have reported that low ventilation rates might have adverse effects on the health of school children. 36 Sundell et al. 37 and Smedje et al. 38 reported that increasing the outdoor air flow rate from 1.3 to 12.8 l/s-p (corresponding to a decreased mean indoor CO2 concentration of 1050–780 ppm), reduced asthma symptoms in pupils from 11.1% to 3.4% over a two-year period. In addition to health outcomes, a study in primary and secondary schools reported that a 1000 ppm increase in indoor CO2 related to a 10–20% increase in student absenteeism. 39
Particulate matter
Particulate matter is a leading cause of death and disability worldwide, 40 and the negative impact on health is especially consequential for children.40,41 In general, the smaller the particle size, the more deeply it penetrates and deposits within the respiratory system, posing a greater threat to human health. Studies have shown that large-scale international or national interventions, as well as personal prevention approaches, might help to reduce particulate matter and improve indoor air quality. 42
Measured indoor particulate matter levels are often higher than those reported outdoors. Indoor PM concentrations are strongly influenced by outdoor sources (mainly from traffic emissions), and urban nurseries tend to have higher PM levels than rural nurseries.43,44 There are also indoor determinants that strongly influence the PM level. In indoor environments, particulates can be generated from human-related activities like cooking, activities of children (playing/walking), cleaning activities, office equipment (e.g. printers), and from construction-related activities like renovation and reconstruction.11,29 Studies also find that higher indoor PM levels are associated with high occupant density and PM10 concentrations are more sensitive to occupancy than PM2.5.45–47 However, a small number of children in the classroom is enough to increase PM concentrations. 44 It is worth noting that indoor PM levels are higher in the classrooms of older children, due to the high level of activity of older children.47,48
PM10
The reported PM10 levels in indoor nursery environments ranged from 6.8 to 216 µg/m3.29,31,43,46,49–52 As shown in Figure 4, almost all the studies report indoor PM10 levels that exceed the 50 µg/m3 24-hour mean guidelines recommended by WHO. 53 A study from Cano et al. 49 reported that floor covering material might be a crucial element that influences the indoor level of PM10. Among the hard surface flooring materials (e.g. wood, tile/stone or PVC), wooden floors are more likely to become the source of PM10. The authors speculated that this might be due to the difficulty of adequately cleaning the joints in wooden floors. A meta-analysis reported that with an increase of 10 µg/m3 of PM10, there was an increase of 2.8% in asthma symptoms and 1.2% in cough. 54 Exposure to air pollutants such as PM10 was associated with illness-related absenteeism. In a three-year study, the estimated relative illness-related absenteeism risks were 1.06 (95% confidence interval, 1.04–1.09) per 42.1 µg/m3 increase in PM10. 55
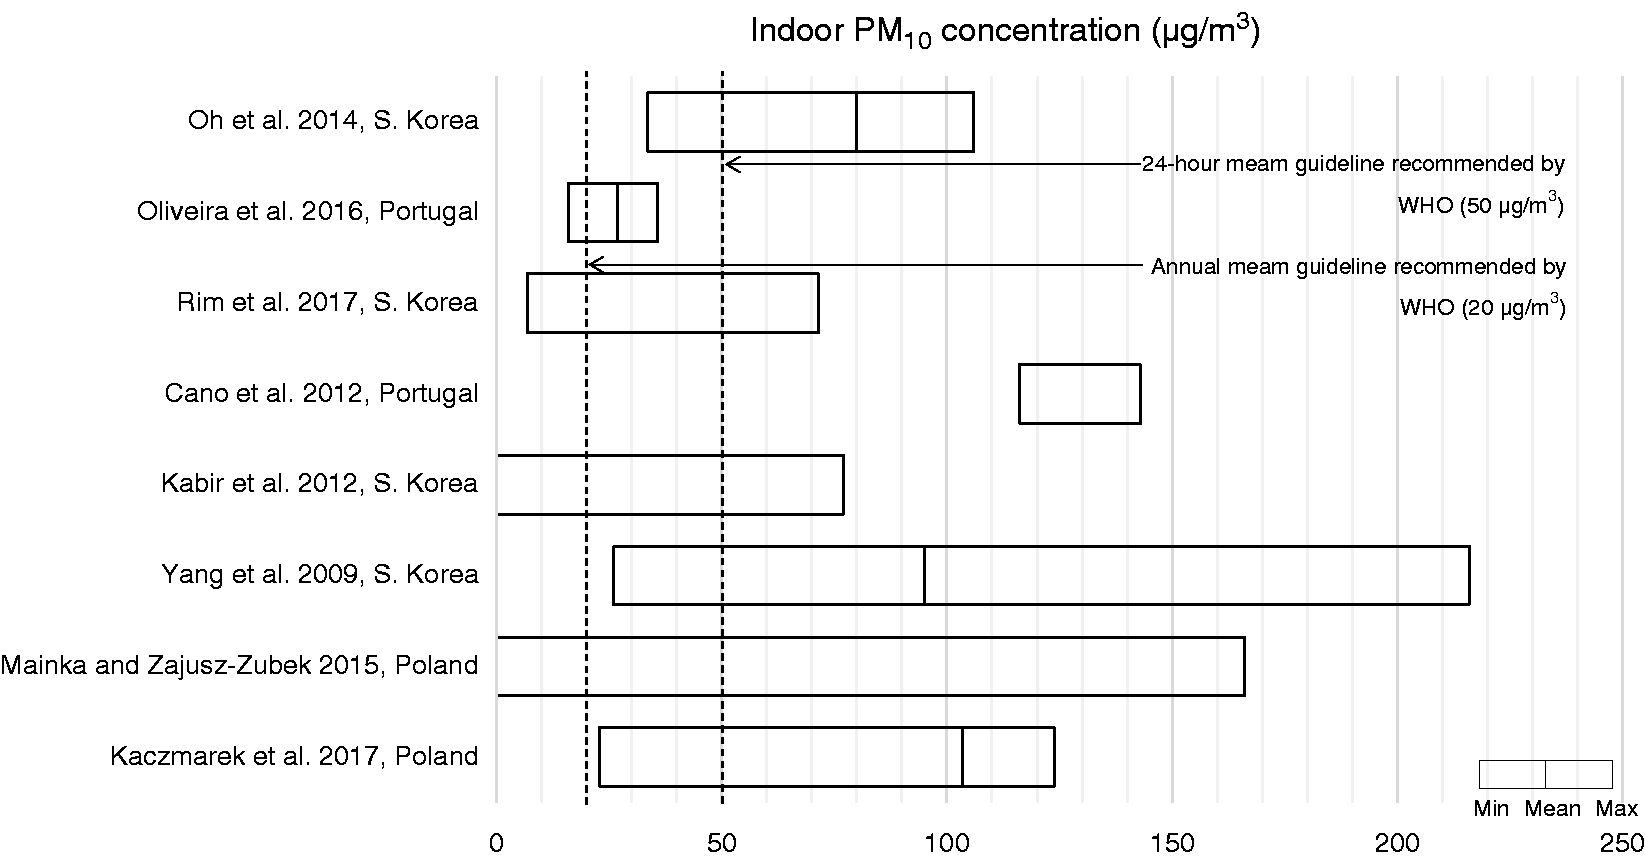
Summary of reported indoor PM10 concentration means and ranges.
PM2.5
The reported PM2.5 levels in nursery environments ranged from 3.2 to 177.2 µg/m3.11,43,46,50,51,56–58 As shown in Figure 5, almost all the studies reported substantially higher indoor PM2.5 levels than the 25 µg/m3 24-h mean guideline recommended by WHO. 53 One study found that children exposed to an excess level of PM2.5 have a greater risk of respiratory symptoms and reduced lung function. 59 An epidemiological study reported that a 10 µg/m3 increase in PM2.5 was correlated with a 15% rise in hospital admissions for asthma. 60
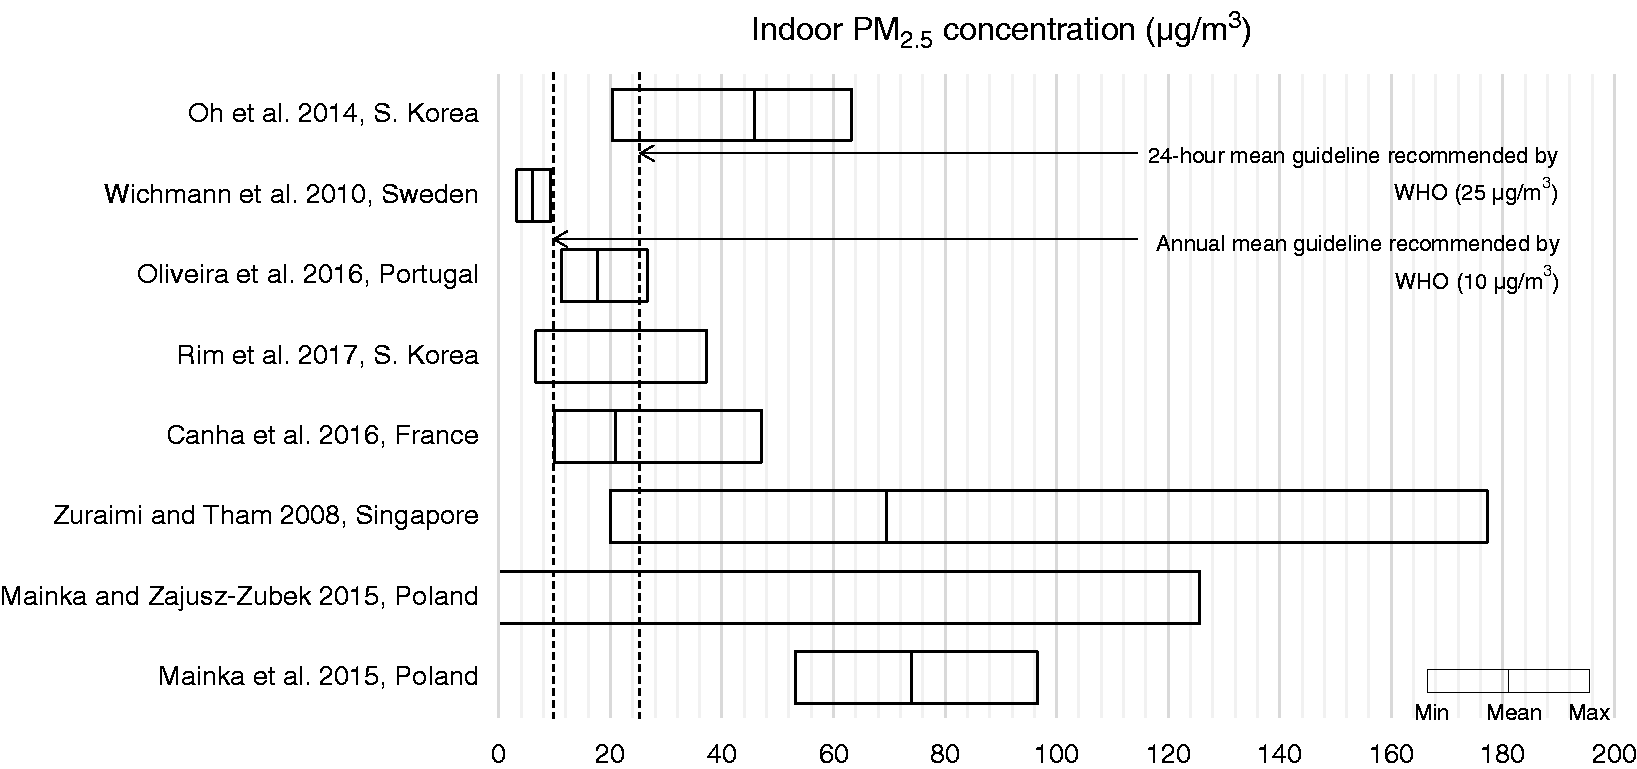
Summary of reported indoor PM2.5 concentration means and ranges.
Ultra-fine particulates
Limited data is available on the concentration of ultrafine particles (particulate matter of nanoscale size; less than 0.1 μm or 100 nm in diameter) in nurseries. The main elements influencing UFP level are summarised as: children’s activities during classes (e.g. painting and other arts and crafts activities), combustion sources (e.g. candles on a birthday cake), and classroom cleaning (e.g. dusting and wood polishing). 61
In Portugal, a study investigated three nurseries and reported a mean concentration of 1.82 × 10⁴ particle/cm3 and 1.32 × 10⁴ particle/cm3 in urban nurseries, and 1.15 × 10⁴ particle/cm3 in a rural nursery. They concluded that canteens have the highest UFP level, likely because they were directly connected to the kitchen with a gas stove. Also, the UFP levels in playrooms were about two times higher than in classrooms. It’s worth noting that during two activities (candles burning on a birthday cake and clay grinding), the concentrations were 13 times higher than the estimated mean value. 62 Due to the small size of UFPs, they can penetrate biological membranes and pass into the systemic circulation, and eventually get into organ systems including the brain and nervous system. Studies about independent health effects of UFP are scarce. A review study identified 85 studies and reported that there were inflammatory and cardiovascular changes associated with short-term UFP exposure. 63
Nitrogen dioxide (NO2)
Compared to other indoor environments, nurseries tend to have higher indoor NO2 levels. Indoor levels are strongly influenced by outdoor levels associated with road traffic. For convenience, nurseries are often located on the ground floor and close to main roads making them vulnerable to this pollutant.13,64 Studies on indoor NO2 concentrations in nursery environments are scarce. Reported indoor NO2 levels in nurseries (Figure 6) ranged from undetectable to 30.2 µg/m3, which does not exceed the annual mean value of 40 µg/m3 recommended by WHO.12,13,64,65 However, one study in Portugal found the mean NO2 concentrations in 10 urban and 5 rural classrooms ranged from undetectable to 136 µg/m3 and 16.67–125.17 µg/m3, respectively. The classroom with the highest NO2 concentration was the one located on the ground floor with windows in the front (roadside) façade of the building.34,66
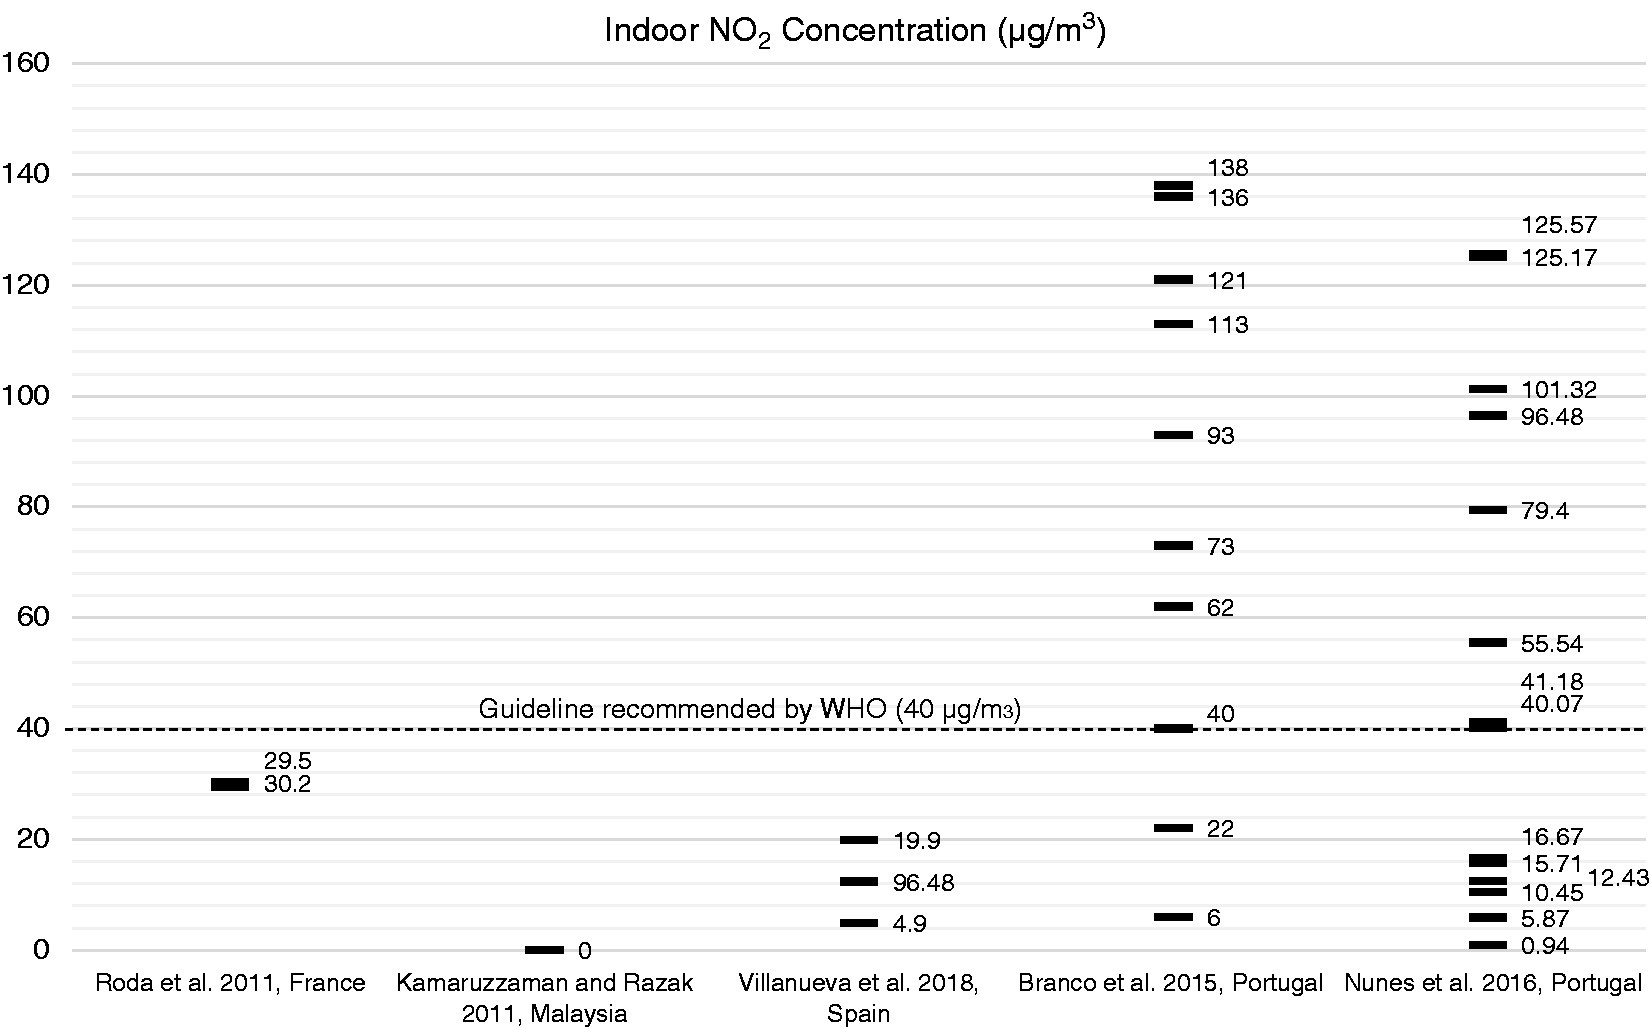
Summary of reported indoor NO2 concentration averages.
It is worth noting that one study reported higher NO2 levels in classrooms with more students. 64 However, in another study, a classroom was measured both fully occupied and partially occupied for NO2 concentrations, and the outcomes were 16.67 and 41.18 µg/m3, respectively. Indicating lower NO2 levels with more students. 34 The relationship between indoor NO2 levels and occupant density warrants further exploration.
The health impact of NO2 is primarily on the respiratory system, increasing the risk of lung infection and causing problems such as wheezing, coughing, colds, flu and bronchitis. A meta-analysis found that with an increase of 10 µg/m3 of NO2, there was an increase in asthma symptoms of 3.1%. 54 However, compared with other pollutants, the adverse impact of NO2 on health may have a longer lag period, which contributes to the difficulty in studying the relationship between NO2 exposure and health outcomes. 67
Ozone (O3)
Indoor O3 concentrations are mainly influenced by outdoor air. In most circumstances, indoor O3 levels are significantly lower than outdoor levels, because few indoor sources (e.g. printers, electronic air cleaners) are found in nurseries, and O3 is highly reactive. 68 One study investigated 10 classrooms in four urban nurseries, the mean O3 concentrations in classrooms ranged from 9 to 24 µg/m3. 66 In Singapore, a study focused on the difference between air-conditioned and naturally ventilated nursery classrooms. Naturally ventilated classrooms had a mean O3 concentration of 71.0 µg/m3, which was significantly higher than air-conditioned classrooms with a mean concentration of 31.5 µg/m3. 11
A study from Portugal reported a mean O3 concentration of 119 µg/m3 which exceeds the 100 µg/m3 (over an 8-hour period) recommended by WHO. 65 The outdoor mean O3 concentration was 188 µg/m3. The authors did not provide a reason for the high concentrations, but reported that the studied nursery is situated on moderately trafficked streets. 51 A list of studies and their reported findings on O3 concentration can be found in Figure 7. One study found that outdoor O3 concentration and total area cleaned are important elements that influence indoor O3 concentration. During the cleaning process, O3 and terpene (a constituent of some cleaning products) react to reduce indoor O3 concentrations. 11
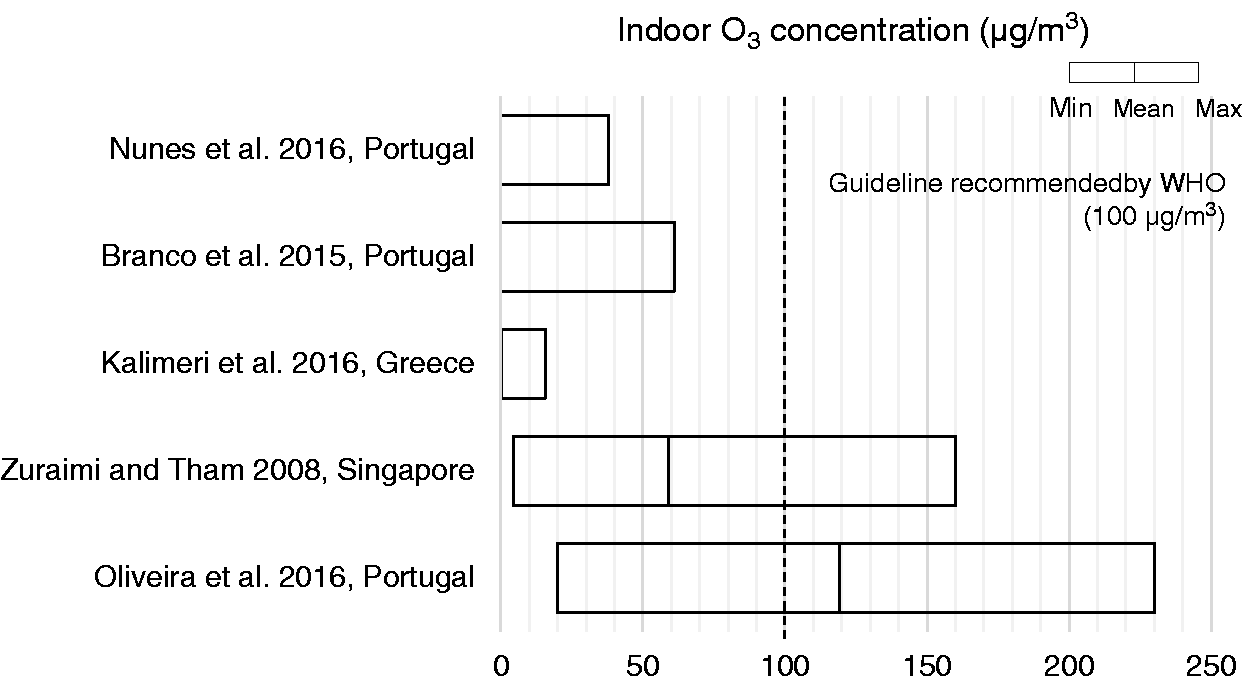
Summary of study reported indoor O3 concentration means and ranges.
Exposure to O3 is associated with various respiratory symptoms including coughing, wheezing, dyspnoea, and other symptoms such as nausea and headache. 69 In Mexico, a study reported that when nursery children were exposed for two consecutive days to relatively high O3 levels (>0.13 ppm, or 259.4 µg/m3), there was a 20% increased risk of respiratory illness. 70 Another study focused on elementary schools quantifies that further, with an increase of 20 ppb of O3, there is an 82.9% increase in upper respiratory illnesses, 173.9% for lower respiratory illness with wet cough, and 62.9% for illness-related absence. 71 A separate study, with similar outcomes, estimated that relative risks of illness-related absenteeism for O3 were 1.08 (95% CI, 1.06–1.11) per 15.94 ppb. 55
Carbon monoxide (CO)
Studies report that CO found indoors is mainly from outdoor sources, and generally traffic related. As a result, nurseries located in urban areas, and in naturally ventilated buildings, tend to have a higher indoor concentration.11,34 However, there are still indoor sources that should be considered such as, heating systems, wood-burning stoves, fireplaces, water heaters, clothes-dryers, and stoves. 31
Studies about CO levels in nursery environments reported an average concentration range from 4.2 to 2786.0 µg/m3.11,18,29,31,45,49,51,66 In Greece, a study investigated two primary schools and one kindergarten in their research. They report that, during winter, one room with kitchen facilities in the kindergarten had an extremely high CO centration of 4.2 ppm (approximately 4900.0 µg/m3). 68 Another study mentioned that schools constructed within one year had significantly higher CO concentrations. As the main heating systems within the schools were electric, higher CO concentrations might be caused by the introduction of outdoor pollutants through open windows during the summer. 29
The health effects of breathing CO include headache, dizziness, vomiting, and nausea. If levels are high enough, people can lose consciousness or die. The CO concentrations in the reviewed studies do not exceed the 6.1 ppm for 24-h exposure (approximately 7015.0 µg/m3) established by WHO guidelines. 65 However, it should be noted that a study on elementary schools concluded when CO levels increased by 1.0 ppm, absenteeism increased by 3.79%. 72
Volatile organic compounds (VOCs)
In studies on the indoor air quality of nurseries, total VOCs (TVOCs) is used to report the indoor organic chemical compounds level. As shown in Figure 8, reported indoor TVOCs ranged from nondetectable to 6440 µg/m3 (with a mean concentration that ranged from 114 to 642.11 µg/m3). Some high TVOC peaks are included in this range, but further studies that may explain those high peaks have not been conducted.10,18,29,30,49,51
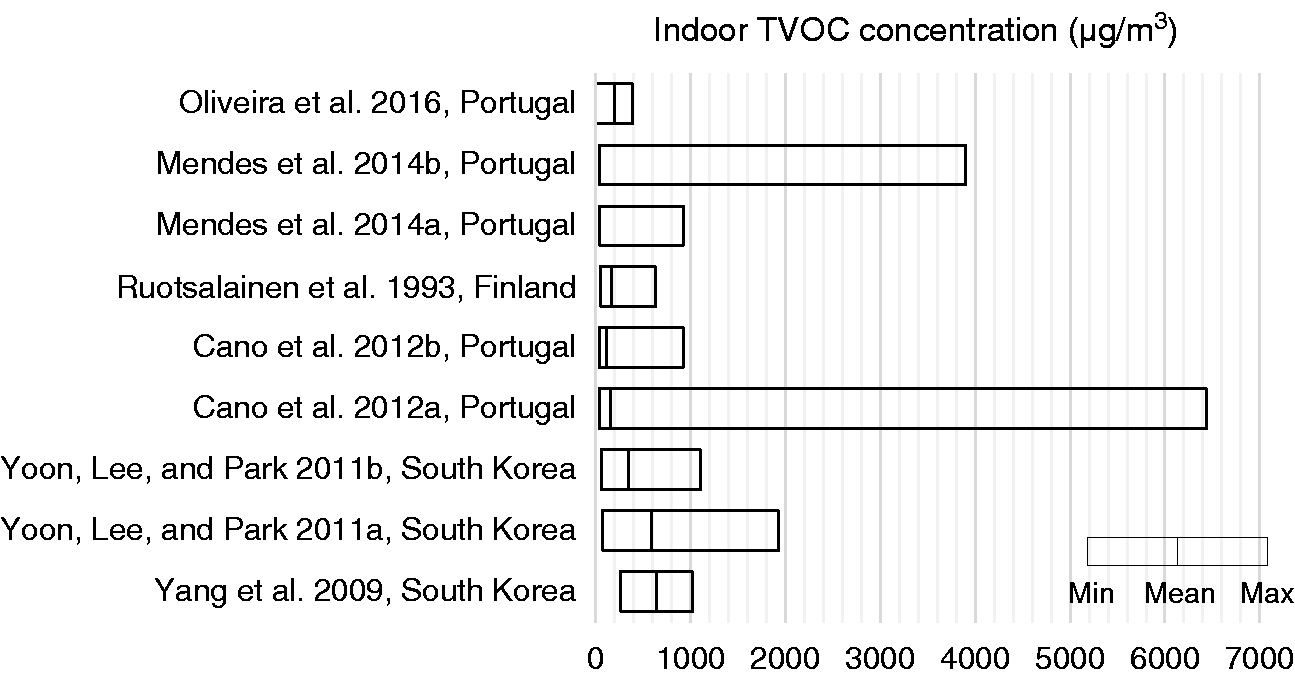
Summary of reported indoor TVOC concentration means and ranges.
Some detailed research on indoor VOCs in nursery environments have been conducted, with BTEX (benzene, toluene, ethylbenzene and xylenes) the most commonly reported compounds. Reported mean concentration of benzene, toluene, ethylbenzene, m,p-xylenes and o-xylenes ranged from 1.4 to 2.93 µg/m3; 2.2 to 7.9 µg/m3; 0.6 to 2.2 µg/m3; 1.6 to 5 µg/m3 and 1.3 to 1.6 µg/m3, respectively.13,30,33,48,58,73 As mentioned by BB101 (2018), 25 trichloroethylene, tetrachloroethylene, naphthalene and d-Limonene are also important chemicals in indoor environments. However, there is limited information about indoor concentrations of those pollutants in nursery environments. One study investigated 7 nurseries and 10 elementary schools in France and reported a mean trichloroethylene concentration of 2.3 µg/m3 with a range of 0–28.3 µg/m3 and mean tetrachloroethylene concentration of 1.1 µg/m3 with a range of 0–11.5 µg/m3. 58 Two studies reported a naphthalene concentration that ranged from 0.3 to 3.1 µg/m3.15,48 Studies about the indoor d-Limonene level in nurseries were not found.
Due to the relative complexity of individuals’ susceptibilities to TVOCs, only indicators of sensory effects are reported. 6 The complex mixture of chemicals in TVOCs can cause eye, nose and throat irritation, shortness of breath, headaches, fatigue, nausea, dizziness and skin problems. Higher concentrations may cause irritation of the lungs, as well as damage to the liver, kidney, or central nervous system. An increased cumulative incidence of lower respiratory symptoms was associated with a 2 µg/m3 change in process-related compounds (OR = 1.08). 74
As products containing formaldehyde such as plywood, particleboard, carpets, and foam insulation are frequently used in indoors, many studies focus on the indoor level of this compound. 75 As shown in Figure 9, mean indoor formaldehyde levels reported are relatively low. However, high concentration peaks were reported in many studies. One study reported those peaks corresponded with poor ventilation and the activities of cleaning and moving furniture (i.e. scraping the floor).34,76 Most studies report high formaldehyde during the hot/non-heating season.31,68,76 It is worth noting that there was a strong correlation between benzene and CO with formaldehyde, which might suggest they are from common sources.31,76
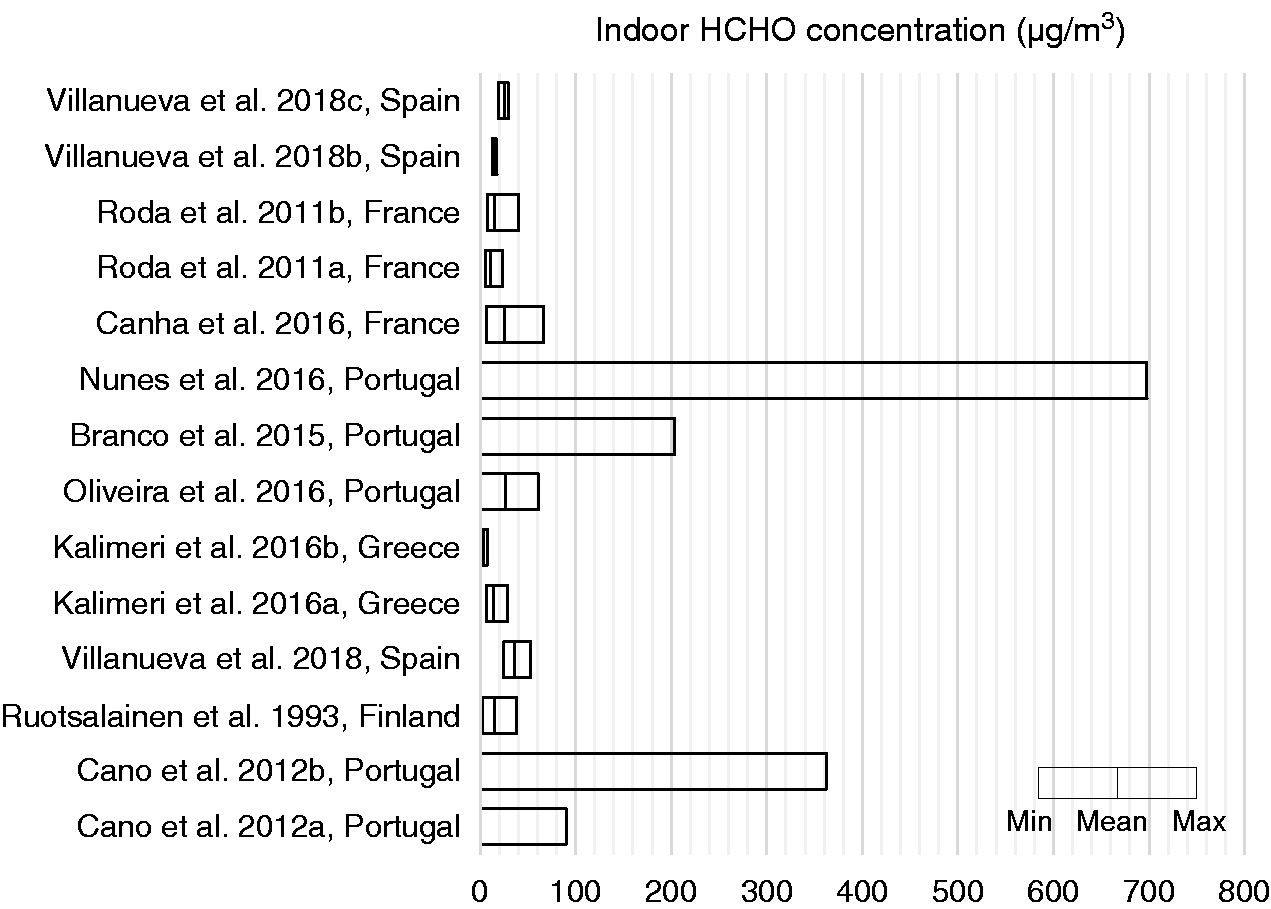
Summary of reported indoor formaldehyde concentration means and ranges.
Allergens
Studies have demonstrated that indoor allergens are common in nurseries, and allergens can be different due to different geographic, climatic, and cultural factors. 77 Most studies in nursery environments reported a low concentration of allergens which did not exceed recommended levels, however low levels of exposure still have a potential to cause allergic reactions. 78
Based on current studies, cat (Fel d 1) and dog (Can f 1) allergens were the dominant allergens found in nurseries. Measured cat allergen (Fel d 1) ranged from undetectable to 1.48 µg/g.79–82 Measured dog allergen (Can f 1) ranged from undetectable to 3.3 µg/g.79,80,82
Dust mite (Der f 1 and Der p 1) and cockroach (Bla g 1 and Bla g 2) allergens were also detected in some studies. Dust mite allergens (Der f 1 and Der p 1) ranged from 0.13 to 5.40 µg/g and 0.05 to 21.8 µg/g.13,18,81,83 In Brazil, a study reported that dust mite allergens were greater than 2 µg/g in 67% of samples collected from day-care centres and preschools, and the highest levels were seen in a preschool bed with a mean Der 1 (Der p 1 + Der f 1) concentration of 6.3 µg/g. 79 Cockroach allergen levels were comparatively low or undetectable in other studies.82,84
The common reservoirs for allergens were carpeting, upholstered furnishings, and clothing. 77 Animals were not allowed in almost all nurseries, so the indoor allergens were mainly from the hair and clothing of children or nursery staff with a pet at home. It should be noted that nursery children are more likely to play on the floor than school children and therefore may be exposed to a higher allergen level. Cleaning was beneficial at reducing indoor allergens as reported by Smedje et al. 25 Studies have associated wheezing, daytime breathlessness, sensitization and asthma with indoor allergens.85,86 A cased-controlled study reported that mite allergens above 10 µg/g of dust was positively associated with wheezing and breathlessness, and that cat allergens above 8 µg/g of dust in home environments was a risk factor for coughing at night. 87
Fungi species
An increase in fungal levels in the indoor environment is associated with mould/water damage in the building structure. Exposure to fungi can cause adverse human health effects from three aspects: immune response, infection by the organism, or toxic-irritant effects from by-products of mould (mycotoxins, MVOCs etc.). 88 The symptoms caused by indoor fungi include respiratory complaints, eye symptoms, and mucous membrane irritation. 89 However, little is known about the relationship between inhalation and response, and there are no unified sampling or analytical methods for mould exposure. 90 Kim et al. 91 reported mean MVOCs concentrations of 423 ng/m3 in eight primary schools, they also mentioned that nocturnal breathlessness and doctor diagnosed asthma were associated with higher indoor concentrations of total MVOC.
Studies in South Korea and Portugal reported that nurseries tend to have higher fungi concentration compared to homes, hospitals, postpartum nurse centres, primary schools and elderly care centres.32,92 The fungi found in the indoor environment were mainly from outdoor sources. Penicillium and Cladosporium were two main fungi genera found in indoor environments.13,28,32,93 Studies investigating total indoor fungi concentrations reported results ranging from 69.2 to 707 CFU/m3, with a higher concentration in summer.13,18,32,33,48,49,92,94
In tropical countries, the indoor fungi concentrations in nurseries tended to be much higher. In Singapore, a study reported that the total fungi concentration was 1424.2 CFU/m3 on dry days and 2930.5 CFU/m3 on rainy days. 95 They also reported that most of the indoor airborne culturable fungi had a size range between 1.1 and 3.3 µm. However, another study reported a dominant size range of 3.3–4.7 µm. 92 Further studies are needed to explain this inconsistency. In addition to outdoor air (the main determinant), occupant density, cleaning, pets, plants, plumbing systems, heating, ventilation, air-conditioning systems, mould and dust resuspension all had an impact on the fungi concentrations indoors.11,28
Bacterial concentrations
Studies about indoor airborne bacteria of nurseries mainly focused on the total bacterial concentrations. It is difficult to determine if indoor bacteria have a specific influence on health, because of a lack of speciation information. However, long exposure time in an environment with high levels of bacteria was shown to have adverse health effects. 36 It is worth noting that nurseries tended to have higher bacterial concentrations compared with other indoor environments that were tested. These high levels may be due to higher occupancy densities, activities of children, and poor ventilation. A study done in Portugal investigated four environments including homes, child day-care centres, primary schools and elderly care centres, they reported the highest bacterial concentration with a median of 3870 CFU/m3 in 50 classrooms of nine child day-care centres, and found that children have at least two times the dose rates of bacteria than older people. 32
Most studies reported significantly higher indoor total bacterial concentration than outdoor, with results that ranged from 1596 to 4630 CFU/m3.18,33,48,49,94 Based on these higher indoor concentrations, the main airborne-bacteria sources are likely from indoors. Human oral and respiratory droplets emitted during coughing, sneezing, talking, breathing, and skin shedding are likely sources. 94 The reported bacteria concentrations were much lower in some locations. Researchers in South Korea studied 43 child care facilities and the mean total suspended bacteria was 418 CFU/m3. 31 Another study in South Korea reported that the mean concentrations of total and respirable airborne bacteria were 931 and 358 CFU/m3 in childcare centres. 92
In addition to studies about total bacteria concentration, a few studies focussed on determining the size distribution and the genera of indoor bacteria in nursery environments. One study reported that Staphylococcus spp., Micrococcus spp., Corynebacterium spp., and Bacillus spp. (mainly gram-positive bacteria), were dominant genera and accounted for over 95% of the total airborne bacteria. 92 In Poland, a study investigated one urban nursery and identified Micrococcus spp. (a gram-positive bacteria) as the dominant indoor bacteria. They also analysed the size distribution of bacterial aerosols and concluded that small particles (<4.7 µm) contributed up to 85% of the total bacterial aerosols in indoor air.
Radon
Radon is a naturally occurring radioactive gas produced from the decay of uranium in soil and rocks. It can penetrate buildings through cracks in the foundation. When inhaled, it remains in the lungs and continuously releases ionizing radiation that damages tissue. 96 A review paper reported that Radon is a human lung carcinogen, and is the second leading cause (after tobacco smoke) of death from lung cancer. 97
Most studies that looked at the radon levels in nursery environments reported acceptable average indoor values, within the 100 Bq/m3 recommended by WHO.98–101 Some studies reported ranges of 100–300 Bq/m3 recommended by ICRP (The International Commission on Radiation Protection).102–106
However, in some high radon areas, studies reported relatively high levels. In Slovenia, a study investigated 10 high radon level kindergartens. The average indoor air radon concentration ranged from 264 to 1700 Bq/m3. 107 Studies have reported high radon levels in other countries (Italy; Slovenia; Bulgaria), with results ranging as following: 50–1047 Bq/m3; 145 to 794 Bq/m3; 104–1761 Bq/m3.108–110 Although in many places, radon is not a frequent contamination, in high-risk locations, radon should be taken into consideration in the indoor environments of nurseries.
IAQ control solutions
There are three main approaches to improving indoor air quality: (1) eliminate sources of indoor air pollution, (2) improve ventilation, and (3) air cleaning. 111 Many studies attempt to track the sources of indoor air pollutants to suggest means of reducing the levels, and ventilation is recognized as an efficient method of diluting pollutants from indoor sources. Nature ventilation and HVAC system could be used to increase the air exchange rate. However, these approaches are not always feasible, leaving air cleaning as an additional strategy to improve indoor air quality.
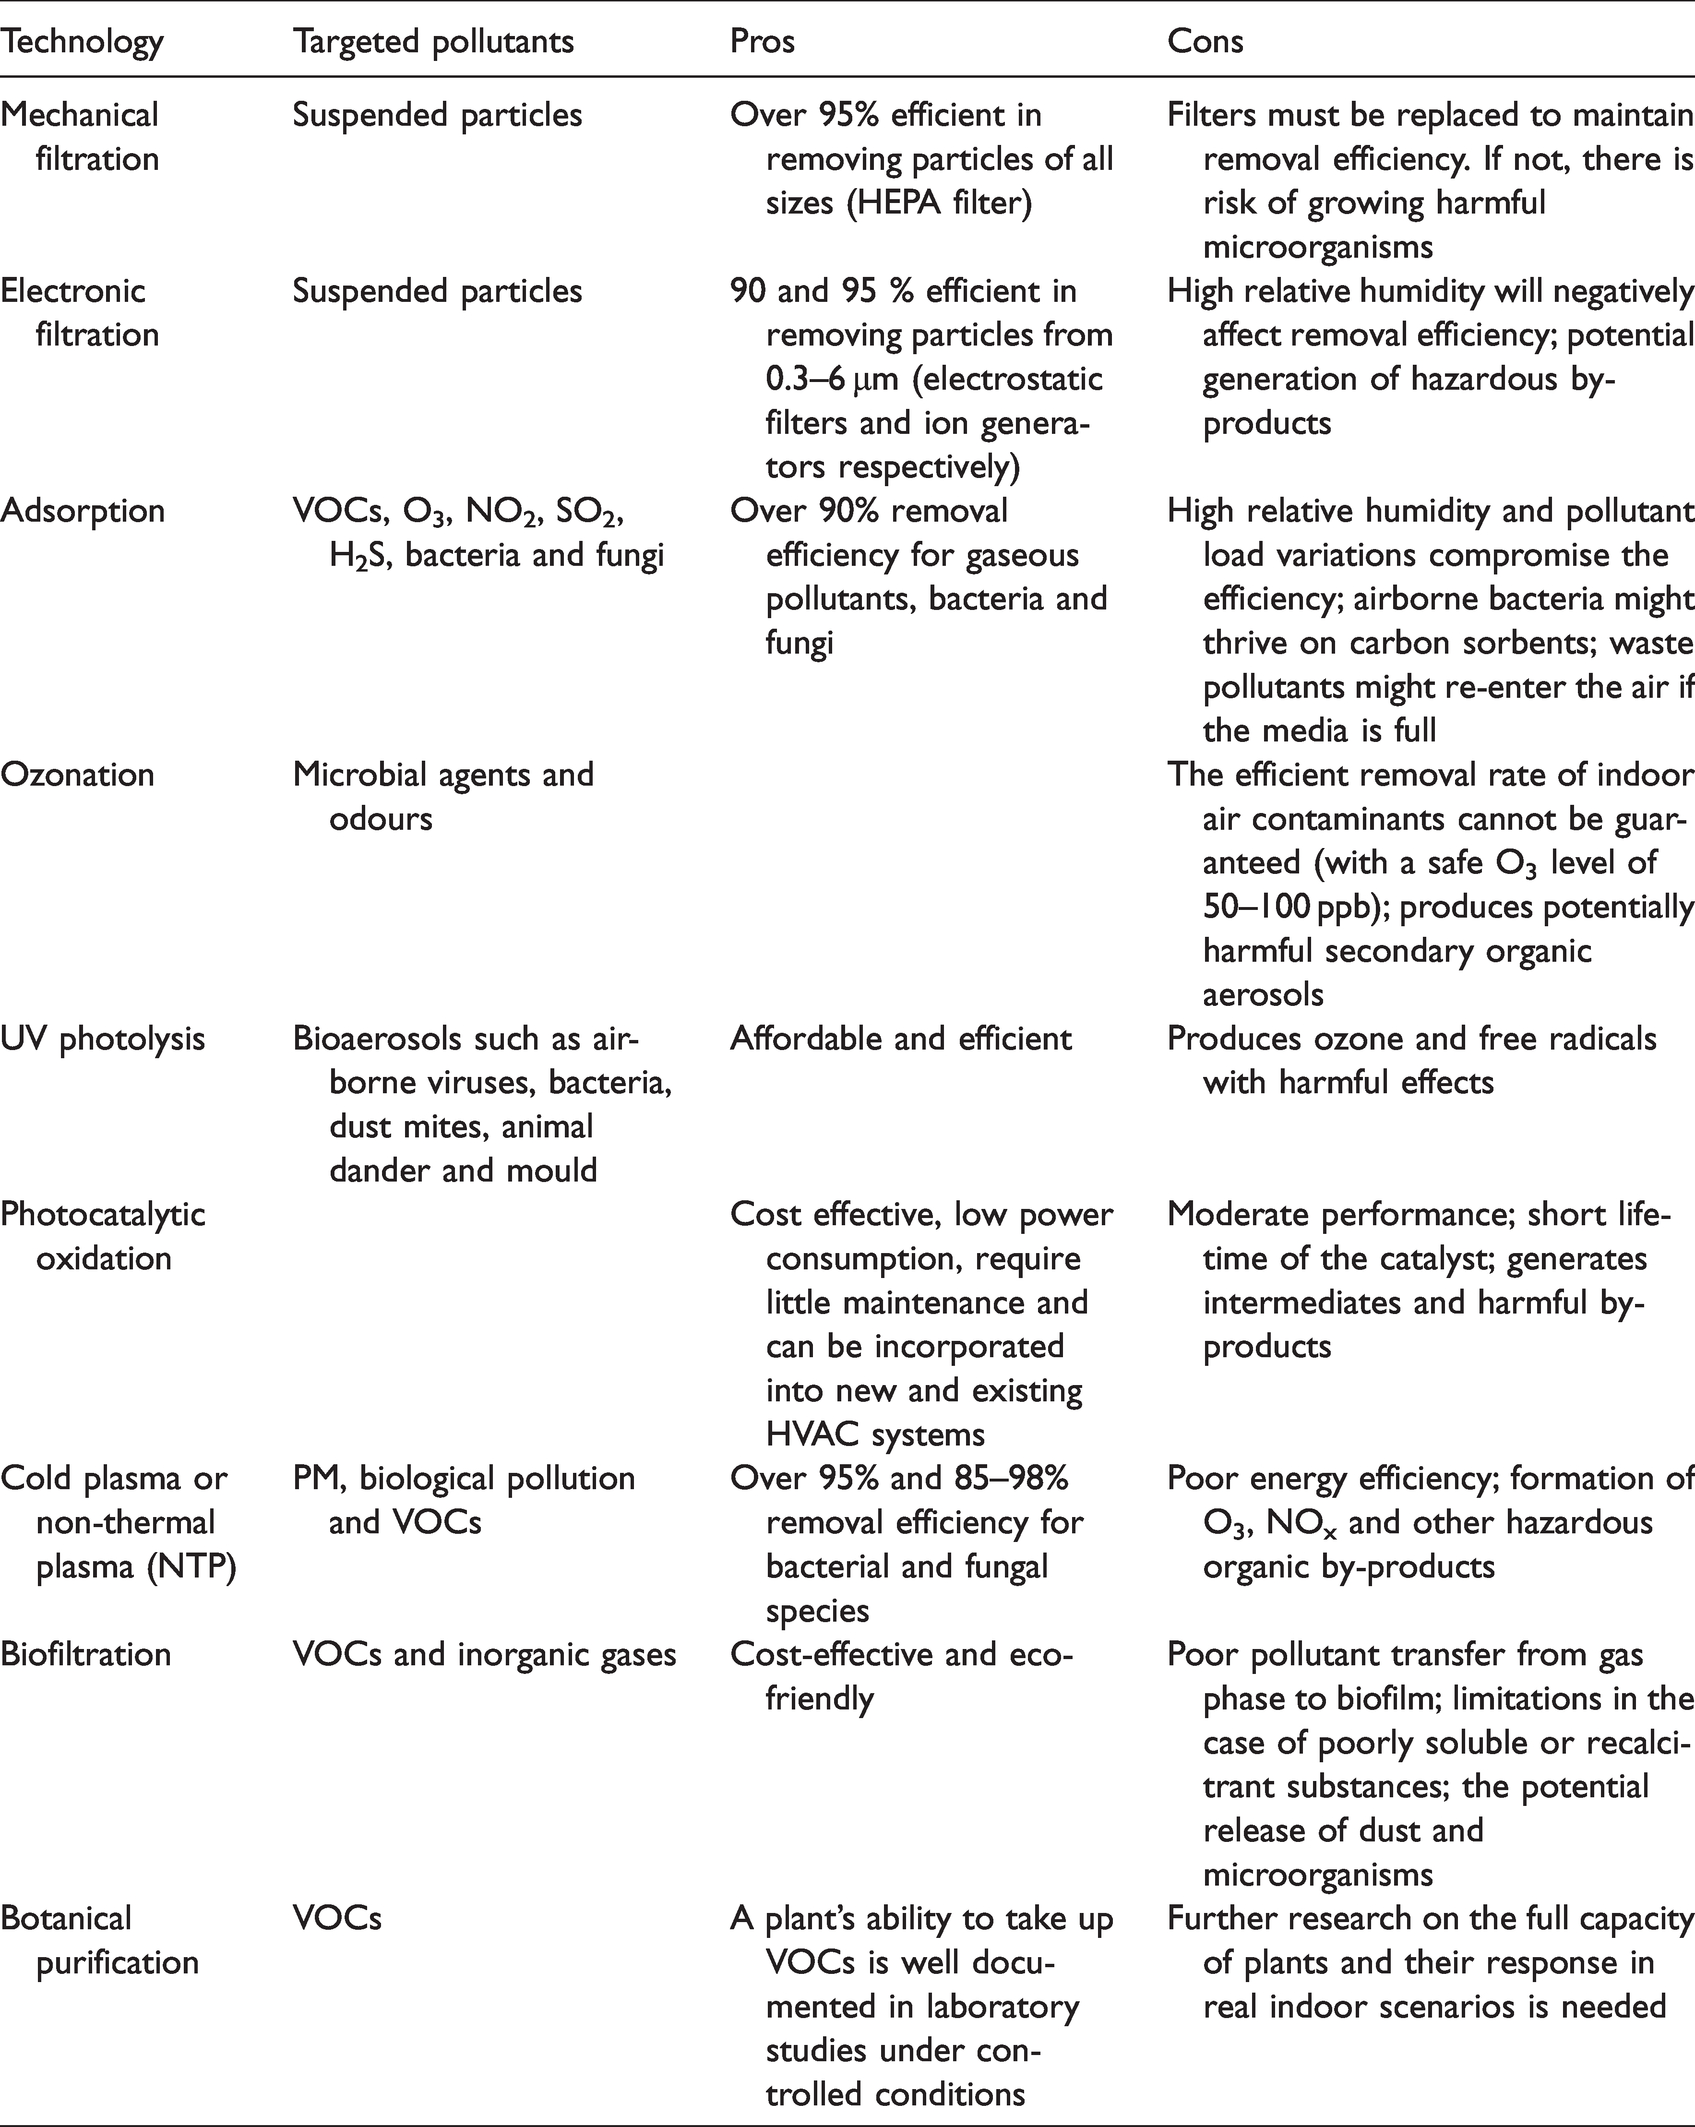
Air purifiers are designed to remove pollutants of different types. Air cleaning can be integrated into the ventilation system to serve multiple spaces within a building, or it can be a portable or fixed (wall, window, or ceiling) device installed in one room or area. Current air cleaning technologies were reviewed by Luengas et al. 112 and Kelly et al. 42 A summary of these technologies, and their pros and cons, can be found in Table 2. The pollutants targeted in air cleaning are PM, VOCs and bioaerosols. Studies report efficient removal rates in many circumstances. 42 However, there are still limitations for each technology, including unwanted and potentially harmful by-products such as O3, and NOX. The literature review by Luengas et al. 112 investigated various types of indoor air treatment and reported that “mechanical filtration is a simple and extensively used technique for removing suspended particles from indoor air”.
Air cleaning technology, targeted pollutant, and assessment.
The use of air cleaner interventions to reduce particulate pollutants at homes has been demonstrated to be effective in improving indoor air quality. In the U.S., a study found that an air cleaner intervention (using HEPA filtration) in homes substantially decreased the indoor PM2.5 levels, from 38 to 24 µg/m3 over a 12 month period. 113 However, research on school and nursery environments are scarce, information about those few studies can be found in Table 3. One study selected 18 classrooms (nine control, nine intervention) in three urban elementary schools, they reported that the PM2.5 levels in the intervention classrooms with HEPA filters were substantially reduced compared with control classrooms, with mean PM2.5 concentrations reduced from 6.2 µg/m3 to 2.4 µg/m3. 114
Studies using air purifiers in nursery environments.
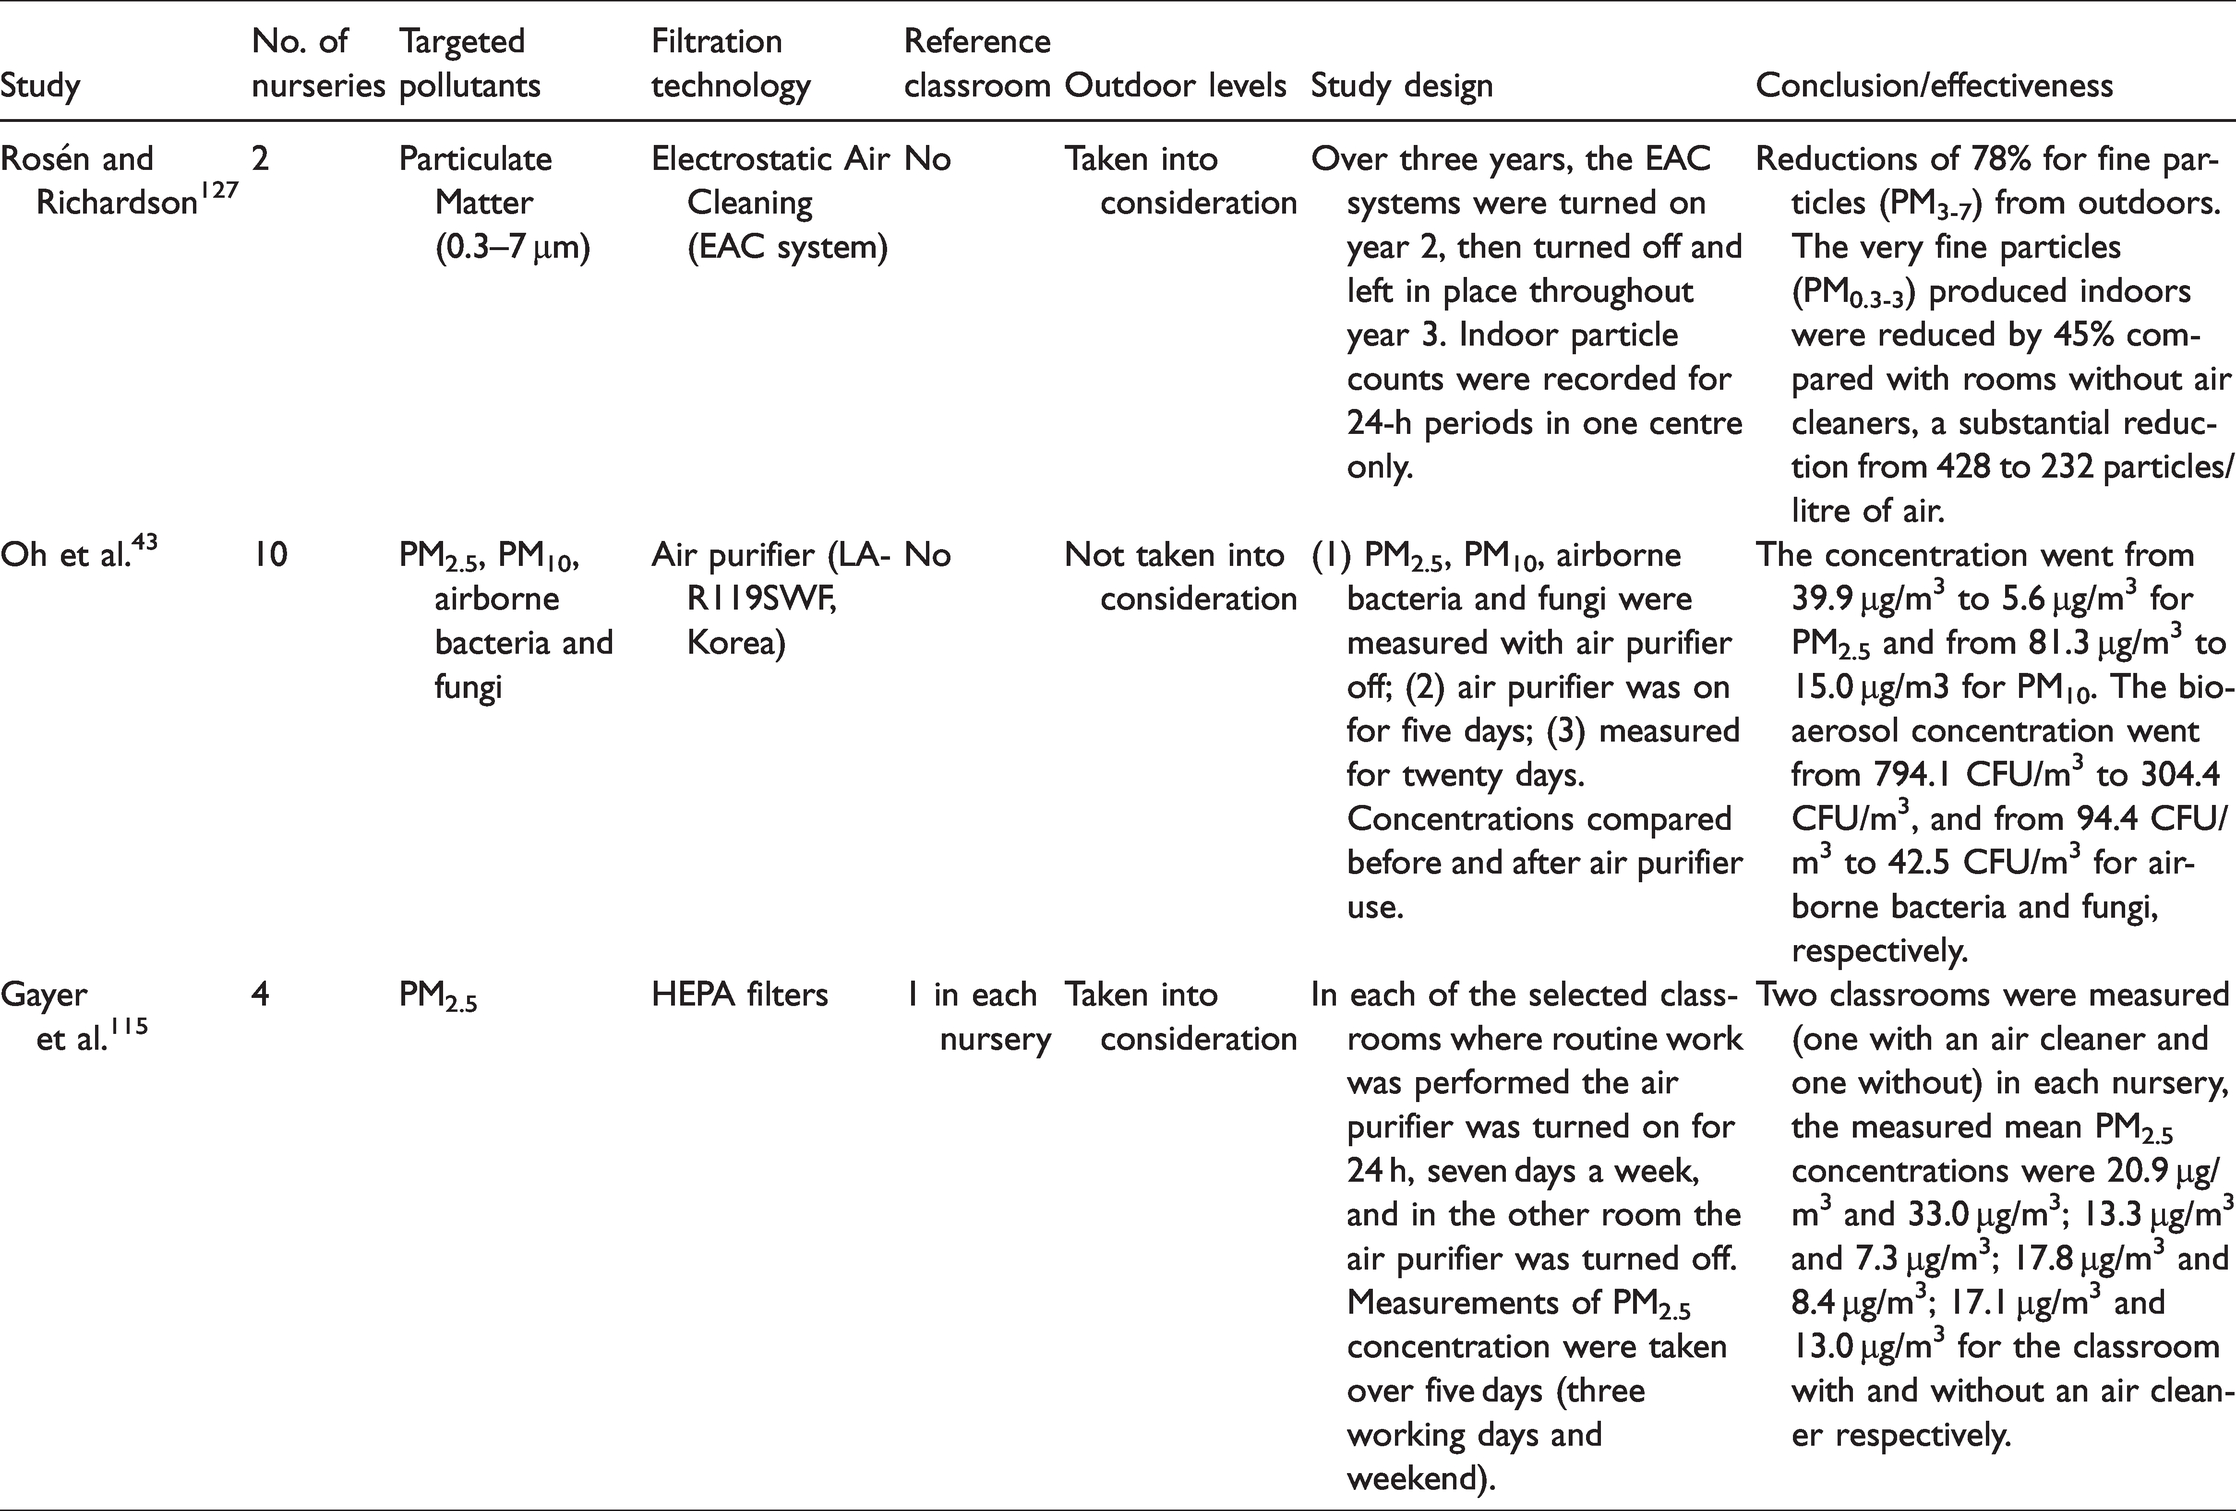
In South Korea, PM10, PM2.5, airborne bacteria, and fungi were measured for five days in ten nurseries before the use of an air purifier system. They then took the same measurements with the system operating. The researchers reported that all pollutants were substantially reduced over the three weeks of air cleaner use. Concentrations dropped from 39.9 µg/m3 to 5.6 µg/m3 for PM2.5, and from 81.3 µg/m3 to 15.0 µg/m3 for PM10. The bio-aerosol concentrations decreased from 794.1 CFU/m3 to 304.4 CFU/m3 and from 94.4 CFU/m3 to 42.5 CFU/m3 for airborne bacteria and fungi, respectively. 43 Another pilot study tested the efficiency of HEPA filtration in four nurseries, they selected two classrooms (one with an air cleaner and one without) in each nursery building. The measured PM2.5 concentrations were, nursery A: 33.0 µg/m3 and 20.9 µg/m3; nursery B: 13.3 µg/m3 and 7.3 µg/m3; nursery C: 17.8 µg/m3 and 8.4 µg/m3; nursery D: 17.1 µg/m3 and 13.0 µg/m3. Outdoor PM2.5 concentrations were 35.5 µg/m3, 18.6 µg/m3, 26.9 µg/m3 and 21.9 µg/m3, respectively. Although air cleaning appears to be a good way to remove indoor air pollutants, the links between it and health improvements need further development. 115
During the COVID-19 pandemic, indoor air quality has become even more critical. Qian et al. 116 investigates 318 outbreaks in China and reported that they all occurred in indoor environments. Respiratory droplets (generally >5 µm) and aerosol droplets (generally < 5 µm) which can carry the SARS-CoV-2 virus (the causative agent for COVID-19) are the primary means of airborne transmission of COVID-19. 117 Respiratory droplets deposit on the ground or surface rapidly, but aerosol droplets may remain suspended in indoor air for one or more hours. Knibbs et al. 118 discussed that increased air exchange rates could decrease the risk of airborne disease transmission through dilution with outdoor air. In addition to, or in lieu of, increased ventilation, air filtration could also be used to help reduce the transmission risk by reducing the concentration of virus-laden droplets. One recent review paper reported that air purifiers with HEPA filters which have a high removal rate for indoor particles larger than 0.3 µm, may be an effective method for reducing viral load in hospital environments. 119 Previous experiments on SARS-CoV-1 (the causative agent of the SARS outbreak) demonstrated the efficacy of HEPA filters in the ‘capture and containment of diseases of similar particle size’. 120 However, as no direct studies have been conducted to validate this assumption, more specific studies on the impact of using air purifiers on indoor viral load of SARS-CoV-2 are needed. 117
Discussion and conclusions
This report focuses on indoor air quality in nursery environments. The overall evidence indicates that the indoor air quality in nurseries is poor which warrants further attention and remediation. Poor indoor air quality might lead to some negative health outcomes which cannot be ignored. Key findings are as follows: Regarding thermal conditions in nurseries, most reported temperature and relative humidity levels lie within the comfort range. However, both lower and higher temperatures occurred due to poor building facilities. HVAC systems should be properly operated and maintained, which may require appropriate training or additional facilities personnel. Also, it was reported that children prefer a lower temperature than adults, and that there is a difference between the preferences of boys and girls. The methods of collecting accurate feedback on the thermal comfort of nursery children, and guidelines based on the needs of nursery children, warrants further development. Ventilation in nurseries appears inadequate based on CO2 concentrations which commonly exceeded recommended standards (mean concentrations: 377–2750 ppm). The main reasons for the high CO2 levels were overcrowding and poor ventilation of the classrooms. Higher ventilation rates, reducing occupant density, and additional mechanical ventilation are recommended. Additionally, sleep time and sleeping-only rooms should be of special consideration because higher CO2 concentrations were often reported during naptime. Particulate matter of both indoor and outdoor origin was reported in studies. PM levels in nurseries often exceeded current guidelines. Air cleaning systems may be useful in improving indoor air quality. High intensity activities of children, as well as activities that produce indoor particles (e.g. cooking, burning candles, clay grinding), should be especially noted. Indoor NO2, O3 and CO levels were often influenced by outdoor levels, and although limited information was reported, some measurements exceeded the current guidelines. Urban nurseries, or nurseries adjacent to high traffic areas, should be aware of these pollutants. When ambient air quality is not ideal (e.g. during peak traffic periods), ventilation from outdoor air without adequate filtration may not be advisable. High peaks in VOC concentration were reported in most studies, the mean concentrations however, were generally low. The effect of short-term exposures to VOCs on children’s health needs further study. Construction materials, interior decoration, cleaning and office products should be carefully selected. Bioaerosols like allergens, fungi species and bacteria were reported in some studies. Schools could be potential important sources of exposures to those contaminants. Low levels of exposure might still cause adverse health outcomes. Well defined thresholds for biological contaminants are needed. In high-risk locations, indoor radon levels should be measured, and appropriate remediation actions taken if standards are exceeded. Air purifiers may be a useful tool to help improve indoor air quality when source control and ventilation alone cannot achieve the necessary levels. The filtration technology should be carefully selected as some air cleaning technologies produce unwanted by-products. Currently, HEPA filters are suggested as one of the best options (especially for reducing PM levels). However, it should be noted that the costs of purchasing and maintaining air purifiers could exacerbate existing health inequalities.
121
Studies reported in this review originate from different countries with different climates. Also, the methods used are different, for instance, monitoring devices, monitoring periods, and monitored parameters varied in different studies. It’s therefore difficult to directly compare results, and we can only gain a general understating about the current IAQ performance in nursery environments. More comprehensive studies with longer minoring campaigns and more considered confounders are needed to help us further understand the issues.
Additionally, more research from developing countries, where approximately 70% of the world’s population lives, is needed. Studies have found that poor indoor air quality in homes in developing countries has a fundamental impact on health.122,123 Issues around access to childcare and early childhood education go beyond the scope of this review. However, it is noteworthy that most of the studies cited in this review were from developed countries, and yet the overall IAQ performance was unacceptable. The authors express concern, therefore, that the air quality in nurseries in developing countries may be even more precarious, especially where outdoor pollution is high and the structural fabric of buildings is poor.
The present review of the literature highlights the poor indoor air quality in nurseries and its potential effect on the health of children. When it comes to nurseries, designers should take ambient pollution levels, ventilation, filtration, decoration and construction materials, and occupant density into consideration to design for healthier indoor environments in the future.
Footnotes
Declaration of conflicting interests
The author(s) declared no potential conflicts of interest with respect to the research, authorship, and/or publication of this article.
Funding
The author(s) disclosed receipt of the following financial support for the research, authorship, and/or publication of this article: EPSRC Impact Acceleration Award: Indoor Air Quality in London’s Nurseries.