
Abstract
To manage the concerns regarding the energy performance gap in buildings, a structured and longitudinal performance assessment of buildings, covering design through to operation, is necessary. Modelling can form an integral part of this process by ensuring that a good practice design stage modelling is followed by an ongoing evaluation of operational stage performance using a robust calibration protocol. In this paper, we demonstrate, via a case study of an office building, how a good practice design stage model can be fine-tuned for operational stage using a new framework that helps validate the causes for deviations of actual performance from design intents. This paper maps the modelling based process of tracking building performance from design to operation, identifying the various types of performance gaps. Further, during the operational stage, the framework provides a systematic way to separate the effect of (i) operating conditions that are driven by the building’s actual function and occupancy as compared with the design assumptions, and (ii) the effect of potential technical issues that cause underperformance. As the identification of issues is based on energy modelling, the process requires use of advanced and well-documented simulation tools. The paper concludes with providing an outline of the software platform requirements needed to generate robust design models and their calibration for operational performance assessments.
Practical application
The paper’s findings are a useful guide for building industry professionals to manage the performance gap with appropriate accuracy through a robust methodology in an easy to use workflow. The methodological framework to analyse building energy performance in-use links best practice design stage modelling guidance with a robust operational stage investigation. It helps designers, contractors, building managers and other stakeholders with an understanding of procedures to follow to undertake an effective measurement and verification exercise.
Keywords
Introduction
The ‘performance gap’ is a commonly used terminology in the context of building energy consumption and is described as the difference between the actual energy use of a building and the energy use envisaged at the design stage.1,2 Depending on the baseline selected, the magnitude of the gap varies considerably. Sometimes use of an incorrect baseline or change in building use patterns can be linked to underperformance and the key factors that contribute to the performance gap can happen at various stages. 3 Beyond the baseline selection, design stages issues causing underperformance include incorrect design targets, specifications, detailing and modelling inaccuracies; shortcomings in construction practices, poor commissioning, lack of building fine-tuning in early stages of post-occupancy are also observed.4–8 Handover and operation stage issues that cause the performance gap include inadequate user training, poor building management and maintenance, occupant behaviour issues and changes of building operating conditions (such as changes in space-time utilisation).1,5,9–11
The aim of this paper is to show a process of using modelling, from design stage to operational stage, as a tool to accurately determine the energy performance gap in the context of measurement and verification (M&V) and to demonstrate a robust M&V protocol to effectively identify root causes of a building’s performance gap using calibrated energy simulation method. To address this, the paper first looks at the background of the performance gap, the use of modelling for design stage estimation and subsequently calibrating those models during M&V. The paper then proposes a framework for modelling practices from design through to operations for managing the performance gap issues. Finally, an application of this framework is provided via a case study building along with the key lessons learnt. Finally, the simulation software requirements to deliver such a framework will be discussed.
Background
Performance calculations, gaps and their causes
To achieve the carbon emissions targets in the UK, 12 various schemes have been implemented in the building sector that focus on improving energy efficiency and quantification of performance at the design stage.UK building regulations (Part L) and asset ratings energy performance certificates (EPCs) focus on design stage quantification of energy performance.
Energy performance calculations carried out to comply with Building Regulations in the UK, commonly referred to as ‘compliance modelling’, are based on default or standardised operating conditions and do not report energy use related to equipment (plug loads). These calculations, developed for performance estimations and comparisons across the building stock, often do not accurately reflect the actual operating conditions of a given building. However, due to the lack of understanding of intentions, limitations and finer details of the calculations used, there is a prevalence of interpreting ‘compliance modelling’ results as the projected energy use once the building is operational. 13 When these ‘compliance modelling’ results are compared to the ‘actual energy use’, the resultant performance gap can be overestimated, leading to a ‘perceived gap’. 14
To address the issue of misinterpretation of compliance calculation results as predicted performance, an industry guidance document was created in the UK, CIBSE TM54. 15 CIBSE TM54 sets out a framework, using dynamic simulation models, to provide estimates of the likely operational energy performance of buildings at the design stage. The outcome of this simulation can also be used as a more appropriate baseline for estimating the magnitude of the energy performance gap; therefore, in contrast with ‘compliance modelling’ this approach is termed as ‘performance modelling’. 3 Actual performance is the measured and monitored performance of a building when it is in a steady mode of operation. The resultant potential gap between the performance modelling results and the actual energy use is a more appropriate quantification of the performance gap.
Energy modelling and calibration process
CIBSE TM54 proposes the best practice guidance for evaluating operational energy use at the design stage by creating more detailed estimates that help identify and explain the factors that affect operational energy use to prospective building users. It allows designers to tailor the operating conditions as per the project brief and the predicted performance accounts for all end uses including equipment loads. CIBSE TM54 is intended to be used during design and construction stages, and the tailoring of the calculations for actual operating conditions creates a more realistic design stage projection of building performance. The following key steps should be followed to develop a good energy simulation model: Acquire the available information about the building and prospective use. Undertake dynamic thermal simulation with accurate modelling factoring in all energy end uses associated with HVAC systems, small power, and any special function within the building using reasonable and context-oriented assumptions. Include all the energy uses in the final reporting of disaggregated building level projections.
One aspect of CIBSE TM54 calculation is that, in practice, its underlying model to predict HVAC loads is typically based on a simplified approach following the UK National Calculation Methodology, owing to the cost and time associated with detailed HVAC system design and simulation. In the context of improvements in performance accuracy, adopting the lessons learned from the NABERS scheme in Australia, 16 the pilot study for the Design for Performance programme 17 highlighted the lack of detailed HVAC system modelling as a reason for the unreliability of the predictions, even with the use of TM54 modelling protocol. By contrast, undertaking un-calibrated simulations for four case study buildings, Ahmad and Culp 18 suggest that, due to the added uncertainties, there are high discrepancies between the simulations and the measured data even with detailed system modelling. Ahmad and Culp concluded that noticeable improvements were not obtained with the added effort over the simpler modelling effort.
CIBSE TM54 protocol is developed primarily to deal with design stage issues. Problems during construction and operation stages, such as technical issues arising from poor workmanship, commissioning, or maintenance, and changes in building functions or occupancy trends over time, can lead to underperformance but are not necessarily reflected in the model created using CIBSE TM54. To deliver a model that can accurately predict the actual performance once a building is in the operational stage, a calibrated simulation model can be developed. Calibration is a process of fine- tuning the input parameters of a baseline model (generally a performance model) so that its results are reasonably close to the actual performance and satisfy a set of calibration criteria.
CIBSE TM6319 is a new technical memorandum that provides a framework for calibrating simulation models to help understand the underlying performance issues. CIBSE TM63 shows how calibration can give insights into the operational inefficiencies and pinpoint underlying causes for the performance gap. By revisiting various design assumptions in a calibrated model, detailed analysis and quantification of the impact of individual causes of the performance gap can be assessed.
In a typical calibration process, two data sets are required: Simulation input data which is often based on design values and the assumptions for operating conditions. This is used to calculate the predicted performance. Actual building specifications, actual operating conditions and metered data for energy and other environmental parameters from the monitoring of the building.
The first dataset can be used to establish an initial baseline for performance, while the second dataset will inform the calibration process. The most influential parameters affecting the concerned outputs can be selected for fine-tuning and are modified until there is a match between the simulation output and metered data. In order to develop calibrated models for diagnosing performance gap issues, a procedural and replicable step-by-step, evidence-based calibration methodology should be followed.20–22 A calibration workflow, as described in CIBSE TM63 is shown in Figure 1 and explained in detail in the text below.
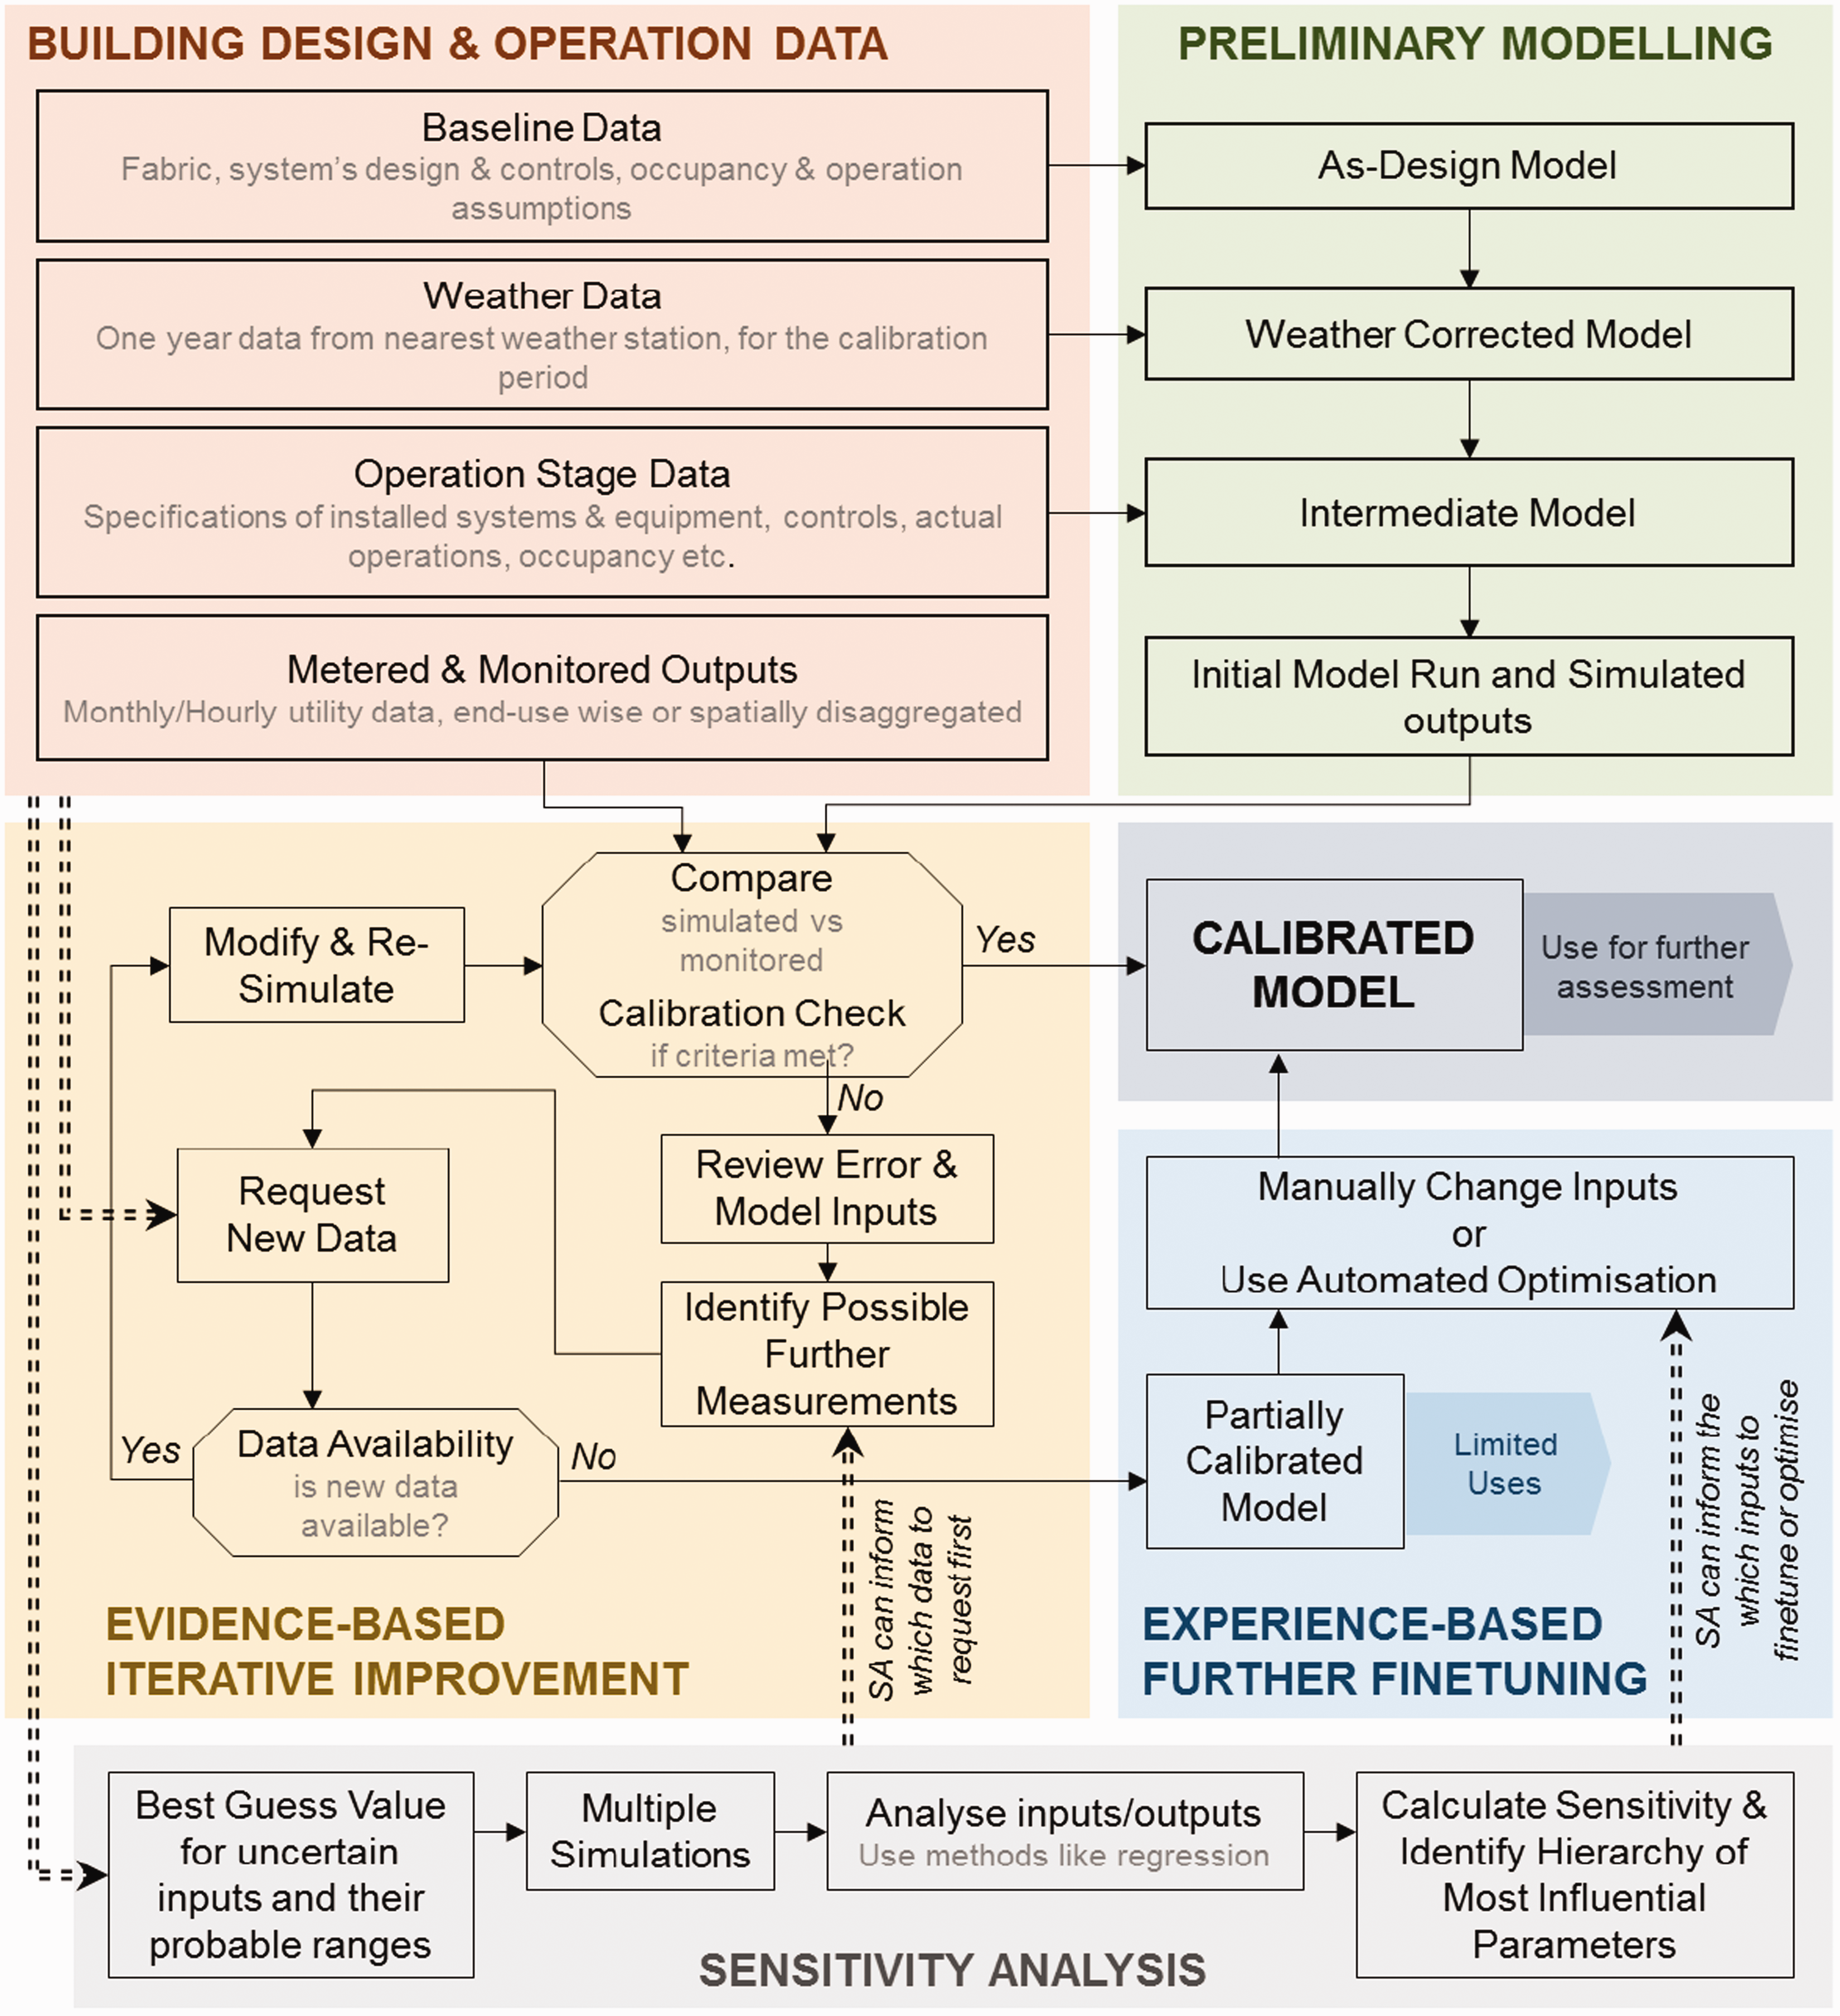
Model calibration workflow.
In the first step, an as-designed model is used (or created for an existing building) which reflects all the design stage input parameter values. This model can be developed using CIBSE TM54 or other equivalent protocols. In the second step, this as-designed model is modified using real weather data and readily accessible information of already identified changes to the building and its operations (collected from the building during audits, post occupancy evaluations, monitoring, metering etc.) to create an intermediate model. In the third step, simulation outputs of the intermediate model are compared against the metered energy use and the calibration criteria (e.g., ASHRAE Guideline 14 criteria 23 ) If the criteria are not met, in the fourth step, iterative improvements are done by obtaining new operational data from the building until the criteria are met or no further data is available. If no more data is available, then only a ‘partially-calibrated’ model is achievable based on the empirical evidence. To meet the calibration criteria, further fine-tuning of unmeasured inputs has to be based on experience, carried out by either user estimation or an automated optimisation processes within user defined parameter values. Uncertainty analysis (UA) can help to identify the impact of input uncertainty on the outputs and subsequent sensitivity analysis (SA) of simulation outputs can help to identify the most influential simulation input variables. In the calibration process, SA can be used to determine the sequence of input data for iterative changes either at evidence-based or experience- based stages of fine-tuning.
M&V protocols
Measurement and Verification (M&V) is the process in which planning, measuring, collecting, and analysing of data is undertaken for verifying and reporting a building’s performance. In the context of using calibrated energy simulation in M&V, protocols such as ASHRAE Guideline 1423 and IPMVP 24 provide guidance on model validation approaches. These approaches generally focus on quantitative statistical requirements and goodness of fit of the simulation results with the actual simulation. They do not aim to provide a framework on how to create a reasonable simulation model or on how to calibrate it or on how to verify the performance issues.
In addition to potential discrepancies between actual operating conditions and design assumptions, during the building operation stage, performance evaluations often uncover several technical issues with building services and operations that are causes of the performance gap. However, in the absence of a robust M&V framework, it is not certain that the technical issues uncovered in a building reflect all or most of the key causes of the performance gap. It is likely that one or two key issues are identified during investigations, whilst other potential issues are not uncovered. Addressing these, the energy performance M&V framework presented in CIBSE TM63 identifies and separates performance issues into two key categories: Deviations of operating conditions from design assumptions that are primarily driven by the building’s function and its actual occupancy, Technical issues in the building systems and their operations and maintenance that cause a performance gap between design intent and actual operation.
Method
In this paper a structured framework is presented to manage energy performance in buildings from design to operation using modelling and calibration, through a case study example. The method shows how a best practice design stage model, completed in accordance with CIBSE TM54 protocol, can be linked to a systematic assessment of building performance in-use in accordance with CIBSE TM63. The two-stage framework firstly shows the development of the design stage model (CIBSE TM54 compliant) and then in the second stage the same model is calibrated (CIBSE TM63 compliant) to analyse the longitudinal performance issues. While in the first stage, the baseline modelling principles and energy end uses to be tracked are established, in the second stage the new modelling M&V framework is followed to define the energy performance gap with reasonable accuracy (Figure 2). The new framework is based on the following principles:
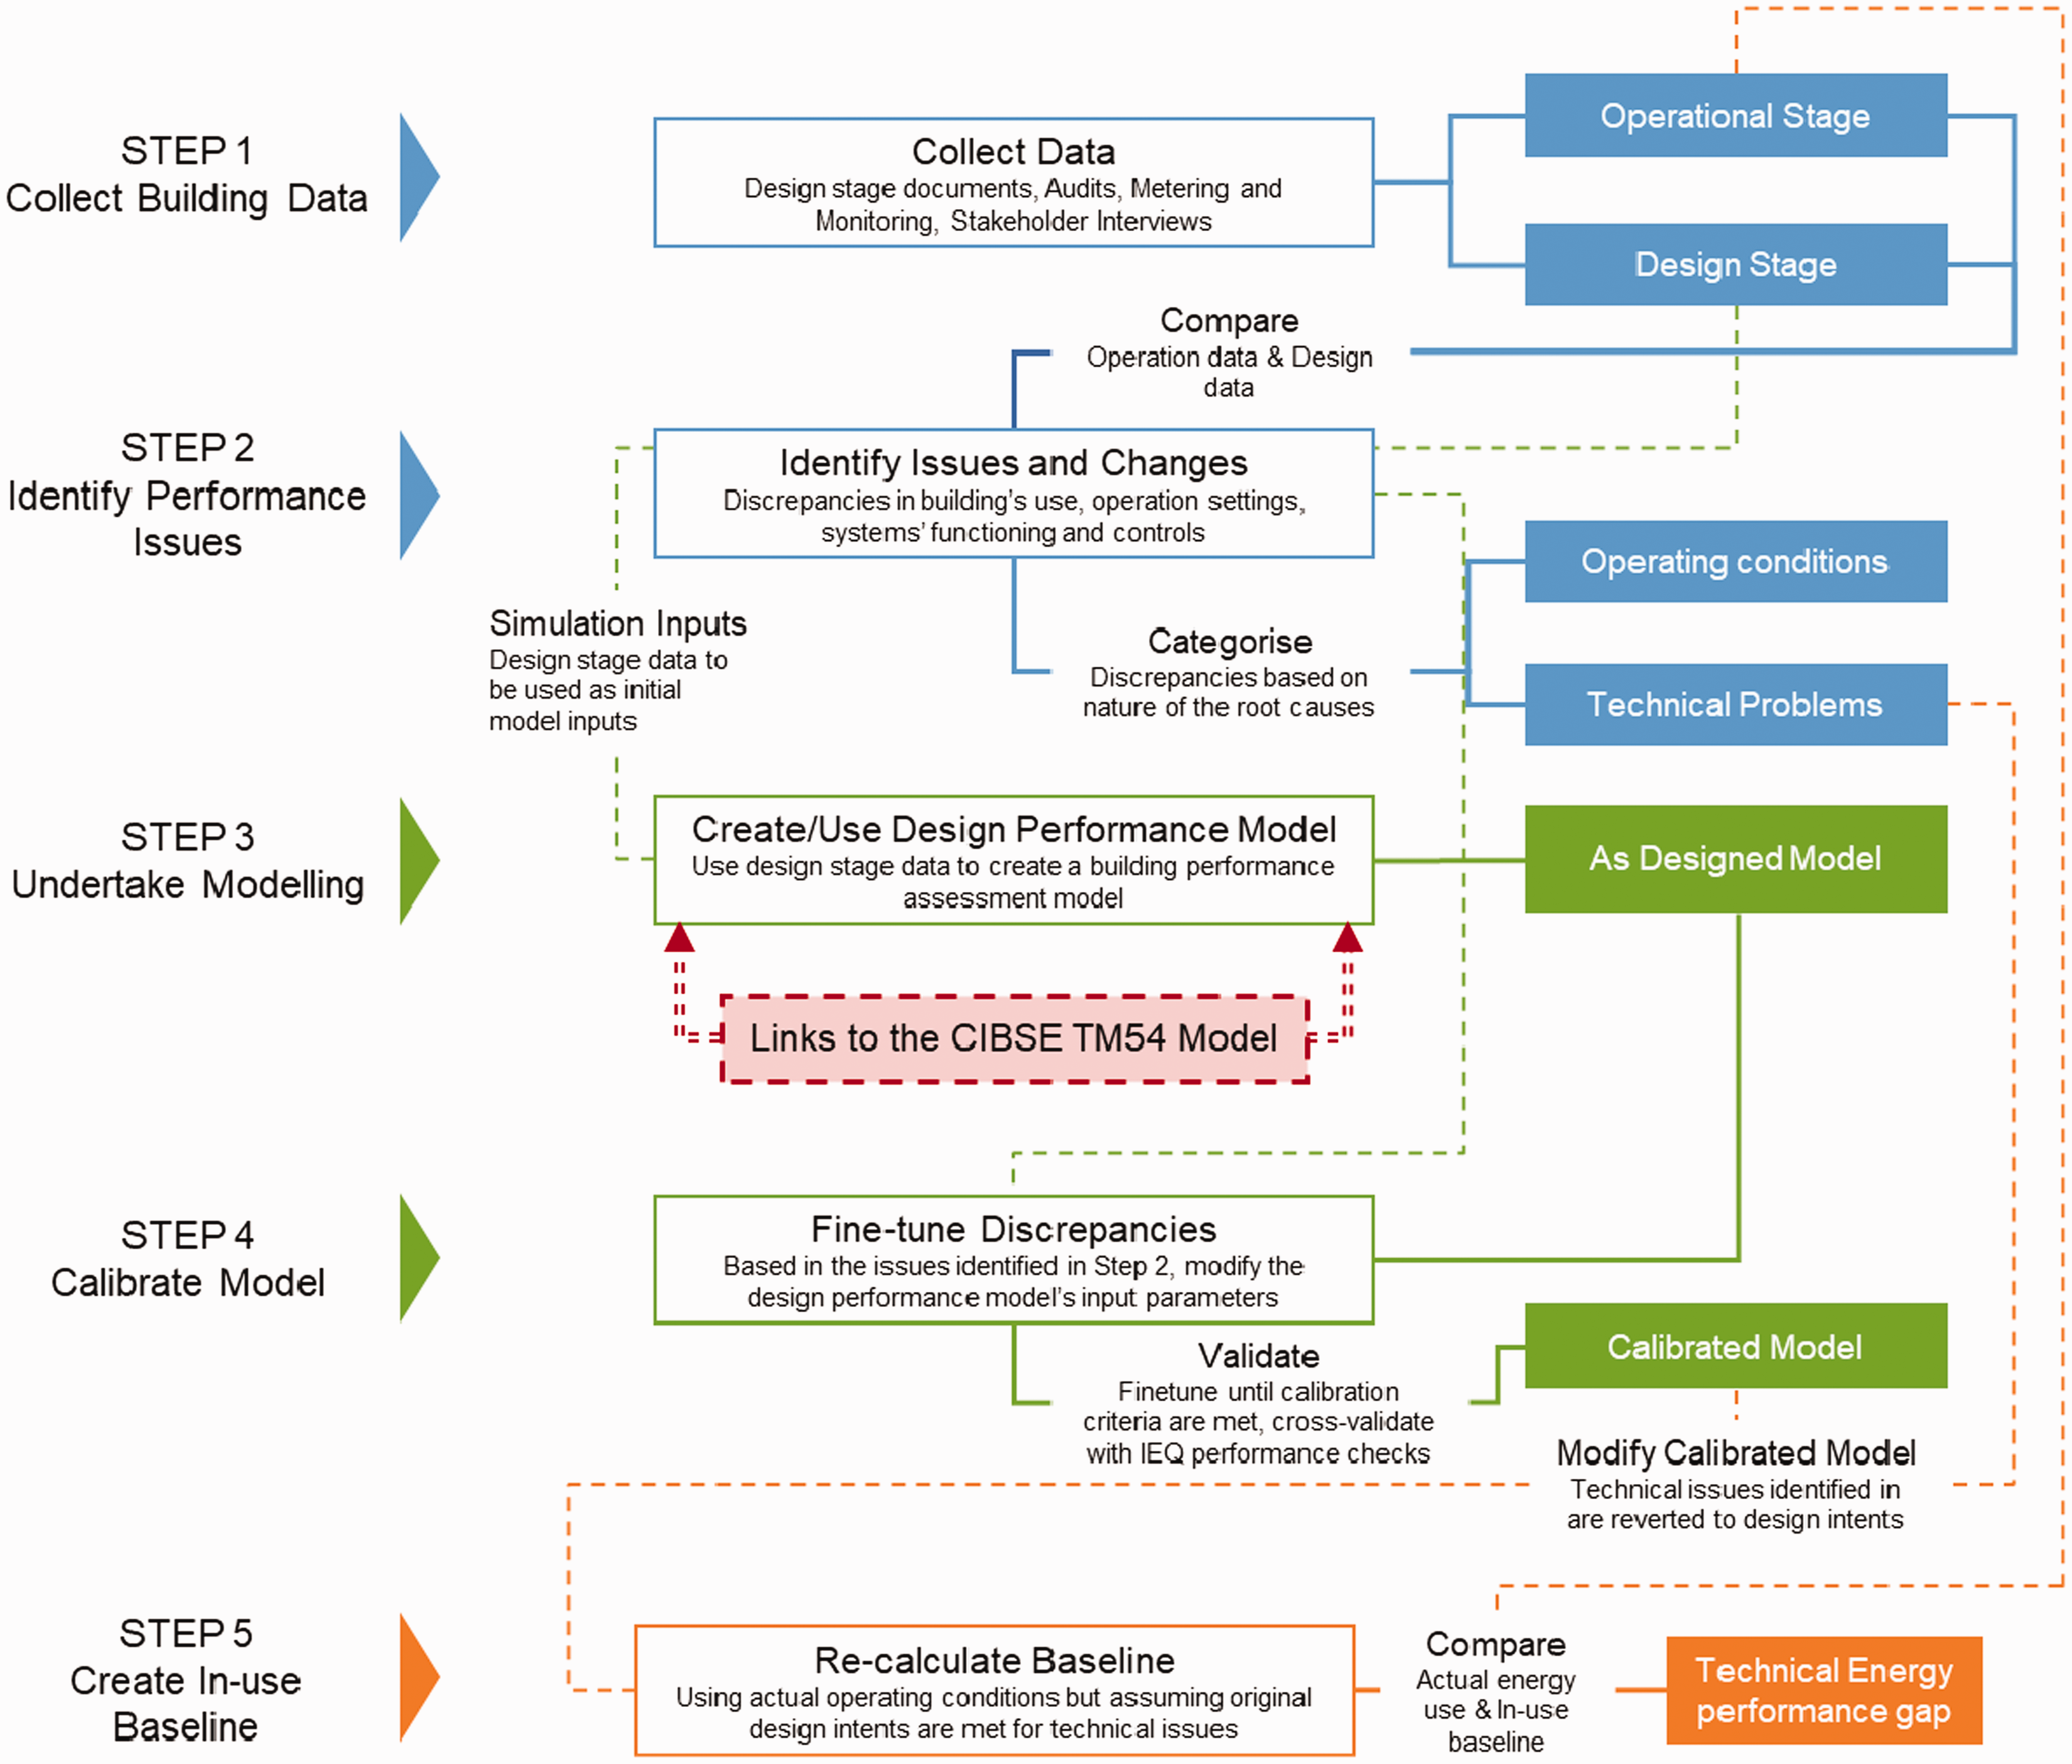
Calibration-based M&V framework to identify performance issues (adapted from CIBSE TM63) and its links to CIBSE TM54 design stage model.
Use of a systematic method of data collection to identify various discrepancies.
Use of a simulation model calibrated with actual operation to ensure that the uncovered issues can explain the actual performance with reasonable accuracy.
Through the calibration process, two sets of simulation model input data relating to the discrepancies in building performance should be identified and separated:
3.1. Actual operating conditions required for the building to perform its functions.
3.2. Technical issues related to construction, systems, controls, etc. 4. Once the computer model of the building is calibrated, a new performance baseline can be defined that reflects actual operating conditions and requirements (adjusted for 3.1 above), but assumes that the original design intents are met (technical issues identified in 3.2 above are corrected in the model and reverted to their design intents). 5. The technical energy performance gap can be defined as the difference between the measured value and the new baseline defined in point 4. This performance gap needs to be addressed to improve the building’s operational performance.
Case study application
The four-storey case study office building (∼6500 m2) is located in South-West England. The building, completed in 2014, has open plan offices and meeting rooms and is designed to high energy efficiency standards.
Step 1: Design vs actual performance
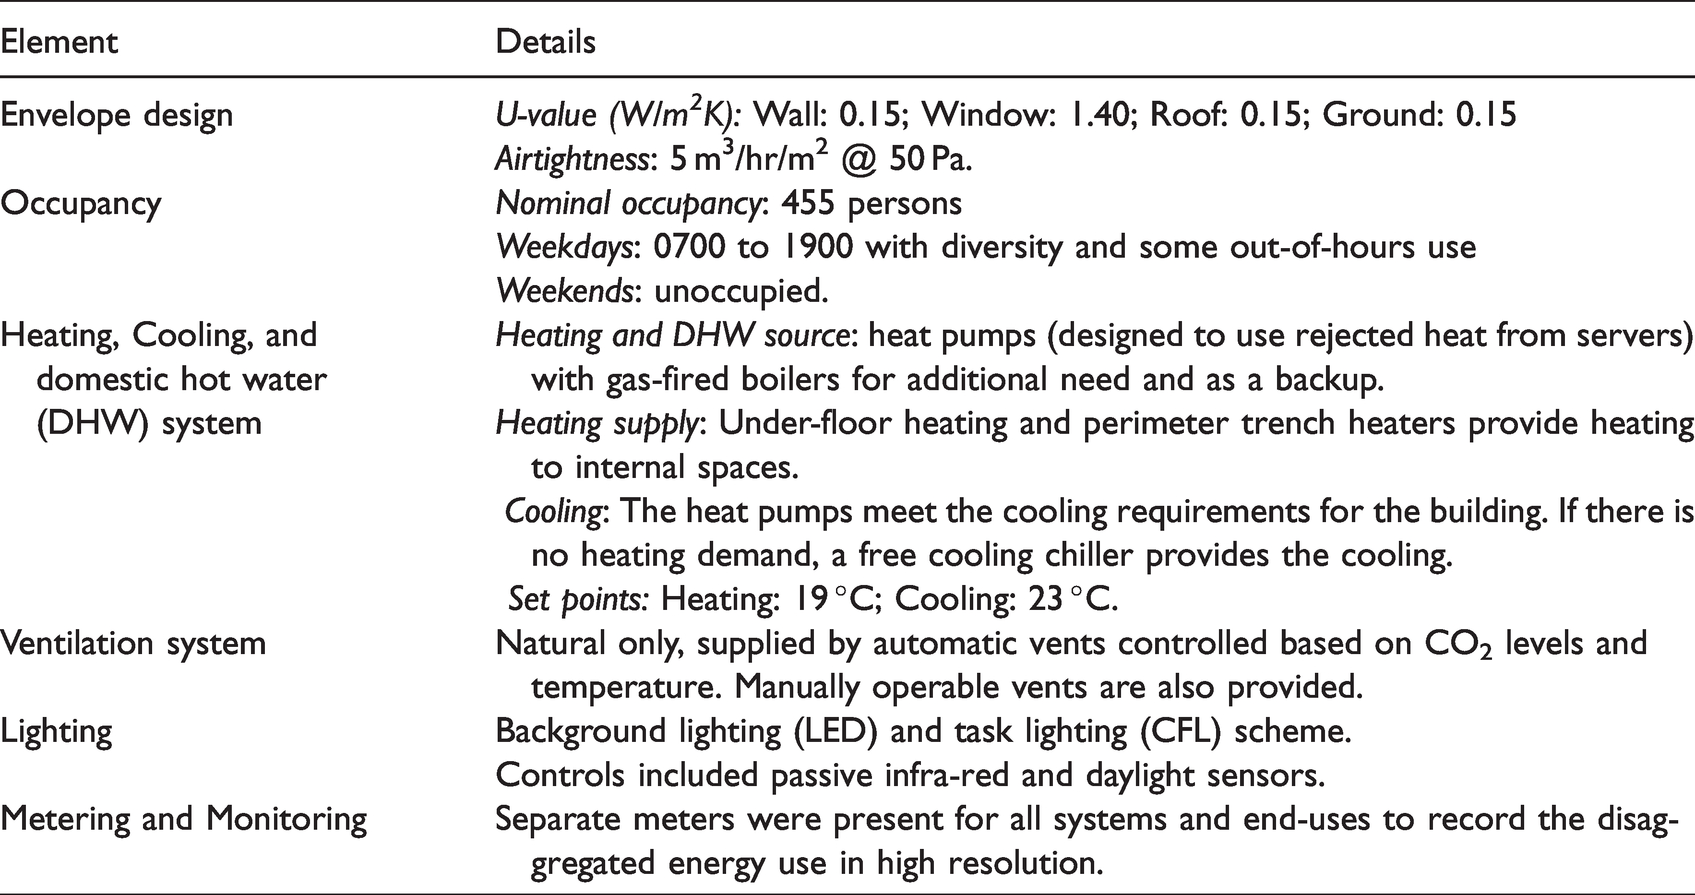
Details about the building fabric, occupancy and technical/operational parameters of building services were collected for the design stage through design documentation (Table 1) and for the operational stage data through regular site-visits and building monitoring. The actual performance, when compared to design data (Figure 3), shows that the building was not operating at design intended levels.
Case study building’s design stage details.
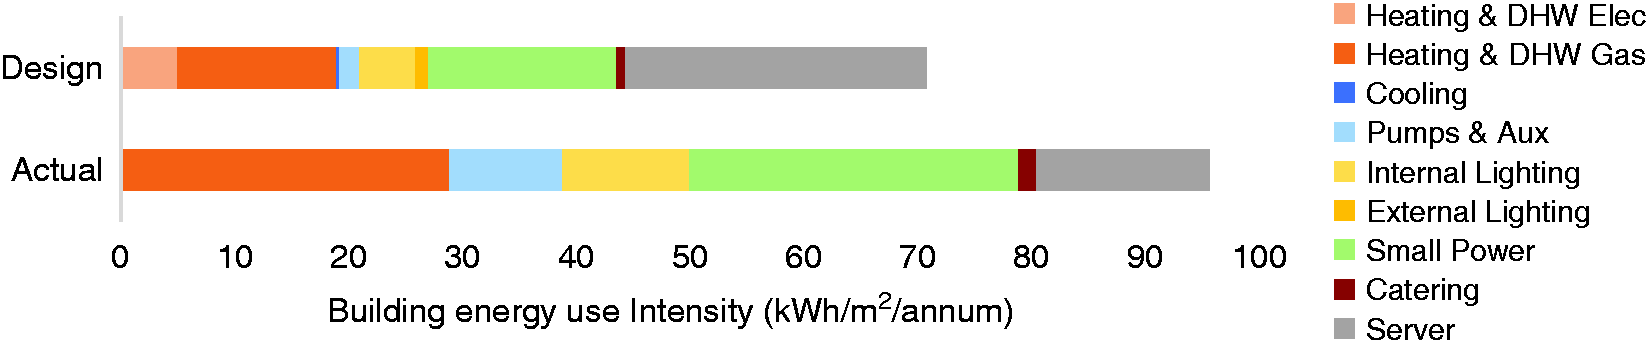
Comparison of building design and actual energy performance.
Step 2: Performance gap issues
To investigate the performance gap causes, first the existing documentation was analysed and then specific potential reasons for deviations from design assumptions were catalogued through energy audits, analysing the metered data, and semi- structured interviews with facility managers and occupants. The performance gap issues identified were categorised into issues related to operating conditions and technical issues.
The main changes in operating conditions identified were: The total occupancy of the building was about 25-30% higher and there were extended operation hours along with some weekend use of the building. To manage the occupant comfort needs, heating set-point was maintained at about 21–22°C, higher than the design intent of 19°C. Departmental structure of the occupant organisation limited the scope of hot- desking and use of ‘kill-switches’ to shut off systems in unoccupied areas of the building during out-of-hours use (a design measure).
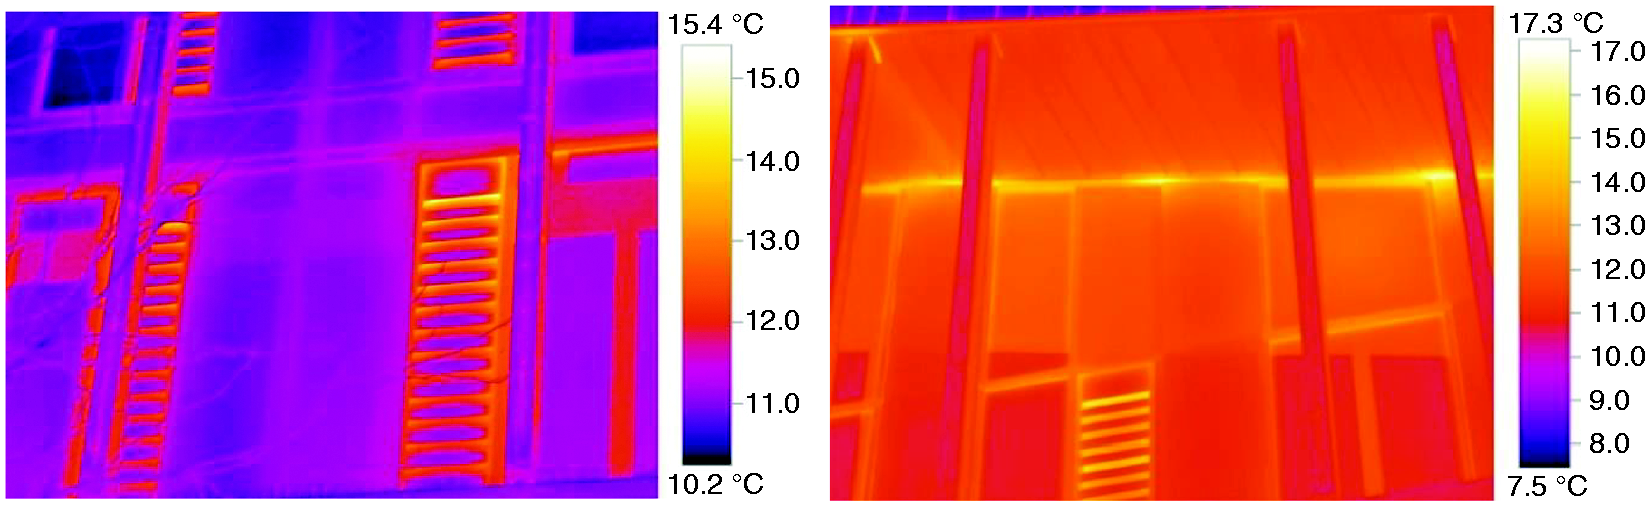
The main technical issues identified in the building were: Technical issues with heat exchangers in the low temperature hot water system at the interface between heat pumps and gas-fired boilers. The high flow temperatures required to meet the heating demand led the heat pumps to malfunction. Subsequently, the backup gas-fired boilers were effectively used as the main heating system. Heat losses due to thermal bridging around the vents and construction junctions (see Figure 4) was higher than design expectation, leading to increased heating demand. Heat loss from the doors installed behind natural ventilation vents in a closed position (left), and at construction junctions (right). Heating terminals sizing was not consistent with the low temperature heating flow required for energy efficient operation of the heating system. Server loads were overestimated in design calculations. This had an adverse impact on heating efficiency as there was significantly less free heat available for the low temperature hot water system. Some of the ventilation control sensors malfunctioned and required a subsequent modification to the control strategy to overcome the system shortcomings. This had a knock-on effect on building heat loss and heat loads during the heating season. Parasitic loads, higher than design assumptions, were identified when the building was unoccupied.
Step 3 and step 4: Energy modelling and model calibration
Using the workflow defined in Figure 1, a streamlined software toolkit was used which revolves around the ‘DesignBuilder’ software, an interface for EnergyPlus, along with spreadsheets to calibrate the CIBSE TM54 as-designed model. The simulation results of the baseline model and the subsequent iterations were created in DesignBuilder and compared against the actual metered data, processed through spreadsheets, in the ‘DesignBuilder Results Viewer’ for compliance with ASHRAE Guideline 14 criteria. During the calibration process, sensitivity analysis and uncertainty analysis tools in DesignBuilder were also used to identify the most likely performance deviation factors and to check if their variation was able to account for the total performance gap. Actual weather as per station and satellite measurements for relevant location for the calibration period was obtained from DesignBuilder Climate Analytics tool and was used in the simulations. Figure 5 shows the calibrated results meeting the ASHRAE Guideline 14 monthly criteria (i.e., CV(RMSE) 1 < 15% and NMBE 2 < ±5%), which validate that the performance issues identified were able to account for most of the gap in building energy use. Further validation of the calibrated model was done against temperature data, as a dependent variable. Figure 6 shows that the simulated and monitored trends of zone temperatures closely follow the actual measurements, except during the weekends where there is a dip in simulated temperatures. However, these do return close to the measured values over the longer period. Changes made in the energy model to calibrate it were as per the issues listed in ‘Step 2: Performance gap issues’ section.
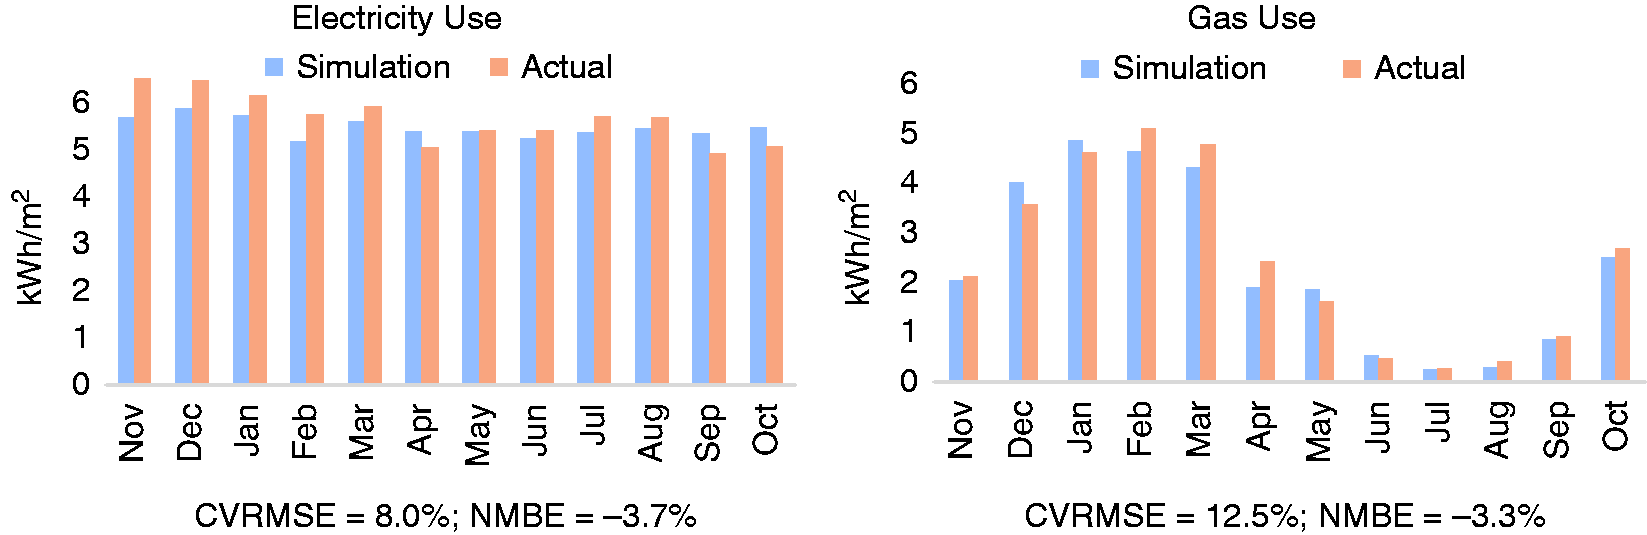
Calibrated electricity and gas use.1Coefficient of Variation of the Root Mean Square Error.2Normalised Mean Bias Error.
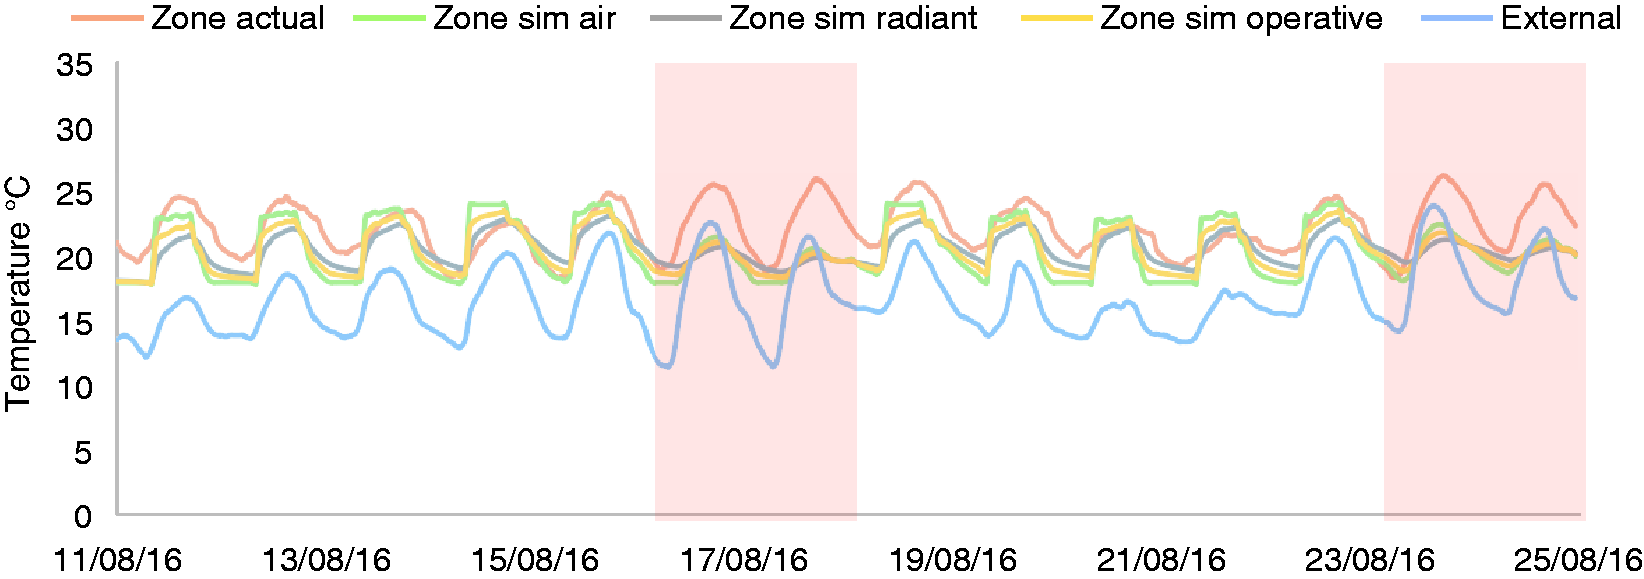
Hourly simulated and measured temperatures for typical days in a representative zone.
More fine-tuning of the calibrated model could be done at higher resolution (e.g. hourly resolution) to match the residual deviations. But in the context of monthly calibration method for assessing causes of the performance gap, the current accuracy is deemed sufficient in accordance with ASHRAE Guideline 14 and the IPMVP building performance calibration protocols.
Step 5: Operational baseline and the associated performance gap
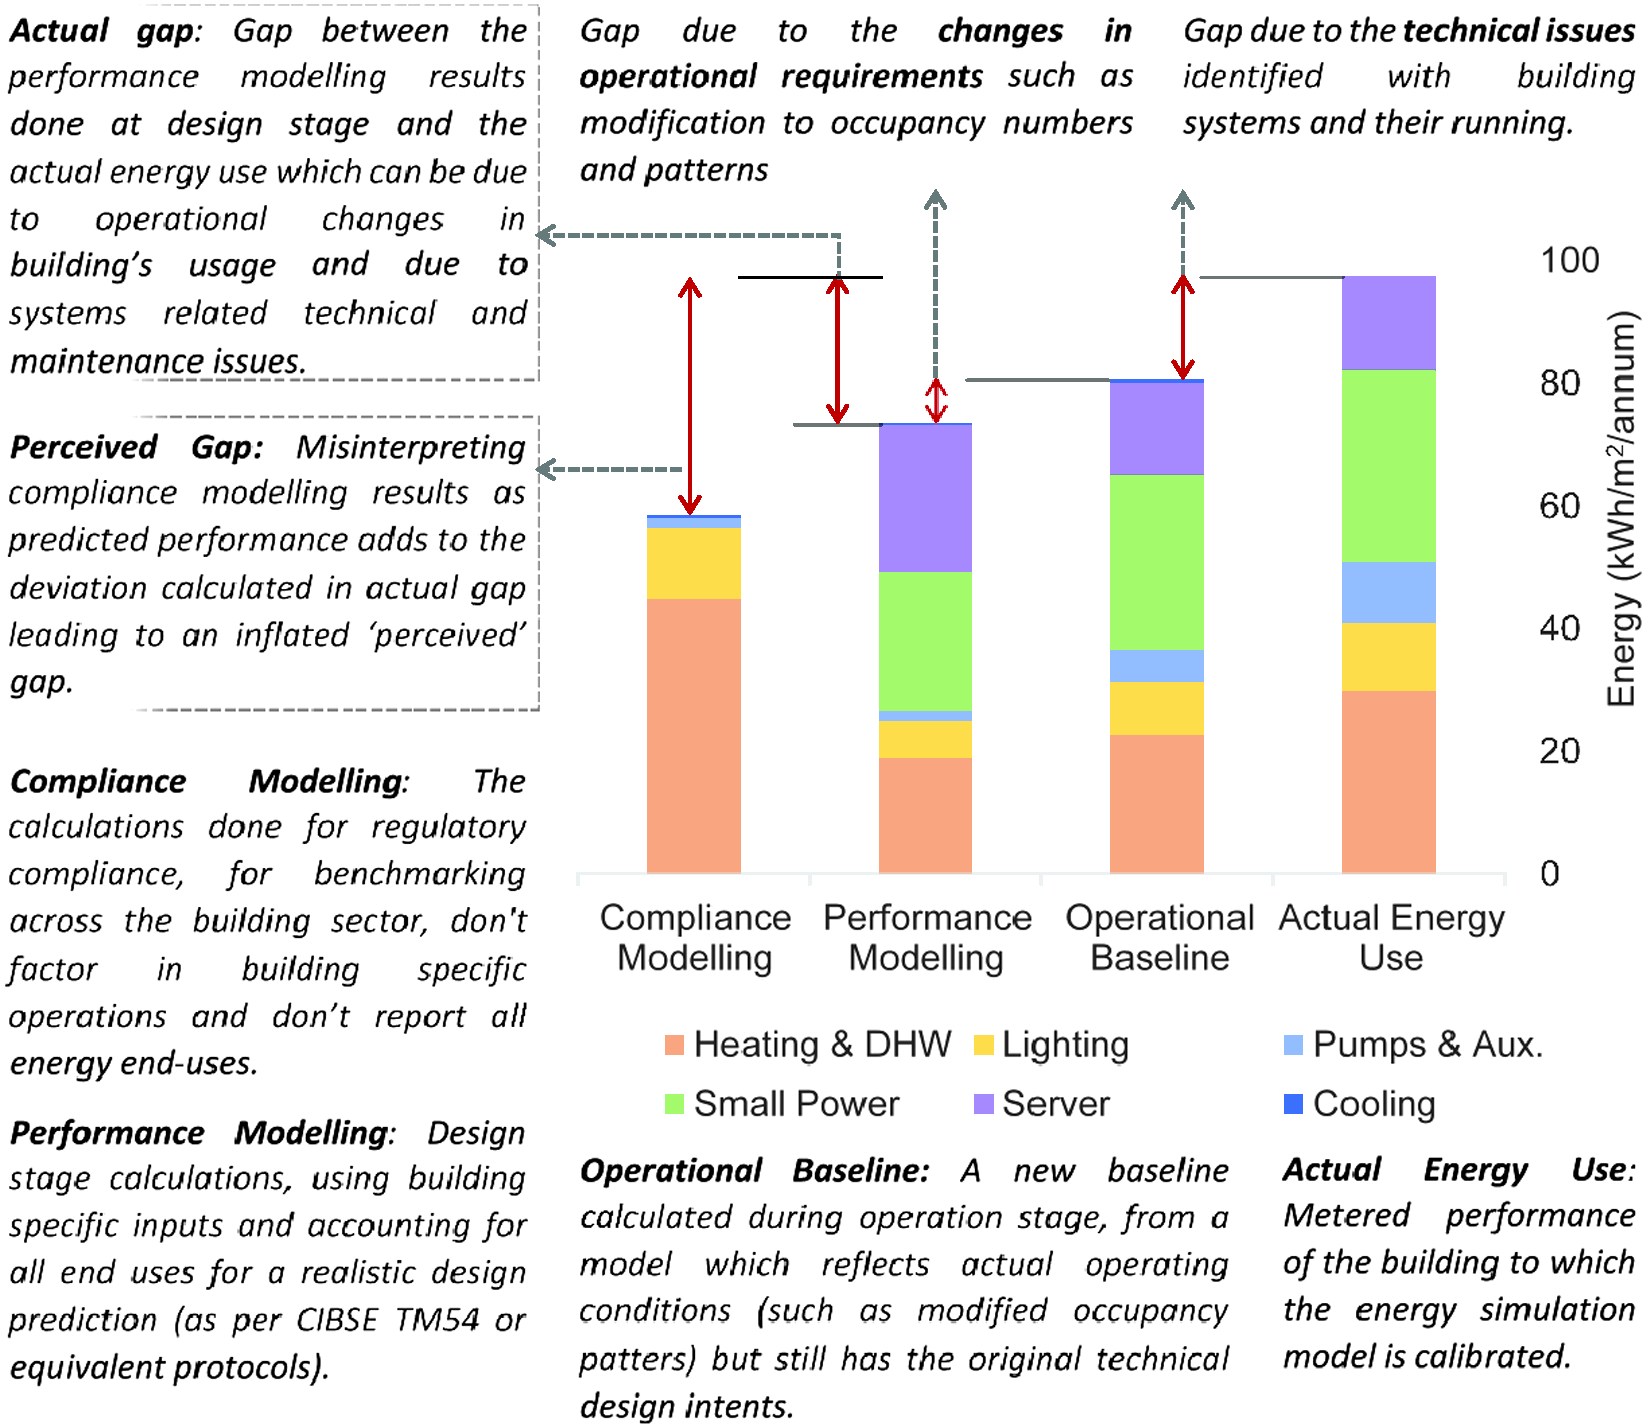
Changing the technical issues identified in ‘Step 2: Performance gap issues’ section back to their design intents, a new operational baseline was generated. Figure 7, described in detail in the discussion section, shows the various energy calculations and related performance gaps observed in the case study building. These form the basis of the new calculations.
Performance calculations and associated gaps in the case study.
Discussion
Categorisation of the causes of the performance gap
It is important to appropriately define the performance gap based on the underlying issues. Figure 7 shows the potential misinterpretation that may be caused when compliance modelling results are used to determine the performance gap, which is quite prevalent in the UK industry. In this case study the designers were aware of the perceived gap issue and undertook detailed performance modelling using realistic operational conditions in the building. The method applied in this paper enables a better understanding of the true extent of the performance gap, and also separation of changes in operational requirements from technical problems. The operational changes after occupancy happen in each building as the occupants get used to their regular functional routine over time, sometimes to the extent of change of use in some of the spaces. The gap in this case study due to operational changes is masked a little by the designer’s overestimation of server load, but can be seen in increased heating, lighting and small power energy uses. This increase, resulting from the changes in the building’s functional requirements, however, is expected in baseline energy use and should not be categorised as a performance gap per se. During operational stages, the performance gap which should be assessed and addressed is the gap due to technical issues. This gap provides immediate insights into what are the key technical problems in the building that can and should be corrected in order to ensure that the building runs at its optimal level. It should be noted that behavioural strategies and energy saving campaigns can also help change occupant behaviour and improve building performance. Whilst this is beyond the scope of this paper, the framework presented and applied here supports such strategies by identifying the extent of the performance gap related to change in use and occupancy related issues and distinguish it from the effect of technical issues, which can be dealt with separately.
Need for an M&V protocol based on calibrated building simulation
Integrating calibrated simulation as an effective and systematic building diagnostic tool into an M&V protocol provides three clear benefits:
A procedural workflow for calibration, through an integrated simulation software toolkit, is essential for practical industry application of model calibration, especially in the performance gap evaluation context. The calibration procedure explained in Figure 1, can go beyond the current industry practices by incorporating analytical techniques such as cross validation through dependent variable checks (e.g., zone temperatures). To further validate the robustness of the calibrated model, uncertainties in the observed deviations in inputs can be factored in using probable upper and lower values to create a monthly energy use range. If the best- and worst-case scenarios with the remaining uncertainty for key inputs are not very wide, then the model can be said to be calibrated with an even higher degree of confidence. To demonstrate this approach, probabilistic representation can be applied to the calibrated model of the case study (at Step 4 in ‘Step 3 and step 4: Energy modelling and model calibration’ section). After the evidence-based calibration is completed, a value range can be defined for each of the inputs with high uncertainty (based on observed evidence) representing the confidence level in the value used in the calibrated model, to create the best- and worst-case scenarios. For example, in this case study building, while the zonal heating set point temperatures in the calibrated model are reasonable and based on monitoring data, the actual value was seen to deviate by ±1–2°C due to occupant preference. This was used to define the respective uncertainty range for this analysis. Another example of such deviation is occupancy hours, where energy use trends, on-site observations and CO2 monitoring data show partial occupancy during non-regular hours; however, the exact occupancy density is not easy to determine. Figure 8 shows the calibrated simulation results with uncertainty for this case study building. The bars indicate the maximum and minimum range in which monthly energy use would lie in due to the residual variability in the input data. The actual energy use in that month is marked by the dot. This diagram suggests that the actual value of these inputs lie somewhere in between. In applications where a further improvement in the calibrated model is needed, more monitoring data with higher resolution will be required so that the uncertainty ranges can be reduced.
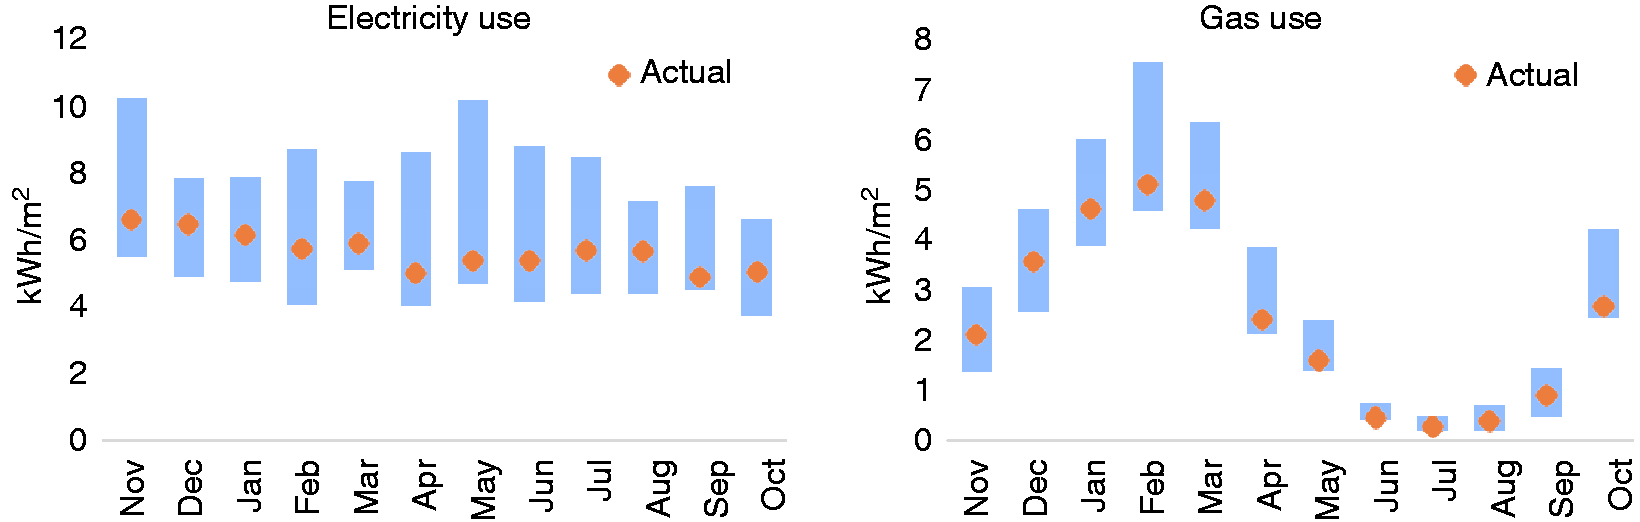
Probabilistic results for gas (left) and electricity (right) use.
Simulation tool requirements for modelling and calibration
Identification of energy performance issues in buildings using calibrated energy modelling, requires a systematic approach and the use of appropriate well- documented simulation tools. Conventional dynamic energy simulation tools (such as DesignBuilder software used in this case study) are equipped to generate good design stage models (e.g. as per CIBSE TM54). Further advancements are required to enable these design stage models to be efficiently fine-tuned to generate calibrated models (e.g. as per CIBSE TM63). Some of the requisites for simulation tools to deliver a calibrated model as per the workflow suggested in Figure 1 are: Handling of raw data from sensors, meters, building management systems, recorded at varying degree of granularity and quality, therefore, often requiring significant processing and cleaning. Comparison of metered data with simulation results as well as use of monitoring data as input values in the simulations. Statistical processing and visualisation of data for identification of trends, patterns, and correlations. Use of a well-documented and validated simulation engine, where underlying calculations could be reviewed. Also, the engine should be capable of modifying model inputs and its calculations between the runs, based on monitoring data, if necessary. Integration of modeller’s engineering expertise and analytical processes such as uncertainty analysis, sensitivity analysis and parametric optimisation in order to guide the assessments towards most probable issues in a fast and reliable manner.
A simulation toolkit which delivers on all the above points should also be packaged in a procedural and simplified workflow, tailored for industry users within a well-integrated interface. Figure 9 shows how components of a well-integrated operational assessment toolkit can deliver a calibrated model. The process begins with an energy simulator that can develop a reasonable ‘as-design’ model. Then the ‘external data processor’ component handles data from the building and processes it either for statistical analysis with simulation data in the ‘results visualiser’ component or for conversion into simulation input through the ‘model input generator’ component. The ‘Real weather’ component develops a bespoke weather file to ensure that the simulation results are calculated with similar external conditions as the monitoring data.
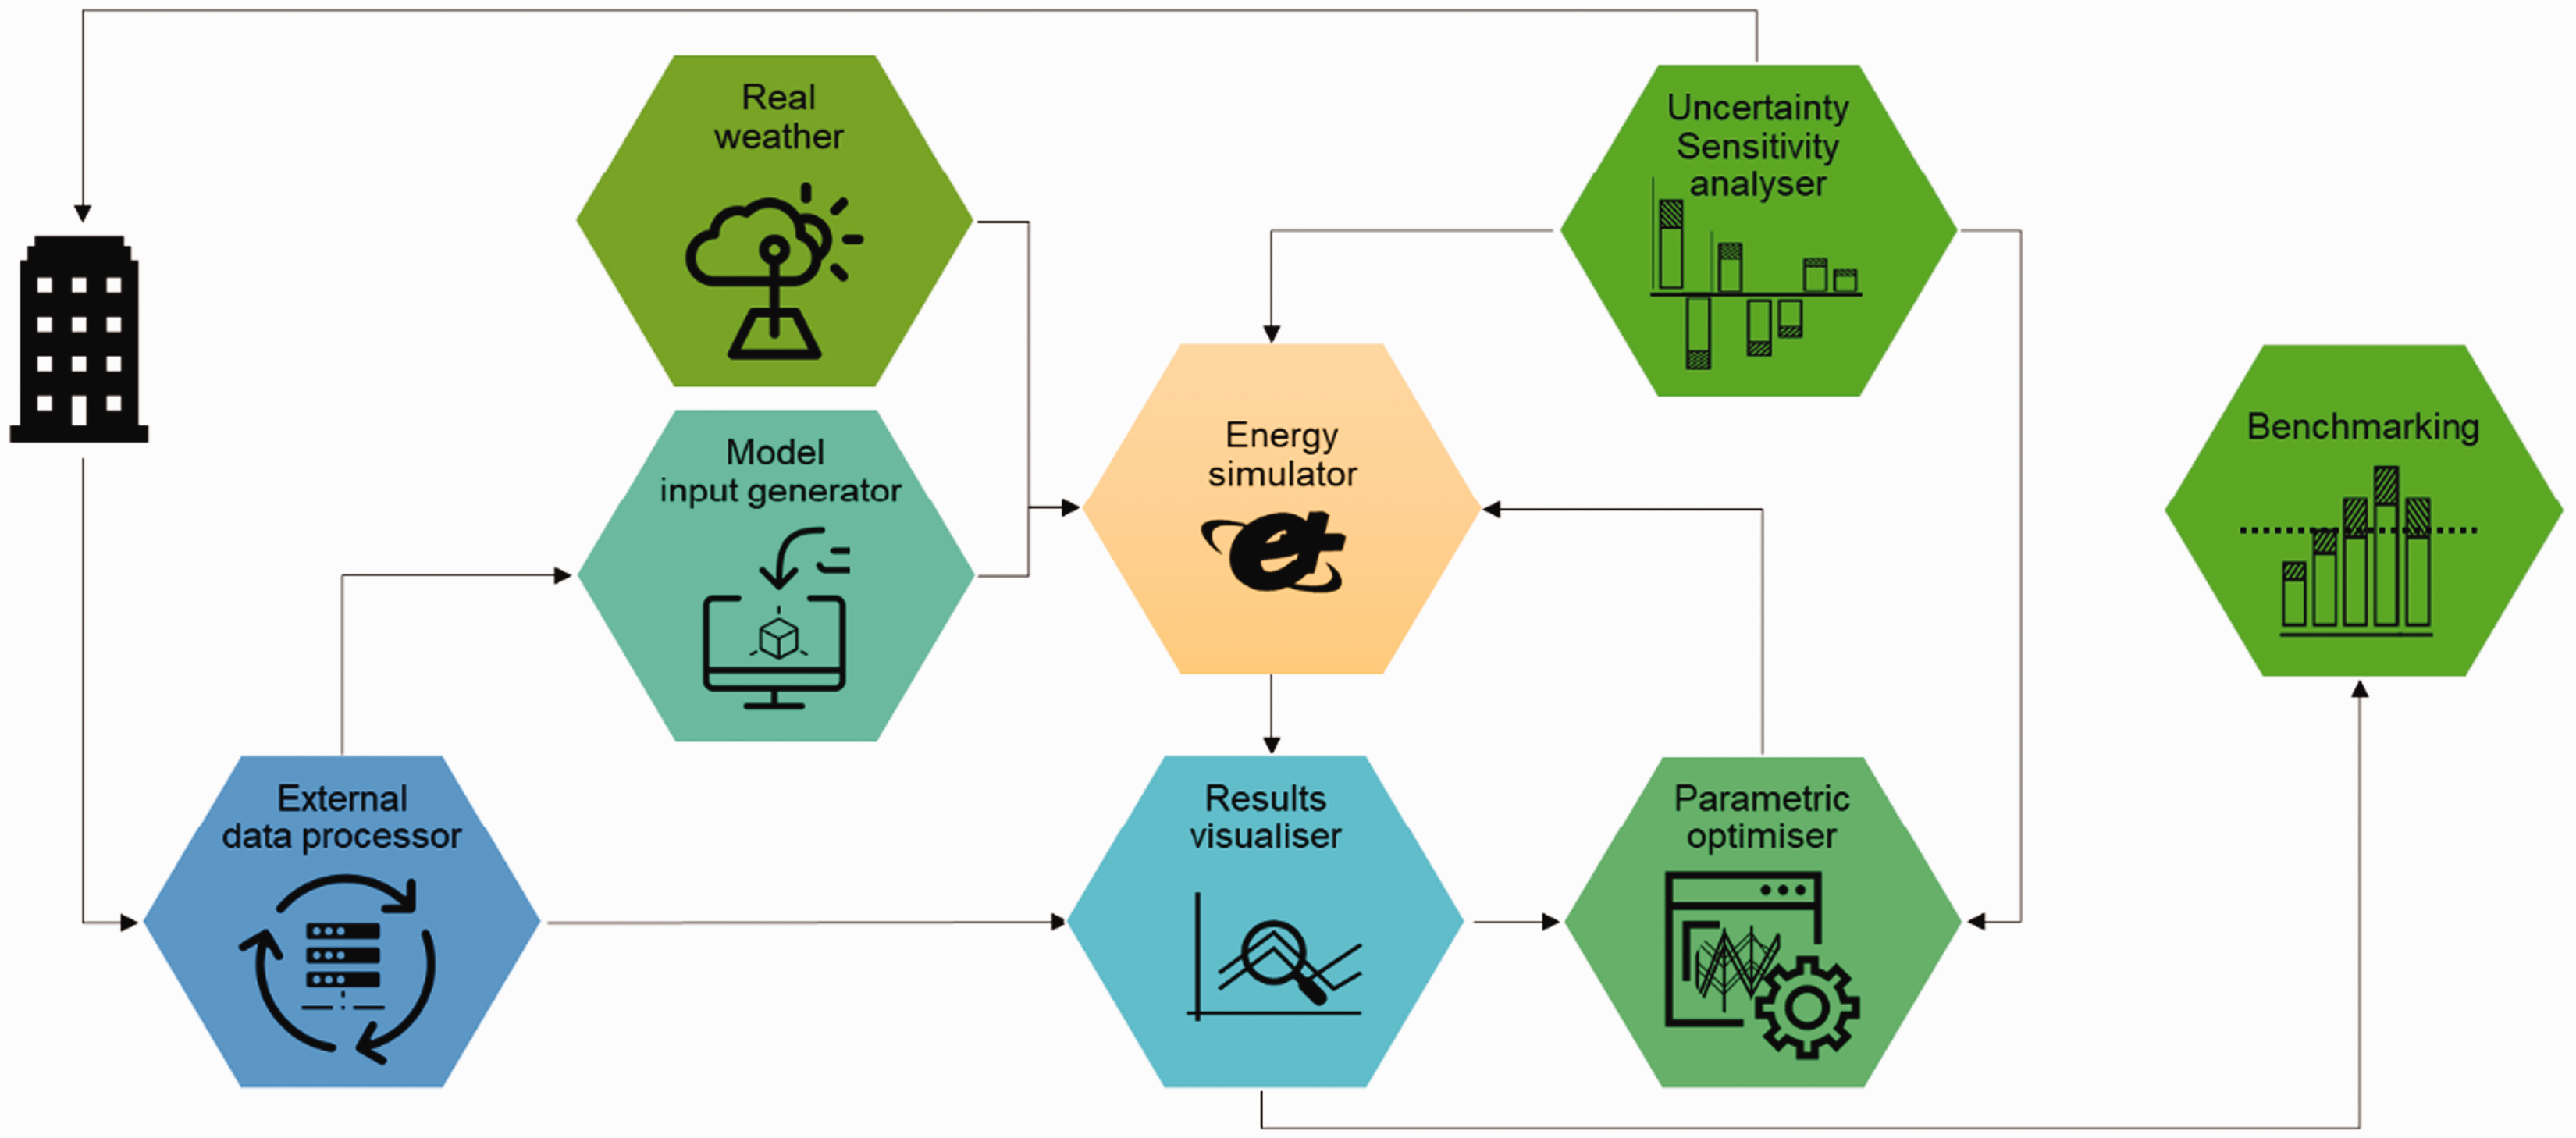
Components and workflow of a calibration toolkit.
While these components can help to deliver a calibrated model, the other two components, ‘uncertainty sensitivity analyser’ and ‘parametric optimiser’, can help in better understanding of the building and enhance the modeller’s capability to identify and tune the model deviations. The sensitivity analyser can help to uncover the sequence of model inputs to be fine-tuned or to be obtained from the building monitoring to make the calibration more robust. Integrating the sensitivity analyser with parametric optimiser’s algorithms can help in quick identification of likely causes of model deviation, which can then be procedurally verified on site. To support this approach, such a toolkit is being developed which can supplement an existing building performance simulation software.
Conclusions
This study highlights many lessons that can potentially be used to inform and improve current industry practices for operational stage performance analysis. The paper demonstrates the application and usefulness of integrating energy simulation as an investigative tool for post occupancy evaluation processes in the context of identification of the performance gap and its root causes. This new M&V framework can transform post occupancy evaluation and building fine-tuning processes to a more robust and procedural setup. The ability of the framework to identify and validate the key potential issues and separate the technical ones from discrepancies driven by change of use, enables a more appropriate assessment of the performance gap. It also provides immediate insights into what needs to be corrected or improved in the building and what are the best strategies to achieve these improvements.
While the new M&V framework is intuitive, the case study presented in this paper provides an example template for practitioners and researchers to emulate in their performance evaluations. The example gives a detailed guidance and explanation of how simulation tools can be used procedurally to undertake robust energy modelling and model calibration.
Limitations and future work
The methods proposed here require certain level of modelling expertise and engineering judgement to generate the calibrated model. Additionally, model validation, through multi-parameter checking, require more standardisation to ensure that the dynamic thermal performance can be accurately used for performance prediction over a wide range of energy and environmental outputs.
A software toolkit, which enables practical application of this framework, is also being developed using DesignBuilder Software, a graphical user interface for EnergyPlus.
Supplemental Material
sj-pdf-1-bse-10.1177_01436244211008317 - Supplemental material for Managing energy performance in buildings from design to operation using modelling and calibration
Supplemental material, sj-pdf-1-bse-10.1177_01436244211008317 for Managing energy performance in buildings from design to operation using modelling and calibration by Nishesh Jain, Esfand Burman, Dejan Mumovic and Mike Davies in Building Services Engineering Research & Technology
Footnotes
Acknowledgments
The authors wish to express their gratitude to the design and construction team, building managers and users who engaged in research and supported the building performance evaluation of the case study.
Declaration of conflicting interests
The author(s) declared no potential conflicts of interest with respect to the research, authorship, and/or publication of this article.
Funding
The author(s) disclosed receipt of the following financial support for the research, authorship, and/or publication of this article: We gratefully acknowledge the financial support by UCL Overseas Research Scholarships (UCL-ORS); DesignBuilder Software Ltd. and Innovate UK KTP project (Partnership number 11615); and the ‘Total Performance' of Low Carbon Buildings in China and the UK (‘TOP') project funded by EPSRC (EP/N009703/1).
References
Supplementary Material
Please find the following supplemental material available below.
For Open Access articles published under a Creative Commons License, all supplemental material carries the same license as the article it is associated with.
For non-Open Access articles published, all supplemental material carries a non-exclusive license, and permission requests for re-use of supplemental material or any part of supplemental material shall be sent directly to the copyright owner as specified in the copyright notice associated with the article.