
Abstract
Field study was conducted in naturally ventilated primary school buildings in a warm and humid environment in Imo State, Nigeria to determine the thermal comfort perception of young children (aged 7–12 years) and to understand the thermal conditions in the classrooms. The comfort temperature was investigated in two types of classroom buildings during the rainy and dry seasons from October 2017 to May 2018. Approximately 7050 completed valid questionnaires were collected from 330 young children repeatedly surveyed twice a day. The children answered comfort questions at the same time the indoor and outdoor thermal variables were being measured. Results indicated that the combined ‘open-space’ classrooms produced a neutral temperature of 28.8°C with comfort range, 25.2–32.3°C. The neutral temperature of the combined ‘enclosed-plan’ classrooms is 28.1°C with 25.8–30.5°C as the comfort range. The differences in the comfort perceptions may be attributed to the differences in the architectural characteristics of both categories of classroom buildings. High temperature tolerance was shown by the participating children in the study area. This article, therefore, suggests that installing air conditioning in primary schools in the warm humid environment in Nigeria may not be necessary as it could lead to unnecessary energy consumption and carbon emission.
Introduction
The indoor thermal conditions are one of the study areas researchers are very interested in because most people are believed to spend more of their time indoors than outdoors. Of all the indoor environmental quality components, thermal comfort is mostly ranked as the number one component that gives the building occupants the most concern especially in the tropical areas. The American Society of Heating, Refrigeration, and Air Conditioning Engineers (ASHRAE) defined ‘thermal comfort’ as ‘that condition of mind that expresses satisfaction with the thermal environment’. 1 Two main models that evaluate thermal comfort of buildings are the heat balance model and the adaptive model. The first model is reported to be more suitable to be applied to artificially (air conditioned) ventilated buildings, while the second model is proven to be more suited for free running buildings, 2 predominantly found in the tropical zones. The adaptive model is more of a subjective evaluation, where the relationship between occupants and the environment in free running buildings are constantly changing, unlike in conditioned buildings.
It is continuously highlighted in thermal comfort research reports that lack of knowledge about the thermal perception of children may put their health at risk, especially with the growing concerns about the possibility of continuous overheating in school buildings caused by climate change. Exposure to these high temperatures in classrooms can cause health problems such as increased risk of heat stroke, respiratory and cardiovascular hospitalizations and deaths.3,4 This information was further corroborated by some other thermal comfort researchers who posit that apart from the impact on pupils’ health, it may also affect their learning and problem-solving ability.5,6 The importance of providing thermally comfortable environments in these classrooms, where children spend one-third of the day, 7 cannot be overemphasized. However, providing a comfortable learning environment in a school requires understanding how the occupants feel about the thermal conditions in such classrooms.
In tropical climates, various thermal comfort studies in schools have reported various ranges of indoor temperatures acceptable to the studied students. For example, Abdeen et al. 8 investigated the thermal conditions in naturally ventilated public primary schools in a hot and humid climate of Egypt and found an acceptable range of thermal comfort between the range 25.5°C and 29.5°C. Mishra and Ramgopal 9 conducted thermal comfort field study in naturally ventilated classrooms in the hot and humid climate of India and observed a neutral temperature of 29.0°C and preferred temperature of 26.8°C, with an 80% occupant satisfaction between 22.1°C and 31.0°C. Hussein and Rahman 10 conducted field study in naturally ventilated classrooms located in Malaysia, a tropical country, to determine the perception of the occupants and found that the occupants of the classrooms accepted thermal comfort beyond the ASHRAE comfort range. However, not all the surveys on thermal comfort perception in schools reported that students accepted the prevailing indoor temperatures in their classrooms. For example, Mohamed 11 assessed the thermal comfort of occupants in naturally ventilated primary school classrooms in hot and humid Egypt and observed that most of the students were thermally uncomfortable. The reason was attributed to high occupancy ratio and inadequate natural ventilation in these surveyed classrooms.
Despite the importance of understanding thermal perception in classrooms, previous thermal comfort investigation conducted in Nigeria, mainly focused on hostel blocks, residential and office buildings. Furthermore, the participants in these studies were mainly adults, despite that approximately 43% of the population of the country is within the age range of 0–14 years. 12 Teli et al. 13 and de Dear et al. 7 argue that children’s perception of comfort may be different from that of adults because age, activity and metabolic rates differ significantly between both groups. In addition, children are not matured in physiology and psychology, causing them to possess poor self regulation ability when faced with temperature changes. 14 Based on these findings, thermal comfort obtained using only adults as participants may not be applicable to children. Furthermore, comfort temperature survey carried out in a geographical area cannot be generalized to apply to a different geographical area2,15 because of differences in culture, buildings and climates.
The case study country, Nigeria is classified as tropical and has a population of approximately 180 million people. 16 The precise study state, Imo State, has a warm and humid climate. In this state, children from mixed socio-economic backgrounds converge for class activities in public schools in two types of classrooms referred in this article as ‘open-space’ and ‘enclosed-plan’ classrooms (Figure 1(a) and (b)). The two types of classrooms have different architectural compositions, and the occupants are from mixed socio-economic backgrounds. There is a need to extract information from these two factors that may influence the perception of thermal comfort, in view of the finding from Trebilcok et al. 15 about a correlation between thermal comfort and socio-economic backgrounds of participants in thermal comfort surveys.
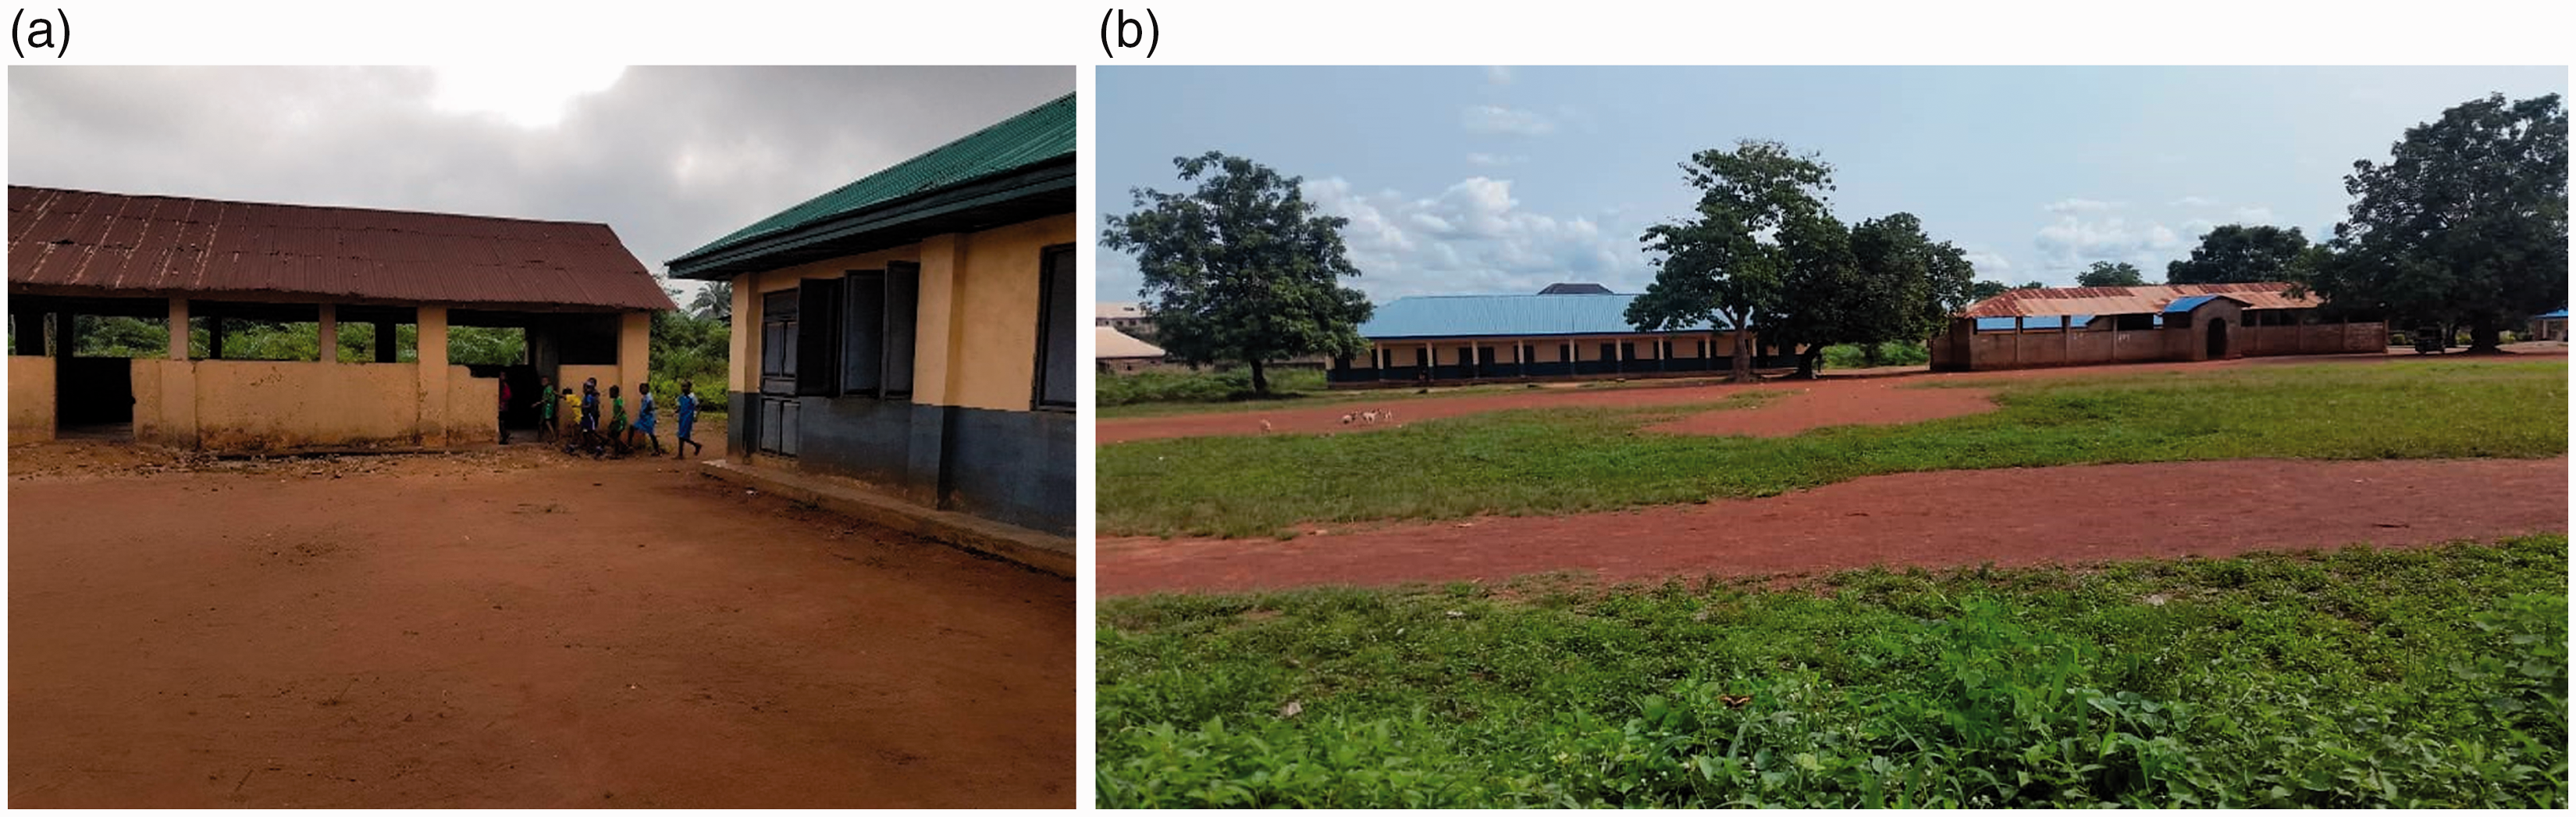
(a) Sample classroom types: ‘Open-space’ (left) and ‘Enclosed-plan’ (right). (b) Other sample classroom types: ‘Open-space’ (right) and ‘Enclosed-plan’ (left).
Apart from determining the thermal comfort perception of the young children in these selected classrooms, it is also important to understand if the comfort perception of the pupils differs according to classroom type. According to Nicol et al., 2 the buildings and the rooms the subjects inhabit (occupy) are almost as important to the survey as the human subjects themselves.
Therefore, the following are the objectives of the field study:
To compare the relationship between the thermal performance in the two types of classrooms and the responses of the young children to the thermal sensation question. To determine the neutral temperature and to compare the result with other similar works. To determine the thermal comfort range and to compare the finding with other related works.
Thermal environment
To have an ideal thermal environment, many of the occupants (put at 80% minimum by ASHRAE Standard 55) needs to accept the thermal conditions in such an indoor environment. According to Fanger,
17
environmental variables (air temperature, mean radiant temperature, air velocity, relative humidity) and personal factors (clothing insulation, activity/metabolic rates) determine occupants’ thermal comfort. The adaptive approach to thermal comfort was developed to encourage low energy use in buildings. Many findings from field works indicate that people are often comfortable at the mean temperature that is prevailing in their locality by adjusting to it through behavioural actions such as clothing adjustment, change in posture, reducing or increasing activity rates and opening or closing windows. These adaptive tendencies tend to make their neutral temperature close to the mean temperature they usually experience. However, these behavioural actions may be impeded if the occupants have no control over their indoor thermal environment, for instance in some schools where some teachers are reported to take control of the indoor environment.
18
To show the relationship between the neutral temperature and the mean temperature, a database of summary statistics containing these two variables were plotted against each other which produced the regression equation (1)19

Some earlier studies established the relationship between neutral temperature and the mean indoor temperature. Humphreys
20
showed a strong relationship between the mean indoor temperature Top and neutral temperature Tn. The simple regression equation is

Auliciems and de Dear
21
developed another equation that expressed comfort as a function of mean indoor air temperature. The equation is

Results from the various fields study on thermal comfort indicate that apart from the influence of outdoor temperature in comfort perception of building occupants, culture and locations also influence the perception of thermal comfort. Hence, fixing a range of thermal comfort to serve different climates and people may not be realistic. 2 Table 1 shows a summary of some thermal comfort studies in school classrooms with different age groups, different locations and different climates. The sample size varied from 45 to 4000 respondents with studies conducted in air-conditioned classrooms, mixed mode ventilated classrooms and, mostly, naturally ventilated classrooms. From the table, comfort range can be as low as 24°C to 26°C in naturally ventilated classrooms 20 and 23.4°C to 25.8°C 22 or as wide as 18°C to 27.5°C. 7 Furthermore, the neutral temperature in naturally ventilated classrooms can be as low as 19.1°C.23 It is therefore evident that the comfort ranges and/or neutral temperatures can be significantly different from one location to another. However, most of these studies focused on schools located in Europe, America and Asia. There is a need to undertake more research to understand the thermal perception of school children from other geographical areas that have not been properly covered.
Summary of children’s comfort/neutral temperature from previous studies.
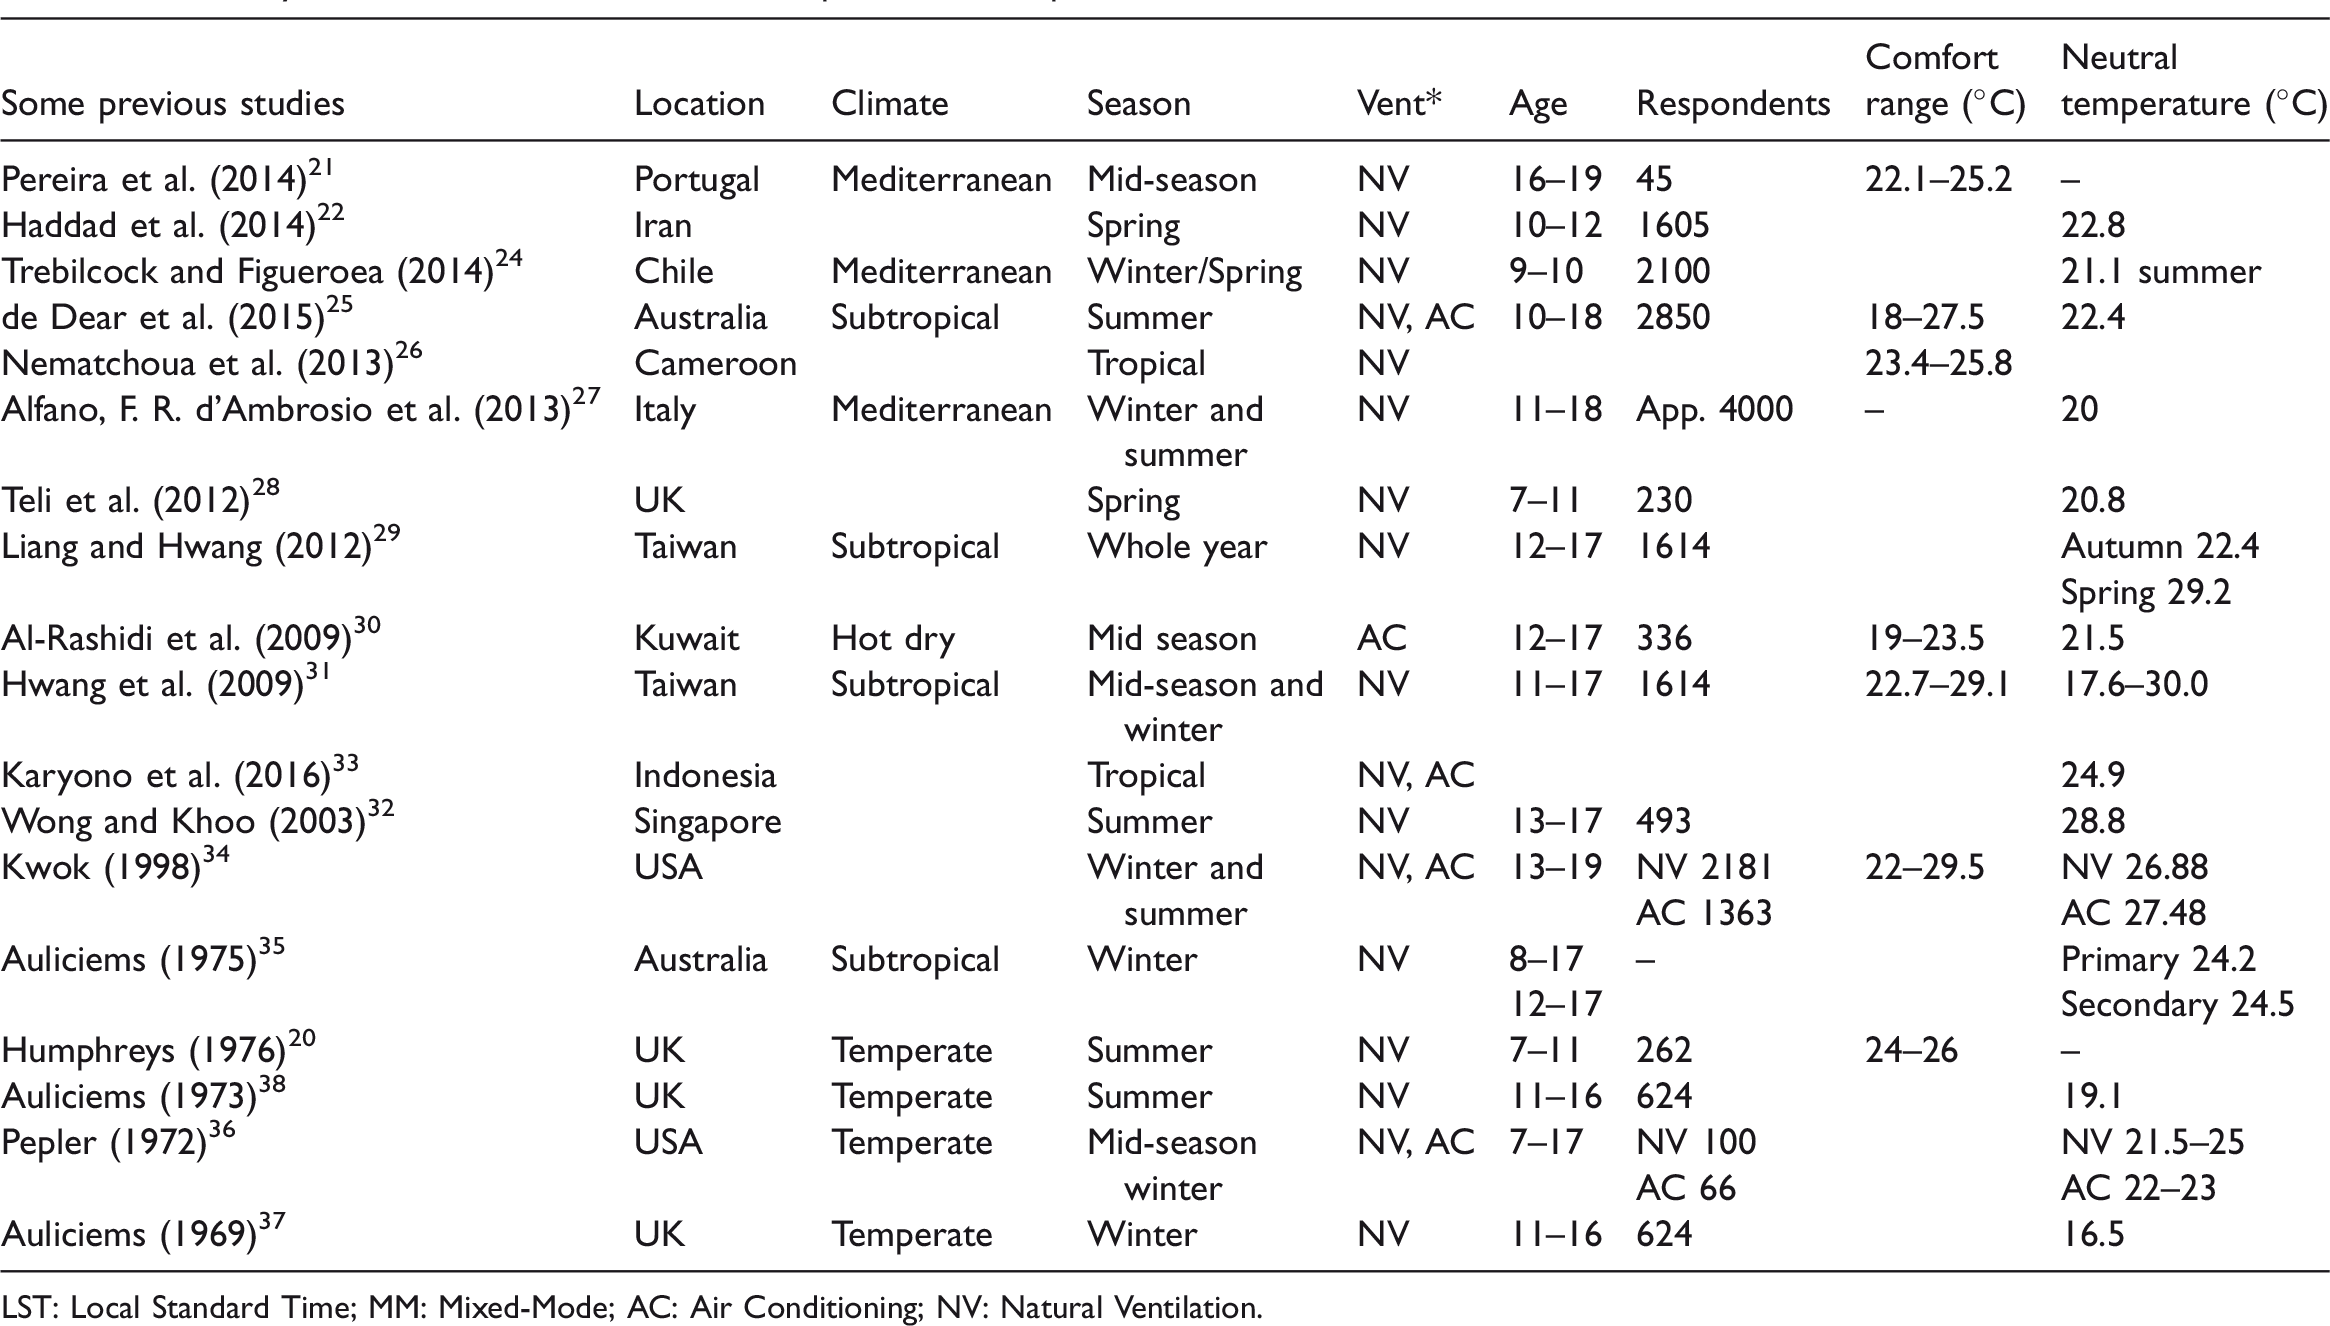
LST: Local Standard Time; MM: Mixed-Mode; AC: Air Conditioning; NV: Natural Ventilation.
Methodology
The study area
The study area, Imo State, is in the South East of Nigeria categorized according to the climatic classification of Koppen–Geinger in the group of tropical zones. 24 The state is located between latitude 4° 45′N, 7° 15′N, longitude 6° 50′E, and 7° 25′E and lies in the rain forest zone of the warm and humid tropics characterized by high temperatures and high relative humidity for most periods of the year. Generally, Nigeria is typical of the tropical region where the sun is known to be directly overhead at noon and according to Adunola and Ajibola 25 and Eludoyin, 26 1200–1600 Local Standard Time (LST) is the hot discomfort period of the day. Figure 2 shows the graphical representation of the mean daily maximum, mean daily minimum, the hot days and cold nights in the study area.
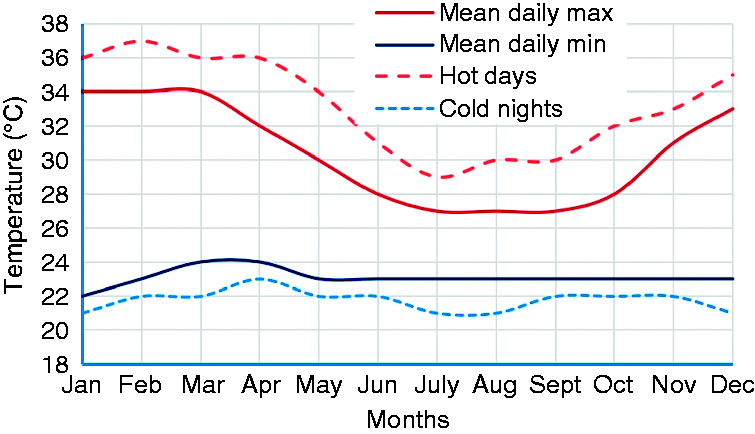
Graphical representation of the mean daily max, min, the hot days and cold nights (data taken from local Met Office Nigeria).
Building fabric in the study area
The characteristics of any building in terms of the materials used in the construction of the walls and the floors, including the type of doors, windows and ceiling installed, determine the thermal condition of that building. To a large extent, these parameters determine the thermal perception of building occupants. The walls of the case study classrooms used in this study are made of sandcrete blocks, a product from the mixture of cement, sand and water. Sandcrete block is the most common material used for the construction of external building walls in Nigeria,
27
and approximating 95% of buildings in Nigeria are constructed with this material. Walls built with this material do not retain heat
28
or absorbs heat, because it has low thermal mass.
29
The entire outside walls of the surveyed classrooms were built with this material and nowhere was any metal iron sheets used in the construction, apart from their usage for windows and, in some places, for doors. The design of the roof overhangs, which are usually up to 1.2 m, in most cases, prevents solar radiation from striking the window directly,
30
and this is applicable to buildings that are not high rise,
28
as the case in this research work. These classroom areas were well shaded from the sun rays with these roof overhangs (eaves). Thus, the area weight average u value of the outside walls of all the case study classrooms satisfied the following inequality, shown in equation (4)

Uw is average U value of the wall or window, W/m2 K
td,i is internal design temperature, °C
td,e is external design temperature, °C
Neither the children nor their teachers were using any computers, as none of these electronic gadgets were available in the surveyed classrooms. As a result, the operative temperature was used as an index to evaluate the thermal conditions in the case study classrooms. Haddad 31 assumed indoor operative temperature to equal air temperature, during a field investigation in some selected classrooms, after observing a negligible effect of thermal radiation caused by similar minor difference of 0.03 K between the indoor air temperature and the operative air temperature in the studied classrooms. Also, Efeoma 28 adopted operative temperature as an index in the evaluation of thermal comfort of office workers in south east Nigeria, having observed that the u value of the outside walls satisfied the inequality, in equation (4).
Furthermore, the floors of all the classrooms were covered with cast in situ concrete and finished with weak cement screed overlay. According to Effting et al., 32 the thermal impact on the floor will only be significant in places where people do not wear shoes or sandals. The floor finishing had no impact on thermal sensation on the children since they adhered to the strict code of wearing sandals while in school. The surveyed classrooms were also finished with ‘polyvinyl chloride’ (PVC) ceiling sheets. PVC ceiling sheets are known to have low density, low thermal conductivity and high thermal sensitivity, which help to reduce thermal gain inside buildings. The roof of the entire schools is made of corrugated iron sheets resting on timber supports. Timber is known to be a poor conductor of heat.
Case study schools
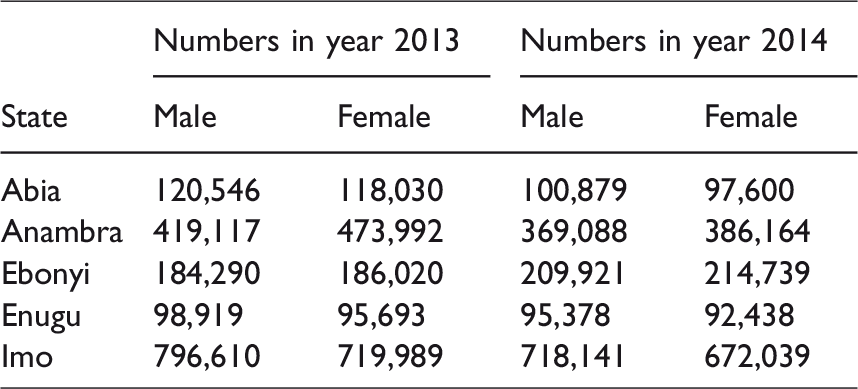
The warm humid states in South East Nigeria are five in number. The following reasons justify the selection of Imo State as case study area
The state was selected because it is easily accessed from other South Eastern states. Number of public primary schools by state in South East Nigeria, year 2013–2014 (compiled from Universal Basic Public Education and key statistics in Nigeria).
Being the home state of the researcher, logistics associated with cost, accommodation, transportation, coordination and time management will be minimal.
Primary schools in Nigeria are owned by the government (public schools) and by individuals or organizations (private schools). Public schools were selected for the field work because children from different socio-economic backgrounds attend the public schools. The diversity in this socio-economic status provides an ideal platform for the survey. In addition, it is in public schools that different classroom building types, referred to in this article as ‘open-space’ and ‘enclosed-plan’ classrooms are found.
Three public schools located in Imo State were selected for the investigation. The three schools are in three zones that made up the state. The schools are Premier primary school Umuaka (School A), Central school Ogbaku (school B) and Central school Umuduru (school C). The classrooms in all the schools are naturally ventilated. School A is a bungalow built in the 1950s and houses one ‘open-space’ classroom and 10 ‘enclosed-plan’ classrooms. The ‘open-space’ classrooms (AOP) and one of the ‘enclosed-plan’ classrooms (AEN) were chosen for the field work. The frontage of both classrooms has south-west orientation. School B is also a bungalow built in the 1940s and houses one ‘open-space’ classroom and six ‘enclosed-plan’ classrooms. The ‘open-space’ classroom (BOP) and one of the ‘enclosed-plan’ classrooms (BEN) were selected for the study. The front elevation of both classrooms has North-East orientation. School C was built in the 1950s. It houses one ‘open-space’ classroom and four ‘enclosed-plan’ classrooms. The ‘open-space’ classroom (COP) and one ‘enclosed-plan’ classroom (CEN) were chosen for the study. The entrance to the ‘open-space’ classroom has south-west orientation, while that of the ‘enclosed-plan’ classroom is oriented towards south-east.
The substructure of the six selected classrooms (3 ‘open-space’ classrooms and 3 ‘enclosed-plan’ classrooms’) comprises of mass concrete strip foundations, mass concrete floor finished with cement screed. All the classrooms are roofed with the same material; galvanized steel resting on timber supports and ceiled with PVC materials. Figures 3 to 5 show the two types of classroom buildings. Some of the ‘enclosed-plan’ classrooms were renovated to conventional ‘style’ in recent times, while some of the ‘open-space’ classrooms remain in their original form.
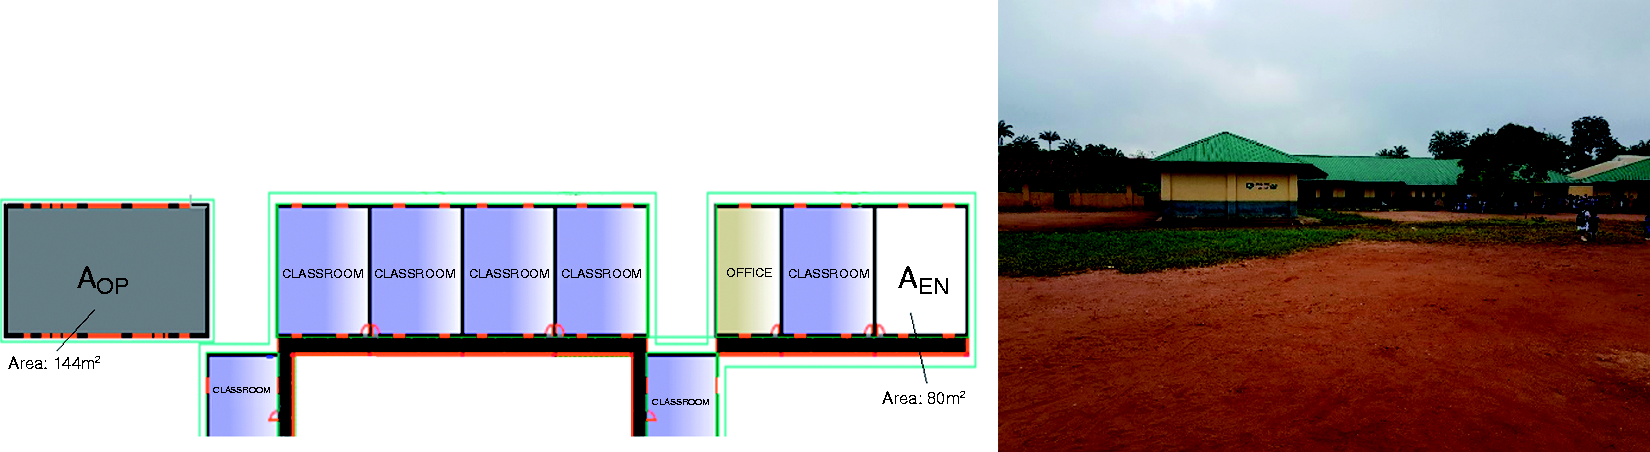
Shows the floor plan (left) and front view (right) of school A.
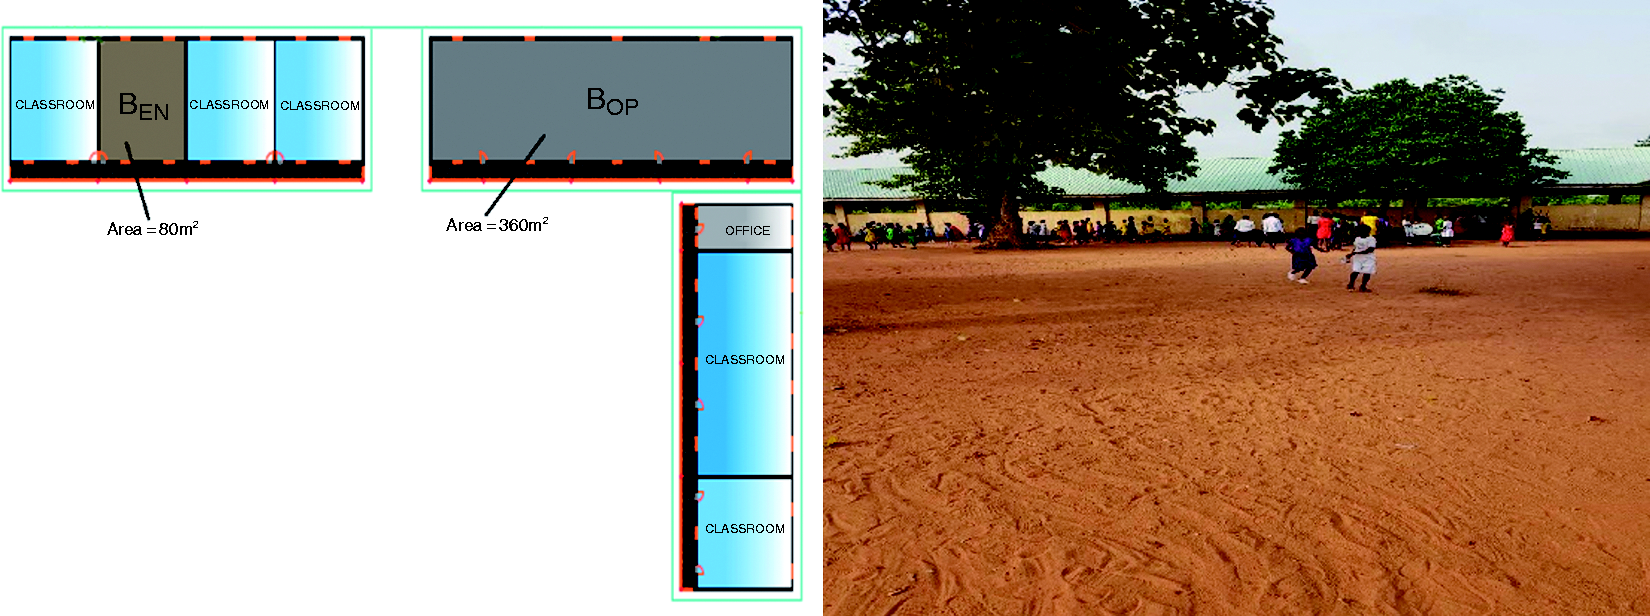
Shows the floor plan (left) and front view (right) of school B.
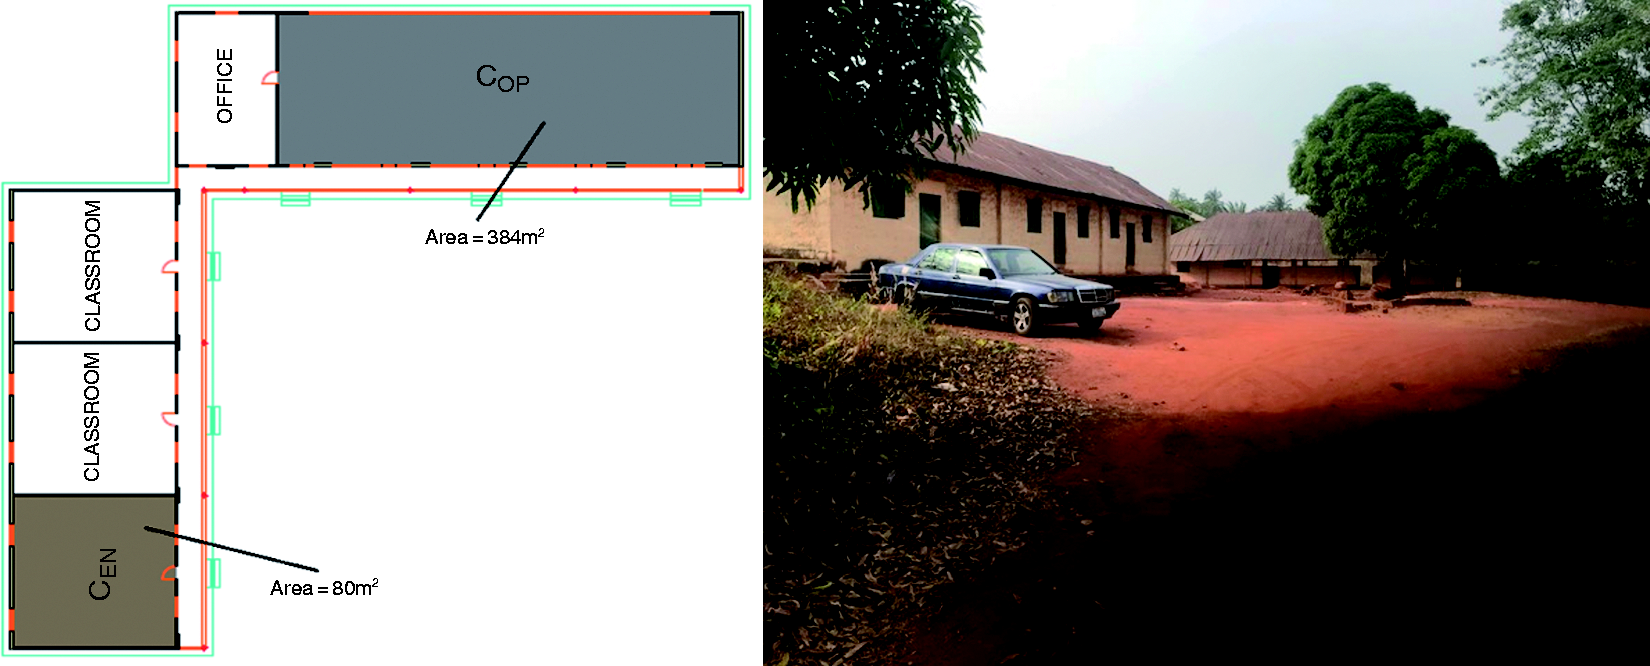
Shows the floor plan (left) and front view (right) of school C.
The two major approaches usually adopted in thermal comfort research are the laboratory experiment and the field work. Laboratory experiment is more suited for airconditioned buildings, while the field experiment is suggested to be adopted in naturally ventilated buildings. 2 Furthermore, in naturally ventilated buildings, results from field measurements are widely accepted to predict the comfort temperature of occupants. 6 This study adopts field research as the research methodology since all the classroom buildings in the study area are naturally ventilated.
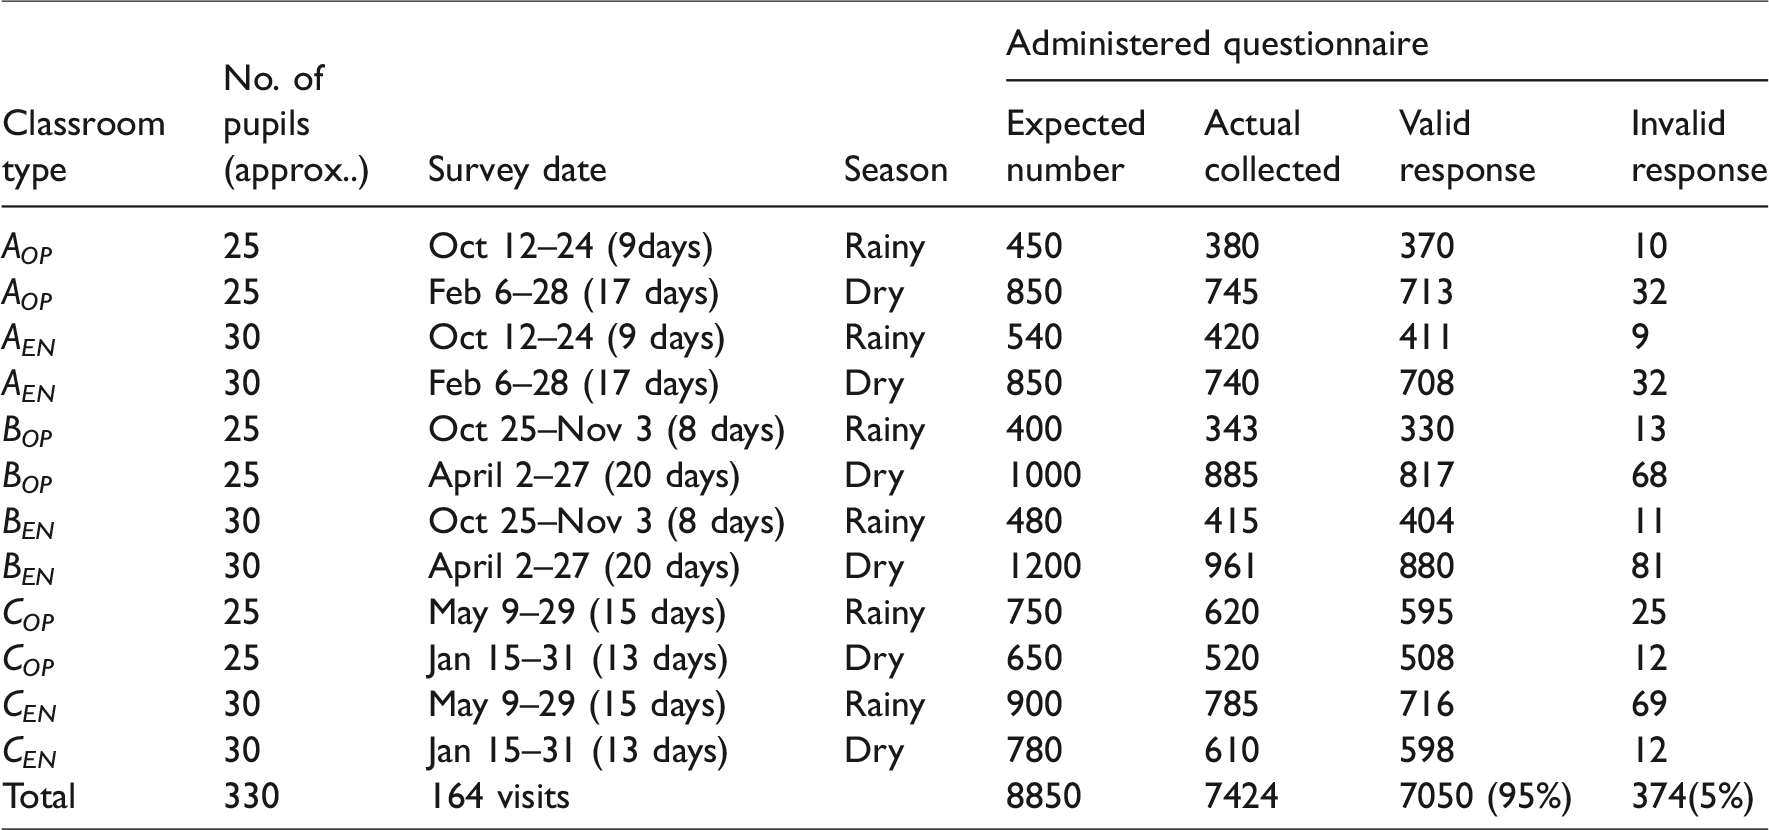
To capture the different climatic periods in the classrooms, the field work took place from the month of October 2017 to the month of May 2018 (with some breaks in between). The duration of the survey in the classrooms varied from one week to more than two weeks. With the help of a trained assistant, the six classrooms were surveyed morning and afternoon during which 330 young children were evaluated, resulting to 7050 completed valid questionnaires. Table 3 gives further detail about the survey period in each of the visited classrooms.
Summary of survey period for the six classrooms from three schools during both rainy and dry seasons.
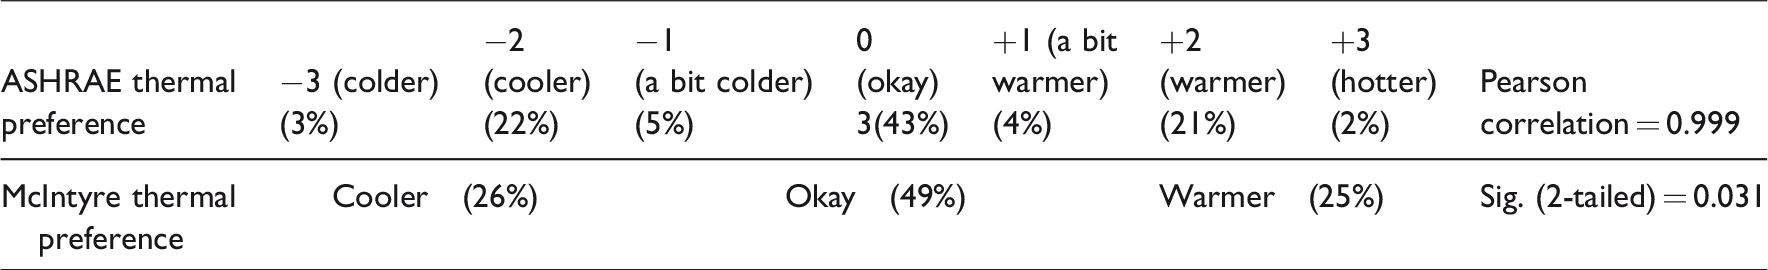
Detail of thermal preference voting using ASHRAE and McIntyre scales.
Questionnaire
Some researchers raise doubts whether children can understand the wordings of a questionnaire. Some others argue that children have the capability to complete the self-reporting questionnaires. For instance, Christensen and James 33 argue that children are worthy of investigating and may not need parents or caregivers to guide them. Treblicock et al. 34 added that children can properly understand the wordings in a questionnaire. Furthermore, Clark and Moss 35 believe that children are strong, capable, and knowledgeable experts on their lives. In Nigeria, English language is the medium of communication and teaching in schools from nursery to the university level. Children ask and answer questions, write figures and essays using English language. According to Edem et al., 36 teachers in Nigeria expose children to English as a medium of communication from the beginning of their schooling. However, there is a concern that some of the children may be influenced by their classmates while answering thermal comfort questions. This very potential factor was observed and dealt with accordingly during the survey. The presence of the teacher ensured that the pupils did not influence one another when filling the questionnaires.
Though some researchers support that young children can understand and answer thermal comfort questions further evidence was needed in this work, and a simple reliability test was carried out prior to the commencement of the survey. The McIntyre scale and ASHRAE scale were used to judge the responses of the children to thermal preference question: Right now, I would prefer to be?, to which they had the option to choose preference to be ‘colder’ (−3) and ‘cooler’ (−2) on the ASHRAE seven-point scale, equated to preferring to be ‘cooler’ (−1) on the McIntyre scale. Likewise, preferring to be ‘hotter’ (+3) and ‘warmer’ (+2) on the same ASHRAE scale were equated to preferring to be ‘warmer’ (+1) on the McIntyre scale, while preference to be ‘a bit cold’ (−1), ‘okay’ (0) and ‘a bit warm’ (+1) on the ASHRAE scale were equated to preference to be ‘okay’ (0) on McIntyre scale. The questionnaire containing the preference questions based on ASHRAE seven-point scale was the first to be distributed to each participating child. After they were done with the first questionnaire, the next questionnaire containing the McIntyre scale was handed over to them to fill. Result from the analysis indicates that the percentage of children who preferred to be ‘cooler’ was 26%, adopting the McIntyre preference scale, while in ASHRAE scale it was 25%. The preference votes to be ‘warmer’ were 23% and 25%, using McIntyre scale and ASHRAE scale, respectively. The preference votes on the basis of ‘okay’ were 49% and 52% using the McIntyre scale and ASHRAE scale, respectively. Further statistical analysis shows no significant difference in the responses between the two rating scales. The correlation between the responses in the two scales is high (r = 0.99) with p value <0.051. The consistency in their responses using both scales indicates that the children, being evaluated, understood the questions and could reflect answers according to their thermal conditions.
Evaluation procedure
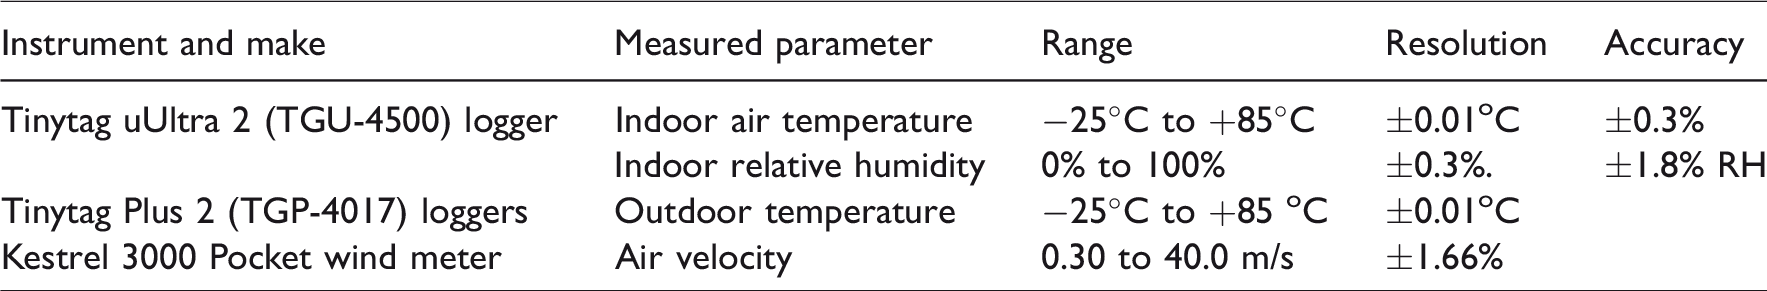
The participating children did not change classes in the two seasons the survey was conducted and were assumed to have adapted to their classroom’s indoor environment. To obtain objective data from them, Tinytag Ultra 2 (TGU-4500) data logger was placed inside each of the classrooms at the height of approximately 0.6 m above the floor area for the seated occupant. 1 The loggers recorded the indoor air temperature and the indoor relative humidity. Based on the type of building fabric in the classroom buildings, as earlier discussed, and the spot checks of air temperature in various spaces in the classrooms, the air temperature was assumed to be equal to the operative temperature. For the outdoor temperature, Tinytag plus 2 (TGP-4500) did the recording and both loggers had temperature reading resolution of ±0.01°C, while the reading resolution of the relative humidity was ±0.3%. The instruments used for the survey met the prescriptions of ASHRAE Standard 55-2017 1 and often adopted by some thermal comfort researchers because of their reliability. Kestrel 3000 Pocket Wind Meter recorded the indoor air velocity. The indoor data loggers were carefully positioned in the surveyed classrooms to ensure they did not prevent the children and their teachers from walking around the classrooms freely. The outdoor data logger was adequately shaded from rain and sunlight. Table 5 shows the technical characteristics of the measuring instruments.
Technical characteristics of the measuring instruments.
Prior to the start of the survey, the temperature readings were taken at different heights in the classrooms; 2.8 m above the floor level (near the ceiling), 1.0 m above the floor area at the centre of the classrooms and near the external walls. All the readings were observed to be similar. Furthermore, the researcher adopted the same method used by some other thermal comfort researchers such as Mors et al., 37 Teli et al., 13 Trebilock et al., 15 Yun et al. 38 by positioning the measuring instrument at a single central location in each of the surveyed classrooms. For the ‘open-space’ classrooms, where the subjects occupied only a portion of the classroom space, the measuring instrument was positioned at the central area they occupied. The data values were automatically measured and recorded every 5 min. The survey was performed twice daily (morning at 09:00 a.m. and afternoon between 13:00 and 14:00 p.m.). At that time, in the morning hours, the children were expected to be in class (class starting at 08:00 a.m.) and were assumed to be sufficiently adapted to the temperature in the classrooms at 09:00 a.m. and were either seated and writing or listening to their class teacher. The questionnaire was then administered at this period they have settled down to approximately sedentary levels with their metabolic rate approximated at 1.2 MET. The clothing value during the survey period was estimated based on the spot observation of what they were wearing during the survey period and was categorized as light summer clothing and averaged 0.38clo. It is important to mention that primary school children in public schools in Nigeria wear government approved uniforms as dress code and the pattern of clothing between the boys and girls do not vary much (shown in Figure 6).
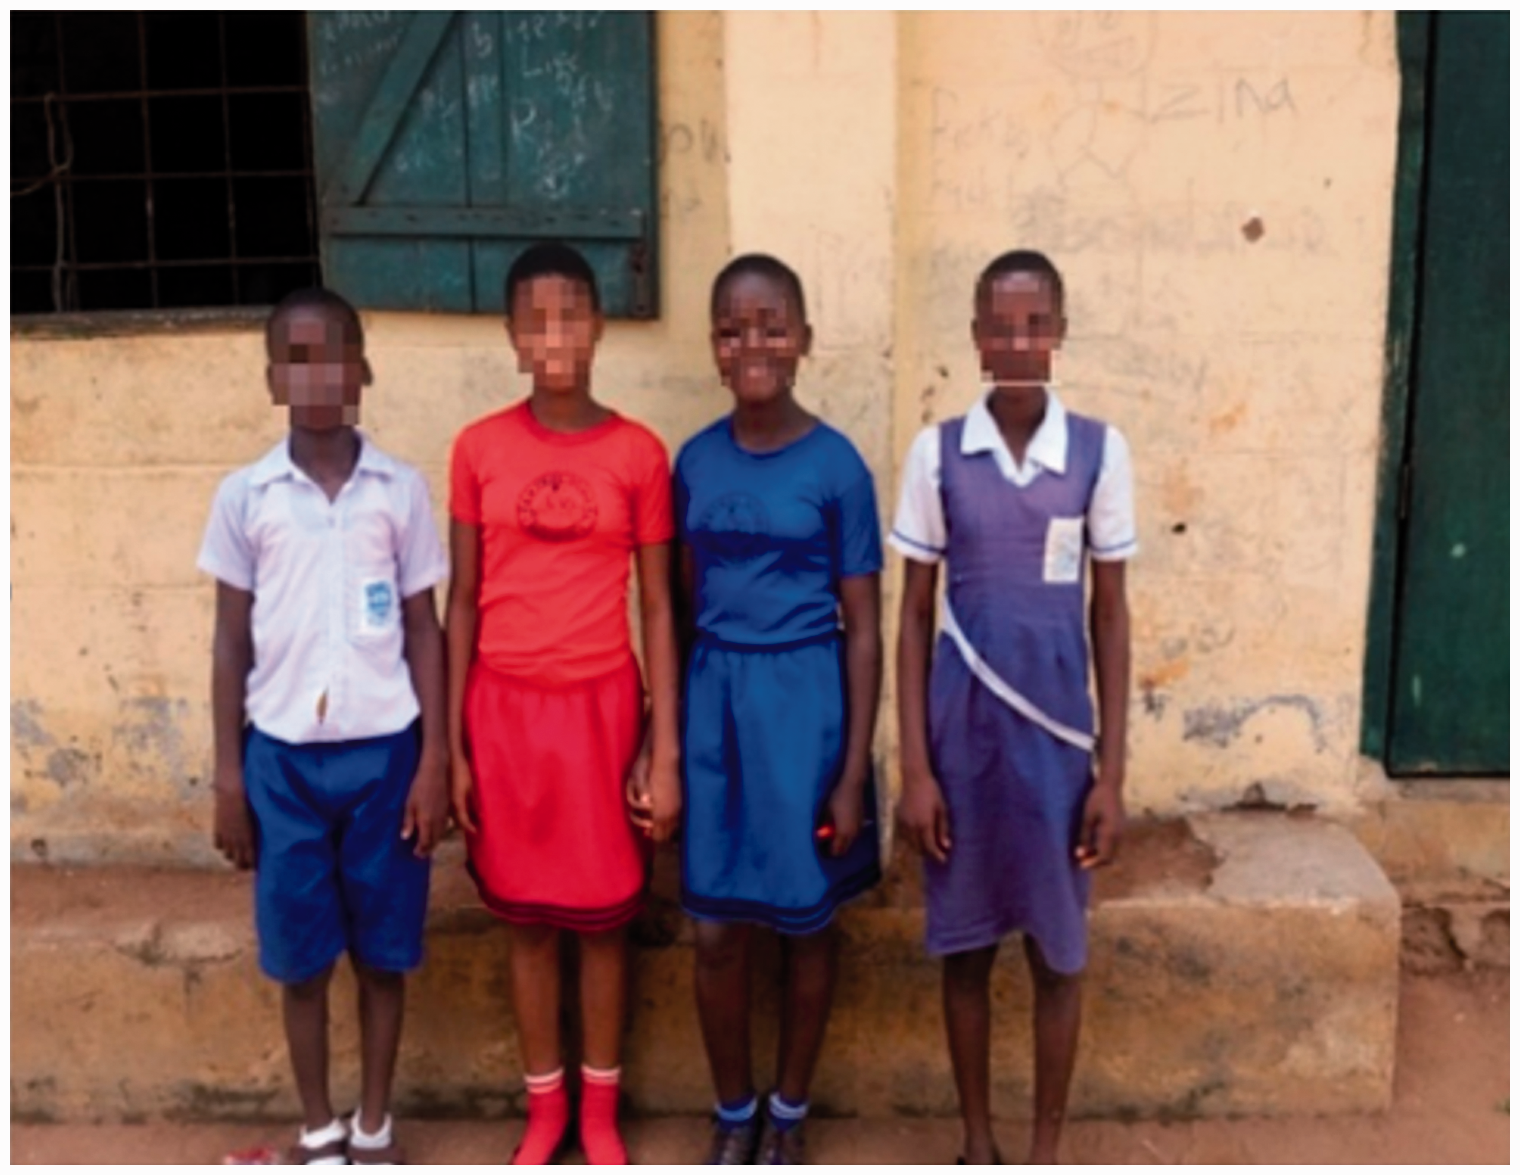
Dress code of the school children.
For the subjective assessment, the questionnaire administered to the children was aimed at evaluating their thermal comfort perception as it relates to their classroom indoor thermal variables and how their perceptions were influenced by the architectural characteristics of the classrooms. The questionnaire was adopted from the previous commonly used thermal comfort questionnaire and was designed in plain English language to avoid ambiguities. After discussions with the class teachers, the word ‘neutral’ was replaced with the word ‘Okay’, a word the children were more familiar with. Table 6 shows the ASHRAE thermal sensation questionnaire adopted in the survey.
ASHRAE thermal sensation scale.
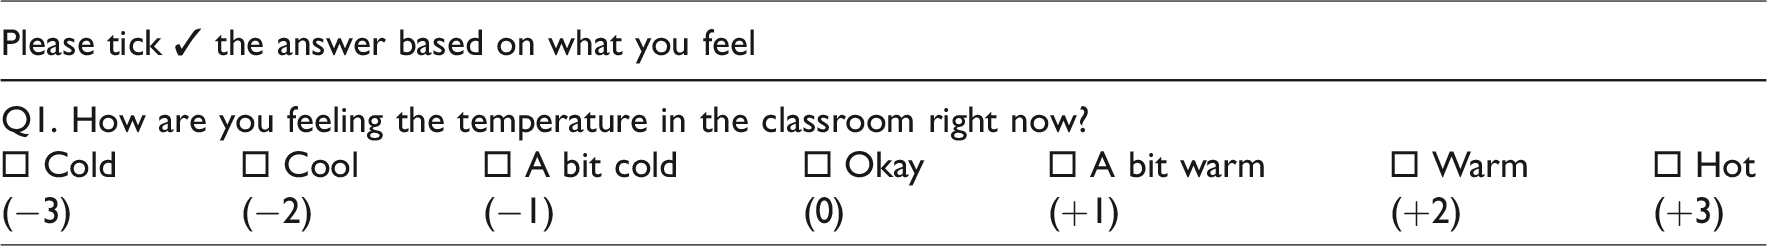
To ascertain the thermal environment the young children in the classroom classify as desirable, ASHRAE seven-point thermal sensation scale ranging from −3 (cold) to +3 (hot) was adopted. After the survey, the administered questionnaire was checked and rechecked against possible unanswered questions and those that ticked more than one answer. Those who indicated not being healthy but still wished to participate in the survey were allowed, so that they would not feel overlooked. However, their questionnaires were not considered during data analysis. The most common illness in the study area, especially among children, is locally referred to as ‘malaria’ which causes more than a normal high body temperature. Such cases of uncompleted questionnaires and ill health constituted only 4.8% of the population that participated in the survey.
Method of analysis
The neutral temperature is the temperature at which most people vote for neutral (okay) on the seven-point ASHRAE scale. Linear regression analysis is one of the popular methods used to determine the subjects’ comfort temperature.2,19,31 In this study, a linear regression model of mean thermal sensation (TSV) was carried out with respect to weighted indoor operative temperature (TOP) using statistical package for the social sciences (SPSS) software package. The thermal neutrality is attained when the individual indicates 0 in the seven-point ASHRAE thermal sensation scale, where the TSV of the subjects are typically expressed as equation (5). By substituting the value of TSV = 0, in any linear regression, between the TSVs and the TOP, a neutral temperature can be predicted. It can also be obtained from the graph where the intersection of regression line with neutral (Okay or ‘0’) thermal sensation gives neutral temperature of the studied population. Neutral temperature obtained by regression analysis is often adopted by thermal comfort researchers to compare with previous studies.39,40
The comfort range of the young children can be determined using thermal comfort indices such as the predicted mean votes (PMV) established by Fanger and Toftum
41
or the adaptive method established by de Dear and Brager.
42
In this study, the ASHRAE adaptive model that sets an 80% comfortable zone, −0.85 ≤ TSV ≤ +0.85,1,7 was adopted to determine the thermal comfort range

Results
Subject’s information
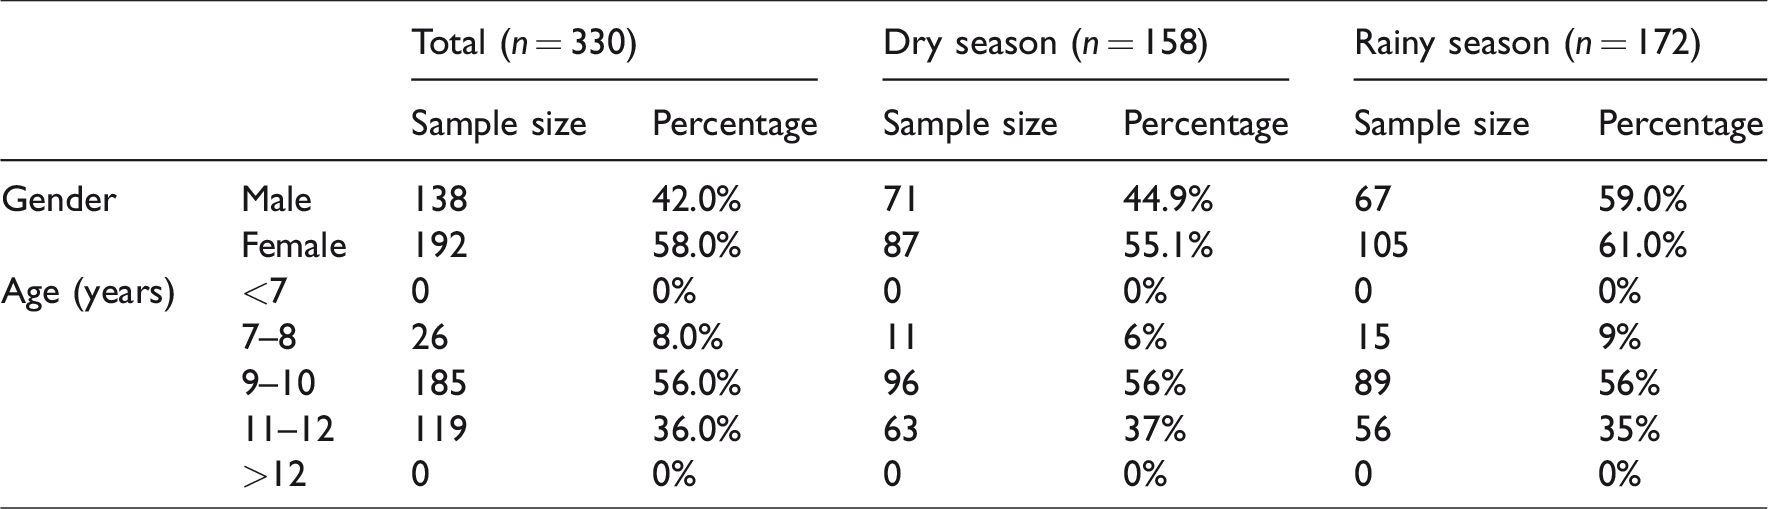
Table 7 gives details of the respondents’ background. The sample constitutes returned responses from 7050 valid returned questionnaires drawn from 330 primary school children aged 7–12 years in six naturally ventilated classrooms. All the classrooms in the study area were naturally ventilated and none had any active ventilator such as an air-conditioning system or a fan. A set of 158, representing 47.8% of the school children participated in the dry season survey, while 172 children, representing 52.2%, participated in rainy season survey. Further detail show that the number of female participants was more (58%) compared to the male (42%) during both seasons. Female constituted 55.1% and 61.0% for rainy season and dry season, respectively, against 44.9% and 59.0% for rainy season and dry season, respectively, for men. Most of the children (56.0%) were within the age range 9–10 years. Of all the participants who were surveyed, none was less than 7 years or more than 12 years. Majority of the participating children (96%) were born in the study area, Imo state.
Respondents’ background information.
Measured and calculated thermal variables
Figure 7 displays the graphical representation of temperature downloaded from the data logger, while Table 8 provides the summary of the measured indoor and outdoor thermal variables in the surveyed classrooms and the thermal responses of the school children. A mean operative temperature (TOP) for all six classrooms during both seasons is 29.1°C. The indoor operative temperature varies from 22.5°C to 35.6°C during the survey period, with a standard deviation of 1.7. The mean outdoor temperature for all the six classrooms is 29.6°C during the same survey period with range from 23.0°C to 37.4 °C with 1.7 as the standard deviation. The relative humidity varies from 24.0% to 94.2% with a mean value of 71.2% and standard deviation of 12.4. Recorded mean air velocity in the combined classrooms is 0.19 ms−1, with a maximum value of 0.30 m/s.
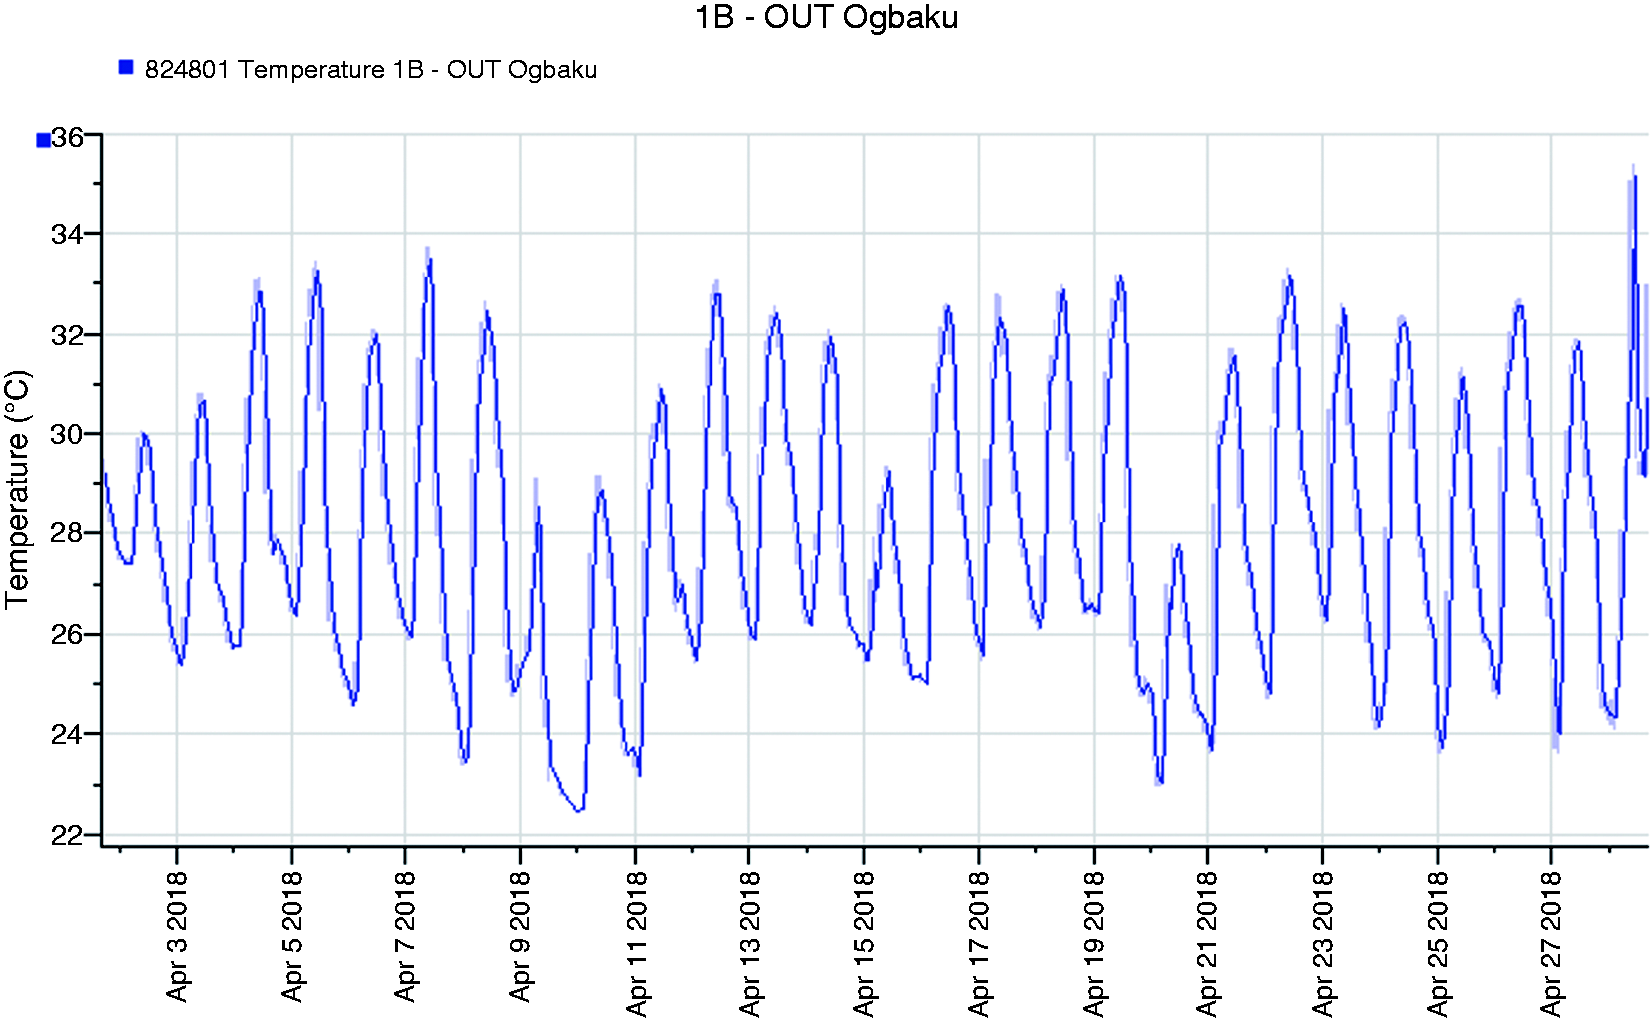
Sample graphical representation of temperature data from logger.
Mean, standard deviation, coefficient of variation, minimum and maximum values of the main environmental parameters and mean thermal sensation votes (TSV( mean )) of the six classrooms over the survey period (dry season dates: Jan, Feb, April 2018; rainy season dates: Oct, Nov 2017, May 2018).
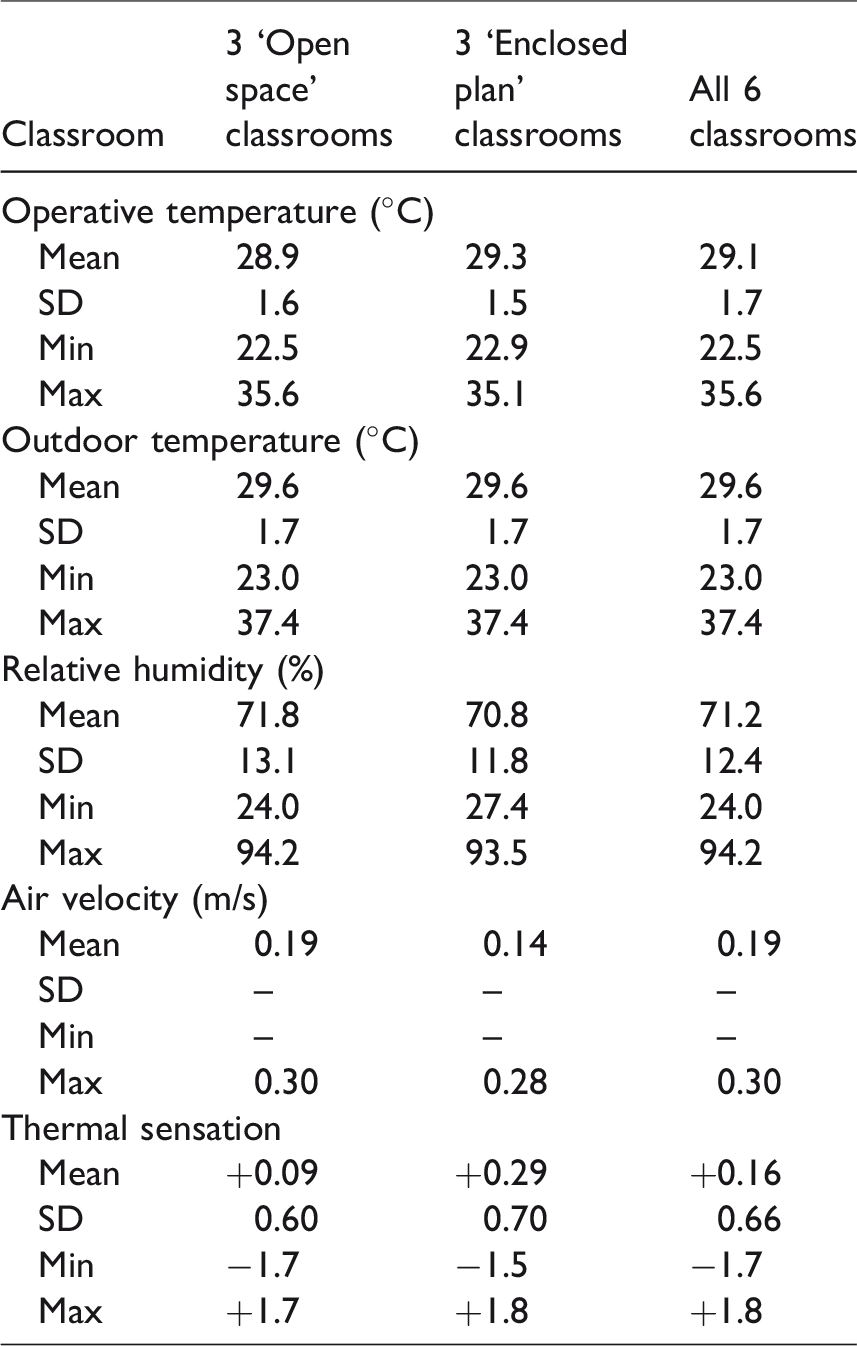
According to classroom type, mean indoor operative temperature for the ‘3 open-space’ classrooms and ‘3 enclosed-plan’ classrooms are 28.9°C and 29.3°C, respectively. The young children expressed in their voting mean thermal sensations with values +0.09 and +0.29 in the combined ‘open-space’ classrooms and combined ‘enclosed-plan’ classrooms, respectively.
Neutral temperature
The regression of the operative temperature against the thermal sensation votes for the combined ‘open-space’ classrooms and the combined ‘enclosed plan’ classrooms produced the regression equations (6a) and (6b), respectively. From these equations, neutral temperature, or optimum temperature, corresponding to a vote of 0 (okay) in the seven-point ASHRAE thermal sensation scale was obtained by substituting the TSV in equations (6a) and (6b) with value 0. The equations produced 28.8°C and 28.1°C as the neutral temperatures for the sampled pupils in combined ‘open space’ classrooms and the combined ‘enclosed plan’ classrooms, respectively. This neutral temperature can also be obtained from the scatter plot (Figure 8), from the intersection of the regression line with neutral (Okay) or ‘0’ thermal sensation of the studied sample population


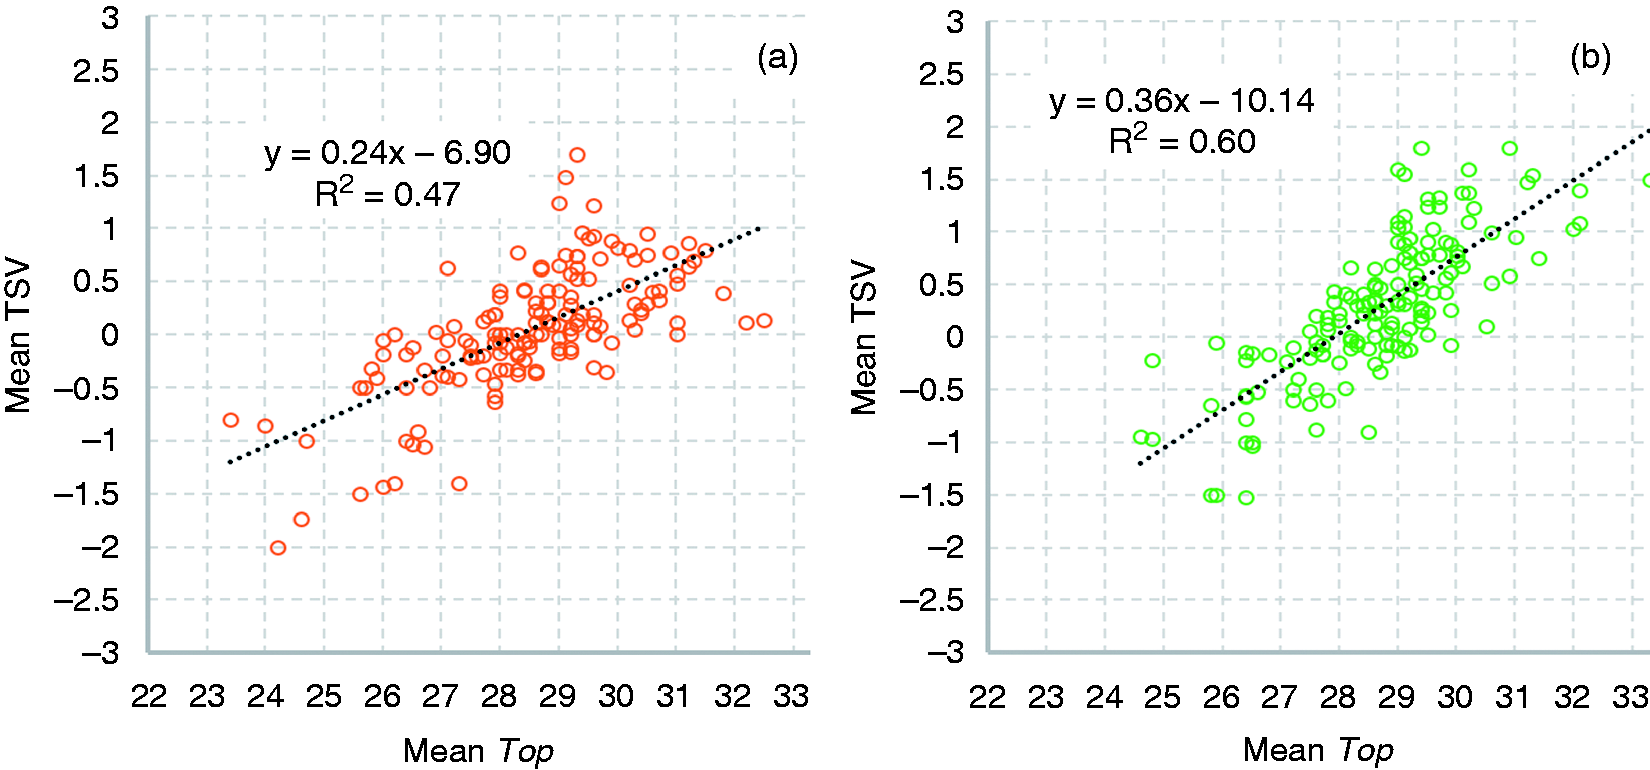
Bivariate scatter plot of mean thermal sensation votes against indoor operative temperature during both seasons: (a) in the three ‘open-classrooms’; and (b) in the three ‘enclosed-classrooms’.
Comfort range
Thermal comfort range of a studied population can be obtained, considering the predicted mean thermal sensation votes in the range −0.85 to +0.85.1,7 The comfort range (acceptable indoor temperature) for the pupils in the warm humid climate in the combined ‘open-space’ classrooms is from 25.2°C to 32.3°C. This was determined from the linear regression of the thermal sensation votes and the mean indoor operative temperature from the field work that produced the equation TSV = −6.90 + 0.24x. The comfort range for the combined ‘enclosed plan’ classrooms is from 25.8°C to 30.5°C, obtained from regression equation TSV = −10.14 + 0.36x.
Discussion
Thermal performance in the two types of classrooms and the responses of the children to the thermal sensation question
The two types of classrooms recorded different minimum, maximum and mean values in the indoor operative temperatures and relative humidity. Furthermore, the lower mean value of the indoor operative temperature in the combined ‘open-space’ classrooms may be an indication that the occupants in the classrooms expressed their indoor environment ‘cooler’ than those in the combined ‘enclosed-plan’ classrooms. The results of the thermal sensation votes where the surveyed young children in the combined ‘open-space’ classrooms voted a lower mean value (+0.09) compared to the subjects’ mean vote in the combined ‘enclosed-plan’ classrooms (+0.29) is another indication that the occupants in the combined ‘open-space’ classrooms expressed their environment ‘cooler’.
The adaptive model relates the indoor operative temperature with the outdoor temperature in considering the thermal comfort of building occupants. Usually, correlation between these two variables is run to determine their degree of relationship. A high correlation between the two indicates that as the outdoor temperature increases, the indoor temperature also increases. On the other hand, a low correlation indicates the reverse. As shown in Table 9, a bivariate correlation analysis conducted in this study found a statistically significant relationship between the indoor operative temperature and the outdoor temperature in all the surveyed classrooms, except in classroom COP and CEN in dry season. The reason may be linked to the month the survey was conducted. The dry season survey in school C was conducted in the month of January. This month is characterized by high variations in temperatures and is usually one of the hottest month of the year. Furthermore, the classrooms in school B reported the highest correlation in the two seasons. This may be related to the steady temperatures in the months of November and April the surveys were conducted in the school.
Correlations between the indoor operative temperatures and the outdoor temperatures in each classroom with statistically significant relationship (p < 0.05).
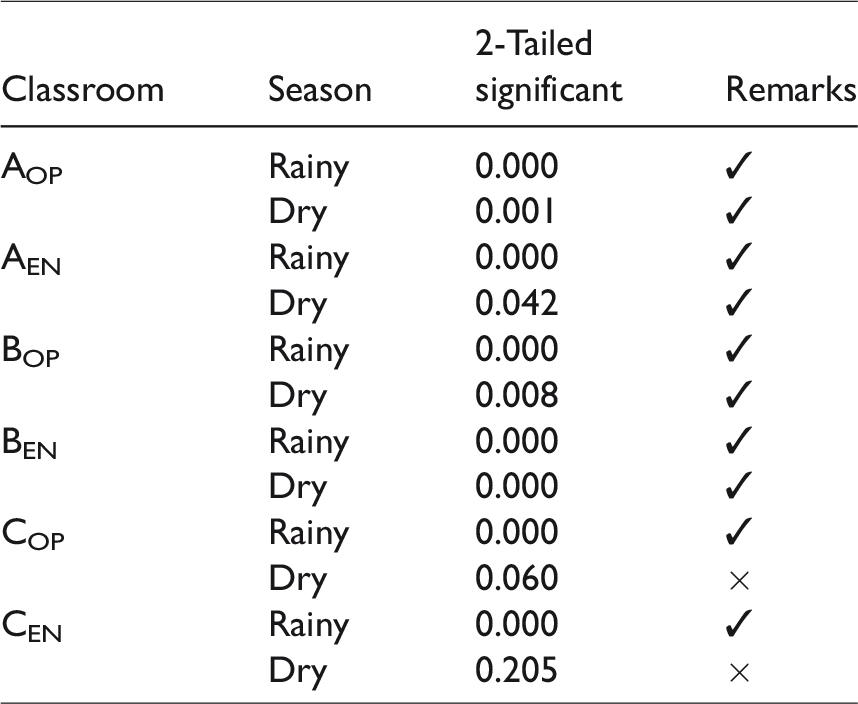
The indoor operative temperatures in the ‘open-space’ classrooms showed higher collinearity with the outdoor temperatures compared with the ‘enclosed-plan’ classrooms. This implies that the indoor operative temperature observed in the ‘open-space’ classrooms followed more closely with the change in the corresponding outdoor temperature than the ‘enclosed-plan’ classroom. These are indications that the thermal performance in these two types of buildings differs, and the reason may be because of the differences in their architectural compositions. This agrees with Nicol and Roaf 43 who posit that in free running buildings, the relationship between indoor and outdoor temperature is largely decided by the form and materials of the building.
Comparing neutrality with other studies
The neutral temperatures produced in this field work for both types of classrooms (28.8°C and 28.1°C) agree with the neutral temperature range 24.5–28.9°C reported by Zomorodian et al. 24 as that obtainable in group A classified by Koppen-Geinger as tropical/mega thermal climates. Also, this is closely related to neutral temperatures reported in some other studies on thermal comfort in Nigeria. The neutrality is closely related to Tn = 28.4°C obtained by Akande and Adebamowo, 44 Tn = 28.2 from Adaji et al. 45 and Tn = 28.8°C obtained by Efeoma. 28 At a closer examination on Table 10, one will observe that the neutral temperature of some of the studies vary significantly with the ones produced in this study. For example, neutral temperature from the fieldwork of Ogbonna and Harris 2008 46 was lower than this study. The reason for the significant difference is obvious. The work was conducted in Jos Nigeria a location where the temperature is, for the whole year, cooler than the study area of this work. While the temperatures in city of Jos fluctuates between 21.0°C and 30.0 °C, the temperatures in Imo State are more prevalent within the range 28.0–30.0°C. Adunola and Ajibola 47 conducted study in Ibadan and produced a much higher neutral temperature of 32.3°C compared to the one produced in this study. The high difference in the neutral temperature may be because the survey was conducted in April, a month usually associated with dry spell.
Thermal comfort research studies in Nigeria.
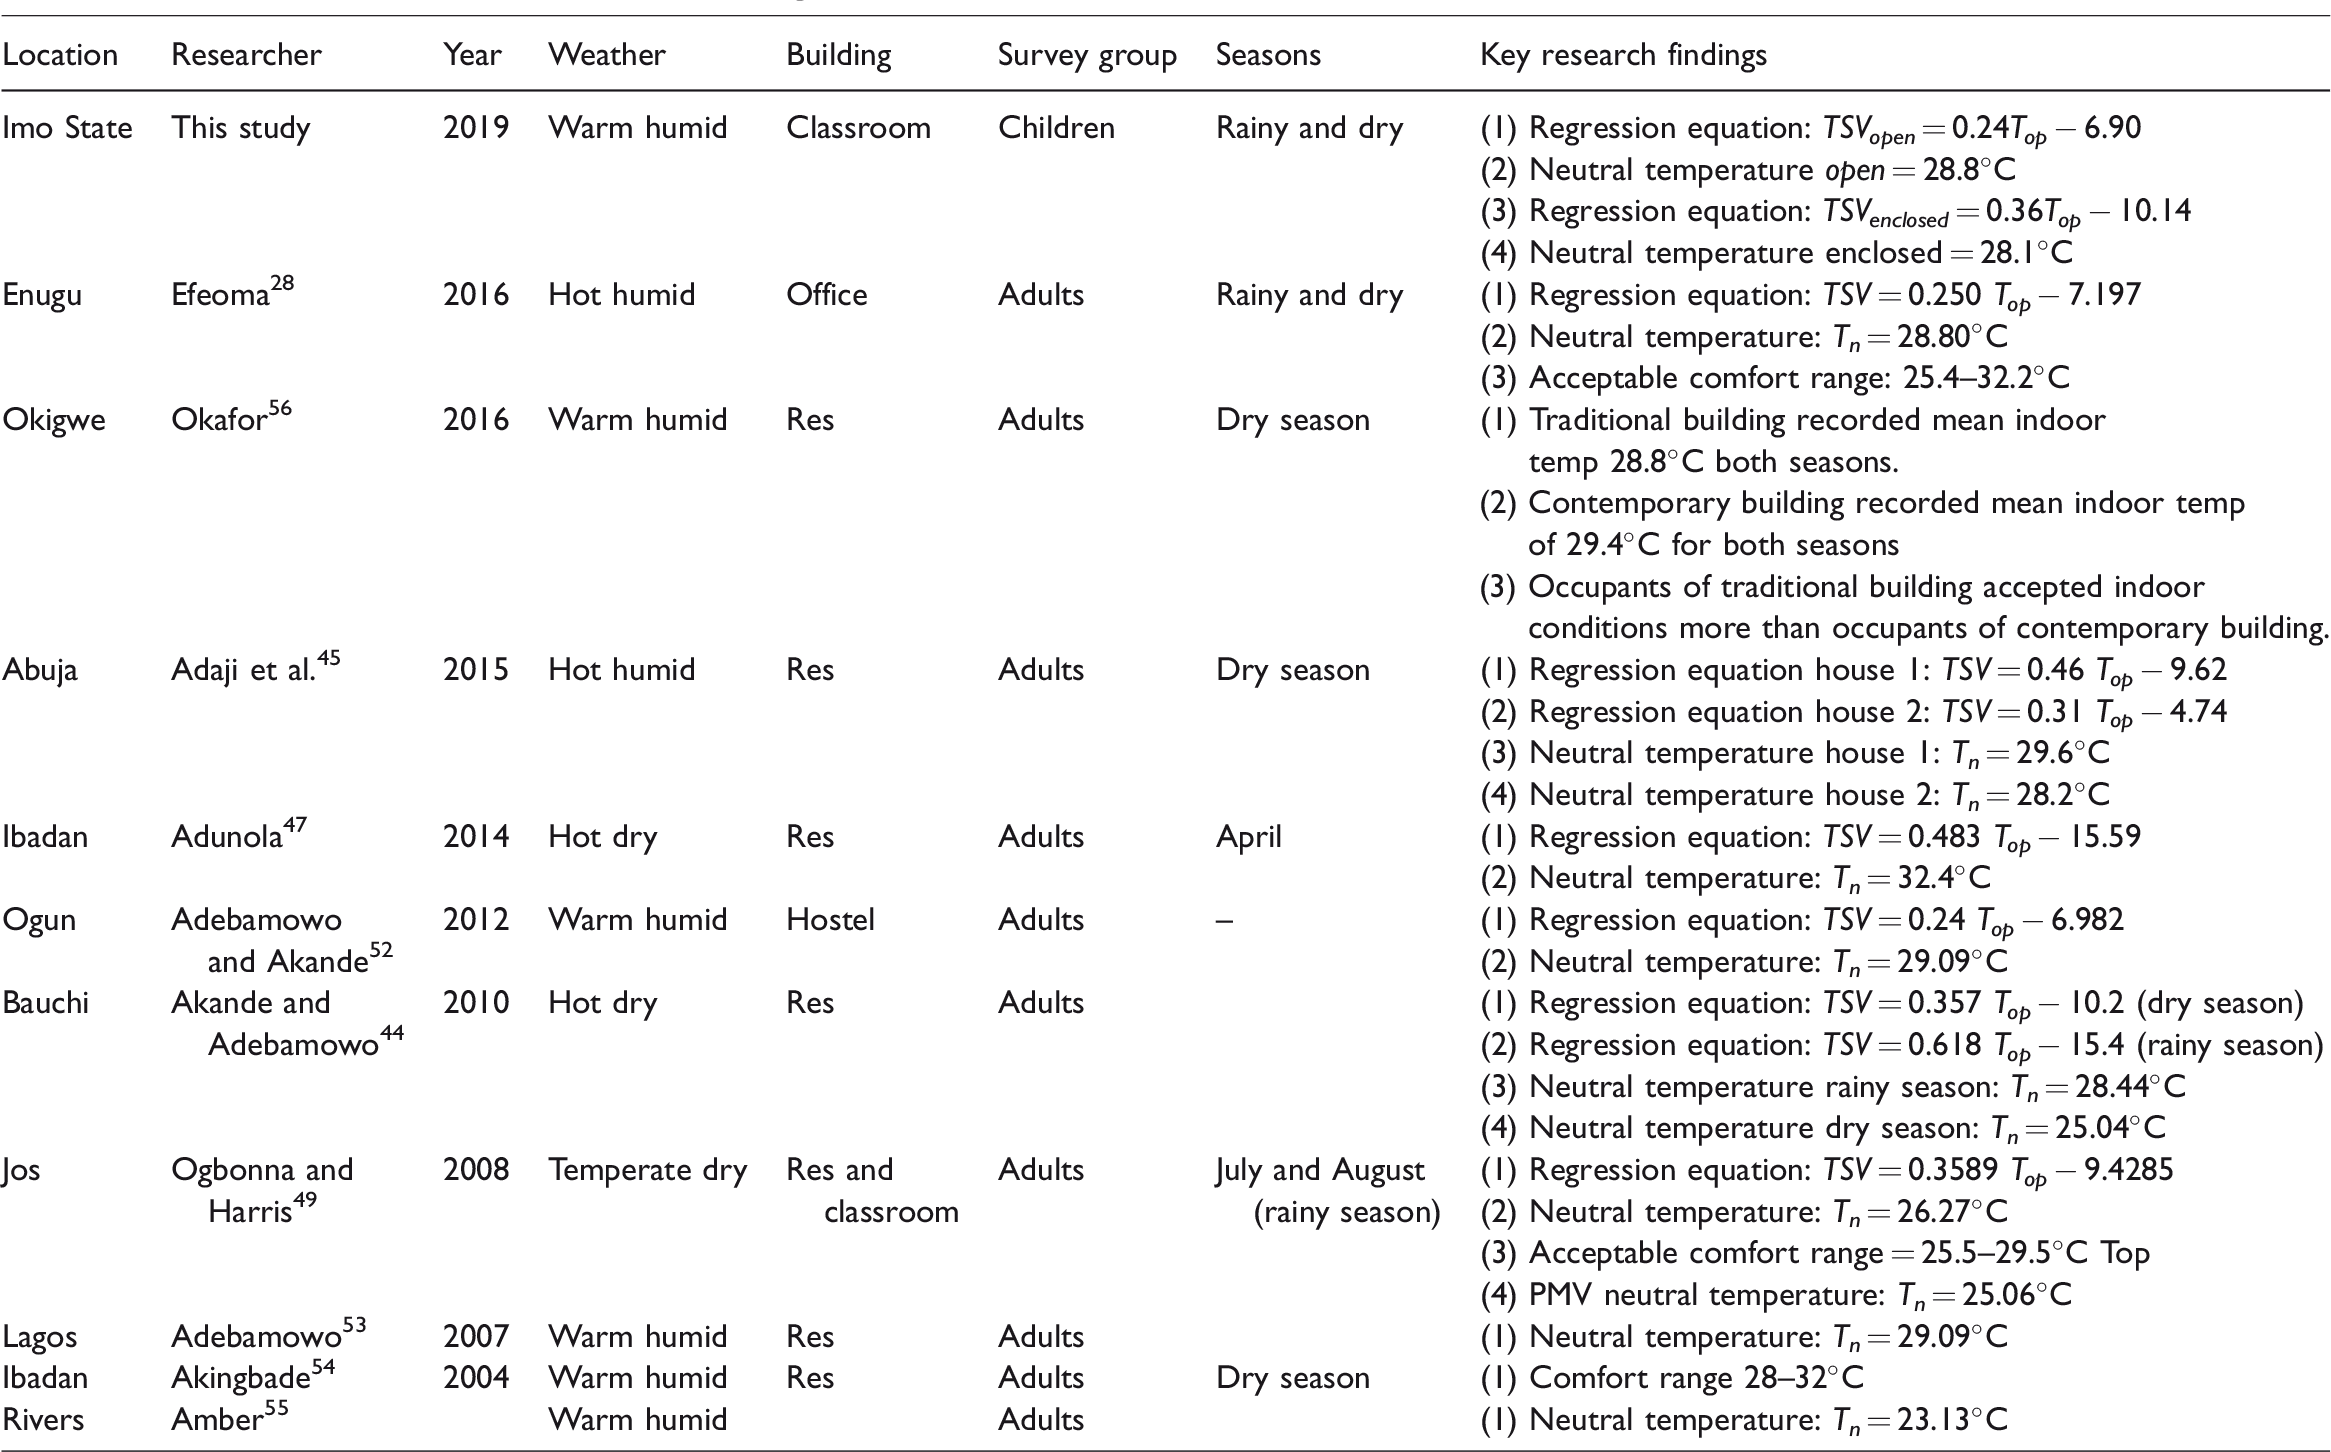
Furthermore, Table 1 is used to compare the results from studies done in other parts of the world with the findings from this work. The neutral temperatures in this work are, to an extent, close to the values obtained in some other studies in other tropical works in naturally ventilated classrooms; 28.8°C in Singapore by Wong and Khoo, 32 28.4°C in Malaysia by Hussein and Rahman, 10 28.5°C by Karyono and Delyuzir 33 in primary school in Tangerang Indonesia, 28.03°C in a school in Mexico a hot and humid environment with comfort range of 25.4°C to 30.6°C. 50 However, the neutral temperature obtained in this study is higher than that obtained from the same tropical environment in Ghana (26.0°C) by James and Koranteng. 51 A closer look at other variables that can influence and vary thermal perception of people reveal that the mean outdoor temperature of 26.8°C that was recorded in the survey in Ghana and the mean outdoor temperature in this study (29.6°C) could be the reason for the difference in the recorded neutralities of both studies. Furthermore, the neutral temperatures obtained in a neighbouring country, Cameroon in both seasons; 25.0°C in Douala and 24.7°C in Yaounde, Nematchoua et al. 22 were lower than the neutral temperatures obtained in this study. The reason could also be linked to the lower average temperatures in the two cities compared to that of this study. These results suggest that there is a strong relationship between the outdoor temperatures and the neutrality experienced by building occupants.
Comfort range
Adopting the ASHRAE comfort range between −0.85 and +0.85, the acceptable indoor temperature for the ‘combined-enclosed’ classrooms (25.8°C to 30.5°C) is within the range of 24.0°C to 31.0°C observed by Mishra and Ramgopal 9 from the various thermal comfort studies in classrooms in the tropics. However, the upper limit of the comfort range in the combined ‘open-space’ classrooms was by 1.3K higher than the upper limit of the range observed by Mishra and Ramgopal; however, in the combined ‘enclosed-plan’ classrooms the upper limit was by 0.5K lower.
Comparison of the comfort range in the two types of classrooms indicates that the surveyed children in the combined ‘open-space’ classrooms reported wider comfort range compared to those in the combined ‘enclosed-plan’ classrooms. While the comfort bandwidth in the ‘open space’ classrooms is 7.1K, that of the combined ‘enclosed-plan’ classrooms is 4.7K, indicating a significant wider band in the ‘open-space’ classrooms compared with the ‘enclosed-plan’ classrooms. Comparison of the comfort bandwidth between the two types of classrooms indicates that the upper limit of the ‘open-space’ classrooms was by 1.8K higher than that of the ‘enclosed-plan’ classrooms. This indicates that the pupils in the combined ‘open-space’ classrooms have more tolerance to the variabilities in the indoor operative temperature compared with those in the ‘enclosed-plan’ classrooms. This may partly be attributed to the generally higher indoor air flow recorded in the ‘open-space’ classrooms which aided in the removal of excess heat accumulated by the children, helping them to tolerate the indoor thermal conditions more. Increased air velocity has been reported as helping to offset thermal discomfort experienced by building occupants. This is an important consideration in adaptation, in view of the world-wide concern about the continuous temperature increase caused by climate change.
Conclusion
This article evaluated the thermal conditions and the perception of indoor thermal environment by children in two types of naturally ventilated classroom buildings during the rainy and dry seasons in the warm and humid environment in Nigeria. The need to understand the temperature threshold considered acceptable by children in this locality necessitated this study. Both objective and subjective evaluation methods were adopted to determine and compare the thermal conditions in the classrooms used for class lessons. The thermal sensations, neutral temperatures and comfort ranges were determined through statistical analysis. The findings were also compared with other related studies. The following are the key conclusions of the study:
The two categories of classrooms evaluated: the combined ‘open-space’ classrooms and combined ‘enclosed-plan’ classrooms reported 28.8°C and 28.1°C as neutral temperatures, respectively, indicating a significant difference in the thermal conditions between the two types of classrooms. These neutral temperatures agree with most results from other studies conducted in primary schools in a tropical setting. For the combined ‘open-space’ classrooms all seasons, it will take up to 4.2°C (0.24 as slope) change in indoor operative temperature for the pupils to experience 1 unit change in their thermal state, while for the combined ‘enclosed-plan’ classrooms all seasons, it will take only 2.8°C (slope 0.36). This indicates better adaptation in the ‘open-space’ classrooms. The regression gradient from this study, for both types of classrooms all seasons (0.24 and 0.36), agrees with the findings from most other thermal comfort studies in naturally ventilated primary school buildings. This further confirms the suggestion that children are less sensitive to temperature changes than adults. Adults usually produce higher regression gradients. The comfort range of the studied sample in both classroom types, 25.2°C to 32.3°C and 25.8°C to 30.5°C in ‘open-space’ classrooms and ‘enclosed-plan’ classrooms, respectively, are indications of higher tolerance to thermal conditions than the values recommended in ASHRAE standard 55. The comfort ranges, from this study, extended the upper limit of ASHRAE 55 comfortable temperature.
The results clearly show the differences in the thermal performance and occupant’s acceptability in both types of classroom buildings adopted in this study. Thus, building characteristics also determine the thermal perceptions of building occupants. The finding in this work highlights the importance of considering appropriate designing strategies and the choice of sustainable building materials when constructing school buildings. These will help in providing thermally comfortable indoor environments and could also help to reverse the current trend in the installation of air-conditioning systems in classroom buildings in Nigeria. Findings from this work are not generalized to apply beyond the climatic zone of this study.
Footnotes
Acknowledgements
Thanks go to the Federal Government of Nigeria who awarded TETFUND scholarship to the author to conduct research work at the University of Salford, UK.
Declaration of conflicting interests
The author(s) declared no potential conflicts of interest with respect to the research, authorship, and/or publication of this article.
Funding
The author(s) received no financial support for the research, authorship, and/or publication of this article.