
Abstract
With the help of building diagnostics, the causes and solutions to complex problems in buildings can be determined. In central and greater London, an increasing number of cases of chronic, year-round, overheating in buildings have been reported. We present three cases of unexpected temperatures in multi-storey residential buildings. Detailed analysis and modelling of these scenarios have led to an investigation of whether the way in which infiltration is currently modelled in building performance simulation may be exerting a pronounced effect on the results of overheating studies. An EnergyPlus model, of one of the dwellings in a multi-residential building in London, was created to investigate the influence of infiltration and exfiltration pathway assumptions on the prediction of overheating. The simulation results were compared to empirical data and show that the predicted indoor temperatures are highly sensitive to how the infiltration airflow network is modelled. The findings of this study have been used to provide practical guidance for modellers and building designers on critical aspects to consider when creating building performance simulation models to ensure more reliable outcomes.
Practical application
Overheating in buildings is an emerging topic of critical importance to the future of the built environment. The importance of understanding infiltration pathways in assessing and modelling overheating risks in flats and multi-residential buildings has been hitherto underestimated or simply ignored. In this paper, examples are given which highlight the need for a fuller understanding of internal air movement where accurate predictions of internal temperatures are required. At present, common building simulation practices and existing technical memorandum (TM) standards are masking the problem and do not provide a basis from which typical or worst-case scenarios can be adequately considered.
Keywords
Introduction
As part of a building diagnostic study that took place in 2015, a number of cases of chronic (i.e. year-round) overheating were investigated in greater London. 1 It is notable that the climate of 2015 does not rank amongst the hottest 10-years in the UK record. Whilst 10 of the hottest years ever recorded in the UK have all occurred since 2002. 2 The year 2015 can be considered a relatively cool year during this recent period. In this paper, we address a critical and neglected aspect of current practice in relation to overheating risk assessments carried out in multi-residential buildings. Three case study examples from three flats located in two adjacent multi-storey buildings in central London, UK are used to provide empirical evidence of the problem of correctly accounting for inter-zonal air flow pathways in the assessment of overheating risks. The thermographic images we present were taken over a series of months (i.e. in May, July and November) during 2015. It is highly apparent that in some cases the normal means of rejecting heat did not appear to be working as intended. For example, opening a window when the outside temperature is cooler than the inside temperature does not necessarily lead to cooling of the internal temperature of the space.
In this work, we attempt to model some of the complex air-flow effects shown in these examples (i.e. infiltration/exfiltration pathways) using different modelling assumptions and procedures to demonstrate the impact this may have on the predicted temperature evolution within the flats. To our knowledge, this work presents the first empirically supported evidence of the specific issues of modelling infiltration and exfiltration pathways in multi-residential buildings, with the main objectives of this study being as follows:
To understand the importance of assessing infiltration and exfiltration pathways more robustly in multi-residential buildings linked by communal corridors. To demonstrate the importance of infiltration as a significant contributory factor in reducing the discrepancy observed between building performance simulations (BPS) and reality To propose how future simulation-based overheating risk assessment methodologies, accounting for infiltration and exfiltration, could be improved, with the aim of achieving more consistent and robust outcomes.
Building diagnostics, evidence of unexpected temperatures within multi-storey buildings
The following three case studies provide examples of chronic overheating and evidence of the role of infiltration/exfiltration pathways. The true nature of air movement within multi-residential buildings is complex and often overlooked in relation to the mass transfer of heat from one zone to another. These issues first became apparent during extensive field monitoring and diagnostic investigations carried out in a number of newly built multi-residential buildings located within greater London, UK. 1
Example 1: Services riser in an unventilated communal corridor
Figure 1 shows the IR image of the second-floor corridor in a multi-flat (five-storey high) apartment building. The outside temperatures at the time the image was taken (in mid-July) were around 20°C. There are two doors shown in the image: the door on the left leads to an electrical riser shaft, whilst the right one leads to the mechanical services riser. The mechanical riser contains communal heating and hot-water distribution pipes serving all floors of the building. The services riser provides a continuous pathway for airflow from the ground floor to the top of the building. The buoyancy-driven stack flow in the riser leads to the air drawn into the shaft at low level being discharged at higher levels, resulting in a continuously ‘warm’ air supply to the upper corridors. This is shown in the thermographic image on the left: where the air entering the corridor is above 30°C (whilst the corridor air temperature is around 23°C). Such effects contribute significant heat gains (year-round) to the corridor and building core; however, they are currently omitted from overheating risk assessment methodologies (such as technical memorandum (TM) 593).
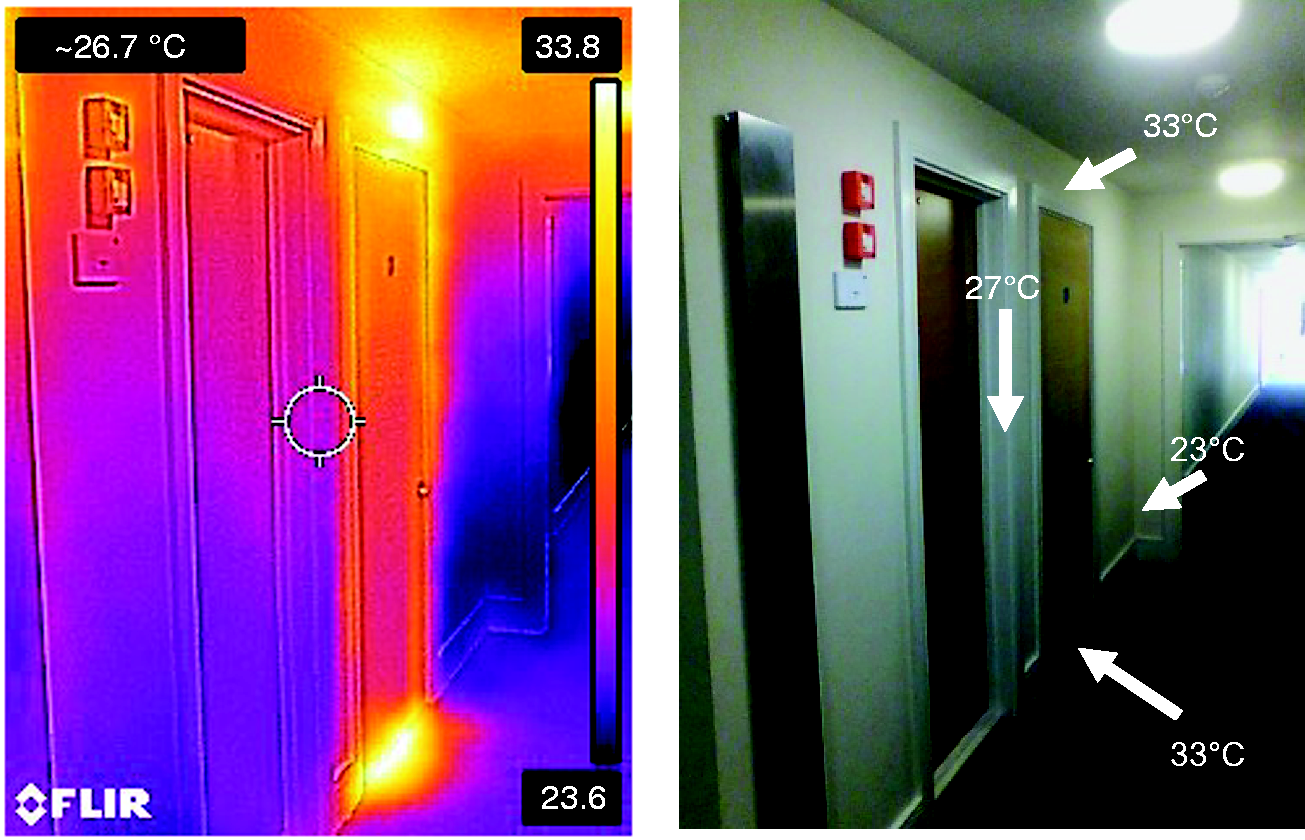
Example 1 – heat emitted from a services riser in an unventilated corridor. The temperature of the air emitted from the riser door is significantly higher (∼33°C) than the surface and air temperatures in the corridor.
Example 2: Wind-driven exfiltration from upwind flats into the communal corridor
The next example (Figure 2) shows a similar building, again from the position of the corridor. Two doors leading to two different flats at first-floor level are shown. The air temperature of the corridor on this day in early November (with an outside temperature of around 15°C) was 28°C. Relatively cool fresh air can be seen (Figure 2) coming into the corridor from underneath the two windward flats, at around 22°C.
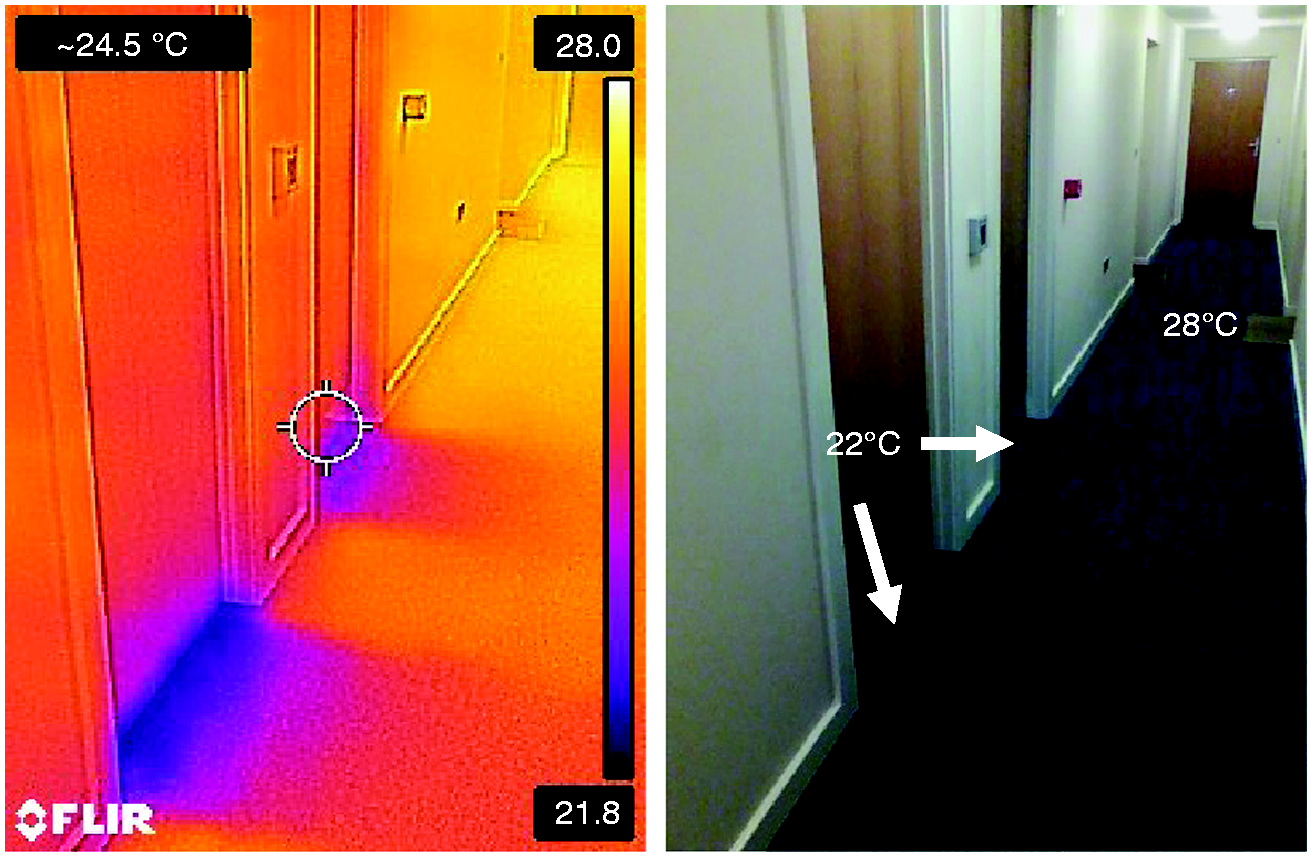
Example 2 – wind-driven (pre-warmed) exfiltration entering a corridor. The air temperature emitted from below the flat entry doors is significantly lower (∼22°C) than the air temperature in the corridor (∼28°C).
The corridor is (indirectly) being continuously heated via the communal heating system distribution pipes that are under the floor and within the ceiling void of each corridor. This results in the surface temperatures of the corridors being warmed (to approximately 28°C), thereby heating the air inside of the corridor.
The flats shown are located on the windward (upwind) side (i.e. facing the prevailing wind). The windows in these flats are open, pressurising the flats and causing the egress of air underneath the doors and into the corridors. Opening the windows in the flats on the leeward (downwind) side, i.e. the side sheltered from the wind results in relatively cool (≈22°C) air being exhausted from the room, i.e. exfiltration, into the corridor. These two examples illustrate the complex (heat source, air-flow pathway and pressure dependent) internal air movement that can occur within large multi-residential buildings.
The normal assumption in BPS is to consider infiltration as a constant (or as being wind pressure dependent), whilst ventilation is treated either as a constant single-zone phenomenon or as part of a dynamic airflow network (AFN) occurring within a single dwelling. But as Figures 1 and 2 show, this has been observed to be an incorrect oversimplification of reality which does not happen in either of these cases. In both of these examples, air ingress/egress occurs beyond the boundary of a single flat and exerts a pronounced effect on the conditions in the adjacent corridor and flats. In Figure 1, the air entering via the gap around a services riser door is contributing to heating the corridor, whilst in Figure 2, the air entering via the gap around a windward flat entrance door is contributing to cooling the corridor. Neither of these effects would be captured by current overheating assessment methodologies such as TM 59. 3
Air which is hot is at a lower density and therefore rises (i.e. the stack affect) and will exit a zone where the air pressure is lowest (i.e. the leeward side). Most models do not adequately consider these fundamental aspects of bulk air transport in the simulation, and overheating is commonly assessed and described in standards such as TM 593 and CIBSE Guide A 4 on a room-by-room basis, where individual zones are not interlinked through whole BPS simulation.
Example 3: The impact of micro-climate
The last example (Figure 3) shows a multi-residential building from the outside, taken on 26 May 2015. The pictures show the top floor of a four-storey building. Whilst the air temperatures are around 18–19°C, the surface temperature of the wall is around 30°C and the surrounding paving slabs are above 40°C. As a result, air within the immediate vicinity of the building is in contact with surfaces that are more than 10°C higher than the free air temperature of the surrounding air-mass away from the building.
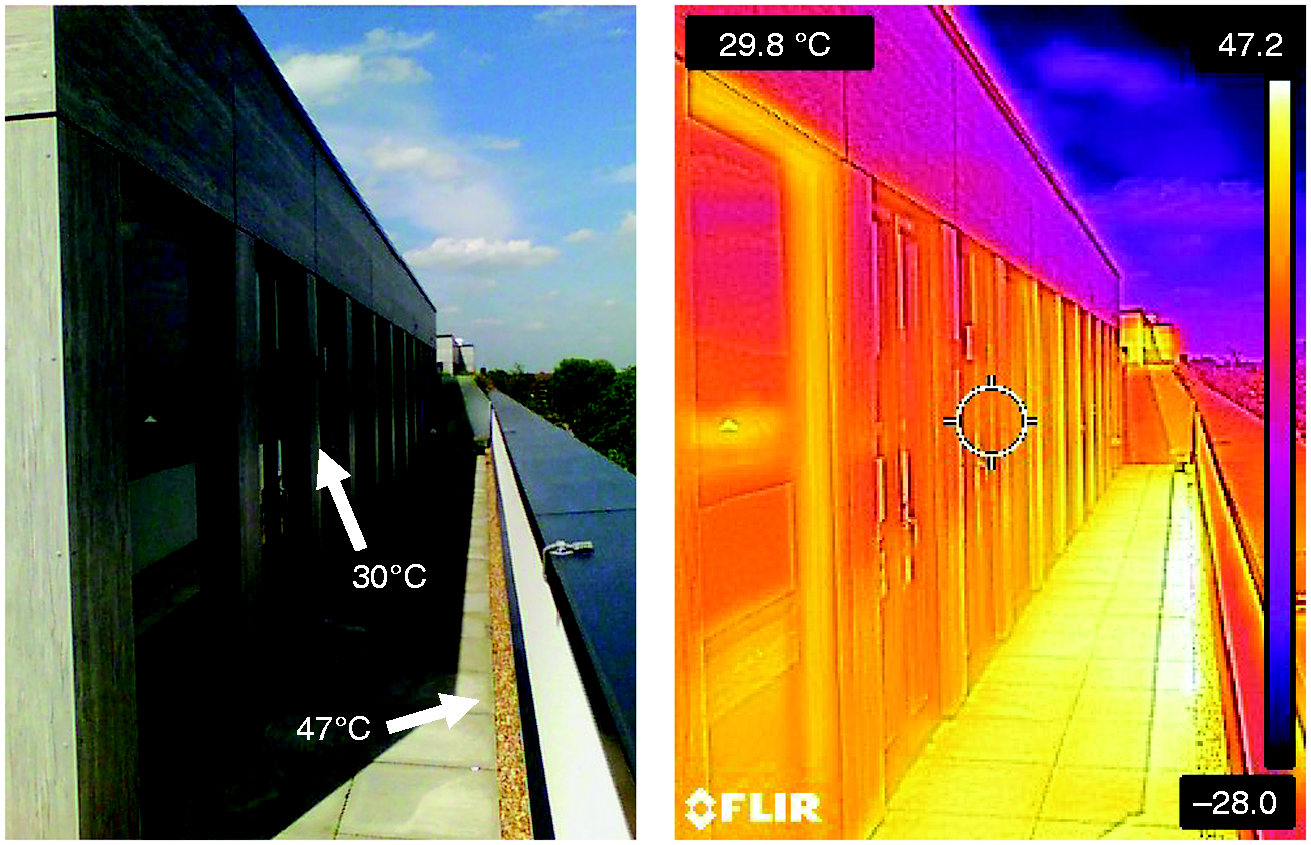
The effects of micro-climate at the building curtilage and the impact on surface temperatures in the proximity of the flat.
The question is, if someone opens the window, does it receive air at the outside free-airstream temperature or will the surface temperature (i.e. sol-air temperature) at the building curtilage have a significant effect on the temperature of the air drawn into the flat? Whilst there has been substantial research on the phenomena 5 and effects 6 of urban heat islands (UHI) on buildings (i.e. the phenomena whereby urban areas are relatively hotter than their rural surroundings), there is far less research into the modifier effects occurring at the immediate curtilage of a building. The immediate micro-climate surrounding a building is governed by the building, other structures and the surrounding surfaces and their composition. Dark and thermally massive surfaces absorb and retain significantly more solar radiation than lighter and reflective surfaces which causes the darker surfaces to heat-up more than their surroundings during the day. On a warm, sunny day (such as the one shown in Figure 3), the sun is shining and heating up the dense concrete pavers and gravel that surrounds the flat. If a window is then opened, the locally heated air above the pavers will be pulled into the flat. Furthermore, the presence of a raised parapet around the flat restricts free air movement and mixing with the cooler air surrounding the building. As a result, the choice and design of the curtilage balcony and guard-rail can be seen (Figure 3) to be exerting a substantial modifier effect on the air ingress temperature into the flat.
Whilst due to its location within greater London the UHI may only be exerting a relatively minor effect upon this building, it is evident that substantive effects caused by the modification of the micro-climate at its immediate curtilage will be unaccounted for in relation to BPS modelling of the air ingress temperatures.
Method
Following the building diagnostic investigation outlined above (and further documented in McLeod and Swainson 1 ), it was possible to obtain access to an unoccupied flat in the same building as described in example 3, however, on a lower floor. 7 The building is of newly built construction, with the residents using the case study flat for short vacations only. They were therefore happy to provide access to the flat for the purpose of monitoring and modelling overheating prevention strategies. The infiltration scenarios that were investigated are based on distinct assumptions regarding the mass transfer of air between the corridor and the adjacent flat(s). This will be explained in the following sections in more detail.
Case study building, monitored and measured data
A second-floor flat located in a multiple occupancy residential building (constructed to comply with Part L 2010 of the building regulations 2010, following the guidance in ADL1A 2010) located in London was investigated. The exterior walls are of brick cavity construction and all of the apertures are double glazed. Furthermore, all the openable windows open inwards and are equipped with safety restrictors. The thermal properties and air flow data of the monitored flats are presented in literature. 1 Background ventilation in the flat is achieved through a whole house mechanical ventilation with heat recovery (MVHR) unit and hot water is provided by a heat interface unit (HIU). This unit also provides space heating through a secondary circuit linked to a distribution manifold (note: space heating was turned off during the entire monitoring period). A detailed description of the above systems can be found in McLeod and Swainson. 1
This single-bedroom flat (Figure 4) has an internal floor area of 46 m2 and is located on the second floor of the building. The flat has only one exterior façade, which is east facing. The north and south sides adjoin other flats, whilst the west side is adjacent to a communal corridor.
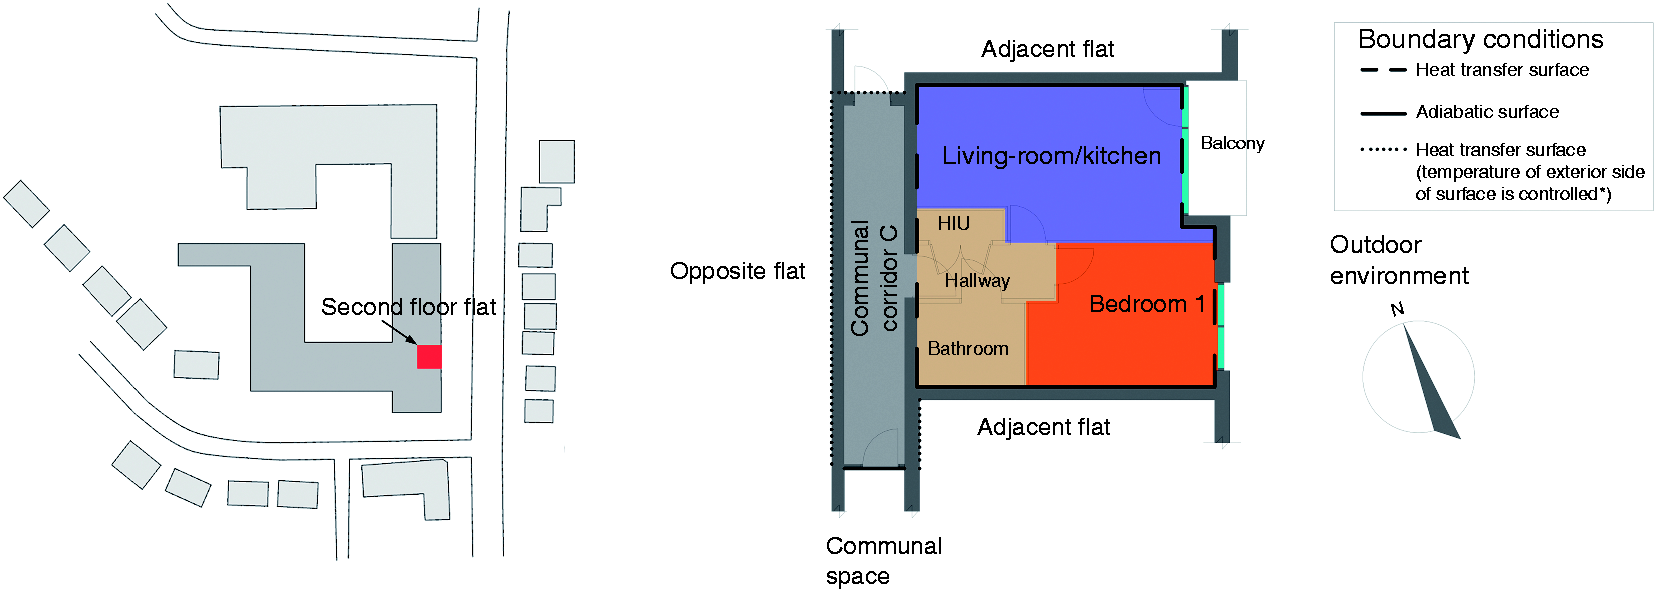
Arrangement of building showing the location (left) and plan of the flat comprising of and six thermal zones (right).
The initial monitoring of the flats took place in October 2015, with the intention of assessing the prevalence of chronic (i.e. prolonged) overheating outside the summer period. For a detailed description of the monitoring protocol and all monitored parameters, refer to McLeod and Swainson.
1
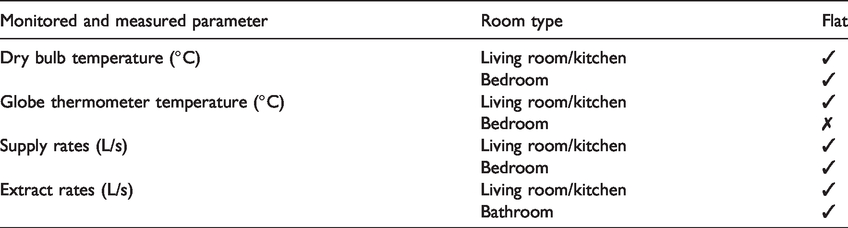
In this previous study, the monitoring of dry bulb
Monitored and measured data used in this study.
Modelling assumptions
For the simulation of the monitored flat using BPS, a bespoke weather file was created. 7 A weather file depicting the actual weather conditions during the monitoring period was essential for the comparison of the simulated data with the monitored data. This was created by gathering data for the time period 1 October to 4 November 4 2015 from the Met Office MIDAS database. Dry bulb temperature, dew point temperature, relative humidity, global horizontal radiation, wind direction and speed data were retrieved from the Kew Gardens weather station (51.48 N, 0.19 W) located approximately 11 km south-west of the monitored development. The missing, atmospheric pressure and total sky cover, weather parameters were obtained from the nearby Northolt weather station (51.55 N, 0.41 W). The opaque sky cover in the absence of recorded values was estimated by assuming 50% of the total sky cover. 8 The components of the global horizontal radiation (i.e. direct normal and diffuse horizontal radiation) are essential inputs in a weather file for BPS purposes and were estimated using a subprogram of the daylighting analysis software Daysim.9,10
In applied mathematics and numerical modelling, the term ‘discretisation’ refers to the process of transferring continuous functions into discrete counterparts. This process necessitates defining system boundaries in order that complex systems can be solved using numerical methods.
11
For the purpose of discretising the geometric model of the flat (in accordance with standard overheating modelling procedures
3
), it was assumed that no heat transfer takes place between the flat and the spaces above and below, so the surfaces are assumed to be adiabatic (i.e. the internal surface temperature and external surface temperature are identical), whereby only the inner surfaces of the ceiling and floor are considered to exchange heat with the modelled zone. This is done in order to eliminate the influence of (unknown) variations in the surrounding flats’ operative temperatures on the heat flux transmitted to the corridor via the bounding walls. In order to achieve this, whilst maintaining the correct corridor air and surface temperatures, the temperatures of the exterior faces of the corridor wall (i.e. the interior faces of the neighbouring flat’s walls bounding the corridor) were derived from equation (1).

where
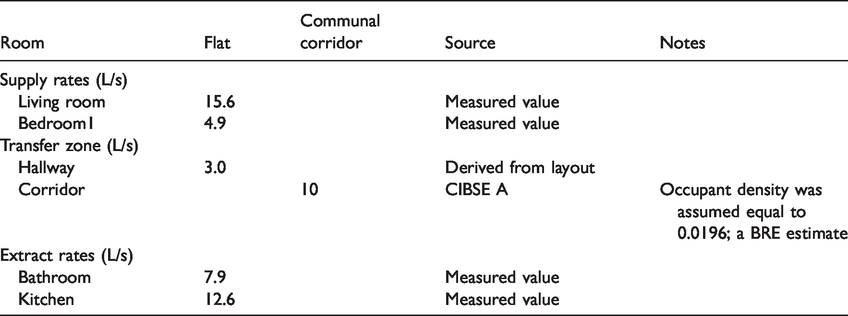
In relation to the operation of the MVHR unit, supply and extract rates for individual rooms were obtained from flow rates measured during the detailed monitoring of the flats (see Table 2). The MVHR unit was in operation throughout the monitoring period. The whole dwelling ventilation rate was found to satisfy the minimum requirements specified by Approved Document F – Ventilation. 13
Ventilation rates in different zones of the flat (based on data measured at room terminals using a balometer with a volumetric flow rate accuracy of ±3%).
The MVHR unit was modelled in EnergyPlus 12 using the Zone Ventilation: Design Flow Rate object in conjunction with the Zone Mixing object to represent the transfer of air from supply zones (e.g. living and bedrooms) to extract zones (e.g. bathrooms).
In terms of the ventilation rate in the communal corridors, in the absence of any measured data, background ventilation flow rates were estimated according to CIBSE Guide A (see Table 2), where the specified design value is 10 L/s/p. In order to calculate the total flow rate in the corridor zone, an occupancy density equal to 0.0196 p/m2 was used (based on the values used in the National Calculation Method (NCM), which is based on a BRE estimate). NCM is a procedure for demonstrating compliance with Building Regulations.
Infiltration scenarios
In the following section, four different modelling scenarios were used to analyse the impact of infiltration and exfiltration pathways, as well as air movement through the flat. The BPS models were created using the widely used freeware EnergyPlus. The infiltration value (ach) for the flat was extracted from the SAP reports. Τhe SAP calculation is based on the air permeability value (q50) divided by 20 to obtain an average infiltration rate (CIBSE Guide A) 4 and multiplied by the shelter factor (i.e. a factor that indicates how well a building is protected from wind). b Accordingly, the infiltration rate was set to 0.26 ach for all scenarios. Zonal infiltration rates were then predicted using the Zone Infiltration: Design Flow Rate object in EnergyPlus by assuming the same value for all thermal zones. The ventilation settings are the same for all the scenarios. The focus of this study was on the impact of different infiltration/exfiltration pathways on the temperature in the assessed flat. For this reason, the ventilation settings remained the same.
Base case: Uniform infiltration
In a previous paper, the results of an EnergyPlus model were presented that was created following the TM 59 procedure. 7 The base case model represents the flat as shown in Figure 4, but does not include any information on occupancy (as it was empty during the monitoring period) and uses the more realistic onsite weather data. In this regard, the study differs from a direct application of TM 59 (where the latter provides clear input requirements for occupancy profiles and climate data). In this paper, the ‘base-case’ scenario can be directly compared to the empirical data gathered on-site. The base case model was chosen, as it reflects current modelling practices applied to a real building. It assumes a fixed (uniform) level of infiltration which was taken directly from the SAP report (although in reality greater uncertainty will exist, and the building regulation Approved Document Part L (ADL) compliance threshold is likely to be used during design stage modelling). The infiltration is equal to 0.26 ach (a value which notionally applies to the whole flat); hence, in the model, this value is used in all of the thermal zones. The base case model therefore assumes uniform infiltration in all spaces, and no air from the corridor is assumed to enter to the flat.
In addition to the base case, three scenarios will be modelled.
Scenario 1: The AFN network
The first scenario is similar to the base case; however, there is no uniform infiltration, as the AFN computes the infiltration rates on each zone separately, whilst the MVHR is continuously on for background ventilation. Additionally, instead of using simple ventilation objects, the simple infiltration/ventilation objects have been replaced with the AFN model. The impact of wind is therefore taken into account via the custom-made weather file that includes wind data. Figure 5 shows the AFN model for the flat. In the absence of measured surface temperatures, this temperature is calculated according to equation (1). At each time-step, an average weighted surface temperature in the modelled flat (i.e. the walls in contact with the communal corridor) is computed in EnergyPlus, and this temperature is ascribed to the walls shown with the dotted line in Figure 5. In other words, it is assumed (in the absence of any other information) that the other flats in the building are operated exactly as the modelled flat.
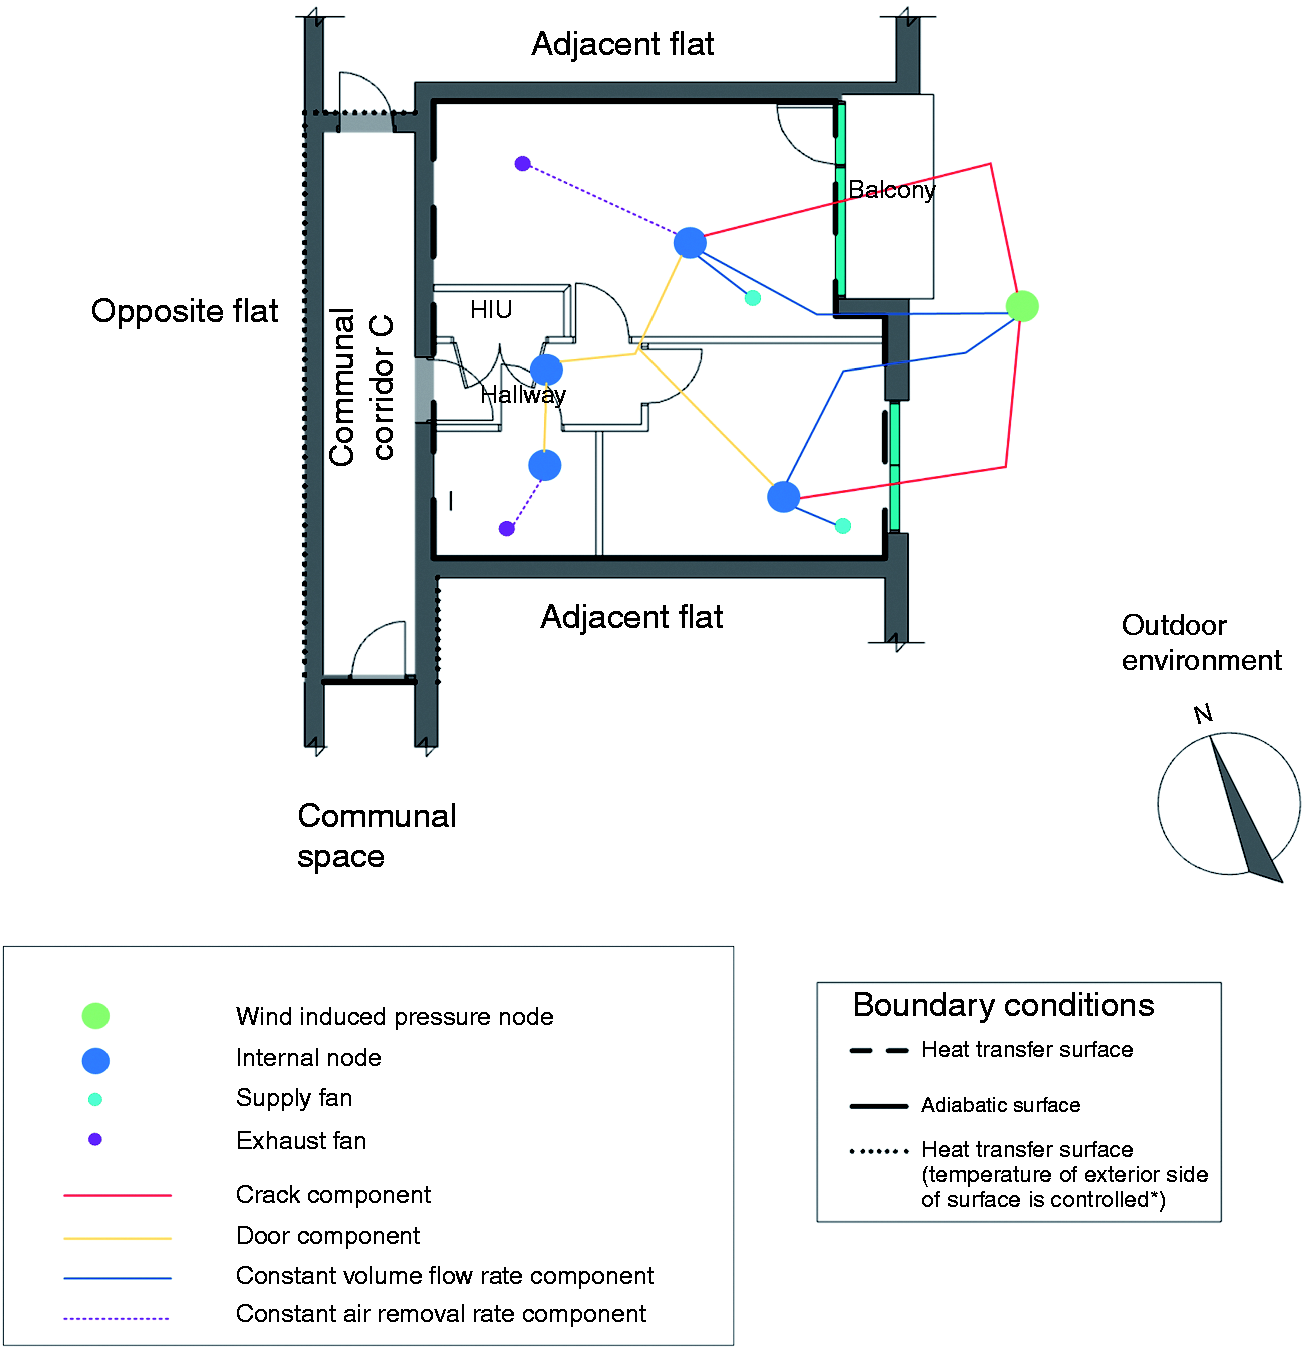
Scenario 1-Airflow network (AFN) model of the flat.
AirflowNetwork:MultiZone:Surface:EffectiveLeakageArea for the exterior walls of the flat: This numeric field (Table 3) is used to input the effective leakage area in m2. The effective leakage area is used to characterise openings for infiltration calculations.
14
Effective leakage area as entered in the EnergyPlus model to be inserted in m2.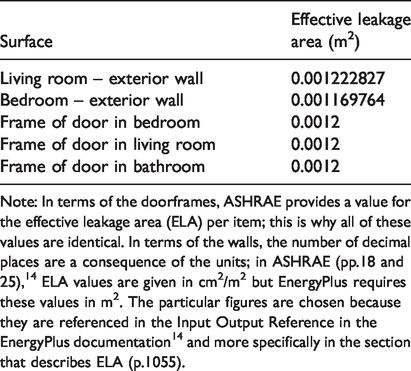
Note: In terms of the doorframes, ASHRAE provides a value for the effective leakage area (ELA) per item; this is why all of these values are identical. In terms of the walls, the number of decimal places are a consequence of the units; in ASHRAE (pp.18 and 25), 14 ELA values are given in cm2/m2 but EnergyPlus requires these values in m2. The particular figures are chosen because they are referenced in the Input Output Reference in the EnergyPlus documentation 14 and more specifically in the section that describes ELA (p.1055).
AirflowNetwork:MultiZone:Component:DetailedOpening for specifying the properties of air flow through windows and doors (window, door and glass door heat transfer sub-surfaces) when they are closed or open. In the model, the windows and external doors are always closed (since the flat was unoccupied) and the interior doors assumed to be always open. The doors are modelled as non-pivoted, with opening dimensions of 2.10 m × 0.9 m for the doors in the bedroom and in the living room and 2.1m × 1.0 m in the bathroom. The degree of opening is assumed to be 100% (i.e. fully open).
AirflowNetwork:MultiZone:Component:ZoneExhaustFan for specifying the properties of air flow through an exterior heat transfer surface with a zone exhaust fan. The zone exhaust fan turns on or off based on the availability schedule. When the exhaust fan mass flow rate is greater than zero, the airflow network model treats this object as a constant volume fan. If the fan is turned off (based on the schedule), the model treats this object as a crack. The zone exhaust fan runs 24/7. The exhaust fan mass flow rate is 0.0126 m3/s in the living room and kitchen. The maximum flow rate field is set to 0.0079 m3/s c in the bathroom (these flow rates are derived at 20°C and 101,325 Pa, d whilst the actual flow rate fluctuates slightly based on the actual temperature and pressure conditions).
Scenario 2: Zero infiltration
Scenario 2 is intended to illustrate the effect of internal infiltration from the corridor coupled with exfiltration from the external wall of the flat. To model this through-flow effect, simple ventilation objects are used (with no AFN). However, in this case, zero infiltration from the outside is assumed. The scenario of zero (external) infiltration is considered to be a plausible scenario under certain operating conditions, such as when the external façade is in the leeward side of the prevailing wind or when the internal air is substantially warmer than the outside air. Where wind-driven pressure-differentials exist across a large building (or a floor plate within a building), all of the flats within the affected zone are likely to operate in predominantly exfiltration or infiltration-dominated modes at certain times. These effects are likely to be most pronounced in relatively airtight mid-floor flats which sit near to the buildings neutral plane.
A ventilation rate equal to 10 L/s per person with an occupant density equal to roughly 0.02 people/m2 is assigned to the communal corridor (see Table 2). The corridor air is assumed to come directly from the outside into the corridor. Using the Zone:Mixing object, this air is then transferred from the communal corridor into the hallway, where half of this air then enters the bedroom, whilst the other half enters the living room/kitchen (as shown in Figure 6). Each of these two zones has an exhaust fan extracting air to the outside.
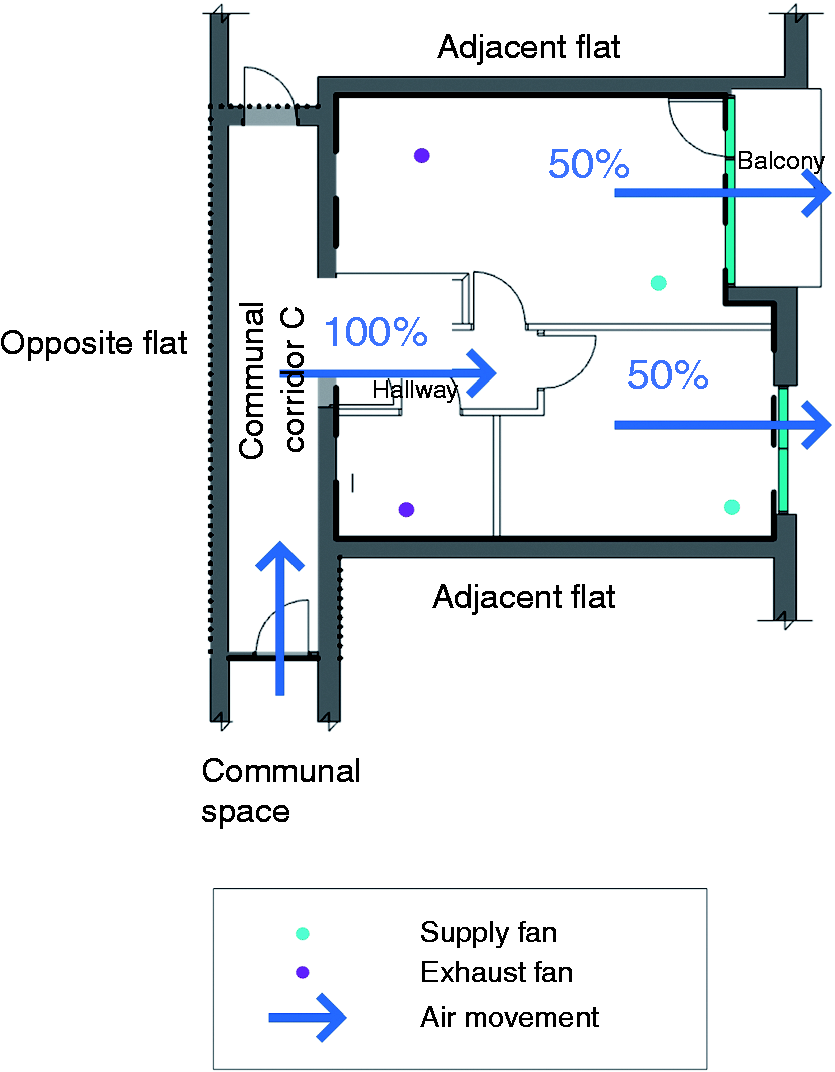
Overview scenario 2.
Scenario 3: As Scenario 2 but without corridor
The final scenario 3 is similar to scenario 2 but with the difference that the geometry of the corridor has been removed in the model (Figure 7). The rationale behind removing the corridor in the modelling and simulation of the flat is that at present, corridors are often not accounted for in guidance documents such as TM 59. This scenario will highlight the difference between dismissing the inclusion of corridors and the behaviour on the flat in comparison to the other scenarios.
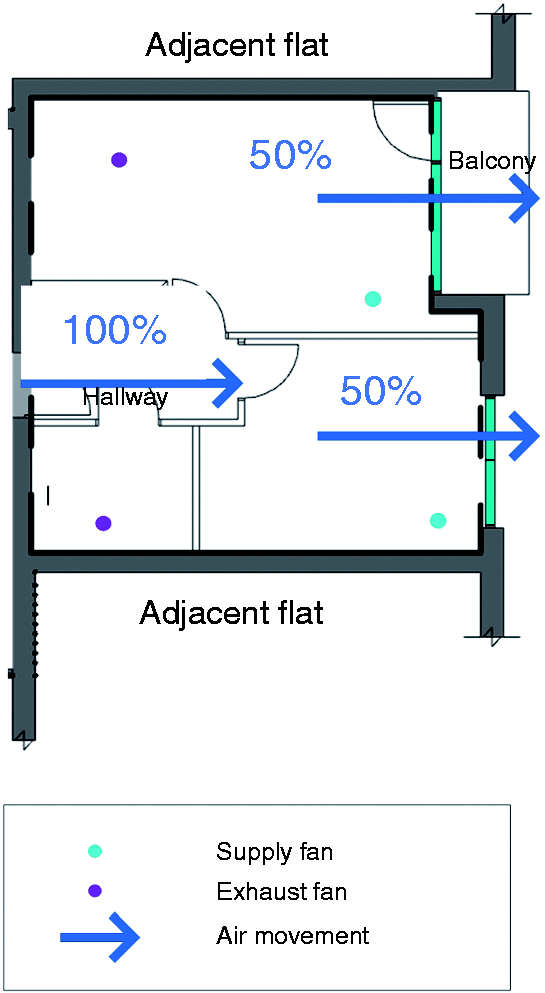
Overview scenario 3.
The object Other:Side:Coefficients has been used (for the flat’s surfaces adjacent to the corridor) to control the temperature of these surfaces. The temperatures of these surfaces are calculated based on the monitored air temperatures of the communal corridor which have been ascribed to the model and their film coefficient. e All the air from the communal corridor (which is at a temperature equal to the monitored one) is assumed to enter the flat via the hallway, which is implemented using the Zone:Mixing object.
Summary
Four BPS models were created to investigate the influence of distinct infiltration pathways on the thermal performance of a modern low-energy flat located in London. All models apart from scenario 1 (AFN) ascribed the infiltration design flow rate using the ZoneVentilation:DesignFlowRate (0.26 ach). Scenarios 1 and 3 used the DesignSpecification:OutdoorAir only for the hallway in order to override the temperature of the air with the monitored data.
Results: Infiltration in monitored flats
Figure 8 shows the comparison of the simulated data to monitored data using the mechanically ventilated criteria and using a custom weather for the period from 1 October to 3 November. Note that the difference in solar radiation transmitted in the living room/kitchen and the bedroom in Figure 7 is due to the localised shading caused by the balcony and the vertical walls in the living room.
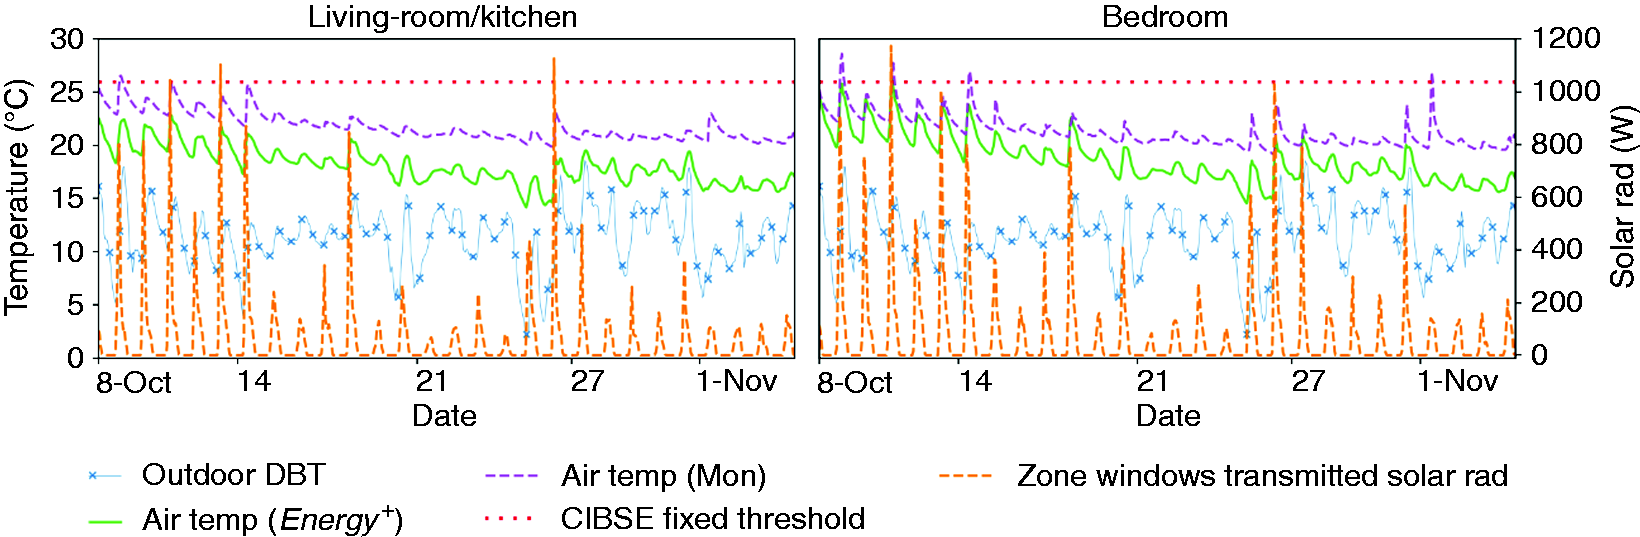
Monitored outdoor air temperature and incident solar radiation on exterior wall, monitored and simulated base case indoor air temperature, and CIBSE threshold value between 1 October 2015 and 3 November 2015 with outdoor temperature and solar radiation from the custom weather file.
There is a gap between the EnergyPlus simulations and reality where the monitored indoor temperatures are considerably higher than the simulated ones. The root mean square error (RMSE) is equal to 3.7°C and 2.7°C for the living room/kitchen and bedroom, respectively. In addition, a similar pattern is noticed in terms of diurnal temperature fluctuations, where the average-maximum monitored variation is 1.3°C and the predicted one is 2.2°C for the living room/kitchen. For the bedroom, the respective values are 2.4°C and 3.0°C. Finally, the empirical data recorded 3 and 10 h above 26°C in the living room/kitchen and bedroom, respectively, whilst at the same time, the simulations predicted just 0 and 1 h above the CIBSE threshold in the same rooms.
In order to understand the gap between monitored and modelled data (as shown in Figure 8) better, Figures 9 to 11 show the different infiltration and exfiltration scenarios as explained in ‘Infiltration scenarios’ section. Note that all RMSEs and the mean bias error (MBE) values are summarised in Table 4 to indicate the prediction errors.
RMSE and MBE for the base model and the three scenarios for the living room/kitchen, the bedroom and the communal corridor.
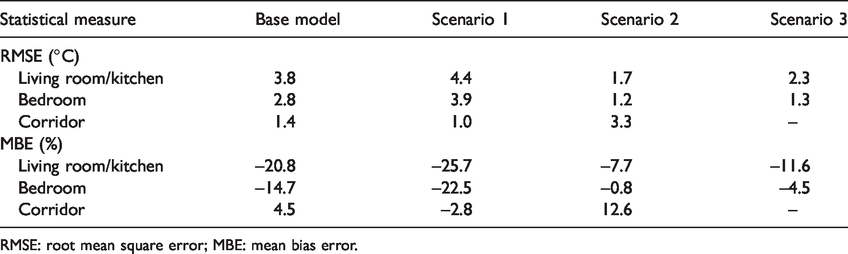
RMSE: root mean square error; MBE: mean bias error.
All scenarios demonstrate significant differences with scenario 2 being closest to the monitored temperatures. Figure 9 shows that all scenarios under-predict the indoor air temperature in the living room.
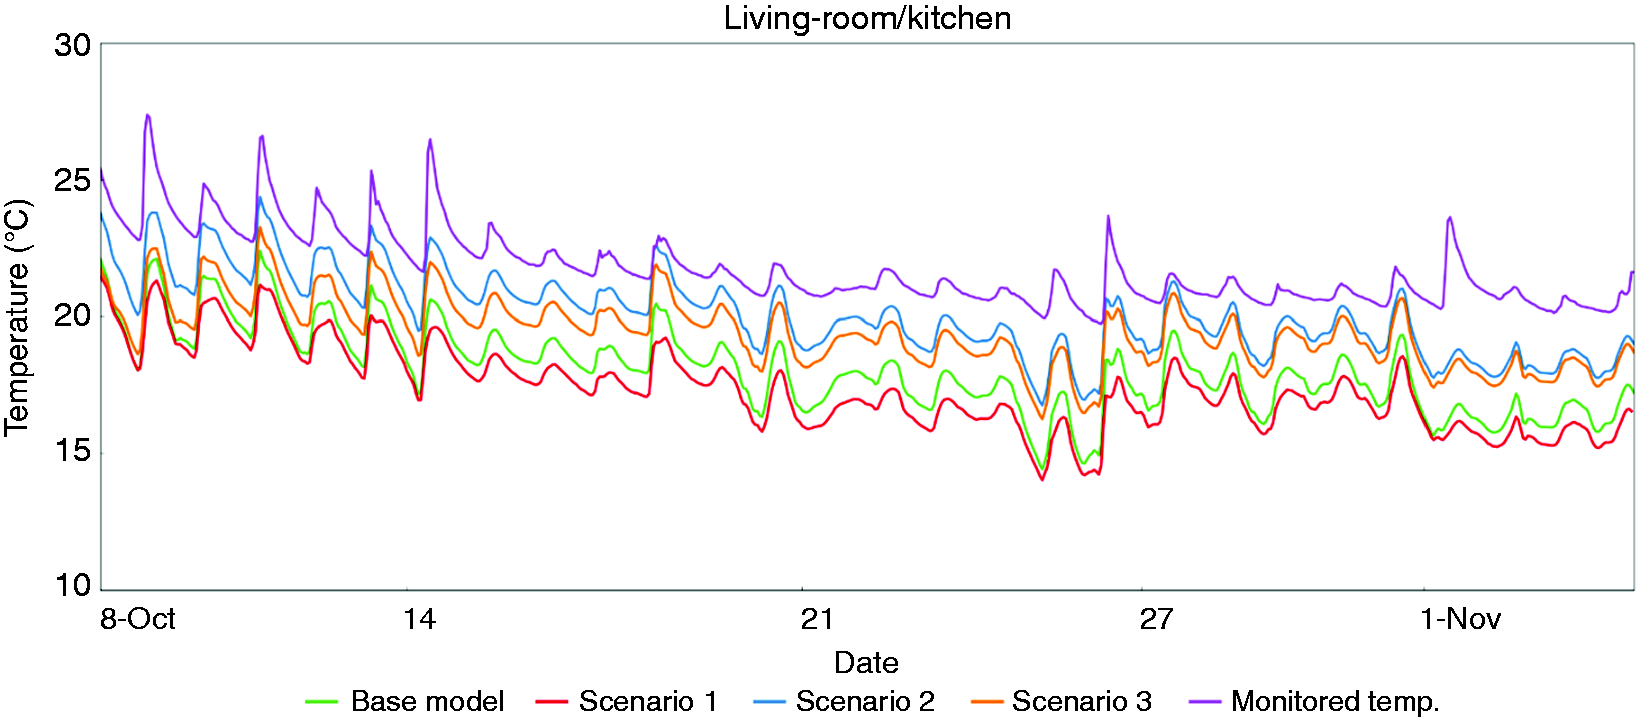
Living room and kitchen: Monitored indoor air temperature of the flat in comparison to simulated data from the base case model and the three scenarios.
In Figure 10, the bedroom temperatures using the monitored data and the different scenarios are summarised. It is shown that scenario 2 is also the closest to the indoor temperature for the bedroom. There is a good correlation at the beginning of the observed period where the gap between the monitored and modelled data is nearly closed.
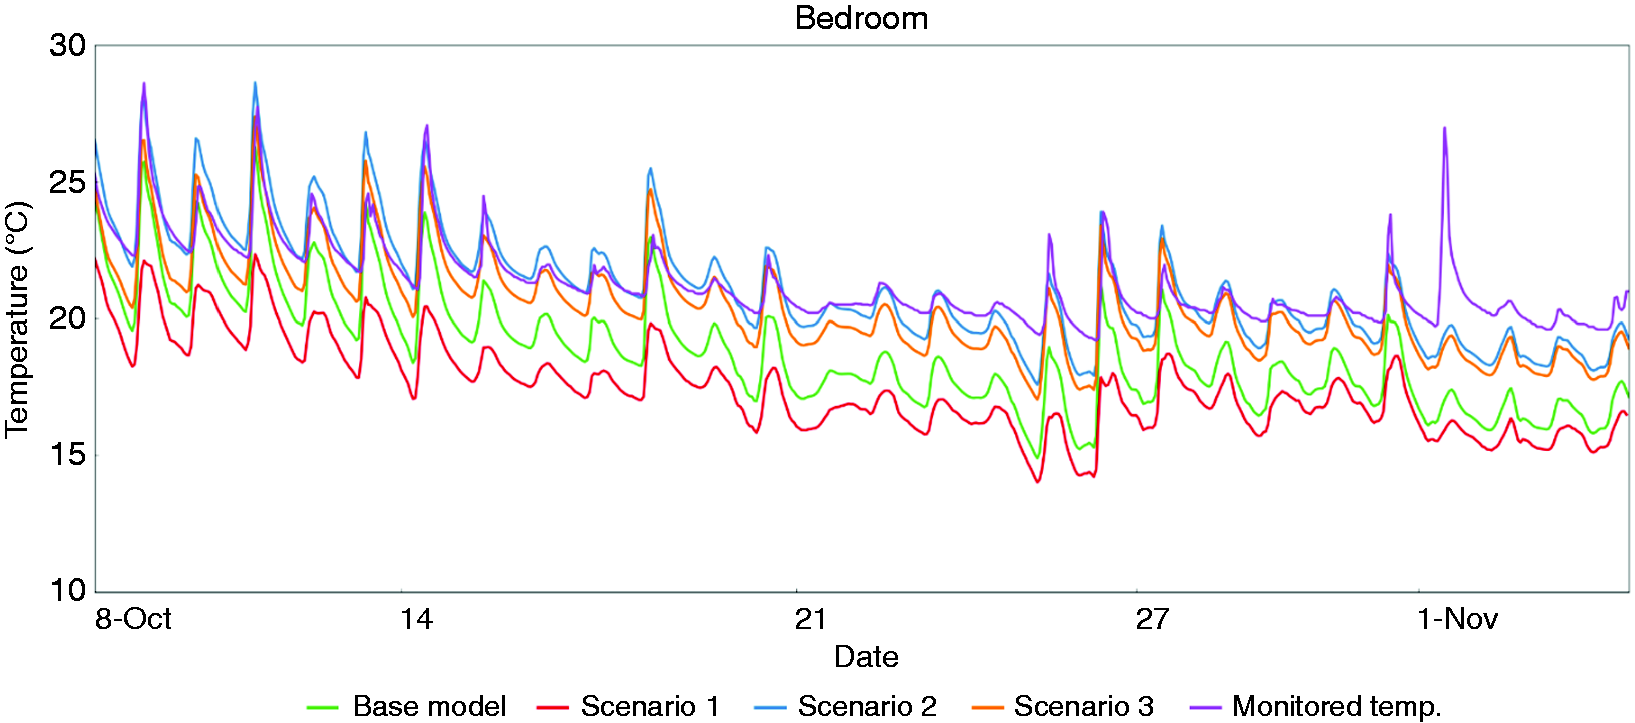
Bedroom: Monitored indoor air temperature of the flat in comparison to simulated data from base case model and the three scenarios.
Figure 11 shows the monitored corridor temperature in comparison to the base model and scenarios 1 and 2. Scenario 3 is not included in this graphic, as no corridor is modelled (that is because the monitored temperature is directly assigned to the surface temperature of the flat). The figure demonstrates that the base model and scenario 2 overpredict the temperature that was monitored in the corridor. A common trend in all of the scenarios is that they overestimate the downward trend of the data due to the seasonality, which is evidenced much more subtly in the monitored data.
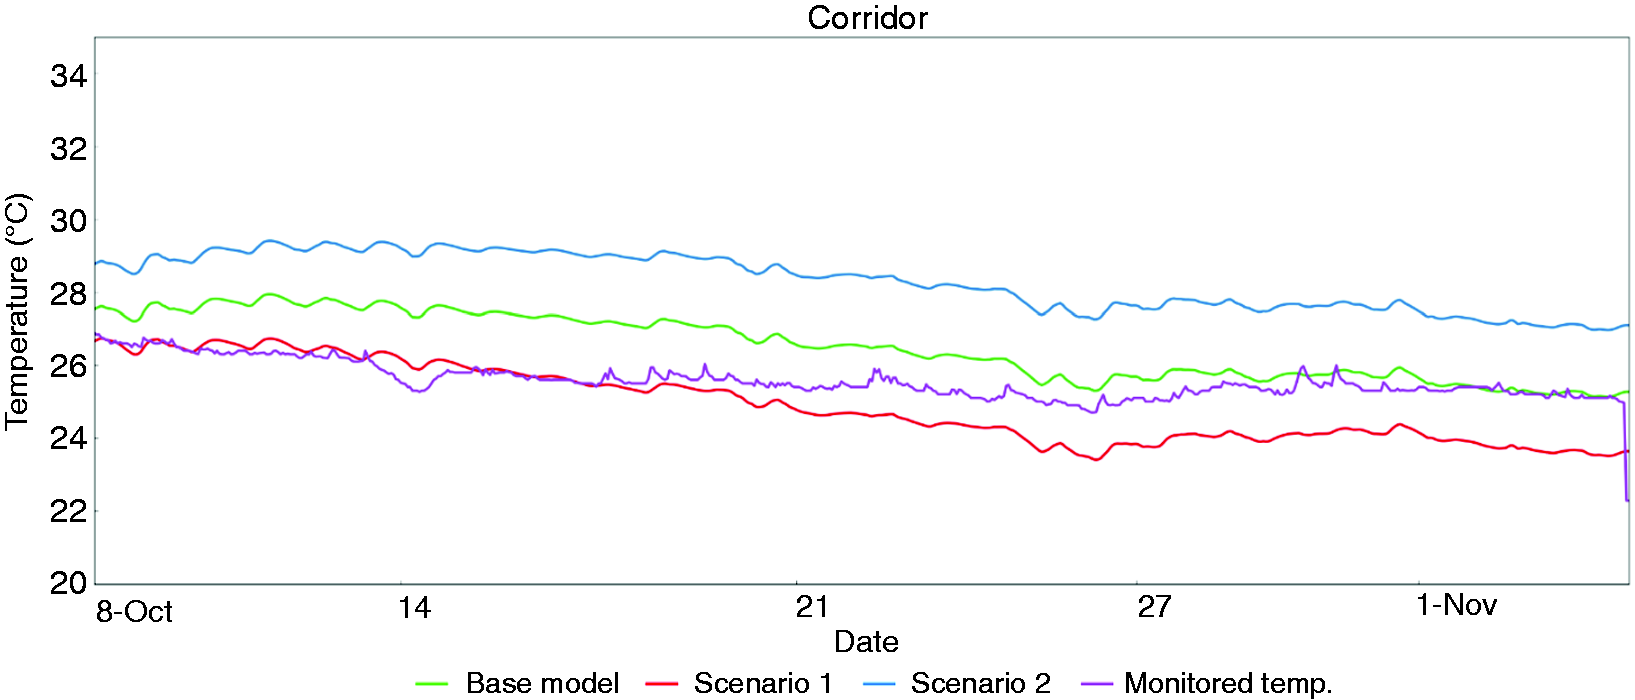
Corridor: Monitored indoor air temperature in comparison to simulated data from base model in comparison to three scenarios.
Table 4 summarises all RMSE and MBE errors of the base case model and the three scenarios for the difference zones.
Discussion
Overall, the results show that distinctly different indoor air temperatures are predicted when the base case model was compared to three different infiltration scenarios. This implies that the way in which infiltration and exfiltration are modelled, as well as the rate of heat loss to/from the corridor, significantly influences the temperature in the flat. The results (including the limitations) will be summarised in the following.
In relation to zonal-level infiltration rates, the dwelling level infiltration rate was assigned equitably on a floor area basis to each zone (for the base case and scenarios 2 and 3). In reality, it is likely that the infiltration rates will be much higher in zones that border the external façade and/or contain openings (such as windows and doors) in their external fabric, since these are exposed to greater pressure differences. However, in the absence of more detailed zonal-level data, this phenomenon cannot be accurately ascribed.
Summary
This study has shown that infiltration pathway assumptions have a significant and temporal impact on the internal temperatures occurring in a flat.
In the bedroom, living room and kitchen, scenario 1 (AFN-using external infiltration only) demonstrates the highest deviation from the empirical data. This is followed by the base case model which applies current modelling practice to a real building.
As no air transfer with the corridor (or other zones of the building) is assumed in these two scenarios, this implies that there is strong and continuous coupling with the outside air. This assumption is extant in the existing modelling orthodoxy and guidance documents (such as TM 59) which assume that infiltration always takes place directly from the outside (and occurs at outside temperatures). Such assumptions have the potential to skew predicted internal space temperatures by assuming that dilution takes place with fresh external air (and equally in all zones of the building). This is highly unrealistic since it ignores both stack and pressure differentials occurring within and across the building.
In the bedroom, scenario 2, the predicted temperatures are very much in line with the monitored data, closely followed by scenario 3. However, in scenario 2, the air temperature in the corridors is very different from the monitored data (Figure 11), where the corridor temperature is overpredicted by 2°C (the respective MBE value is 12.6%). Scenario 3 uses the monitored data of the corridor and assigns it directly to the flat, and thus no over-prediction of the corridor temperature occurs. Similarly, in the kitchen, scenarios 2 and 3 perform much closer to the real performance of the building.
Scenario 3 (assigning the actual corridor air temperature to the infiltration air mass) is the most realistic to the actual condition (as it uses the correct driving temperatures, and thus it is the model based most closely on the reality). However, the gap in relation to zonal temperatures inside the flat is slightly bigger on average than in scenario 2. This does not imply that scenario 3 is less accurate than scenario 2 in relation to the modelling of infiltration/exfiltration, however. Rather, the remaining discrepancy is assumed to be caused by other uncertainties contributing to the gap between the monitored and modelled data. In particular, the simplistic assumptions regarding the modelling of the controlled ventilation system (MVHR) are likely to be exerting a strong influence on the under-prediction of the supply air temperatures (particularly during the coldest parts of the day).
Notably, the modelled temperatures at night-time drop more significantly in all of the modelled scenarios than in the monitored data. However, this does not appear to be so evident during the middle of the monitoring period. A general trend can also be noticed, in that the model is very sensitive to the outside air temperature (see ∼24 October). In reality, the MVHR, due to its internal wall location (and poorly insulated extended intake ductwork), is delivering air which is constantly pre-warmed by heat exchanged with the surrounding ceiling void throughout the monitored period. 1 Since this system provides the continuous background air supply, the flat is effectively decoupled from external diurnal temperature variations. As a result, the MVHR system (even when operating in bypass mode) is incapable of supplying air below 21°C on average (even when the external air temperature is as low as 6°C). 1 Although this does not explicitly influence the modelling of exfiltration/infiltration, it constitutes a significant component of the overall air flow modelling uncertainty. Practical experience shows that air within a building flow is complex, and assumptions regarding both the origin and direction of airflows can significantly impact the ability to reject heat.
Other factors may also be playing a role in the discrepancy between the modelled and measured performance. Notably, some of the peaks (e.g. 1 November) in the monitored internal temperatures are not identified by the simulations. For example, Figure 8 identifies a slight peak in the outside temperature and solar radiation which is absent in the simulations. This might be a site-specific phenomenon caused by the immediate micro climate; however, there is no concrete evidence with which to confirm this. Wider consideration in this respect needs to be given to ensure that appropriate climate data are used to capture the both the immediate the local context6,15,16 as well as the long-term temporal context of the building. 17
In the flat monitored, the assumption that infiltration was from the internal corridor through the flat to the outside produced a better overall fit to the monitored data. In terms of the corridors: scenario 1 (AFN) under-predicts the indoor air temperature, whilst the base case and scenario 2 overestimate the corridor air temperature. Scenario 3 is identical to the monitored data, since this is being fed to the model. In all cases, the seasonality trend in the corridor data is overestimated which points to the erroneous discretisation of the corridor model in contrast to the thermal inertia of the actual building.
Overall, the scenarios used have illustrated that the corridor and flat temperatures are highly sensitive to how the airflow network is modelled. Scenario 2 shows the closest fit to the monitored temperatures in the flat; however, in this scenario, the corridor temperatures were much higher than those monitored. Whilst scenario 3 gave similar results and was based on the use of known air temperatures for the corridor, in practice, during a design stage modelling process, this information would be unavailable.
Larger and wider blocks of flats with central corridors (and those without dedicated ventilation systems) are likely to be the worst affected.
Implications of the findings of this investigation
In this paper, we were fortunate to have access to an existing building and to conduct building diagnostics prior to the modelling. Many of the scenarios that were constructed in this paper are otherwise unattainable a priori. A designer, who usually sits in front of a set of plans on the other hand, would find it hard to conceive of what may occur. Therefore, widespread use of such a scenario-based approach would have to be based on experience and/or sensitivity analysis from prior studies.
The focus in this paper was on a newly built construction. Perhaps the most significant risk, however, exists for multi-residential buildings undergoing thermal refurbishment. Typical refurbishment will focus on measures that reduce the energy and carbon emissions from the building (i.e. Part L criteria). This implies measures to improve the thermal fabric, cladding and glazing, and possibly a new heat distribution system (e.g. communal heating) with HIUs, etc. With heat losses massively reduced, the means of rejecting heat will become critically important.
At present, common building physics practice and existing TM standards are masking the complexity of the problem, particularly in multi-storey multi-residential buildings. As such, current overheating standards and guidelines do not provide a basis from which typical or worst-case scenarios can be adequately considered.
A fuller understanding of the role of internal air movement in overheating assessments is required. This means that detailed surveys of the building are necessary where a building is already in existence. In terms of simulating new buildings, experienced modellers deploying more detailed and rigorous assessment methodologies are essential prerequisites to achieving realistic overheating assessments. Most importantly, the inclusion of scenario-based sensitivity analysis, using multi-zonal ventilation networks, is needed in order to explore a broader range of plausible scenarios. This way, the impact of scenario-based uncertainties (such as weather variability, compounding the influences of wind direction, irradiation and external temperatures) and design uncertainties (such as the geometry of the space, orientation and ventilation concepts) can be fully explored.
Preventing overheating whilst pursuing low carbon design objectives in new and existing buildings has a number of wider design and regulatory implications which are often overlooked. For example, effective compliance with Part F (Ventilation) can be extremely challenging in urban contexts where noise, pollution and window safety restrictors may limit the ability of occupants to purge ventilate in the manner which the designer intended. Further consideration also needs to be given to compliance with Part B (Fire safety) in relation to the design of ventilation and smoke control systems in communal corridors, and their ability to be used as part of a heat purging strategy. Where existing buildings are undergoing refurbishment using internal insulation, issues relating to Part C2 (Resistance to moisture) in respect of interstitial condensation and mould growth may also need to be considered. 18 Compliance with The London Plan in relation to Policy 5.6 (Decentralised energy in development proposals) has promoted the inclusion of communal heating systems in new development proposals, but the unintended consequences of such systems must also be acknowledged.1
These examples are by no means exhaustive but point to the complex nature of resolving competing design objectives. Such challenges are inevitably influenced by regulatory drivers, wherein there is a need for a more wholistic awareness of the interactions between various building and planning regulations.
Limitations
One of the main limitations of this initial study is the absence of information in respect of actual ventilation and infiltration flow rates and pathways within and between the corridors and the flats. Regarding the BPS inputs and modelling, no detailed construction data were available for the floors and roofs; typical constructions were therefore assumed using the information available (e.g. overall depth of construction elements) and material properties as specified in the architectural drawings and SAP reports.
Conclusions
This study has demonstrated the importance of modelling both infiltration and exfiltration pathways, between adjacent zones, in order to capture the mass transfer of heat, particularly in complex multi-storey, multi-residential buildings. All scenarios have illustrated that the predicted corridor and flat temperatures are highly sensitive to the boundary conditions in the different models. This demonstrates the importance of considering interzonal infiltration/exfiltration pathways between a flat and its surroundings, including the adjacent corridor and neighbouring flats.
The current practice of apportioning equal volumes of ambient air to account for infiltration into and exfiltration out of each zone of a model (in isolation) is unrealistic. This simplification is likely to be contributing to the performance gap found between modelled temperature predictions and empirical measurements. In reality, when carrying out modelling a priori at the design stage, complete and accurate information is unavailable, and it is impossible to know how closely the eventual reality is being approximated. In order to address this uncertainty, this paper has demonstrated the need to incorporate a model infiltration sensitivity assessment within TM 59 and similar simulation-based assessment methods. Such a sensitivity analysis should account for the effects of prevailing wind directions, contiguous internal heat gains and the influence of multi-zonal infiltration/exfiltration airflow pathways. This implies the development of standardised guidance for the creation of air flow networks and model discretisation.
Although this work has focused on the role of infiltration/exfiltration pathways in the prediction of indoor temperatures, it is evident that poor MVHR system design and purge ventilation strategies play a significant role in the documented overheating evidenced in these flats. Equally, accurate modelling of controlled ventilation systems is essential to improve BPS model fidelity. The importance of capturing realistic air supply characteristics in the modelling of MVHR systems has been touched on in this work and will form the basis of further research.
In support of substantive improvements in overheating modelling methodologies, the research has also highlighted a need for a better empirical understanding of internal air movement pathways and their characterisation in multi-storey multi-residential buildings.
Footnotes
Declaration of conflicting interests
The author(s) declared no potential conflicts of interest with respect to the research, authorship, and/or publication of this article.
Funding
The author(s) disclosed receipt of the following financial support for the research, authorship, and/or publication of this article: The authors gratefully acknowledge the support of the BRE Trust for the provision of a grant to undertake this research project as part of the ‘Resilience – tackling overheating in urban dwellings’ project.