
Abstract
A new set of CIBSE weather files for building performance simulation was recently developed to address the need for better quality solar data. These are essential for most building performance simulation applications, particularly for daylighting studies and low-energy building design, which requires detailed irradiation data for passive solar design and overheating risk analysis. The reliability of weather data becomes paramount when building performance is pushed to its limits. Findings illustrate how principles of good window design can be applied to a case study building, built to the Passivhaus standard, and how its expected performance is affected by the quality of solar irradiation data. Analyses using test reference years were most affected by changes in the solar radiation model (up to 8.3% points), whereas for design summer years the maximum difference was 1.7% points. Adopting the new model caused overheating risk to be classified as more severe using test reference years than design summer years, prompting a discussion on the design summer year selection method. Irradiance data measured on-site were used as a benchmark to evaluate the new solar radiation model, which was found to significantly improve the accuracy of irradiance data within weather files and so the reliability of overheating assessments.
Keywords
Introduction
Building design and architectural features (e.g. overhangs, shading devices) are known to influence the health and wellbeing of building occupants, as well as the building’s energy consumption and its life cycle cost.1,2 Indoor environmental quality (IEQ) assessments are becoming the norm to evaluate occupants’ comfort level in both commercial3–5 and residential buildings. 6 The main types of IEQ assessments investigate thermal comfort, indoor air quality, lighting and acoustics.
Solar radiation has a significant effect on thermal and (natural) lighting assessments, particularly in all cases where the building utilises passive design strategies.7–9 The Chartered Institution of Building Services Engineers (CIBSE) TM60 ‘Good Practice in the Design of Homes’ 10 lists ‘orientation, layout and window design to make use of available natural light and to optimise useful solar gain’ and ‘the use of appropriate solar control strategies to avoid overheating in the summer’ as the first two factors that need to be considered to ensure that passive designs achieve their performance targets.
Daylight has a positive impact on occupants’ wellbeing and it was found to influence important health factors, such as the correct entrainment of human circadian rhythms, which can in turn affect physical and psychological comfort, as well as sleep quality.11–13 However, higher city density and tall buildings can put at risk the adequate access to daylight for vast portions of the population if design measures and building regulations are not correctly implemented. 14
High temperatures can have an adverse effect on health; they can be responsible for heat exhaustion, heatstroke, heat syncope and heat cramps. 15 They can also lead to sleep impairment 16 which again can lead to reduced productivity. 17 Research has shown that these harmful consequences of overheating are expected to exacerbate in the future unless greenhouse gas emissions are reduced significantly. 18 Previous research reveals the risk of overheating in dwellings.19–22 It is estimated that around 20% of homes in England may be already experiencing overheating, even under moderate summer conditions. 23
Although equally important, thermal comfort and good daylighting are often two conflicting factors, and reaching a good balance between the two requires design experience and accurate evaluation tools. Dynamic simulation modelling is considered best practice when assessing passive design options under variable environmental conditions. 10 Overheating analysis makes use of the results from thermal dynamic simulation, whereas daylighting can be assessed on an annual basis with the use of climate-based daylight modelling (CBDM).24,25 Whilst CBDM consists of a series of discrete ‘snapshots’ of the luminous conditions rather than an actual dynamic simulation, the methodology is based on the use of the same weather files adopted for most building performance simulation (BPS) evaluations.
Climate files are a fundamental component of BPS, as they allow the representation of the external environmental conditions. 26 Depending on the type of analysis that the building modeller is carrying out, different weather files should be used. During the design process, a test reference year (TRY) file is used to test the expected building performance under typical environmental conditions (e.g. for daylighting), 27 and a design summer year (DSY) file is used to test moderately warm summer conditions (e.g. for overheating risk assessments). 28 These are provided by CIBSE and other agencies, usually for a limited number of locations. Normally, the modeller would choose a weather file created for the closest location to the building site. For example, London is the closest city to the location considered in this study (Gomshall, Guildford, UK) for which CIBSE weather files are available. These files provide a reasonable approximation of the typical and moderately warm conditions for that locale. CIBSE also provides files with future climate projections for different emission scenarios, not investigated here. After the building is completed, further analyses might be necessary, for example during the commissioning stage or for a post-occupancy evaluation. For any case in which simulation results are compared with measured data collected from monitoring studies, the weather file has to represent the external conditions during the monitoring campaign.
A new method to account for solar radiation in CIBSE files was recently proposed. 29 Rather than deriving irradiance components from cloud cover values (as currently done using the cloud radiation model – CRM), this new method – referred to as RSO (radiation Skartveit–Olseth) from here onwards – takes advantage of an increased availability of global irradiance measurements collected by the Met Office and only derives direct and diffuse components using the Skartveit–Olseth separation model. 30 This paper investigates the effect of implementing this new approach to account for solar radiation within different types of weather files when assessing overheating and daylighting in a low-energy building design.
Method
The analyses conducted in this paper compared results from overheating and daylighting predictions obtained when applying different solar radiation models within weather files used at various design stages.
To test how overheating and daylighting analyses are influenced by the choice of solar radiation model, the weather files listed in Table 1 were used, and the performance of a case study building was assessed. Essentially, files 1, 3 and 5 represent the current, traditional method to derive the solar radiation components, whereas files 2, 4 and 6 represent the new method, based on global horizontal irradiance (GHI) measured by the Met Office. File number 7 is used as a reference when comparing post-built analyses.
Characteristics of each of the seven weather files used in the analysis.
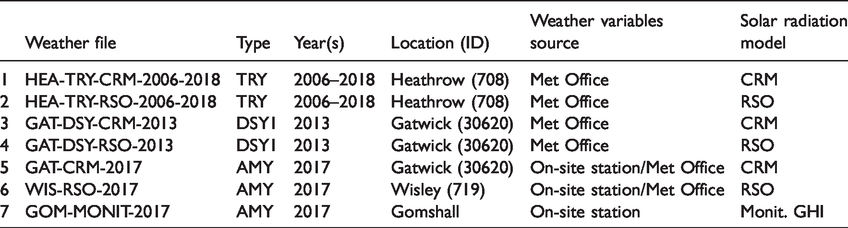
For the two TRY files, data from the Met Office Heathrow station (ID: 708) were selected as the closest location for which CIBSE releases TRY files (i.e. the file provided for London). In this case, the building site is 30 km away from the Heathrow weather station. Irradiance data are collected at this site since 2006. To create a representative year from data collected during the 2006–2018 period, the Finkelstein–Schafer (FS) statistics 31 was used, combined with the ISO method for the weighting of the main weather variables (mean daily dry bulb temperature, mean daily relative humidity and total daily global horizontal irradiation). The procedure is presented in more detail by Eames et al. 27 Global horizontal irradiation is one of the factors determining the selection of the most representative months from the considered multi-year period, thus changing solar radiation model influenced irradiation values and, consequently, the months chosen to constitute a representative year. Hence, the values of all weather variables (e.g. temperature, humidity, wind speed, etc.) in the two TRY files resulting from the FS-ISO procedure are different, not only the irradiance and illuminance components.
The DSY files dataset released by CIBSE includes three different locations for London: the London Weather Centre, Heathrow Airport and Gatwick Airport. As Gatwick is the closest location to the building site Gomshall (18 km away), the two DSY files were created with solar radiation data measured there by the Met Office (ID: 30620). Weather and solar radiation data from the year 2013 were selected, as that year was characterised by a moderately warm summer and suitable for use as a DSY1 file in overheating studies. 28 Furthermore, solar radiation data measured by the Met Office are available for that year, as opposed to the year 1989 used for London in the official DSY release. Only irradiance and illuminance differed in the two DSY files created for this work (3 and 4), while the other weather variables were kept identical.
Additionally, three actual meteorological years (AMY) files relative to the year 2017 were created: one from data collected at the Gatwick station, the closest one measuring cloud cover data; one from data collected at the Wisley Met Office station (ID: 719), which is the closest one (11 km) measuring hourly global horizontal irradiation and one from GHI data monitored on-site. This last file was not meant to act as a validation reference, due to the potential measurement errors of the pyranometer (a second-grade instrument) and due to a data gap in June 2017 (filled with irradiance data from satellite stations, see Table 3 in the supplemental material section); it was however used as an indicative benchmark. Except for irradiance and illuminance, all weather variables had the same values in the three AMY files, as measured at the weather station established on the building site.
Case study
The case study is an actual two-storey, three-bedroom house with a treated floor area of approximately 250 m2, located in the wider area of Guildford, in a rural settlement called Gomshall. 32 The low-energy building, displayed in Figure 1, was designed to achieve near Passivhaus standard.
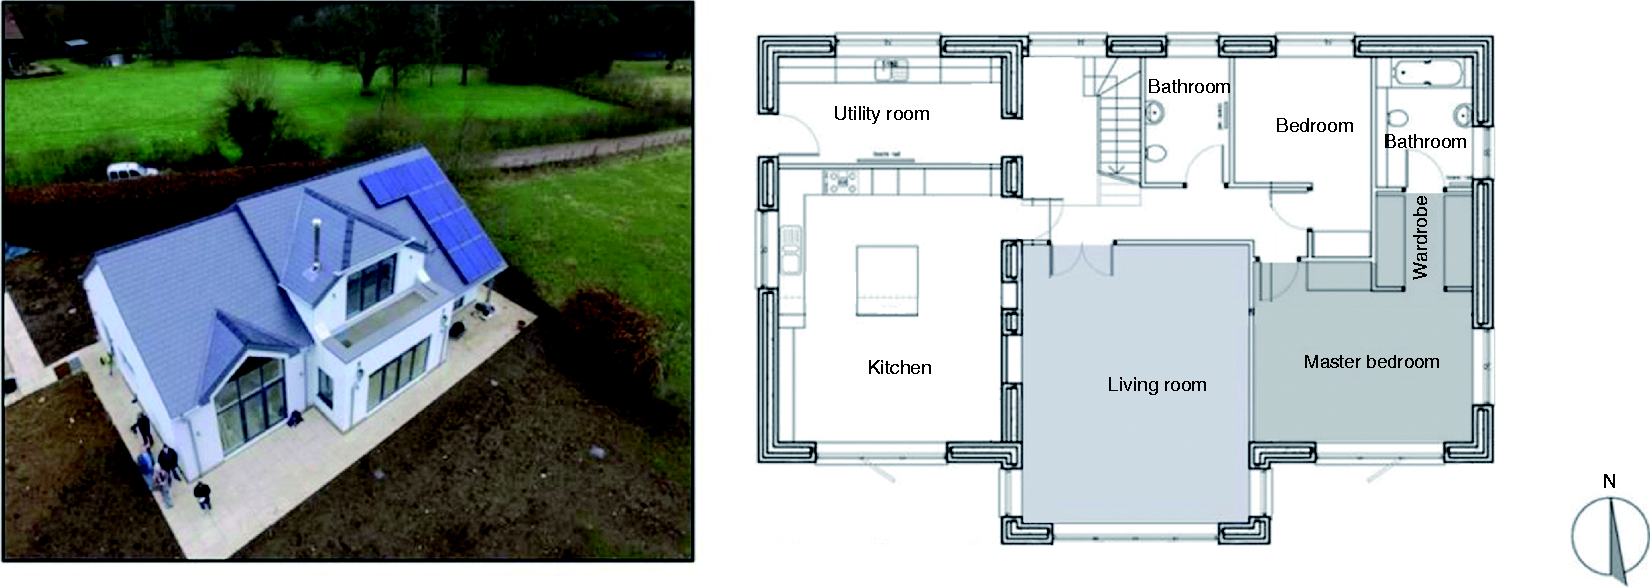
South-West view of the building (left) and plan of ground floor (right), in which the two rooms assessed in this study are highlighted in grey.
Guildford is located in the county of Surrey, UK; this has a temperate maritime climate with typically warm rather than hot summers and cool to cold winters. On average, the hottest month is July in summer and the coldest is January in winter. 33 On-site weather data were measured, i.e. dry-bulb temperature, dew point, relative humidity, atmospheric pressure, wind speed and direction were recorded on-site at a one minute time step. 34 An irradiance sensor (pyranometer) was also installed on-site to record global solar radiation (again, at a one minute resolution). 35 These on-site weather data collected during 2017 form the file entitled GOM-MONIT-2017.
Apart from the on-site weather data, additional data were collected within the building over a period of 20 months between April 2016 and February 2018, such as internal air temperatures and relative humidity, CO2 levels, energy consumption (at the main board), windows opening and closing, mechanical ventilation and heat recovery (MVHR) system operation (on summer bypass). For the purpose of this study, the monitored data were used to obtain a calibrated model. The thermal simulation model of the building was created using EnergyPlus 8.6. 36 EnergyPlus is an open-source, freeware, validated and commonly used dynamic BPS tool, developed by the Department of Energy in the USA. For more information about the building, the thermal properties and the calibration process, please refer to Mantesi et al. 32
Daylight analysis
There are no precise guidelines on CBDM indoor visual comfort metrics for residential spaces. Previous studies indicate that acceptance of low daylight levels (∼100 lx) and possible glare conditions is higher than in commercial spaces, probably due to the larger freedom that occupants have to change their position when at home. 37 For the present work, guidelines mandated by the UK Education and Skills Funding Agency 38 for educational spaces were followed, i.e. illuminance levels were grouped using the useful daylight illuminance (UDI) metric, where illuminances within 100 and 3000 lx for over 80% of the time are considered as an indication of good indoor visual comfort.
The indoor illuminance profiles obtained from the annual simulations were used to calculate three UDI ranges: UDI-n, which represents the portion of the ‘occupied hours’ with illuminances below 100 lx; UDI-c, which represents hours with illuminances between 100 lx and 3000 lx; and UDI-x, which represents the portion of the year with illuminances over 3000 lx. The aforementioned ‘occupied hours’ were considered on an occupancy schedule between 8:00 and 20:00, roughly coinciding with a residential daytime continuous occupancy. In this work, illuminance values used to calculate UDI ranges were averaged over the horizontal analysis planes.
The three-dimensional (3D) model was modified in SketchUp and the simulations were run using the benchmark four-component method, based on the Radiance rtrace command39,40; the two analysis planes – in the ground floor living room and in the master bedroom – were placed at a height of 0.8 m, with a perimeter gap of 0.1 m from the interior walls. Surfaces were assigned standard reflectance (0.20 for floors and external ground; 0.50 for interior walls; 0.70 for ceilings) and transmittance values (0.67 for all glazing). All irradiance values in the weather files were converted to illuminance using the Perez luminous efficacy model 41 and the sky luminance distribution was derived using a blend model based on Commission Internationale de l’Éclairage, or International Commission on Illumination (CIE) overcast and CIE clear distributions. 42
Overheating analysis
Criteria from CIBSE TM59 ‘Design methodology for the assessment of overheating risk in homes’ 43 were used to understand how the different weather files influence the operative temperatures (and indicate overheating) within the building. Two different rooms were analysed, the main living room and the master bedroom, both on the ground floor.
For naturally ventilated homes, the following two criteria must be satisfied:
where
For mechanically ventilated homes, where the opening of windows is restricted, the following criterion must be met:
3.
Note that this research was not to implement overheating assessment using TM59 or TM52 but to show how the use of different weather files may impact the result of assessing exceedance of temperature thresholds. Thus, even though TM59 suggests the use of DSY1 files for the 2020s, high emission, 50% percentile scenario for the analysis of overheating risks in homes, here the three above criteria were applied to the results obtained from the thermal dynamic simulation using DSY1-current and AMY types of weather files.
Results
This section presents the results obtained by directly comparing the different weather files, and by comparing simulation results, i.e. daylight and overheating analysis. The consequences of using the RSO model rather than the CRM are presented, together with design strategies drawn from the combined overheating and daylight analyses results.
Solar radiation data
The first analysis compared solar irradiance values obtained from cloud cover (CRM) with those obtained with the new approach (RSO). Figure 2 represents the distributions of the irradiance values from the seven weather files under investigation, through the use of a violin plot visualisation. The box plots indicates the median value and the interquartile range of the distributions; the error bars include values that fall within 1.5 times the interquartile range below and over the lower and upper quartiles, respectively; on both sides of the boxplots, the probability density of the distribution is visualised to add more information to the comparison between datasets.
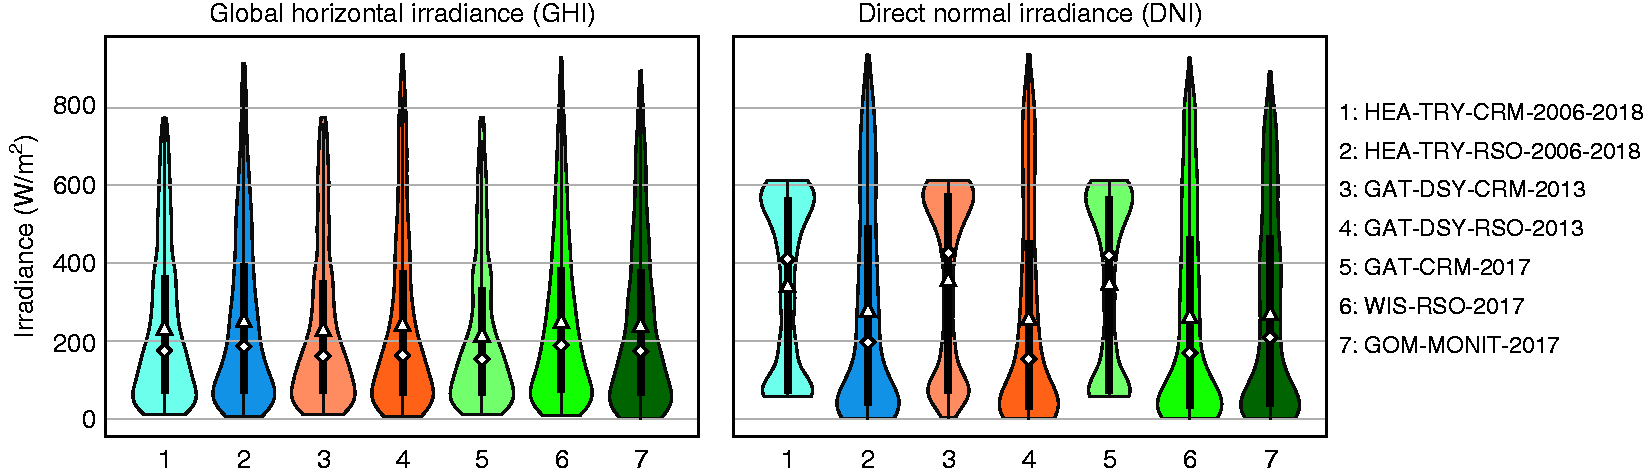
Violin-plot representation of the quartile distribution of the global (left) and direct (right) irradiance values in each of the weather files. The box is delimited by the first and third quartiles, the white diamond represents the median value and the white triangles the mean values, whereas the error bars correspond to data within 1.5 times the inter-quartile range. On both sides of the boxplots, the probability density is also displayed. Only non-zero values were considered.
The left plot of Figure 2 shows how files created with the CRM model (1, 3, 5) results in distributions of GHIs with lower peak values and more limited interquartile ranges than those created with the RSO model (2, 4, 6). On the right-hand side of the figure, it is possible to appreciate the inherent difference between the two models when deriving the direct normal irradiance (DNI) component. The CRM is characterised by a bimodal distribution that peaks around 60 and 600 W/m2, whereas the RSO model peaks for values close to zero and exhibits a long tail reaching values up to 900 W/m2. On the other hand, files created with the same solar radiation model are characterised by a similar distribution, independently from the type of weather file (TRY, DSY or AMY) and from the source years.
For files created for the year 2017, irradiance data monitored on-site (file 7) were used as a reference to evaluate relative errors of the two models: the CRM-derived GHI for the same year (file 5) was found to have a relative mean bias error (rMBE) = –9.5% and a relative mean absolute error (rMAE) = 40.7%; the corresponding RSO-derived GHI (file 6) was instead found to exhibit an rMBE = 3.3% and an rMAE = 21.8%. Furthermore, the distribution of GHI and DNI values as derived with the RSO model is clearly much closer to the monitored data than the distribution of CRM-derived irradiances. TRY and DSY files obtained with the two different models were compared against each other in all following analyses, but – without having a reference dataset – relative errors could not be established. Similarly, errors related to the DNI component could not be defined, as DNI was not measured on-site, but derived using the same separation model as in the RSO files, i.e. the Skartveit–Olseth model. The differences observed in the comparison among weather files propagate to simulation results, although in a less pronounced manner, as explained in the following section.
Design for visual and thermal comfort
In this section, simulation results from different solar radiation models are compared when performing daylight analysis using TRY files and when assessing overheating risk with DSY files that simulate moderately warm summer conditions. After these two evaluations – assessing indoor comfort at design stage – a comparison is performed, between simulation results obtained from the CRM and RSO models against those obtained from monitored irradiance data on-site. Furthermore, design considerations drawn from the results of the previous analyses are presented, illustrating how detailed BPS can help decision making that takes into account both daylight and thermal comfort requirements.
Daylight annual results expressed with the UDI metric did not show significant differences when using TRY files that implemented two different solar radiation models, with a maximum difference of 2% point, as shown in Figure 3. This is smaller than expected, but such a limited effect in annual results can be explained by the fact that UDI is a permissive metric, not sensitive to this order of variation in irradiance values.
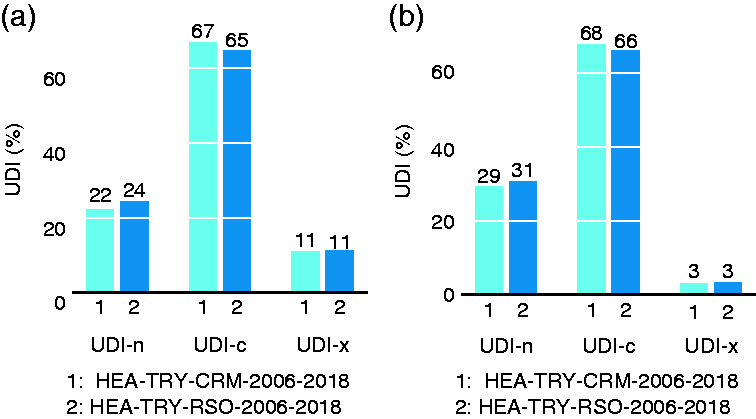
Annual UDI results for the living room (a) and for the master bedroom (b) using TRY files. The light shaded bars represent results obtained with the CRM model (file 1) and the dark shaded bars represent results obtained with the RSO model (file 2).
Annual UDI results suggest that the average illumination within both living room and bedroom is not sufficiently high over the course of the year. The living room suffers from both a high ratio of overly lit hours (UDI-x = 11%) and of poorly lit hours (24%), principally caused by the depth and orientation of the room: the main aperture is South oriented, without any shading device applied externally, thus allowing direct sun to enter the room but not to penetrate more deeply towards the back of it. The windows present on the East and West sides of the living room can contribute only in limited part to the indoor illumination measured on the horizontal plane, as the sun rays inclination is more pronounced when it enters the room from those directions. The bedroom is not affected by high daylight levels (UDI-x = 3%), as the main South-facing window is protected by a roof eave. It is however characterised by a high UDI-n value (31%), indicating low daylight levels and the likely use of electrical lights to supplement them; yet, the designer might consider it desirable for a bedroom space to maintain low lighting levels. The fact that both living room and bedroom spaces receive direct sunlight only over a limited area – because of the orientation for the former and because of a roof eave for the latter – provides an additional explanation for the small difference found when comparing CRM and RSO models, which exhibited a larger disagreement for direct sunlight (as visible from Figure 2).
To understand in more detail the rooms’ daylight performance, UDI results were disaggregated into monthly values, as Figure 4 displays. During months with higher overheating risk – May to September – the daylight levels are all close or over the requirement of UDI-c
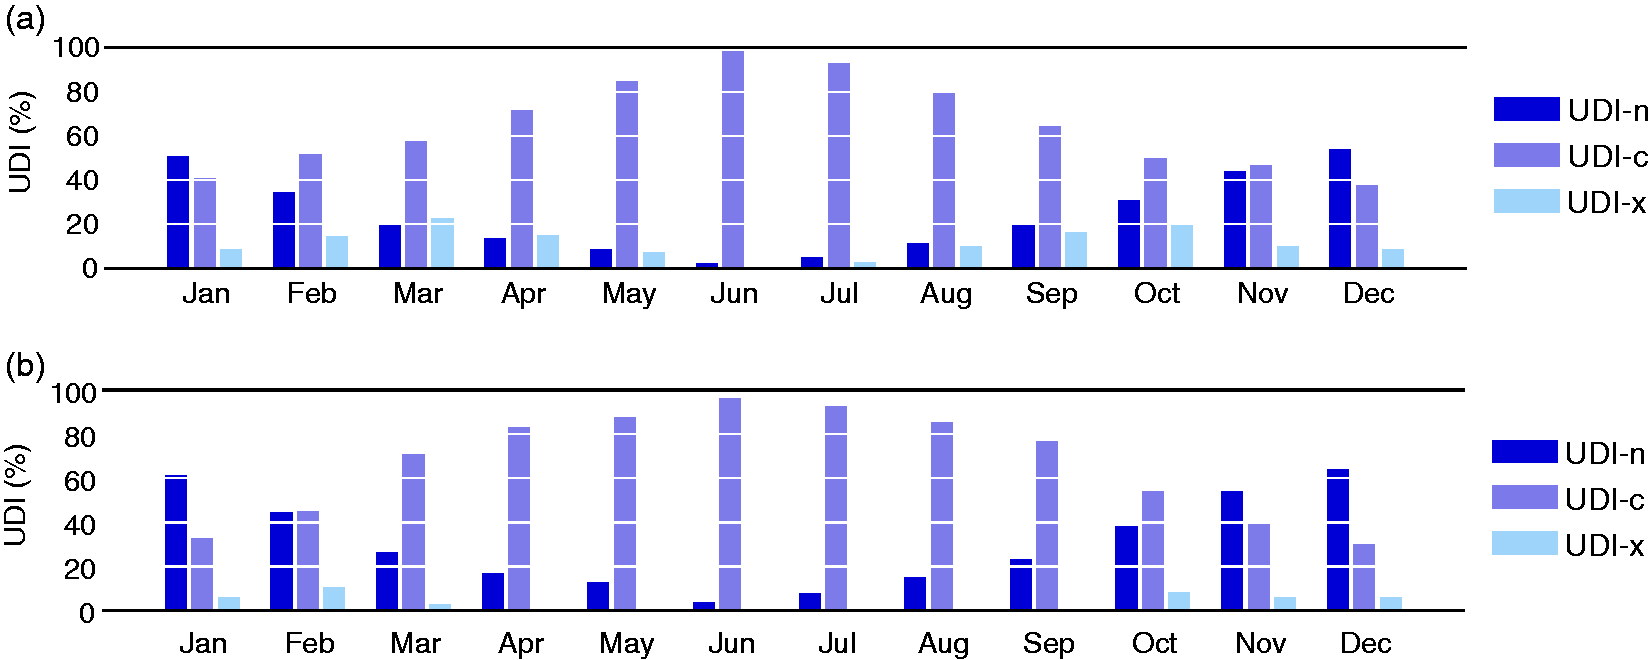
Monthly UDI results for the living room (a) and for the bedroom (b), obtained using the RSO-derived TRY file (HEA-TRY-RSO-2006-2018).
The further reduction of direct solar access would improve thermal comfort, as both living room and bedroom failed to comply with TM59 criteria to avoid overheating when using DSY files, independently of the solar radiation model. However, the impact of the new solar radiation model is noticeable: Figure 5 shows that implementing the RSO model in the TRY and DSY types of weather files leads to a systematic increase in overheating risk as diagnosed with TM59 criteria. The DSY file obtained using the RSO model (4) resulted in slightly higher values (maximum +1.7% points) than the DSY obtained with the CRM (3), for all criteria. The larger difference due to the models was found between the two TRY files (8.3% points maximum), as the choice of solar radiation model did not only influence the irradiance values but also the creation of the files themselves, through the FS statistics month selection. It is interesting to notice how the new TRY file (2) results in even more overheated hours than the DSY file (4) when checking criteria 2 and 3. It is worth remembering that the selection of years used to create DSY files is based exclusively on temperature data.
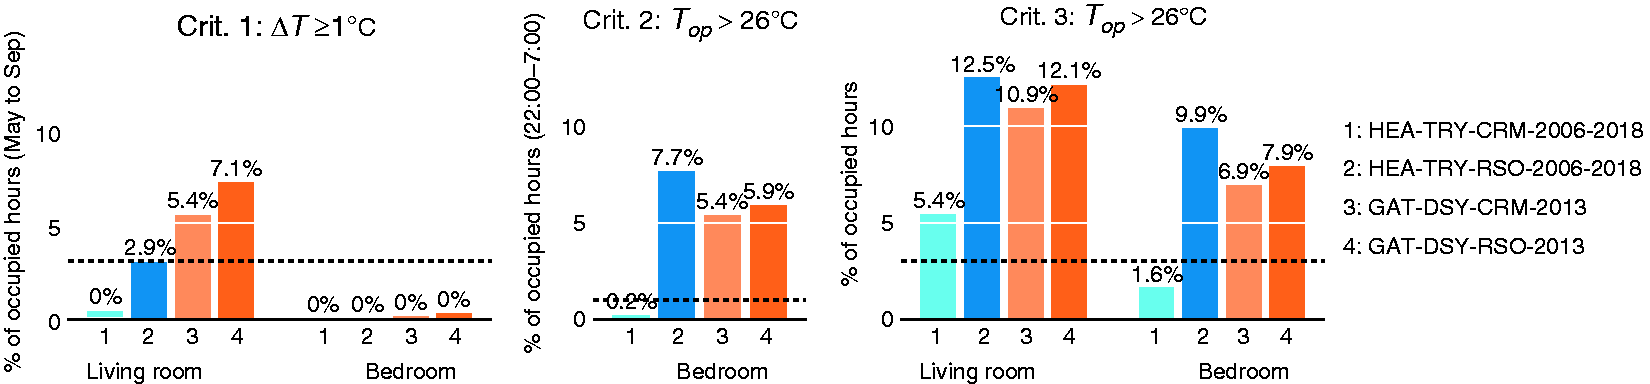
Hours of temperature exceedance (%) for living room and bedroom using the CIBSE TM59 criteria for naturally (criteria 1 and 2) and mechanically ventilated homes (criterion 3). The dashed line indicates the CIBSE hours of exceedance thresholds.
Figure 6 shows in greater detail the simulated operative temperature within the living room and bedroom, obtained by using the DSY-type file with the RSO model (file 4). The living room exceeds the overheating thresholds set by all criteria during the months of July and August, and generally exhibits higher temperatures than the bedroom. The bedroom complies with criterion 1, as the main, South-facing window of that room is protected from direct sunlight by the roof eave, which is most effective during summer months (criterion 1 is calculated on values from May to September); however, it failed to comply with criteria 2 and 3.
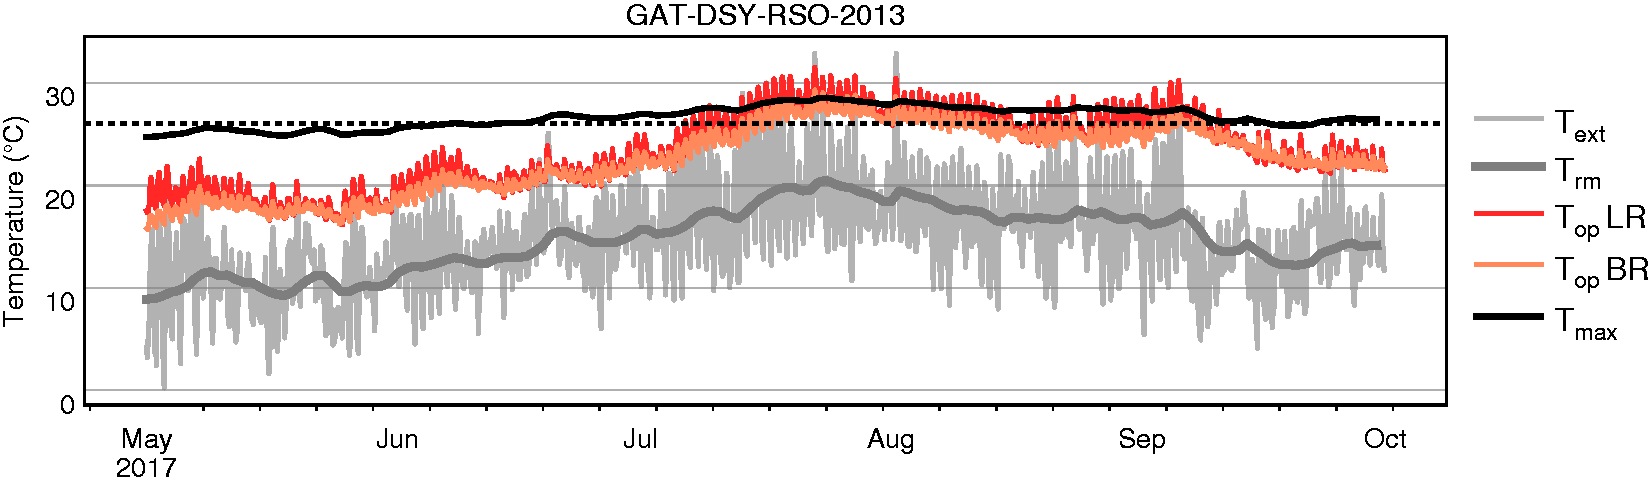
Operative temperature data for the living room (Top LR) and for the bedroom (Top BR) when using a DSY-type file with RSO-derived irradiance data (file 4). External temperatures (Text), running mean temperatures (Trm) and adaptive comfort maximum temperature Tmax are also indicated. The dashed line indicates the 26°C threshold used by TM59 overheating criteria 2 and 3.
The last analysis was performed with AMY files (5, 6, 7) and represented the building performance for the year 2017, which is not characterised by any high peak temperature or warm spell duration (see the ‘Discussion’ section below), but for which data measured on-site were available as a reference. Table 2 reports the errors related to the two solar radiation models against monitored data, when: (i) deriving GHI, (ii) simulating indoor operative temperature and (iii) simulating indoor average illuminance. It can be noticed that errors for GHI are higher than those found when comparing simulation results obtained from different weather files. Except for the rMBE of average illuminance, all errors were smaller when using the RSO model rather than the CRM.
Relative errors for the year 2017, compared to results from monitored weather data.
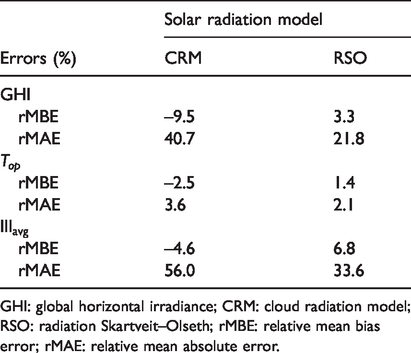
GHI: global horizontal irradiance; CRM: cloud radiation model; RSO: radiation Skartveit–Olseth; rMBE: relative mean bias error; rMAE: relative mean absolute error.
UDI results obtained with the three AMY files were largely in agreement with each other and with the results obtained with TRY files, as previously shown. On the other hand, observing the overheating analysis results from AMY files in Figure 7, it would appear that both solar radiation models led to an underestimation of the actual overheating hours resulting from monitored irradiance data (7). The CRM underestimated the overheated hours by up to 5.2% points (criterion 3, living room), often wrongly evaluating the spaces as within acceptable limits to avoid overheating risk. These larger errors are likely due to a combination of a simpler solar radiation model and of the greater distance between the building site and the weather station used to record cloud cover data. However, as the three files only differ from each other by their irradiance values, these results clearly show how much solar radiation can influence an overheating analysis using the TM59 criteria.
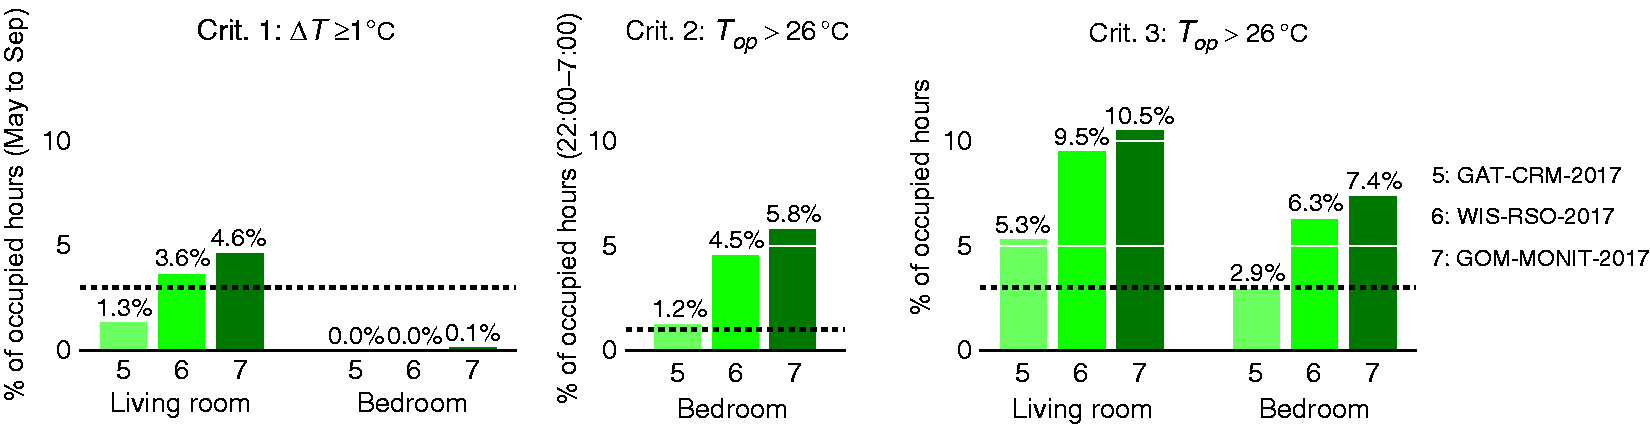
Hours of temperature exceedance (%) for living room and bedroom using the CIBSE TM59 criteria for naturally (criteria 1 and 2) and mechanically ventilated homes (criterion 3). The dashed line indicates the CIBSE hours of exceedance thresholds.
Discussion
Results showed that detailed analysis is necessary to design high performance buildings incorporating passive design strategies, and to take informed decisions on assessments of indoor comfort. For example, a daylight analysis presented with monthly UDI results (Figure 4) is more informative than looking at annual values and allows the month-by-month comparison with temperature results (Figure 6). Coupling daylight and overheating analyses enabled the discussion on the design of windows and shading elements, which were found to allow too much direct sunlight into the living room during summer months, and suggested the introduction of an overhang or roof eave that might prevent part of the summer excessive overheating without daylight falling below the comfort threshold.
Moreover, detailed simulations need accurate input data in order to produce meaningful results. The comparison performed between weather files using the CRM and the RSO models showed that the latter resulted in smaller errors against GHI data monitored on-site, and in an increased similarity of probability density distributions. This finding did not directly translate in a similar improvement for both types of simulations performed in the study, daylighting and overheating. Daylight results, analysed as UDI values, did not show significant differences when performed with weather files that used different solar radiation models. This is in contrast with previous studies29,44 and it can be attributed to the specific geometry of the rooms under analysis, characterised by predominantly indirect illumination and therefore less affected by differences in direct sunlight. Furthermore, previous studies showed that UDI is largely insensitive to the scale of input variation applied here.40,45
On the other hand, results demonstrated that overheating analysis is sensitive to the choice of solar radiation model and that the RSO introduced a significant improvement over the CRM model currently used. The difference was particularly pronounced for TRY-type files (up to 8.3% points), as solar radiation also influences the selection of representative months within the FS-ISO procedure, leading to weather files markedly different from those created with the CRM. Even though the creation of the TRY files used in this work selected representative months from a smaller pool or years (2006–2018 period rather than the 1984–2013 period), it still complies with the minimum of 10 years suggested for building simulation applications.46,47 Furthermore, with the effects of climate change intensifying in recent years, it could be argued that a shorter, more recent period is actually more representative of near-future building performance. The Met Office reported that – within the 1884–2018 period – the 10 warmest years all occurred after 2002. 48
DSY files exhibited a smaller discrepancy due to the solar radiation models (up to 1.7% points), but again the RSO model led to a systematic increase in hours of temperature exceedance for all TM59 criteria. It is instructive to note that the implementation of the new solar radiation model caused the TRY files to predict a higher overheating risk than the DSY files, when assessing criteria 2 and 3, whereas the old CRM model did not produce this effect. Part of the cause may be that TRY files were produced from Heathrow, a peri-urban station that is impacted by the London urban heat island and generally records higher temperature values than the rural station at Gatwick 49 used for the creation of DSY files. Another contributing factor might be that the selection of any DSY-type year is exclusively based on temperature data, meaning that the effect of solar radiation is not taken into account when identifying moderately warm years – even if solar radiation clearly influences overheating assessments. In previous studies, buildings designed as per Passivhaus standards were found to be particularly influenced by the amount of solar irradiation they receive, with direct consequences for peak loads assessments.7,8
AMY files constructed for the year 2017 showed that the use of the RSO model reduced GHI mean bias errors from the –9.5% exhibited by the CRM to a 3.3%, and mean absolute errors from 40.7% to 21.8%. Such improvement in accuracy also led to a more reliable assessment of overheating risk when compared against the hours of temperature exceedance resulting from the file created with on-site monitored global irradiance (file 7 in Figure 7). Both models under-predicted the overheating risk assessed with monitored data, but the CRM is characterised by differences of up to –5.2% points, whereas the RSO is limited to a maximum of –1.3% points. In contrast to the TRY and DSY files, the three AMY files were not created from the exact same location and it is likely that this led to a larger difference in overheating results than that caused by solar radiation models alone. However, CIBSE weather files are provided for only a few locations and it is common that the distance between any building site and the closest available CIBSE file location might be even greater than the one considered here (18 km).
When comparing the expected overheating design performance using DSY files from 2013 to the performance obtained using monitored weather data from 2017 (files 3 and 4 in Figure 5, and file 7 in Figure 7), it can be noticed that selecting the year 2013 for the evaluation coincidentally led to similar values of hours of temperature exceedance than those found for the year 2017. However, the summer of 2017 was not considered warm, as Figure 8 shows. There, the duration of the longest warm spells recorded during the years 2006–2018 is displayed, together with the mean and maximum temperatures registered at the Met Office station in Gatwick. Warm spell duration was calculated by counting the continuous days during which at least one hour recorded temperatures higher than a location-dependent threshold (24.7°C for Gatwick) and considering part of the same spell those days exceeding the threshold and separated by three or less days below the threshold. 28 The year selected for the DSY files creation (2013) is characterised by a longer warm spell than the year during which the monitored data were collected (2017), and yet the results from the overheating analysis suggest that those two years would lead to similar risk of overheating in the house living room and bedroom. Thus, selecting a moderately warm summer from historical datasets (here 2013 was selected based on the work of Eames, 28 which considered the period 1984–2013) might fail to represent similar conditions for the near future, affected by increasingly warmer average and peak temperatures. To account for this, CIBSE TM59 suggests the use of future, moderately warm years (DSY1, for the 2020s, high emission, 50% percentile scenario) 43 that would likely result in higher overheating risk prediction. Further studies should investigate the effect of the new solar radiation model on weather files based on future weather projections, as well as the consequences for peak loads and heating energy demand on the Passivhaus model. In fact, DNI was already found to have a strong impact on low-energy building design, 8 and the implementation of a better quality solar radiation model would ultimately lead to improvements in the health and comfort of building occupants.
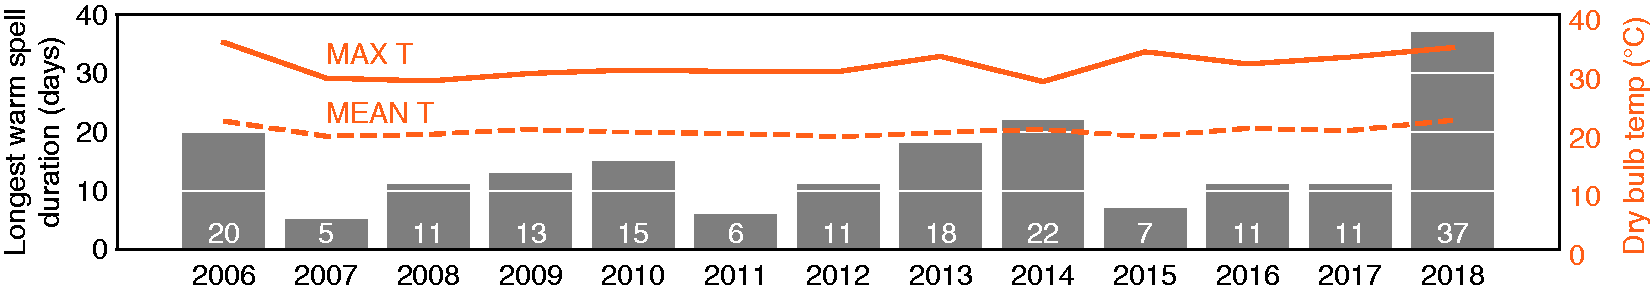
Maximum and mean temperatures recorded at the Gatwick Met Office station between the years 2006 and 2018, during non-heating season (May to September). The duration of the longest warm spell for each of those years is also indicated, in days.
Conclusion
The analyses presented in this paper emphasised the importance of coupling daylighting and overheating assessments to inform building design strategies that meet both indoor visual and thermal comfort requirements for a dwelling built to Passivhaus standards. In order to meet such requirements, detailed investigations should be performed, considering seasonal and daily variations of multiple environmental factors.
Additionally, the effect of implementing a more accurate solar radiation model for indoor comfort analyses at different design stages was investigated, demonstrating that solar radiation can significantly affect the results of overheating risk assessments performed as per CIBSE TM59. TRY-type files led to the highest differences due to solar radiation model choice (up to 8.3% points), as global irradiance is also used in the selection of representative months from multi-year datasets. Daylight evaluations that used UDI as comfort metric were not affected by the choice of solar radiation model for the evaluated spaces. However, this might be due to the fact that both rooms under analysis received direct sunlight only on a limited portion of the space, because of their orientation and external shading elements. DSY-type files that used the new RSO model showed higher ratios of temperature exceedance in the two rooms under evaluation, compared to ratios predicted with the CRM model (up to +1.7% points). Analyses performed against results obtained from on-site monitored weather data for the year 2017 confirmed that the new RSO model is more accurate than the CRM in evaluating irradiance components and overheating risk.
The findings from this study urge future releases of weather files to carefully consider the solar radiation component, which can play a significant effect in building design that involves more passive principles and comply to highest standards of air tightness.
Footnotes
Acknowledgements
The authors gratefully acknowledge the Chartered Institution of Building Services Engineers (CIBSE) and Loughborough University. Furthermore, they would like to thank Mr and Mrs Karlsson for their kindness to offer their house for the monitoring project, and Mr Kostantinos Mourkos for providing the 3D model. Further acknowledgements go to the people and agencies responsible for the data networks used in the study: all environmental data were kindly made available by the Met Office, and the additional satellite irradiation data for Gomshall were sourced from the Copernicus Atmosphere Monitoring Service (CAMS).
Declaration of conflicting interests
The author(s) declared no potential conflicts of interest with respect to the research, authorship, and/or publication of this article.
Funding
The author(s) disclosed receipt of the following financial support for the research, authorship, and/or publication of this article: E Brembilla would like to thank the Chartered Institution of Building Services Engineers for the financial support of this research.