
Abstract
This paper is presented in the context of a gradual move from energy management at a Building level to energy management at Component level. This move requires specific energy consumption and power demand benchmarks to allow measured component energy use and power demands to be put into context. The paper presents a methodology for collecting and collating the data needed for producing these benchmarks from measured operational data. This methodology was tested in the European iSERVcmb project. Example benchmarks from iSERVcmb are provided along with links to the full published data. The paper concludes that large scale measurement and comparison of detailed operational data are possible and useful in support of achieving operationally low energy buildings.
Be collected from all types of buildings across all EU Member States Produce benchmark ranges of operational energy consumption and power demands at the level of individual components serving given activities Improve their operational energy efficiency, Enable legislation using this data to show compliance
Applying this benchmarked data in the design and operation of buildings will:
Introduction
This paper examines how detailed energy consumption data can be used to help produce benchmarks of operational energy use and power demands in building HVAC components. It is part of a wider body of work started in the IEE HARMONAC Project (www.harmonac.info) and continued through into the iSERVcmb project (www.iservcmb.info). The individual HVAC component operational performance data derived from the measured data for iSERVcmb are available to download from the iSERVcmb website.
The paper presents the methodology used for collecting and collating detailed, physically-based data about HVAC components and the buildings in which they operate. The use of a common framework is a pre-requisite to enable comparisons to be drawn between the consumption and the power demands of individual components in different buildings.
The use of Operational Data to Benchmark Buildings is now gaining commercial credence, with schemes such as the Australian NABERS Rating System 1 using operational data at their core, and the mass collection of building operational data underpinning the database 2 operated by the US Office of Energy Efficiency & Renewable Energy. CIBSE also provide a guide to evaluating the operational energy performance of buildings 3 and there is a growing body of work around the world that is now using these new operational data streams to provide a better understanding of the use of energy in buildings and systems. From a bottom-up viewpoint, manufacturers are also attempting to leverage this information in the form of add-on commercial products with companies now starting to market the abilities of their products to provide real-time insights into their performance. However, this information often exists with no context of what is being serviced by the component, and therefore whether the data provided are indicating good or poor behaviour from an energy viewpoint.
At present, iSERVcmb is believed to be the only approach currently benchmarking operational performance at the level of individual components and activities, right up to whole buildings and Estates.
This look at detailed operational energy use and power demand data is timely because low cost energy use data at the level of individual components and processes is now becoming available from all aspects of the built environment. This new data availability heralds an inevitable move from theoretical assessment of building energy performance to measured assessment, with all the benefits that the certainty of measurement should bring.
The aims of iSERVcmb in the context of this paper were to establish firstly that it was practical to collect and collate data at this level of detail, secondly to understand which parts of the procedure were simple and which problematic from a practice viewpoint and, finally, to establish a first set of published data on the measured energy and power demands of the HVAC components in the participating buildings
As this is the first time that a comparison of European-wide continuous sub-hourly data collection on HVAC component energy use servicing given end use activities has been undertaken, the data produced should be considered only as a first indication of the energy consumption and power demands being achieved by these components in practice in operational buildings.
Whilst not the subject of this paper directly, it should be noted that a driving motivation for the iSERVcmb project was the observation from HARMONAC that providing detailed information on the operational energy use and power demands of individual HVAC components often led to rapid improvements in their performance, as the operators could see clearly what needed to be addressed. Data obtained at this level of detail can therefore be seen to be applicable to both energy management practice and legislative procedures via benchmarking.
There are many other operational and management benefits of having this data, including business continuity, cost-optimality calculations, etc., but the rest of this paper focusses on the process of obtaining the energy and power demand data.
Background
The Energy Performance of Buildings Directive (EPBD) 4 legislation to formally provide more accountability for energy use in European Buildings was introduced over 11 years ago in 2002. This had at its heart measures and requirements which were suitable for the technology and knowledge of building energy use at the time. It also reflected the skills available in the marketplace, with an eye on improving requirements over time.
Since 2002, however, we have had a revolution in computing, metering and communication. It is now commonplace for us to be able to use mobile devices to control and access information from almost anywhere in the world. Despite their relatively slow pace of change compared with other markets, Buildings Services have not been immune to this change and we can now use mobile phones to turn our domestic heating on or off, or to interrogate individual items of Building Services plant.
It therefore seems an appropriate time to reappraise the information we have available to us to understand and control the energy use of our buildings, and in particular the energy use of Heating Ventilation and Air Conditioning system components, to see if there is a more effective way of assessing building energy use which allows better understanding of opportunities for reducing this consumption.
The current mainstream approach to understanding energy end use in buildings has been to model the building and then use either top-down or bottom-up approaches to estimate where the energy is being used e.g. CIBSE TM22. 5 This has led to the emergence of the ‘performance gap’ term where the energy consumed by the building as a whole does not match that predicted by these models and techniques.
There is a wide body of research dealing with the need to use measured data to calibrate models to reduce this gap, with some examples given in the references.3,6–9 At present, their main conclusions are that it is possible to tune some building models to accurately predict what the measurements are providing – meaning that for those particular buildings the elements creating the energy demand are reasonably well understood. However, most buildings do not yet have models and are unlikely to have access to the resources and expertise to undertake such an exercise.
Other research examining the development of benchmarking methodologies10–13 shows that almost all benchmarking approaches are underpinned by modelling. There are at present no building benchmarking and performance assessment approaches implemented which use operational data to provide both the benchmarks and assessment. This paper forms part of a procedure which proposes to introduce such an assessment approach.
The approach used in this paper arises from research at both the UK and European level. The EU IEE AUDITAC project 14 aimed to show the likely impact on energy use in AC systems of Inspection as required by EPBD Article 9. 4
AUDITAC concluded that the EPBD would not have the impact on energy use in AC systems hoped for, mainly due to a lack of skilled Inspectors to implement Article 9 across the AC systems falling within its scope but also due to a severe lack of independent data on the actual energy use of AC systems in operational buildings. There was also a concern (borne out by the subsequent development of the Inspection market into primarily a compliance market) about the lack of feedback on the impact of Inspection as there was no mechanism for assessing energy savings achieved as a result of Inspection.
The IEE HARMONAC project 15 was proposed and coordinated by the author between 2007 and 2010. It obtained information from across Europe on the energy savings identified by Inspections compared with the energy savings identified from detailed energy metering of 42 AC systems across Europe. One of the main conclusions was that a good Inspection would on average identify only ∼37% of the energy savings that sub-hourly energy metering suggested existed. However, perhaps more importantly, it was clear from HARMONAC that owners would act on the detailed meter data to implement many of the savings identified, as the benefits could be clearly calculated and hence the investment risk was reduced.
iSERVcmb 16 built on the findings from HARMONAC. It proposed that empirical data from automatic metering and physical observations should be obtained at the level of individual HVAC components. This data, in conjunction with knowledge of the activities served by these components and other parameters, such as the floor area being serviced, allowed benchmark ranges of achieved performance to be produced, enabling comparisons to then be made across buildings and systems.
An important part of the procedure is that iSERVcmb obtains the area and activity being serviced by an HVAC component through connecting each HVAC component via an HVAC system to the specific areas they service within buildings. This means that the energy and the power demand benchmarks derived are based on a more focussed understanding of the actual load being imposed on a component, rather than whole building areas which are more commonly used in benchmarking at present. A consequence of this is that iSERVcmb can benchmark HVAC system performance at the level of individual spaces and activities – a feature that is of value in determining appropriate benchmarks for HVAC systems in buildings which cross traditional sectoral definitions. This data also have the potential to be of value to legislation.
The debate about how we might reappraise our method of assessing energy use in buildings and systems is one that the HARMONAC and iSERVcmb projects have presented to Europe as a whole 17 and will not be covered in depth in this paper. However, the project also demonstrated that the actual energy use in operational buildings can be reduced significantly and cost-effectively through the use of detailed operational energy use data at the level of individual HVAC components.
The value of detailed operational data in achieving operational energy efficiency has already been recognised by the European Commission following the finding from the IEE HARMONAC project that detailed monitoring can help identify and reduce excessive energy consumption in Air-Conditioning systems. As a result, the recast of the EPBD in 2010 18 incorporates the requirement for Member States to ‘encourage the introduction of intelligent metering systems’ in Article 8 as well as specifically noting in Articles 14 and 15 (relating to the Inspection of Heating and Air-Conditioning Systems) that ‘Member States may reduce the frequency of such inspections or lighten them as appropriate, where an electronic monitoring and control system is in place’.
The rest of this paper deals only with the issues surrounding the derivation of comparative energy use and power demands in HVAC components and systems.
Data collection methodology
Data collection – spaces, activities, meters and HVAC
The iSERVcmb project revealed that the greatest uncertainty in the use of operational data is when the data themselves are clearly ‘wrong’ for some reason. This uncertainty most often comes from the following:
Poor data collection techniques and protocols, including frequent meter errors and missing data (which is particularly important for pulse meters which simply record consumption per interval, not overall consumption) Poorly installed meters, leading to larger inaccuracies than expected Poor understanding of the installed metering systems and what they are connected to Lack of certainty over where the HVAC components/systems the meters are connected to actually serve
The key to achieving meaningful results, as with any comparative process, is to minimise the uncertainty in the data that underpins the benchmark ranges we intend to create. A standard methodology for collecting this data was trialled during iSERVcmb. An Excel spreadsheet (available for free from www.iservcmb.info or www.k2nenergy.com) was produced as a framework for describing a buildings’ HVAC components, the spaces and activities they serve, and their meters. Figure 1 shows how the iSERVcmb spreadsheet is structured to capture these details and, as importantly, Empty iSERVcmb spreadsheet showing some of the data fields to be collected.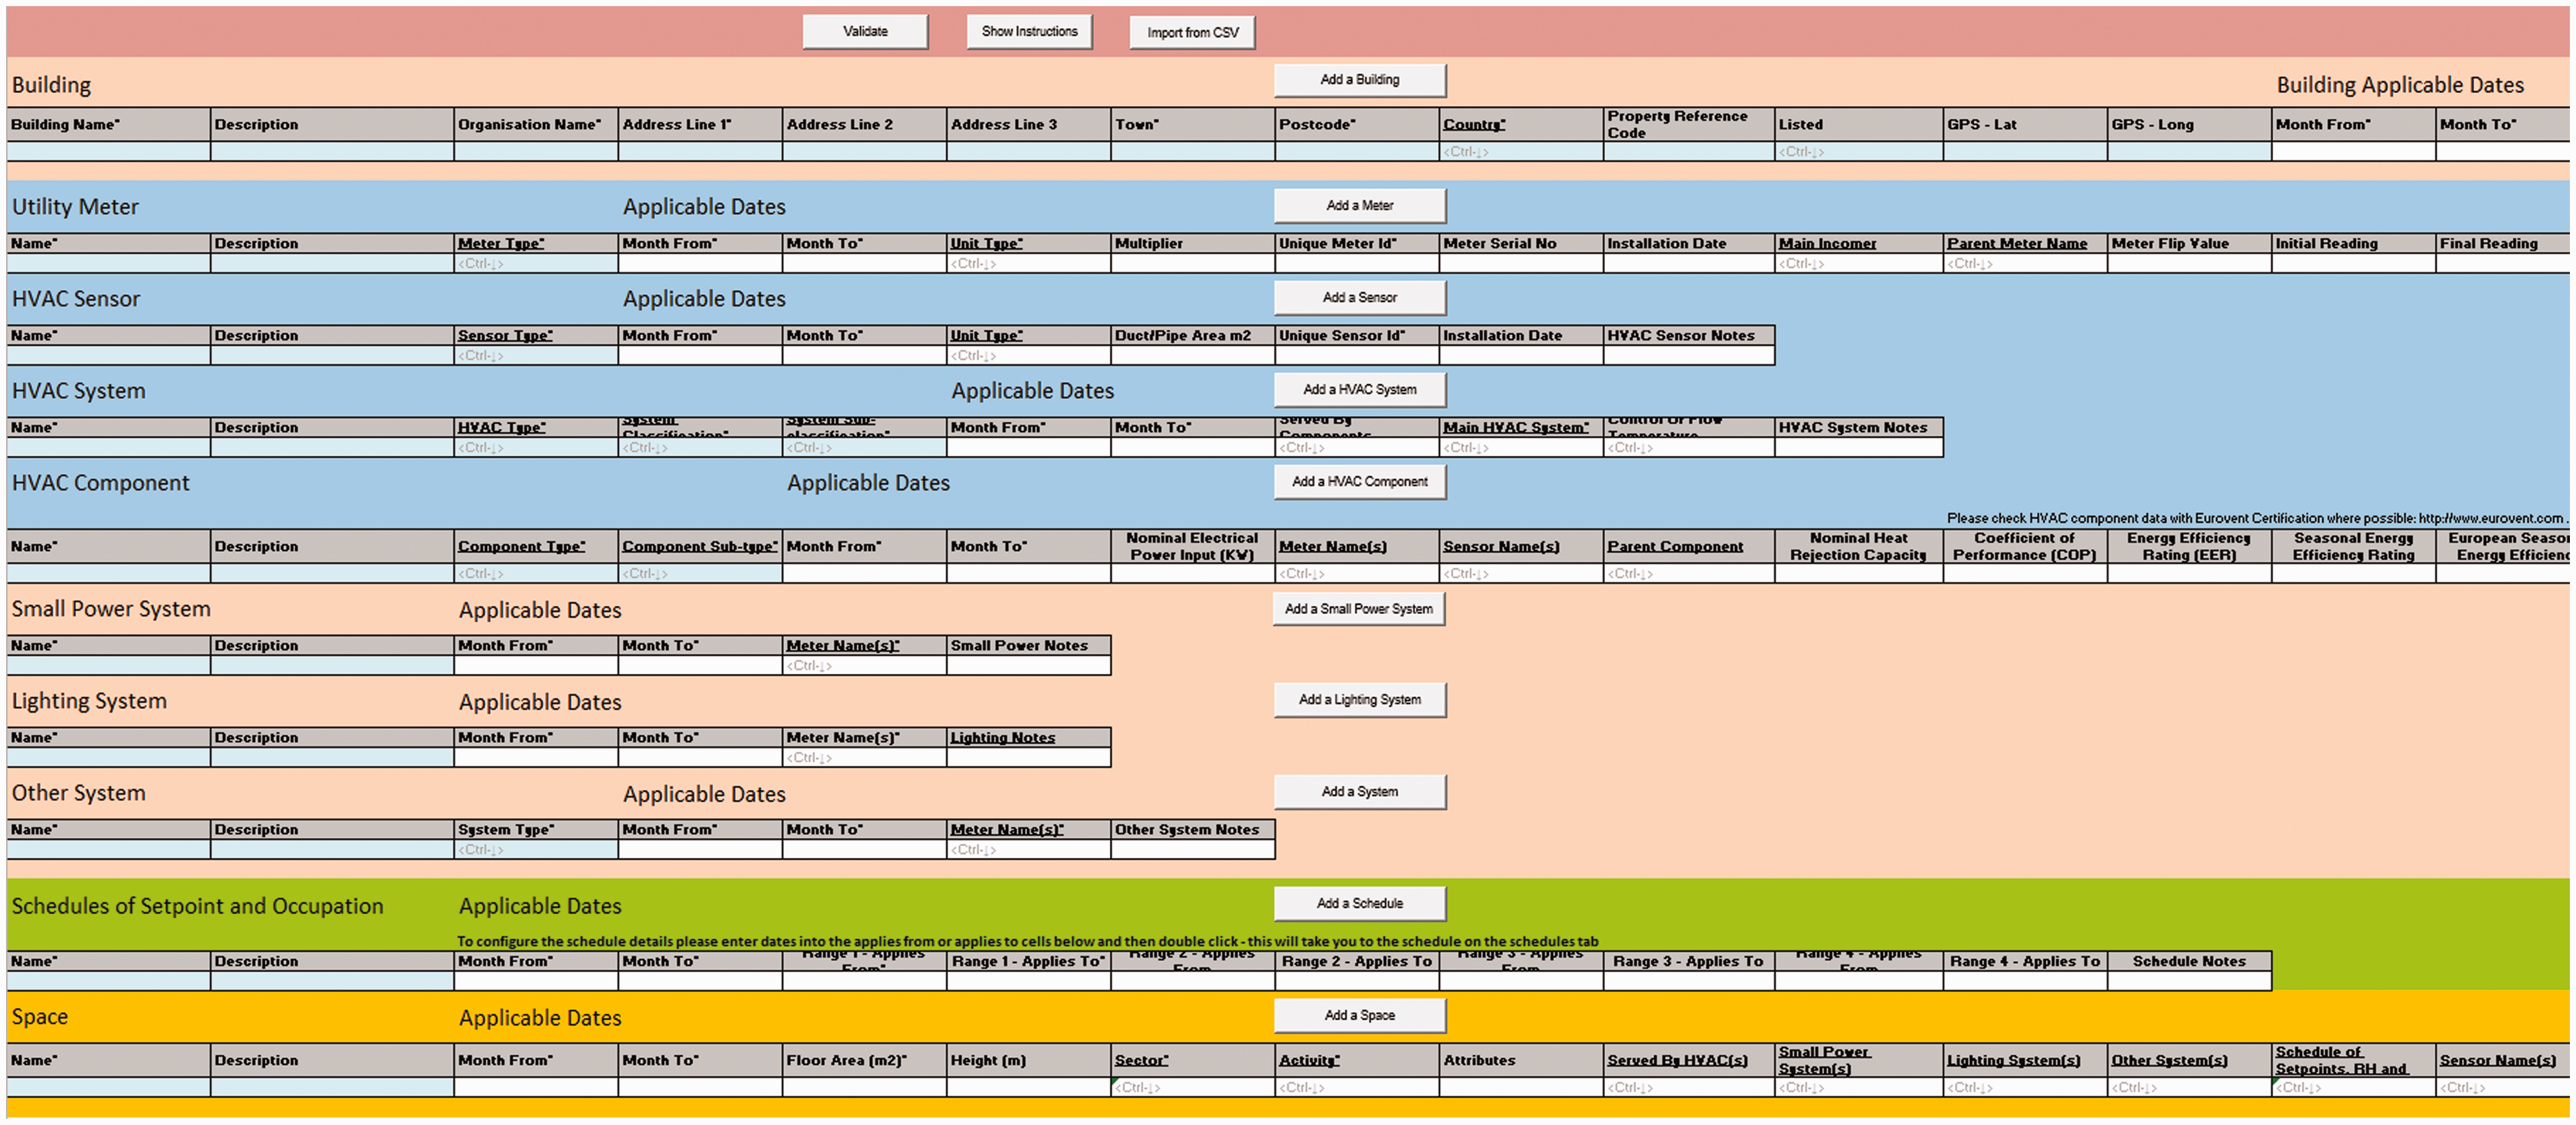
Figure 2 shows in graphical form how the asset data in the spreadsheet is inter-connected.
Connecting the building assets.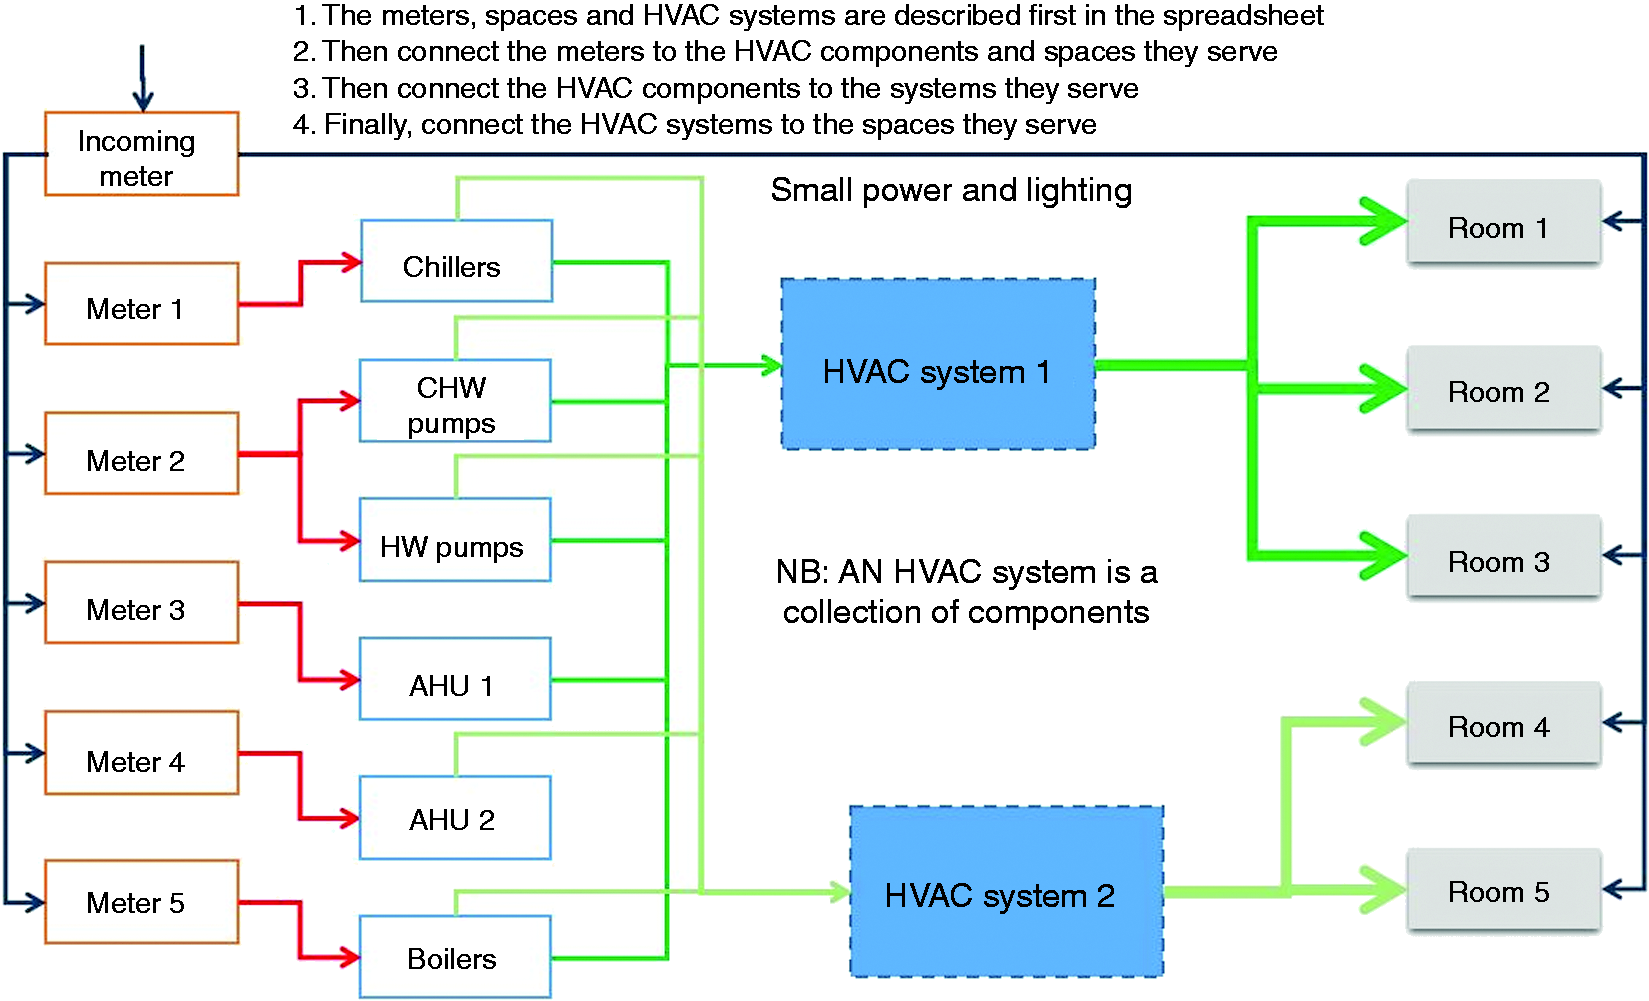
The feedback from the project for this approach from end users is promising. The concept is easy to understand as it relies on physical data which can be described, measured and verified on site – which means the data have value beyond the task of helping establish benchmarks. Essentially, the spreadsheet acts as an enhanced asset register for many of the physical assets of the building that influence its energy consumption. The main omission, for practical reasons, were most of the physical descriptions of the building and its fabric, meaning that at this stage the framework could not be used to model heating and cooling demands for a building in much detail. However, given that we were recording the actual energy use of the building which incorporated all the interactions between occupancy, climate and fabric then this was considered an acceptable compromise at this stage.
The main hurdles to overcome for the widespread use of the process are:
It became clear from undertaking the HARMONAC and iSERVcmb studies that few buildings in Europe have records of this basic information, let alone understand how their services work in detail. This means there is a time investment needed to provide the initial details required. There is a case to argue that this information should be known by any professional before any energy efficiency retrofit measures are attempted, but practical and economic reasons have meant that these have not been valued in operational buildings until recently. With any measurement and descriptive exercise there is also the scope for uncertainty. This includes the choice of activity to describe the primary use of a space and the more obvious potential for errors in the measurement of area and energy use already noted. Achieving robust operational data collection and transmission on a continuous basis
Data collection – energy consumption and sensor data
Having collected and collated each building’s physical elements, iSERVcmb then collected the sub-hourly data for its ELECTRICAL energy meters, and any provided sensors, at least once a month. The iSERVcmb project collected information from 330 buildings in 20 EU Member States. The data covered 2 831 HVAC systems, 7 685 HVAC components, 2 230 m, 11 173 Spaces, 72 different Activity Types and 1 551 638 m2 of floor area. The sub-hourly data collected for these systems covers from a few months to over 5 years, including some historic data. Most of this information is at 15 or 30 min time intervals.
Figure 3 shows an example of this data in the form of a 15 min carpet plot, taken from October 2012. It shows the measured consumption through the electricity meter serving a Portuguese HVAC system consisting of Chillers, Pumps and AHUs. This carpet plot separates the data into 10 energy use bands, enabling periods of high and low energy use to be quickly identified by day and time over a specific month.
A Carpet Plot showing the 15-min energy use of a Portuguese HVAC system consisting of Chillers, Pumps and AHUs in October 2012.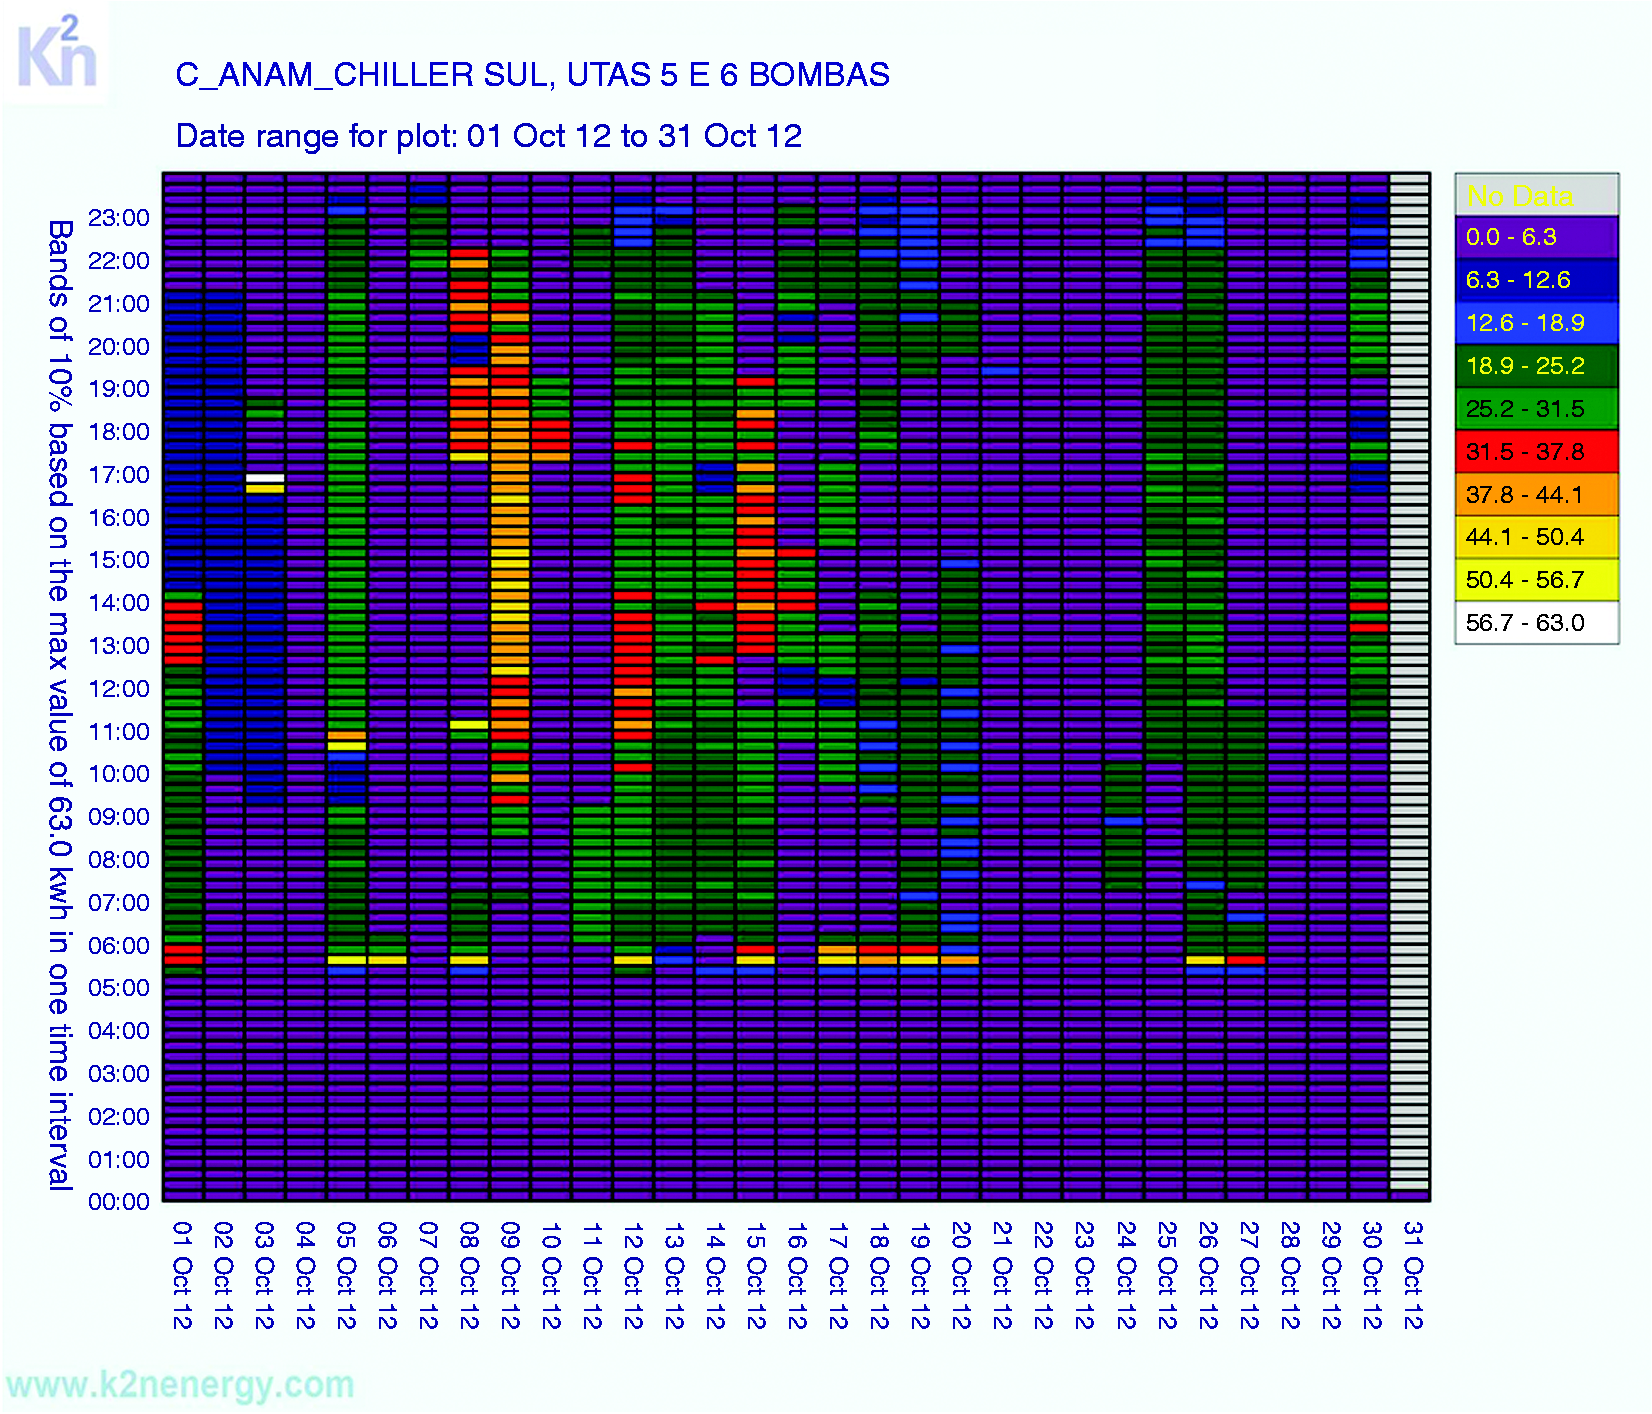
We can also view this information in the form of scatter graphs showing time of day power demand or energy use over an extended period. Figure 4 shows the range of average recorded power demand per m2 over a year for a complete HVAC system serving the activity of ‘Generic Check-In’ for each hour of the day for weekdays in Portugal.
A Scattergraph plot of the average weekday power demand per m2 by time of day for an HVAC system serving the ‘Generic Check-In’ activity in Portugal.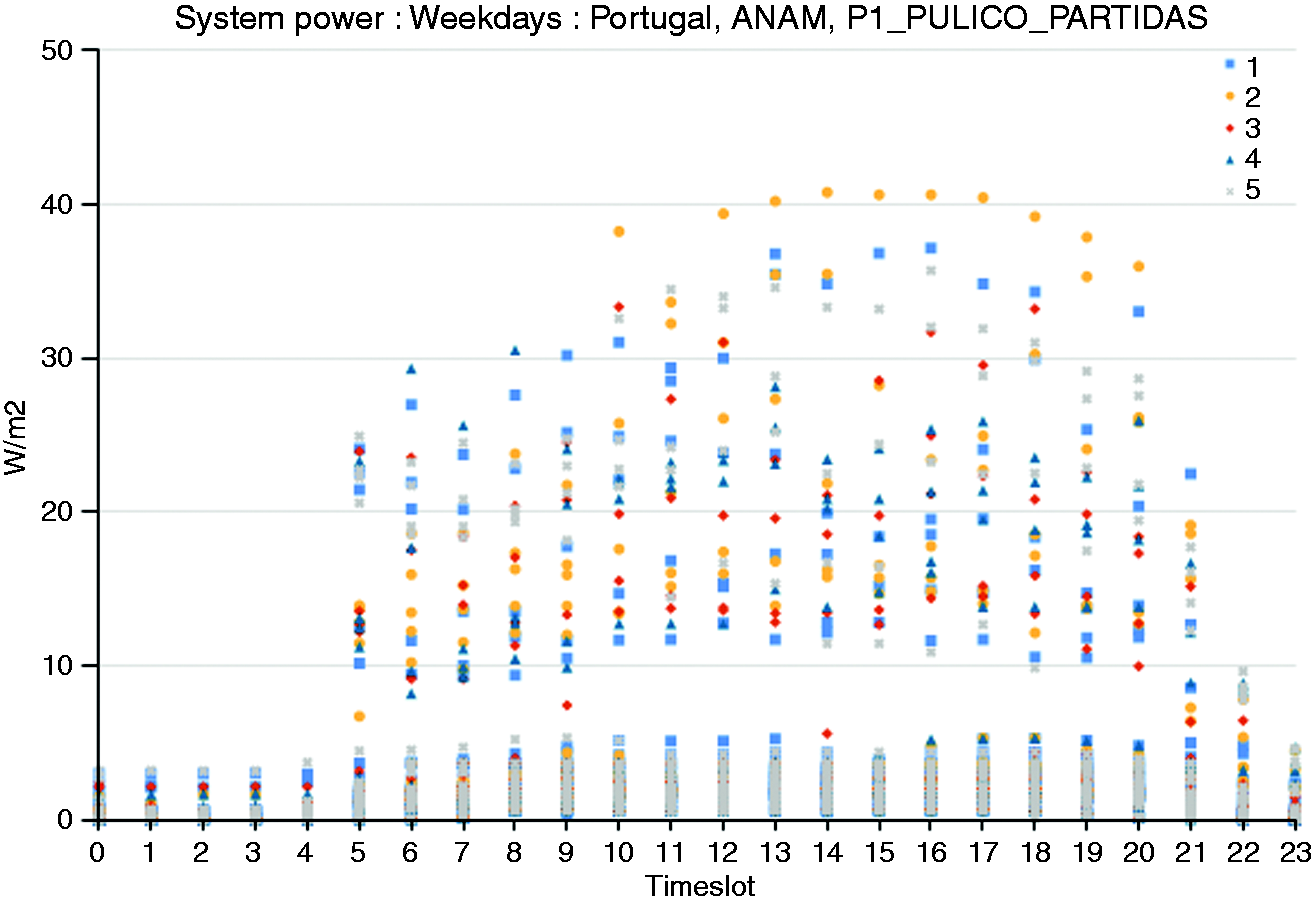
The maximum, minimum and average power demands for the system can be clearly seen by hour of the day for the weekdays across a whole year. From knowledge, taken from the spreadsheet, of the components, their nominal power ratings and other components on the same meter serving the same end uses, along with analysing the profiles from various parts of the year, we can apportion the power demand between the various HVAC components that comprise the system being metered.
The same information can be used for operational, diagnostic and benchmarking purposes.
Data reliability and accuracy
The production of benchmarks of any kind requires confidence in the data from which they are derived – in this instance that includes measurements of area, activity, etc., as well as the recorded consumed energy. For any initial attempt at deriving this information in the real world then, as noted earlier, there will always be uncertainties, especially when applied across differing cultures in the EU, as with the iSERVcmb dataset.
iSERVcmb used the RICS definition of Gross Internal Area 19 ‘the area of a building measured to the internal face of the perimeter walls at each floor level’ as its measure of area – which means that individual spaces should be measured to the centreline of any internal walls or partitions. However, floor area within buildings submitted to the database may not always adhere to this standard. The paper by Warren 20 on the worldwide variation in measurement standards of floor area across commercial buildings indicates that the largest likely floor area measurement variation due to different measurement practices will be around 5% (4.8% in the paper by Warren) across all areas supplied to the project database. As iSERVcmb refers to spaces by individual sizes, it is likely the room areas supplied have been taken to the inner faces of the room partitions rather than the partition centre lines, so it is also more likely that the areas supplied will be up to 5% too small rather than too large. The error ranges calculated for iSERVcmb take this into consideration by assuming the actual area is in the range of 99 to 104% of the area provided.
For electricity meters, the project assumes they have been installed correctly when the readings are not clearly erroneous (in which case these data are queried and checked by the relevant iSERVcmb Partner for the EU Member State) so a general error of ±2% has been allowed for each reading, based on UK OFGEM guidance 21 indicating a range of +2.5% to −3.5% to be acceptable in such meters. Other significant sources of error include multiplication errors and corrupted data streams, though these are relatively simpler to identify and either correct or discard.
However, the greatest error likely to be present with the data is associated with uncertainty over exactly what energy end uses each meter serves. A common finding across Europe, from both the HARMONAC and iSERVcmb projects, has been that, along with a lack of detail about their services, very few buildings have up-to-date records of exactly what is served from their metered distribution boards. When this is combined with the uncertainty over which areas some of the HVAC systems service, it is clear that deriving quantitative values for ranges of normalised ‘in use’ energy consumption and power demands for the 2 831 EU HVAC systems in iSERVcmb requires both subjective and objective approaches at this initial stage.
For iSERVcmb, the approach used to record the in-use energy consumption and power demands of HVAC systems and components is empirically-based. At this stage of their development, benchmarks derived from this data rely on the subjective judgement and experience of the author to interpret the reliability of the objective data being collected and produced. This interpretation is undertaken with reference to the larger dataset to ensure outliers are spotted and discussed with the original provider of the data before deciding whether to include or discard the data.
The author has been continuously involved in monitoring, analysing and predicting the energy use of operational buildings and HVAC systems since 1987 and has published numerous outputs ranging from UK Energy Consumption Guides, through Building and HVAC system energy use publications, to the final reports from iSERVcmb. 22 This experience is important to provide confidence in the initial operational energy use and power demand benchmark ranges published by iSERVcmb, examples of which are presented here.
To summarise, iSERVcmb produced a significant amount of information of the type presented in Figures 3 and 4 for individual operational HVAC components. These were metered either individually, or as part of a system, in buildings located across 20 EU MS. The reliability of this data for use in the benchmarks has been manually examined and queried where it varied significantly from other data for the same activities and components.
It is important that the benchmarks presented from this data are understood to be an initial view of what is happening in practice, based on pre-installed metering systems and building owners understanding of their Estate assets. No claim is made for their absolute accuracy as this was not possible to do over such a scale and variety of cultures within the project funding and time constraints. What is presented therefore is what the participating buildings and components would report as their energy use and assets (including floor areas) if queried.
Operational data benchmarks
A benchmark, for the purposes of this paper, is defined as a figure or range of figures encompassing the measured performance of operational components in buildings. They are NOT considered to be STANDARDS to be met, but the approach could form the basis of operational data standards if needed.
Benchmark types
From the iSERVcmb data, it is clear that there are categories of electrical energy use and power demand that are comparable across the EU. There are also other categories, usually to do with geographical location and climate, which are better dealt with through self-reference or reference only to local consumption figures. iSERVcmb had insufficient data to enable this latter analysis, so the range of achieved consumption and power demand figures presented covers all systems in the EU countries – though some of these figures are also presented at country level on the iSERVcmb website to enable these figures to be assessed further if needed.
We will further normalise some of the data for weather data in a later paper, but felt it was more important at this stage to produce a set of actual operational energy use figures with as little normalisation as possible to enable relatively ‘raw’ operational energy consumption data to be available for the debate on what role building services should play in achieving low or zero energy buildings in the near future. The only normalisation used in this paper is by floor area in m2.
If benchmarks are to have an impact in helping reduce the operational energy use of real buildings and systems then, from iSERVcmb and HARMONAC, they need to provide information in a way that allows clear connections to actions that can be taken to improve energy use or power demand.
We can produce two main types of benchmark from sub-hourly Operational Data – energy consumption (kWh) and power demands (W). Each can be normalised by a variety of parameters including floor area served – the most commonly used parameter at present.
The Insufficient detail to know WHERE action should be taken to improve. Building descriptions are too vague to allow meaningful comparison Floor area is not a good parameter for benchmarking some important activities, notably Server rooms, LAN rooms and high density IT rooms. Ignoring the value of the more detailed sub-hourly data often available for the main meter Requiring a full years’ data before a view on the operational performance can be derived. This makes it of limited use to commissioning of new build or evaluation of the impact of changes.
The main failing of this energy consumption benchmark however, is that reductions or increases in the kWh/m2.a figure for a building are very difficult to attribute to their causes. This makes it difficult to claim success from a particular energy conservation strategy or to understand what has caused the increase i.e. it tells you WHAT has happened, but not WHY or WHERE. This leads to increased risk in making investment decisions and poor recognition of the value of energy efficiency. This problem has led to the emergence of protocols such as IPMVP 23 to try and remedy this deficiency.
Conversely, an
For both benchmark types, the approach used enables benchmark
Having ranges of achieved performance as the benchmarks also allows use of the measured energy data to predict potential ranges of energy and cost savings for each situation, enabling cost-optimality to be quickly addressed. This ability to predict savings is key to much existing and future legislation.
Operational energy use and power demand benchmark figures
The initial benchmark types produced from the measured data, for each HVAC component serving a specific end use activity, are:
‘Annual energy use’ in kWh/m2 ‘Power in use’ in W/m2 ‘Monthly energy use’ in kWh/m2 for each month of the year ‘Power in use’ in W/m2 by time of day and month of year
Future benchmark sub-types possible once more data sources are available could include:
These are likely to need to be location and climate specific.
The data analysis undertaken to produce the first benchmarks compared the normalised measured data with initial predictions prepared by the author of HVAC component power and benchmark ranges when servicing specified activities. This was done to provide a ‘sanity check’ to the figures produced from the measured data. The 73,000+ initial separate benchmark predictions were based primarily on existing confidential commercial datasets available to the author, along with reference to other publications dealing with operational energy use benchmarks, such as VDI380724 and CIBSE Guide F.25,26
An example of how operational data and these predicted benchmarks compared for a limited sample drawn from the ‘Air Handling Units: Supply with Heating and Cooling variants’ subset of data is shown in Figure 5. The graphs show the minimum, average and maximum Example of measured data vs predicted power demand/m2 benchmarks for a Supply AHU component serving various end use activities.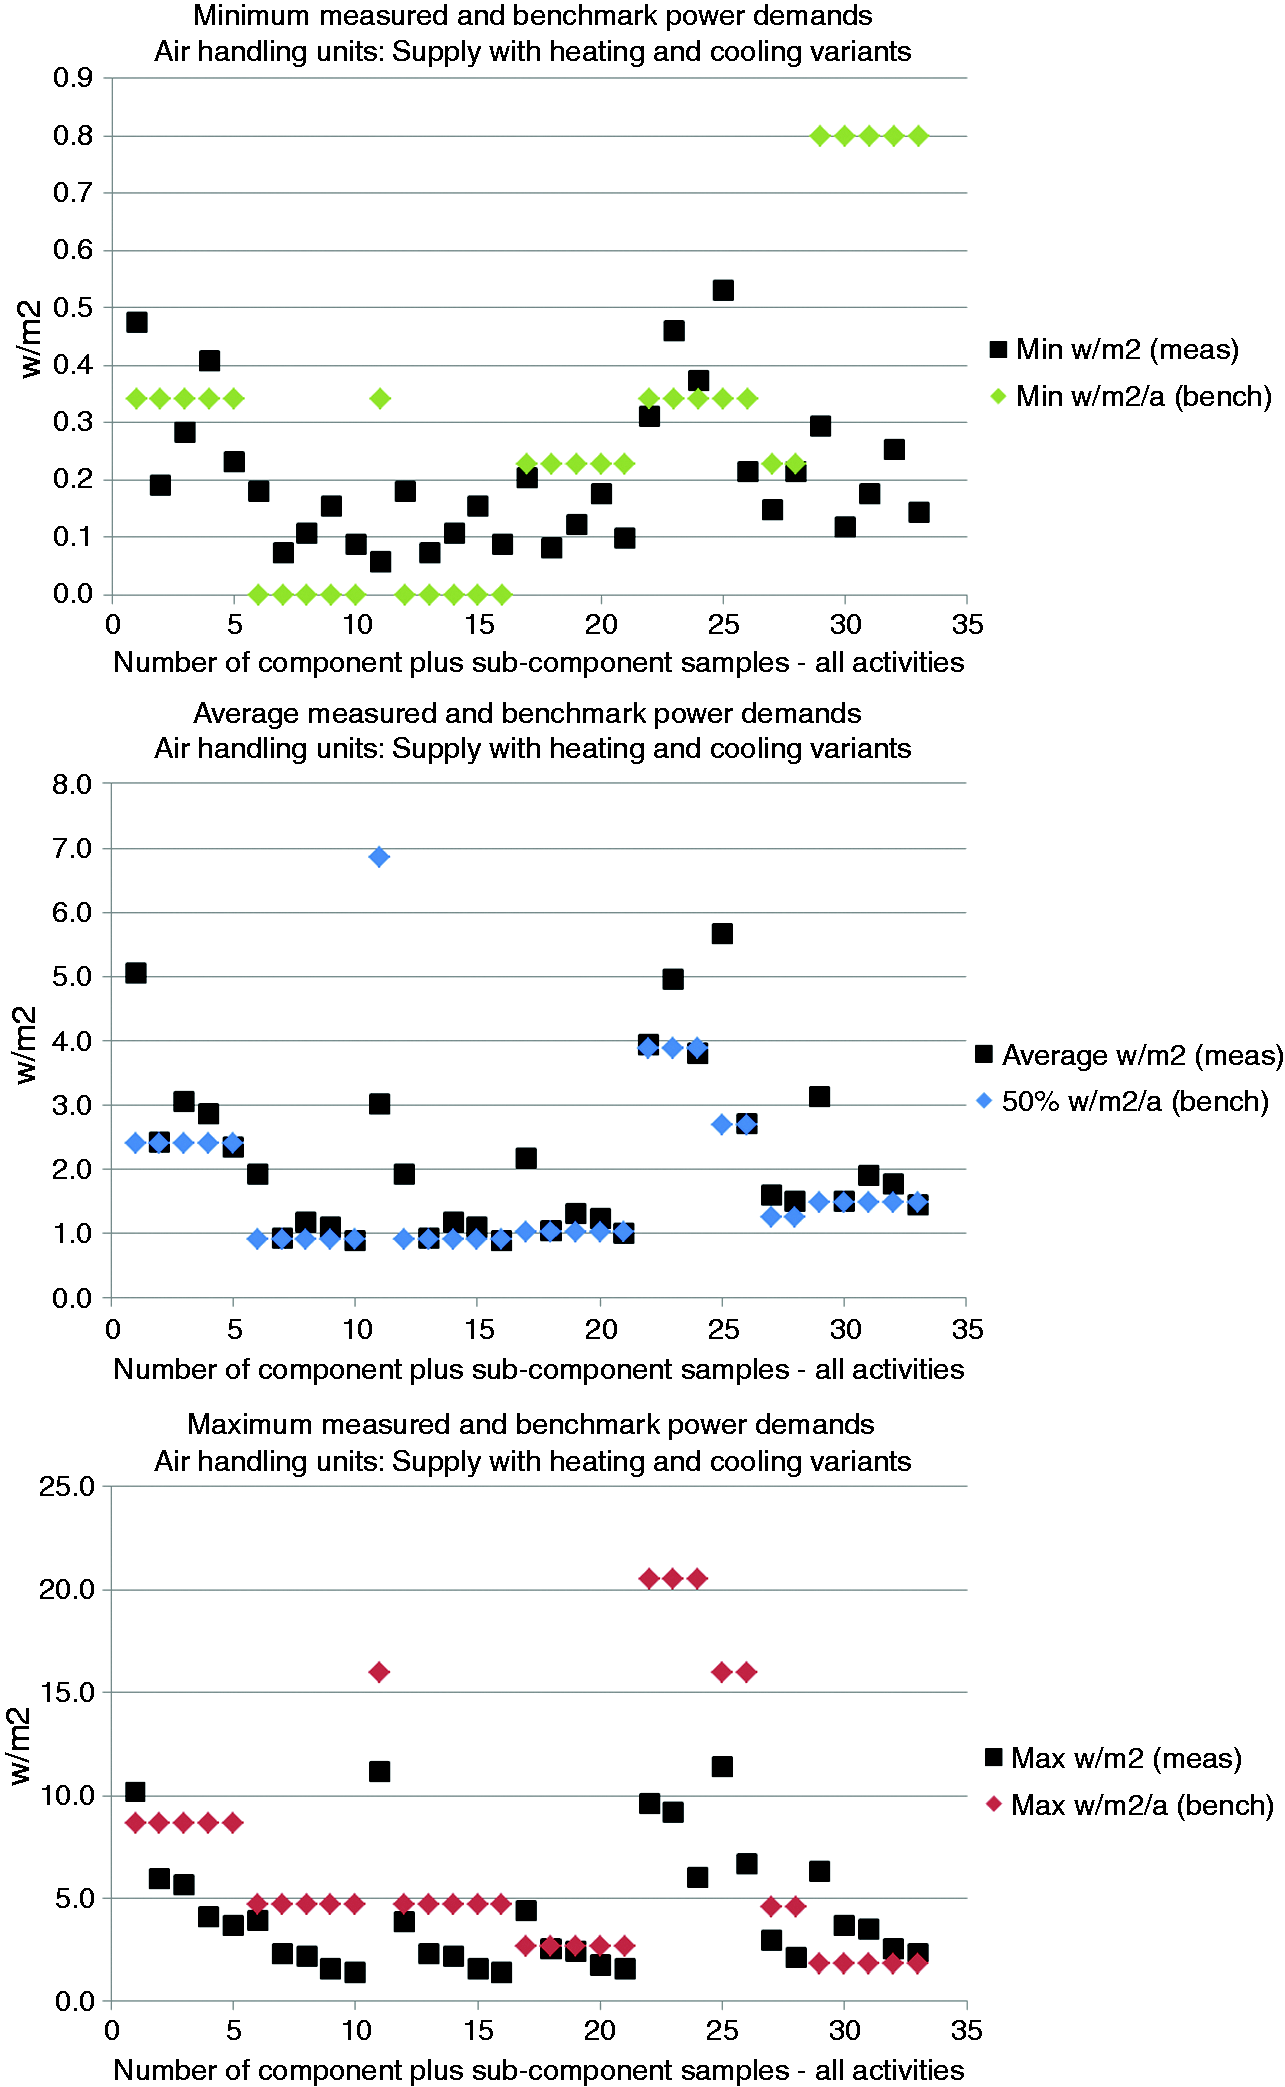
At present all benchmarks produced by iSERVcmb are based on the /m2 parameter for all combinations. These will evolve as the procedure is taken forward. For example, data collected by iSERVcmb indicate that IT LAN rooms and Servers, along with their associated services, should be separately metered to enable their consumption to be removed from that of the building as a whole. This is because volume or space occupied is a very poor guide to consumption efficiency for this activity.
Other activities and processes show similar characteristics regarding poor correlation with floor area, and these will be discussed further in other papers as the data are analysed in more detail. It is important to note that the iSERVcmb procedure is using the operational data to show what is happening in practice rather than assuming any form of relationship with any parameter. This means that the operational data benchmark ranges produced can show their derivation very clearly. Improving the accuracy of these benchmarks will be a trade-off between which normalisation parameter is the most accurate and which is the most practical to apply in operational buildings.
Figures 6 and 7 are examples from the iSERVcmb project
27
of the average annual energy use and power demand figures found for operational AHUs serving various end use activities around Europe.
Example of normalised average annual energy consumption benchmark by activity and component type. Example of normalised average power demand benchmark by activity and component type.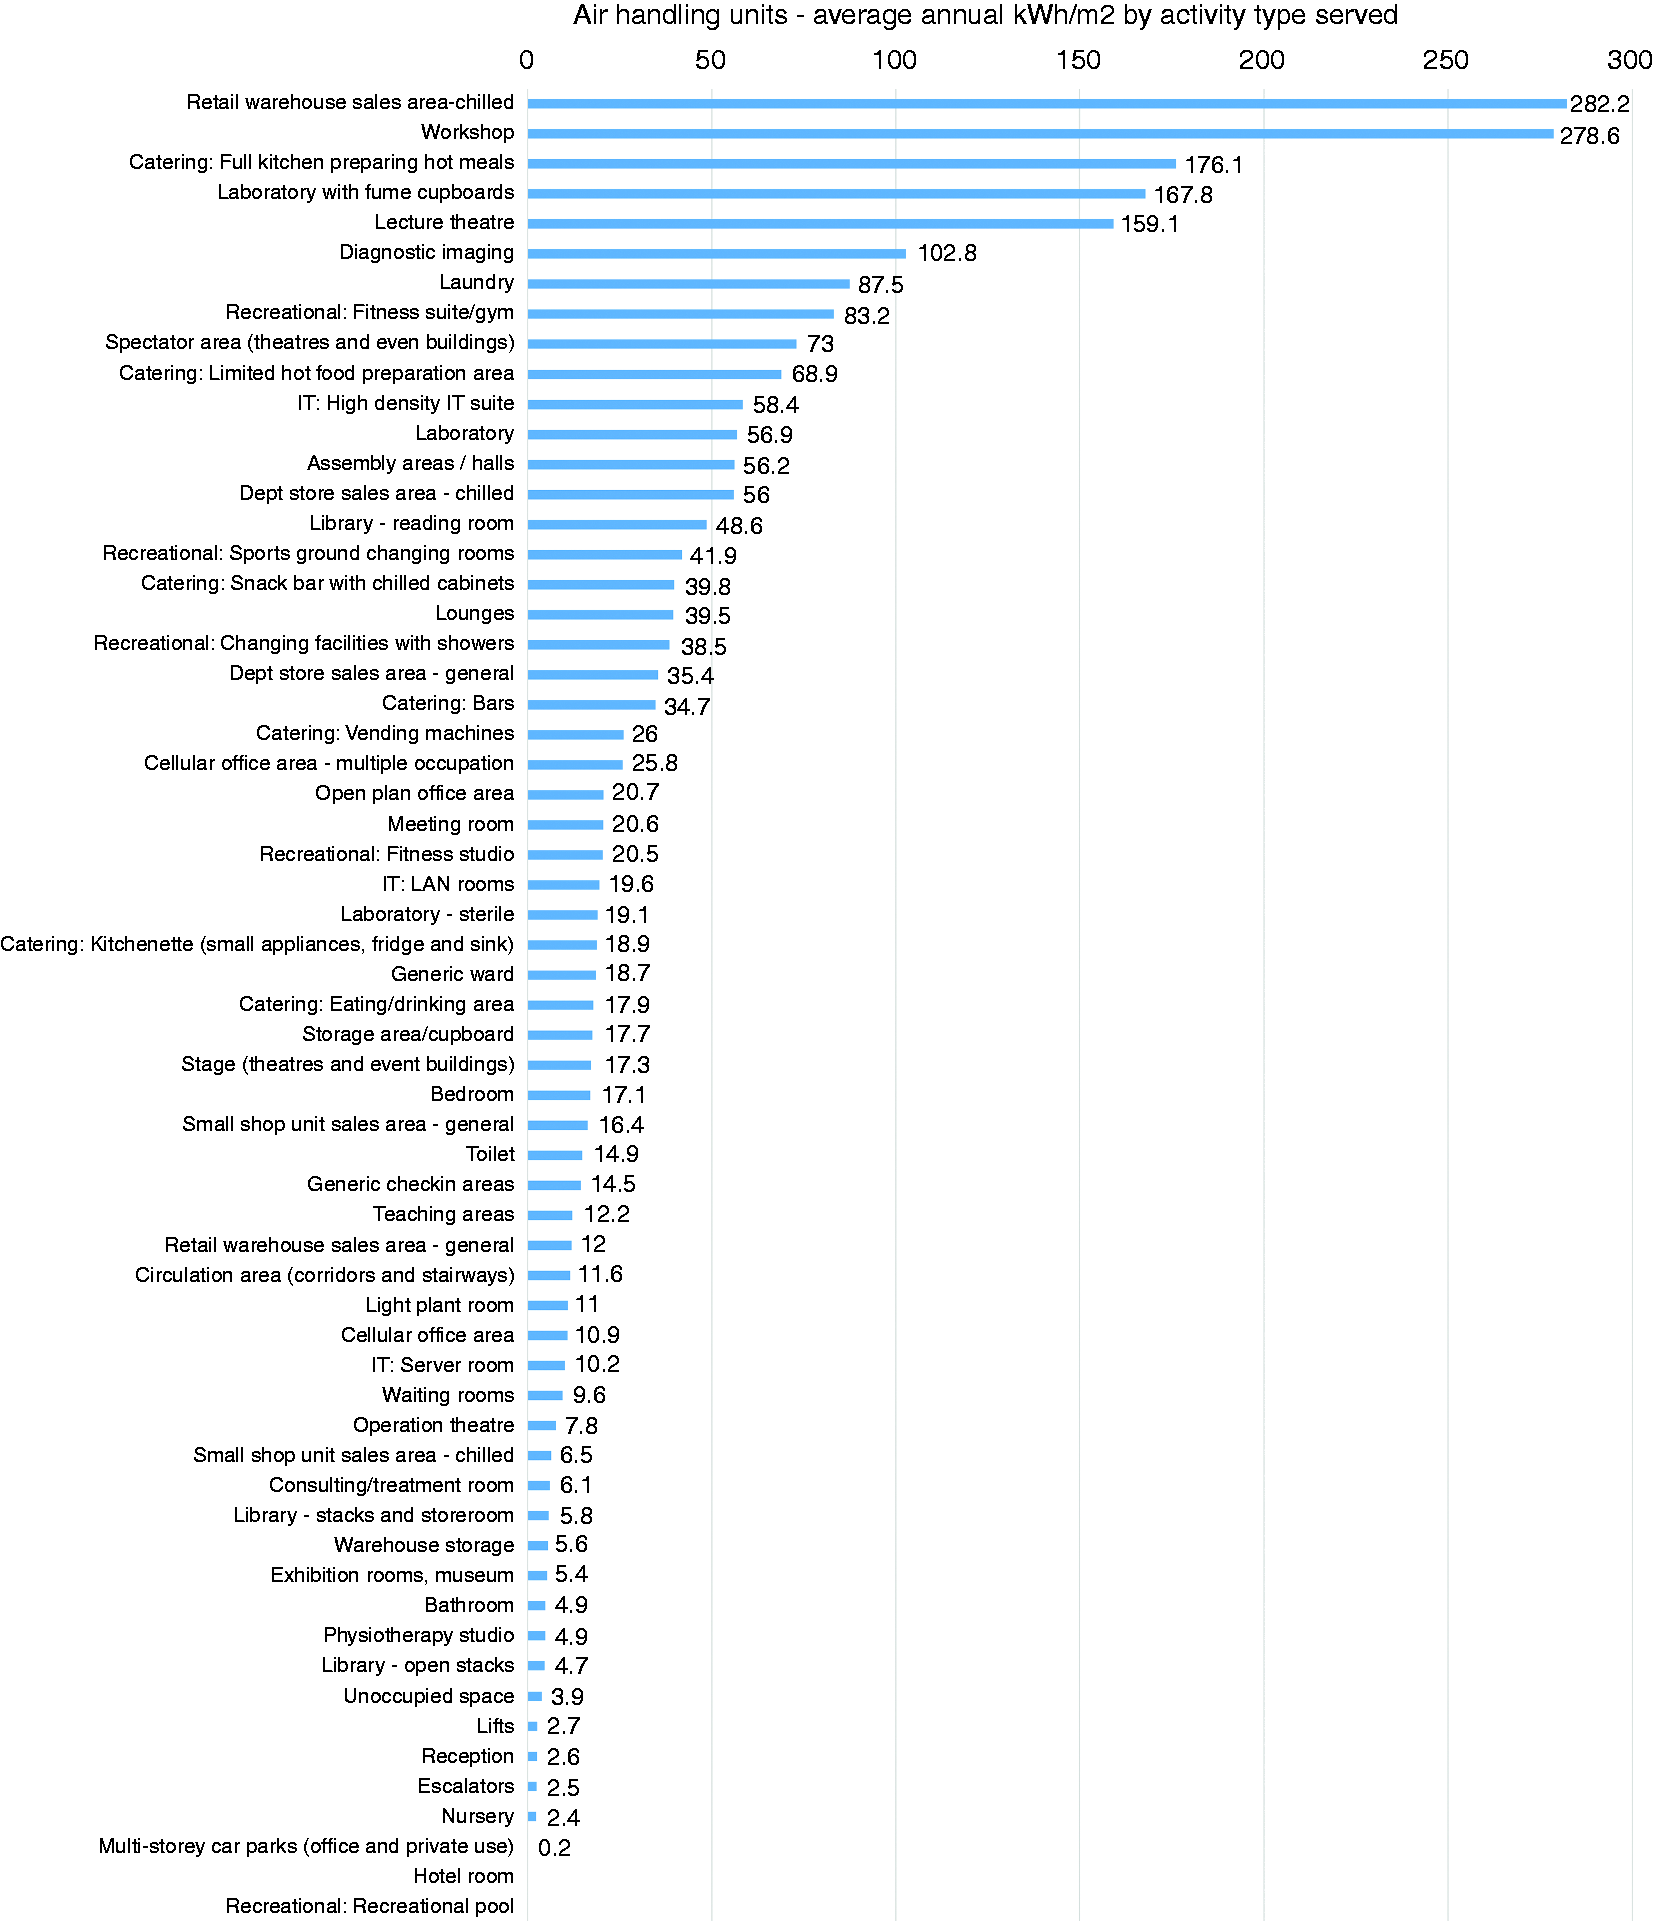
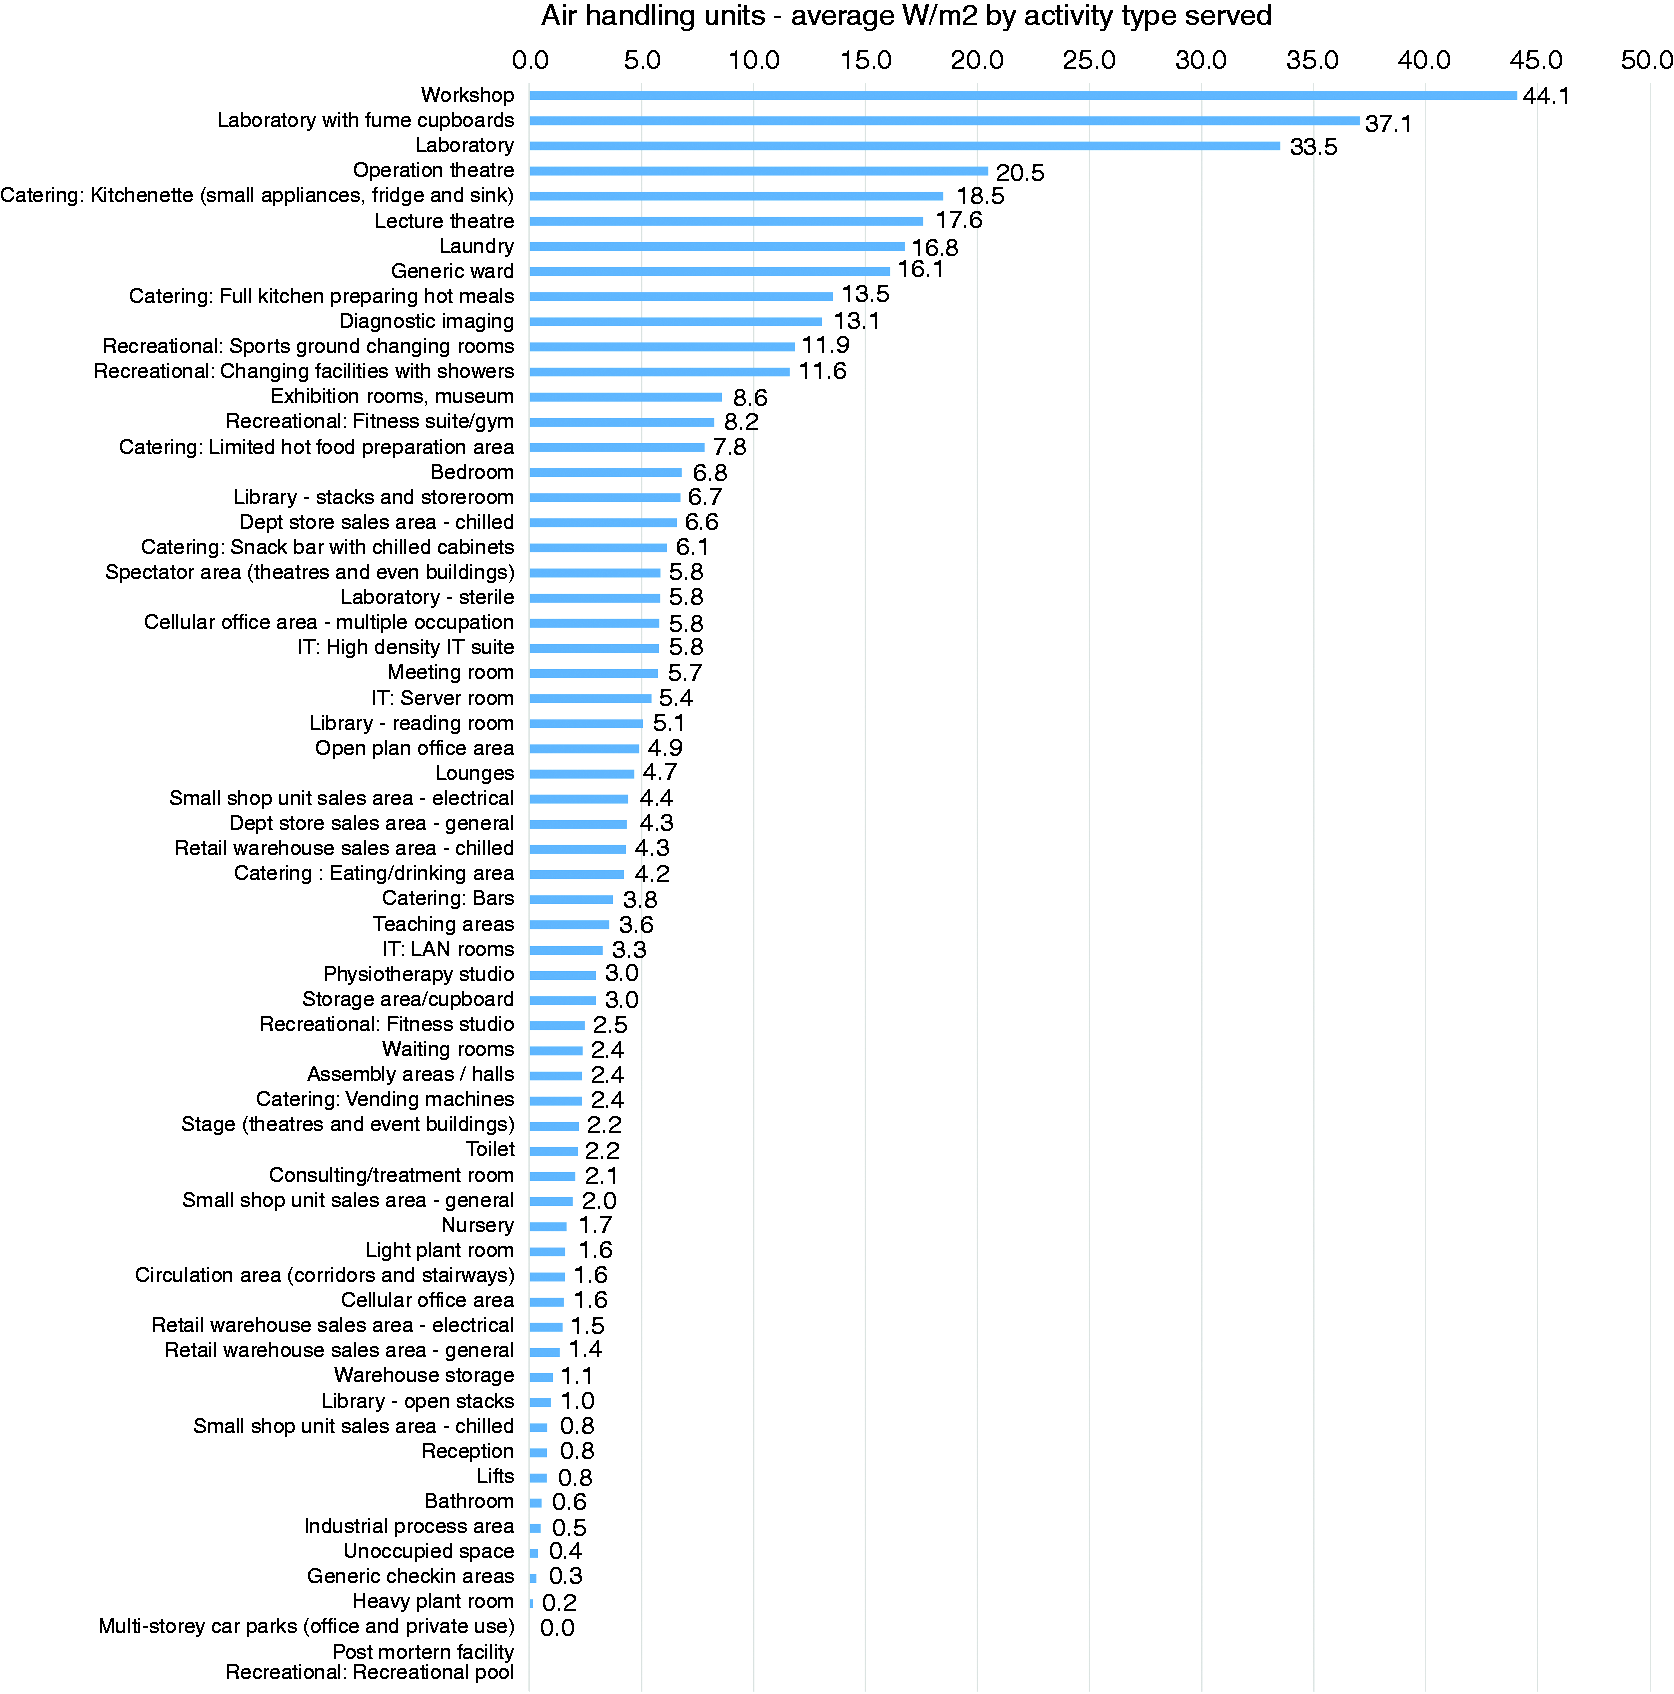
From the figures, it can be seen that the measured energy use and power demands generally confirm what might be expected for each activity and component pair/m2, providing confidence that this data provide a reasonable indication of performance being achieved in use.
Conclusions
This paper presents a first look at deriving EU Member States operational energy consumption and power demands at the level of individual components and activities in operational buildings. The key hurdles to overcome in implementing such an approach are:
The initial description of each building in the iSERVcmb template Producing standards for products and processes to meet in providing the data Obtaining the support of the main actors in this area to implement the approach Producing legislation that supports the approach as an alternative or complement to existing Member State legislation
The operational data collected show that the procedure used in iSERVcmb can be successfully used in all EU MS to provide information at this level of detail. This is a key finding as the EU strives to provide practical guidance to achieving operationally low energy buildings in the transition to a lower energy intensity future. Without information at this level of detail then achieving and maintaining low energy use and reduced power demands in operational buildings will be difficult to manage.
The findings are also of great value to building energy modellers as they provide potential boundary parameters that can be used in the modelling process to improve the accuracy with which models can be used to predict consumption and power demands in operational buildings.
Further work is already underway to help address many of the hurdles identified, with practical experience in operating the approach across a large estate being a key component of this work. It is hoped to recruit more Estates to the approach in the coming months.
Footnotes
Acknowledgments
The author wishes to acknowledge the contributions of all the Partners and contributors to the iSERVcmb project in producing the benchmarks presented in this paper, in particular K2n Ltd for their assistance with generating the benchmark data. The sole responsibility for the content of this paper lies with the author. It does not necessarily reflect the opinion of the European Union. Neither the EACI nor the European Commission are responsible for any use that may be made of the information contained herein.
Declaration of conflicting interests
The author(s) declared no potential conflicts of interest with respect to the research, authorship, and/or publication of this article.
Funding
The author(s) disclosed receipt of the following financial support for the research, authorship, and/or publication of this article: The author wishes to thank the European IEE programme for funding the iSERVcmb project.