
Abstract
Objectives
This study aimed to develop an inexpensive, readily available prognostic indicator in acute decompensated heart failure patients to guide management and improve outcome. Prognostic biomarkers for heart failure exist but are expensive and not routinely performed. Increasing plasma volume has been associated with worse outcomes.
Setting
UK University Teaching Hospital.
Design
Observational Cohort study.
Participants
967 patients with acute decompensated heart failure.
Methods
Haemoglobin and haematocrit were measured at admission and discharge and were used to calculate the plasma volume change using the Strauss-Davis-Rosenbaum formula.
Main outcome measures
Endpoints were death and the composite of death and/or heart failure hospitalisation. Change in plasma volume was added to ADHERE scoring to determine predictive value.
Results
During follow-up, 536 died and 626 died or were hospitalised with heart failure. Multivariable Cox models showed change in plasma volume was an independent predictor of mortality (hazard ratio (HR) [95% confidence interval (CI)]: 1.150 [1.031–1.283], p = 0.012) and death or heart failure hospitalisation (HR: 1.138 [1.029–1.259], p = 0.012). Kaplan–Meier analysis of change in plasma volume tertiles for outcome measures showed significant difference for the top tertile compared to the lower two. Multivariable analysis of change in plasma volume with ADHERE scoring showed change in plasma volume change remained an independent predictor of death (HR: 1.138 [1.026–1.261], p = 0.015) and death or heart failure hospitalisation (HR: 1.129 [1.025–1.243], p = 0.014).
Conclusions
Change in plasma volume over an admission can be used for prognostication and adds value to the ADHERE score. Change in plasma volume can be easily and inexpensively calculated from routine blood tests. Clinically, this may facilitate targeted treatment of acute decompensated heart failure patients at greatest risk.
Introduction
Heart failure affects at least 550,000 people in the UK 1 with a prevalence of 7.84% in men aged over 75 years and 5.89% in women aged over 75 years. 2 The incidence of heart failure is projected to increase. 2 Prognosis of heart failure is poor with a quality of life worse than that of patients with chronic pulmonary disease and an estimated mortality at one year of 40%. Heart failure patients account for approximately 2% of all inpatient bed-days. 2 The aim of this study was to develop an inexpensive method to guide patient management in acute decompensated heart failure patients using change in plasma volume.
In chronic heart failure increasing plasma volume has been shown to be associated with worse prognosis 3 predicting mortality proportional to the increase in plasma volume independent of other factors such as left ventricular ejection fraction, urea, sodium, creatinine and albumin.3,4 In contrast, there is limited evidence evaluating the use of plasma volume to prognosticate acute decompensated heart failure. Furthermore, papers published have focused on chronic heart failure and have used plasma volume status rather than the change in plasma volume.
Accurate measurement of plasma volume is technically difficult and invasive, for example using pulmonary artery catheterisation.5–9 Clinical evaluation using signs and symptoms is known to be highly inconsistent.10–12 Of the clinical signs, jugular venous pressure and a third heart sound have been shown to be associated with morbidity.11,13 However, reliance on clinical signs is likely to lead to insufficient patient management. 8 Equations have been validated to estimate plasma volume non-invasively. This includes the Strauss–Davis–Rosenbaum formula.8,14
The Strauss–Davis–Rosenbaum formula is used to estimate percentage change in plasma volume8,14
Percentage change in plasma volume = ([(Hb1/Hb2) × ((100-Hct2)/(100-Hct1))] −1) × 100
where 1 = baseline and 2 = end values. Hb = haemoglobin, Hct = haematocrit.
An easily accessible marker of prognosis such as change in plasma volume estimated from admission and discharge haemoglobin and haematocrit would enable targeted treatment of the most at-risk patients. An inexpensive, readily available method of estimating change in plasma volume to guide patient treatment may be useful in the clinical setting.
Methods
Study population
Haemoglobin and haematocrit were measured at admission and discharge in 967 patients admitted to University Hospitals of Leicester with acute decompensated heart failure between 2006 and 2011. In addition, demographic data, admission symptoms, admission observations, aetiology of heart failure, past medical history, drug history, electrocardiogram and chest X-ray findings, New York Heart Association (NYHA) functional classification, Acute Decompensated Heart Failure National Registry (ADHERE) risk score, admission and discharge blood tests and patient outcome were also recorded. Patients who were likely to have had a blood transfusion were excluded (defined as an increase in haemoglobin from admission to discharge of ≥30 g/dL. This observational cohort study complied with the Declaration of Helsinki and was approved by the local ethics committee; written informed consent was obtained from patients.
ADHERE score
The ADHERE risk score stratifies patients admitted with acute heart failure by mortality risk. 15 In the original study, blood urea nitrogen level of ≥15.35 mmol/L, serum creatinine level of ≥243.1 µmol/L and systolic blood pressure of <115 mmHg were high-risk independent predictors of in-hospital mortality. 15 In this study patients with acute decompensated heart failure were stratified into five groups ranging from low to high (1–5) risk using the ADHERE registry model. 15 Groups were defined as 1 (urea < 15.35 mmol/L and systolic blood pressure ≥ 115 mmHg), 2 (urea < 15.35 mmol/L and systolic blood pressure < 115 mmHg), 3 (urea ≥ 15.35 mmol/L and systolic blood pressure ≥ 115 mmHg), 4 (urea ≥ 15.35 mmol/L, systolic blood pressure < 115 mmHg and creatinine level < 243.1 µmol/L) and 5 (urea ≥ 15.35 mmol/L, systolic blood pressure < 115 mmHg and creatinine level ≥243.1 µmol/L).
Estimation of change in plasma volume
In this study changes in plasma volume were calculated using the haematocrit and haemoglobin at admission and discharge and the difference between these values was the change in plasma volume. The Strauss–Davis–Rosenbaum formula used is shown in the ‘Introduction’ section.
Endpoints
Endpoints were death, and the composite of death and/or heart failure hospitalisation. Heart failure hospitalisation was defined as an admission for which heart failure was the primary reason, with symptoms and signs of heart failure and necessitating the use of diuretics, nitrates or inotrope therapy. Endpoints were obtained by reviewing records in the local hospital databases and the Office of National Statistics Registry. Patients were followed up for a maximum of 3168 days with most patients followed for at least 1800 days.
Statistical analysis
Statistical analyses were performed with SPSS version 22 (IBM SPSS Statistics, IBM Corporation, Armonk, New York, USA). Changes in plasma volume were Z transformed (normalised to 1 SD increment) to make values more comparable with other parameters.
Cox survival regression was used to test the prognostic ability of change in plasma volume to predict patient outcome. The multivariate analysis (model 1) included variables which are known to be significant for predicting outcome in heart failure (age, sex, admission systolic blood pressure, admission New York Heart Association functional classification, past medical history of diabetes, ischaemic heart disease, heart failure and hypertension, admission urea, sodium and creatinine). The Z transform of change in plasma volume was added to these base models and the comparative prognostic power was assessed (model 2). Another relative Cox survival regression model was used to analyse whether change in plasma volume significantly improved the value of the ADHERE risk score for prognostic value. Unless otherwise stated, results are expressed as hazard ratio (HR) (95% confidence interval), p value for statistical significance.
Kaplan–Meier survival analysis was performed to visualise the prognostic utility of change in plasma volume for survival. Patients were split into tertiles of change in plasma volume. The tertiles were plotted against death, and death or heart failure hospitalisation.
Classification and regression trees for predicting inpatient mortality were constructed using Chi-squared Automatic Interaction Detection (CHAID; performed using SPSS), which detects which biomarker has the strongest interaction with the dependent variable (death, or death and/or heart failure) in step-wise analysis. A two-sided p value of <0.05 was deemed to be statistically significant.
Results
Baseline patient characteristics
Characteristics of the 967 acute decompensated heart failure patients according to change in PVol tertiles.

Numerical data are presented as n (%). The numbers (%) or mean ± SD are reported. p values are quoted for the ANOVA or Chi-squared tests for continuous or categorical variables, respectively. ADHERE: Acute Decompensated Heart Failure National Registry; ADHF: acute decompensated heart failure; HF: heart failure; NYHA: New York Heart Association; PVol: plasma volume; SBP: systolic blood pressure.
Survival analysis
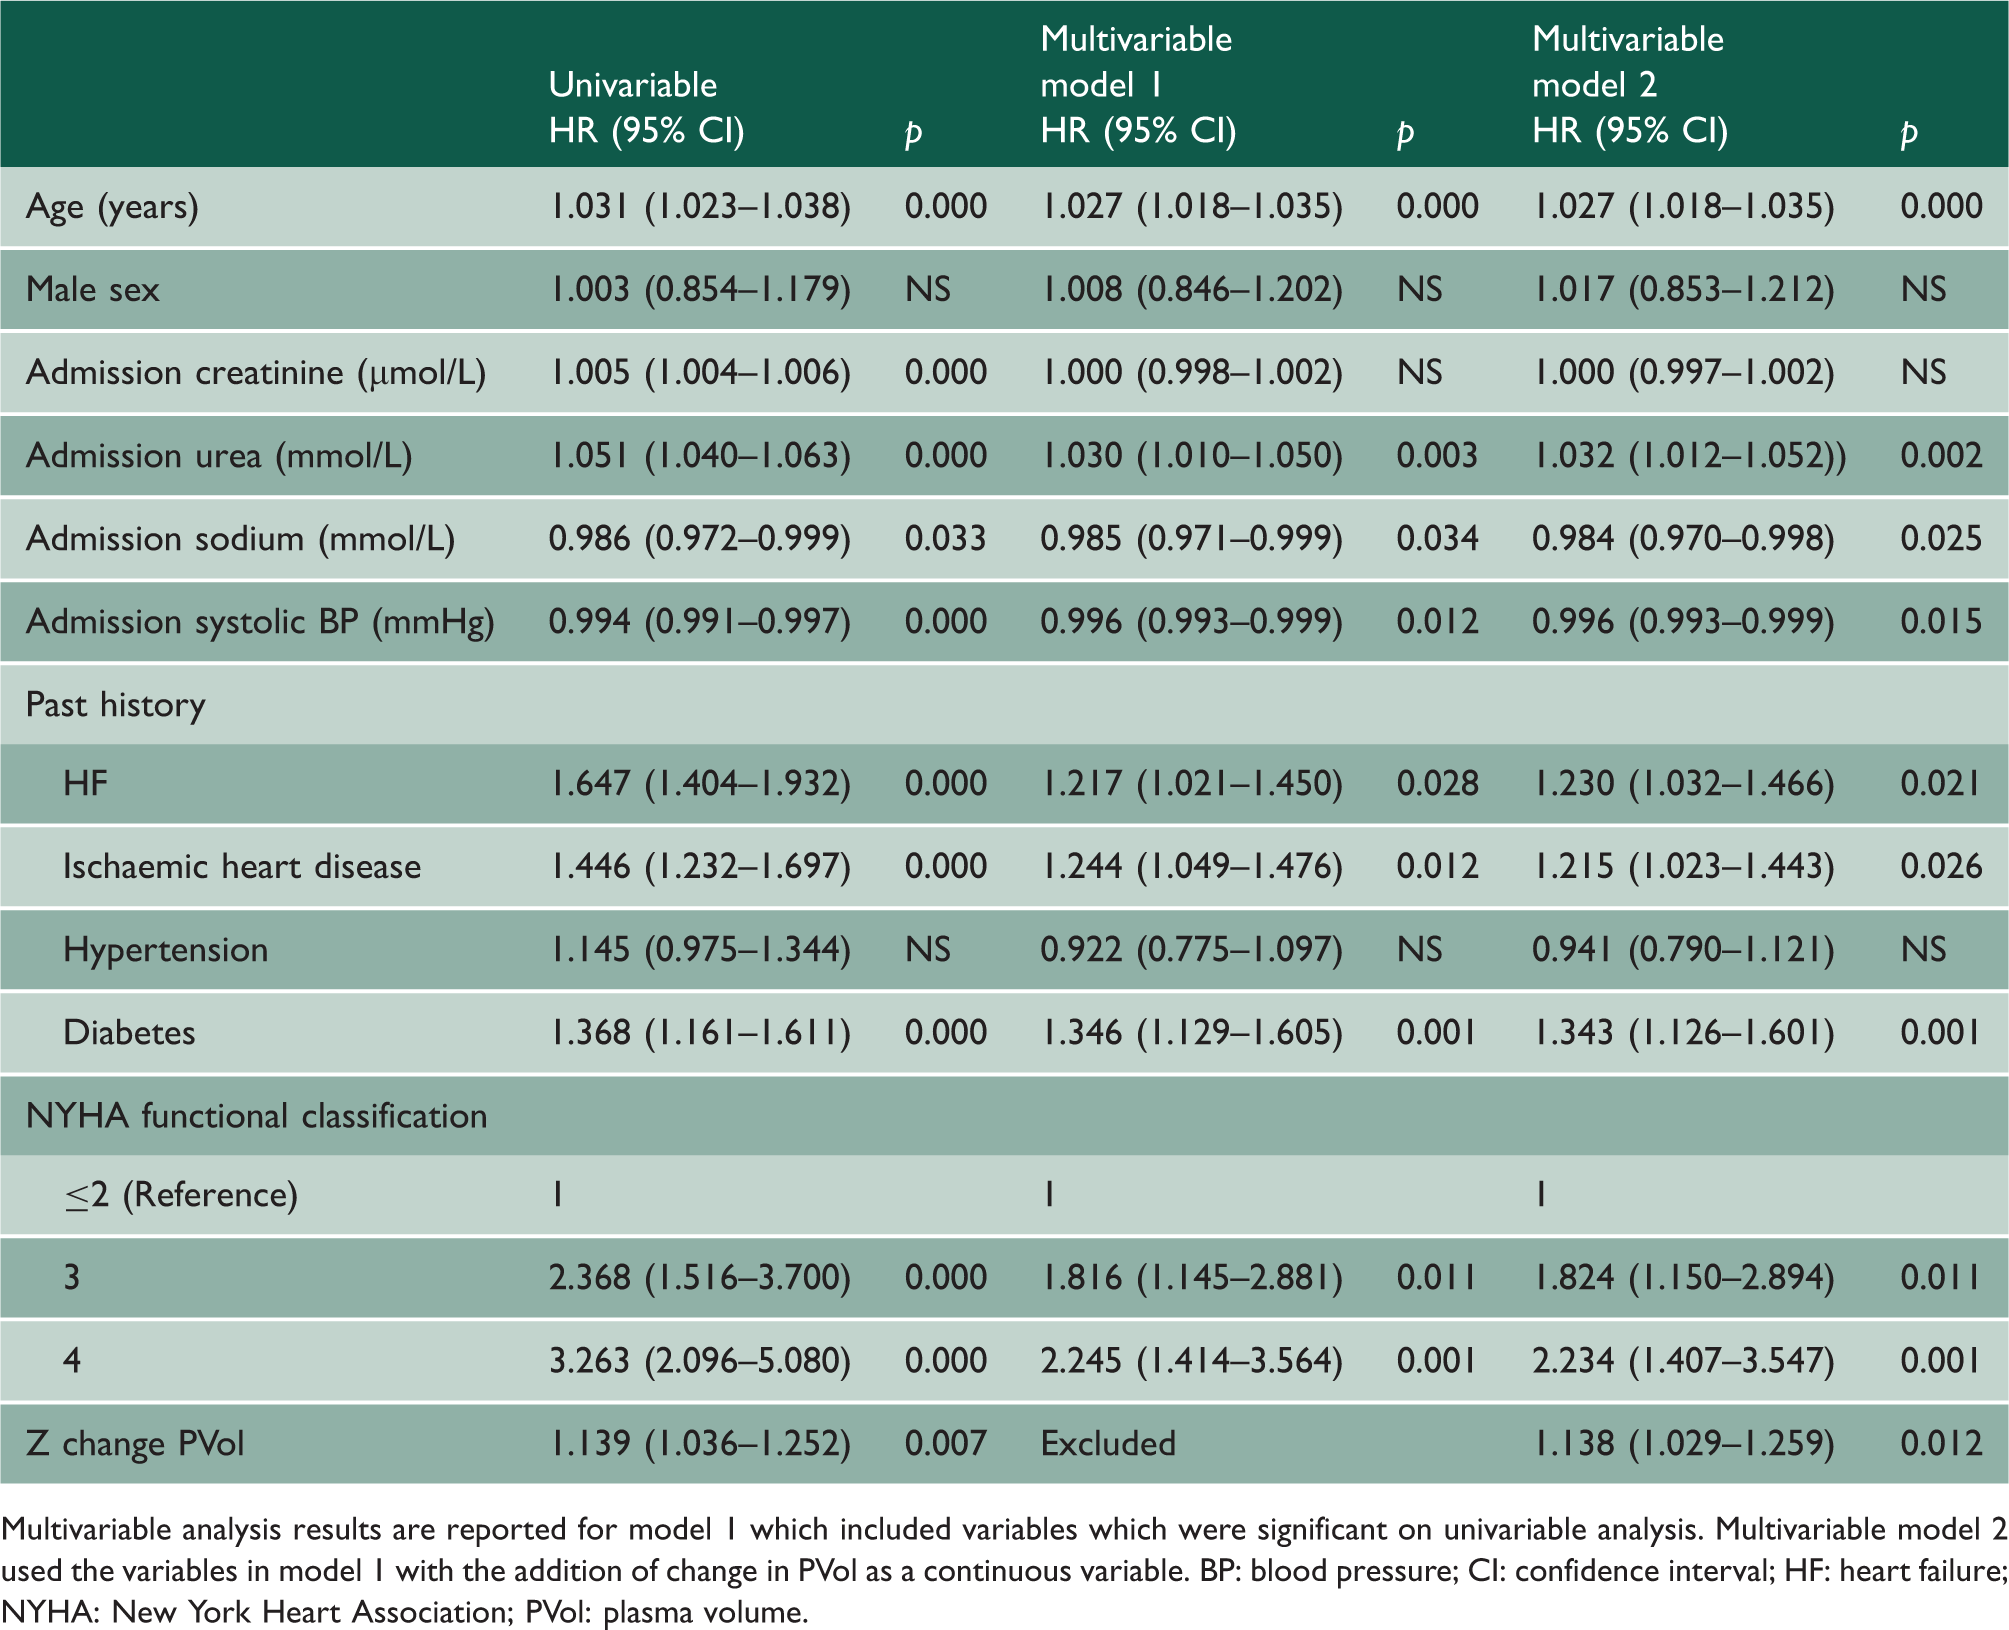
Cox regression analysis for death.

Multivariable analysis results are reported for model 1 which included variables which were significant on univariable analysis. Multivariable model 2 used the variables in model 1 with the addition of change in PVol as a continuous variable. BP: blood pressure; CI: confidence interval; HF: heart failure; NYHA: New York Heart Association; PVol: plasma volume.
Cox regression analysis for death or HF hospitalisation.
Multivariable analysis results are reported for model 1 which included variables which were significant on univariable analysis. Multivariable model 2 used the variables in model 1 with the addition of change in PVol as a continuous variable. BP: blood pressure; CI: confidence interval; HF: heart failure; NYHA: New York Heart Association; PVol: plasma volume.
Kaplan–Meier survival analysis was performed with patients split into tertiles by change in plasma volume. Survival was plotted against their tertile group. Tertiles for change in plasma volume were found to be significant for predicting death and for predicting death of heart failure. Kaplan–Meier survival analysis comparing the highest tertile of change in plasma volume to the two lowest for death was significant for log rank (Mantel–Cox) analysis (p = 0.001). Analysis for death and/or heart failure hospitalisation was significant for log rank (Mantel–Cox) analysis (p = 0.002) (Figure 1).
Kaplan–Meier curves showing death and death and/or HF hospitalisation of ADHF patients HF per tertile for Z change PVol. ADHF: acute decompensated heart failure; HF: heart failure; PVol: plasma volume.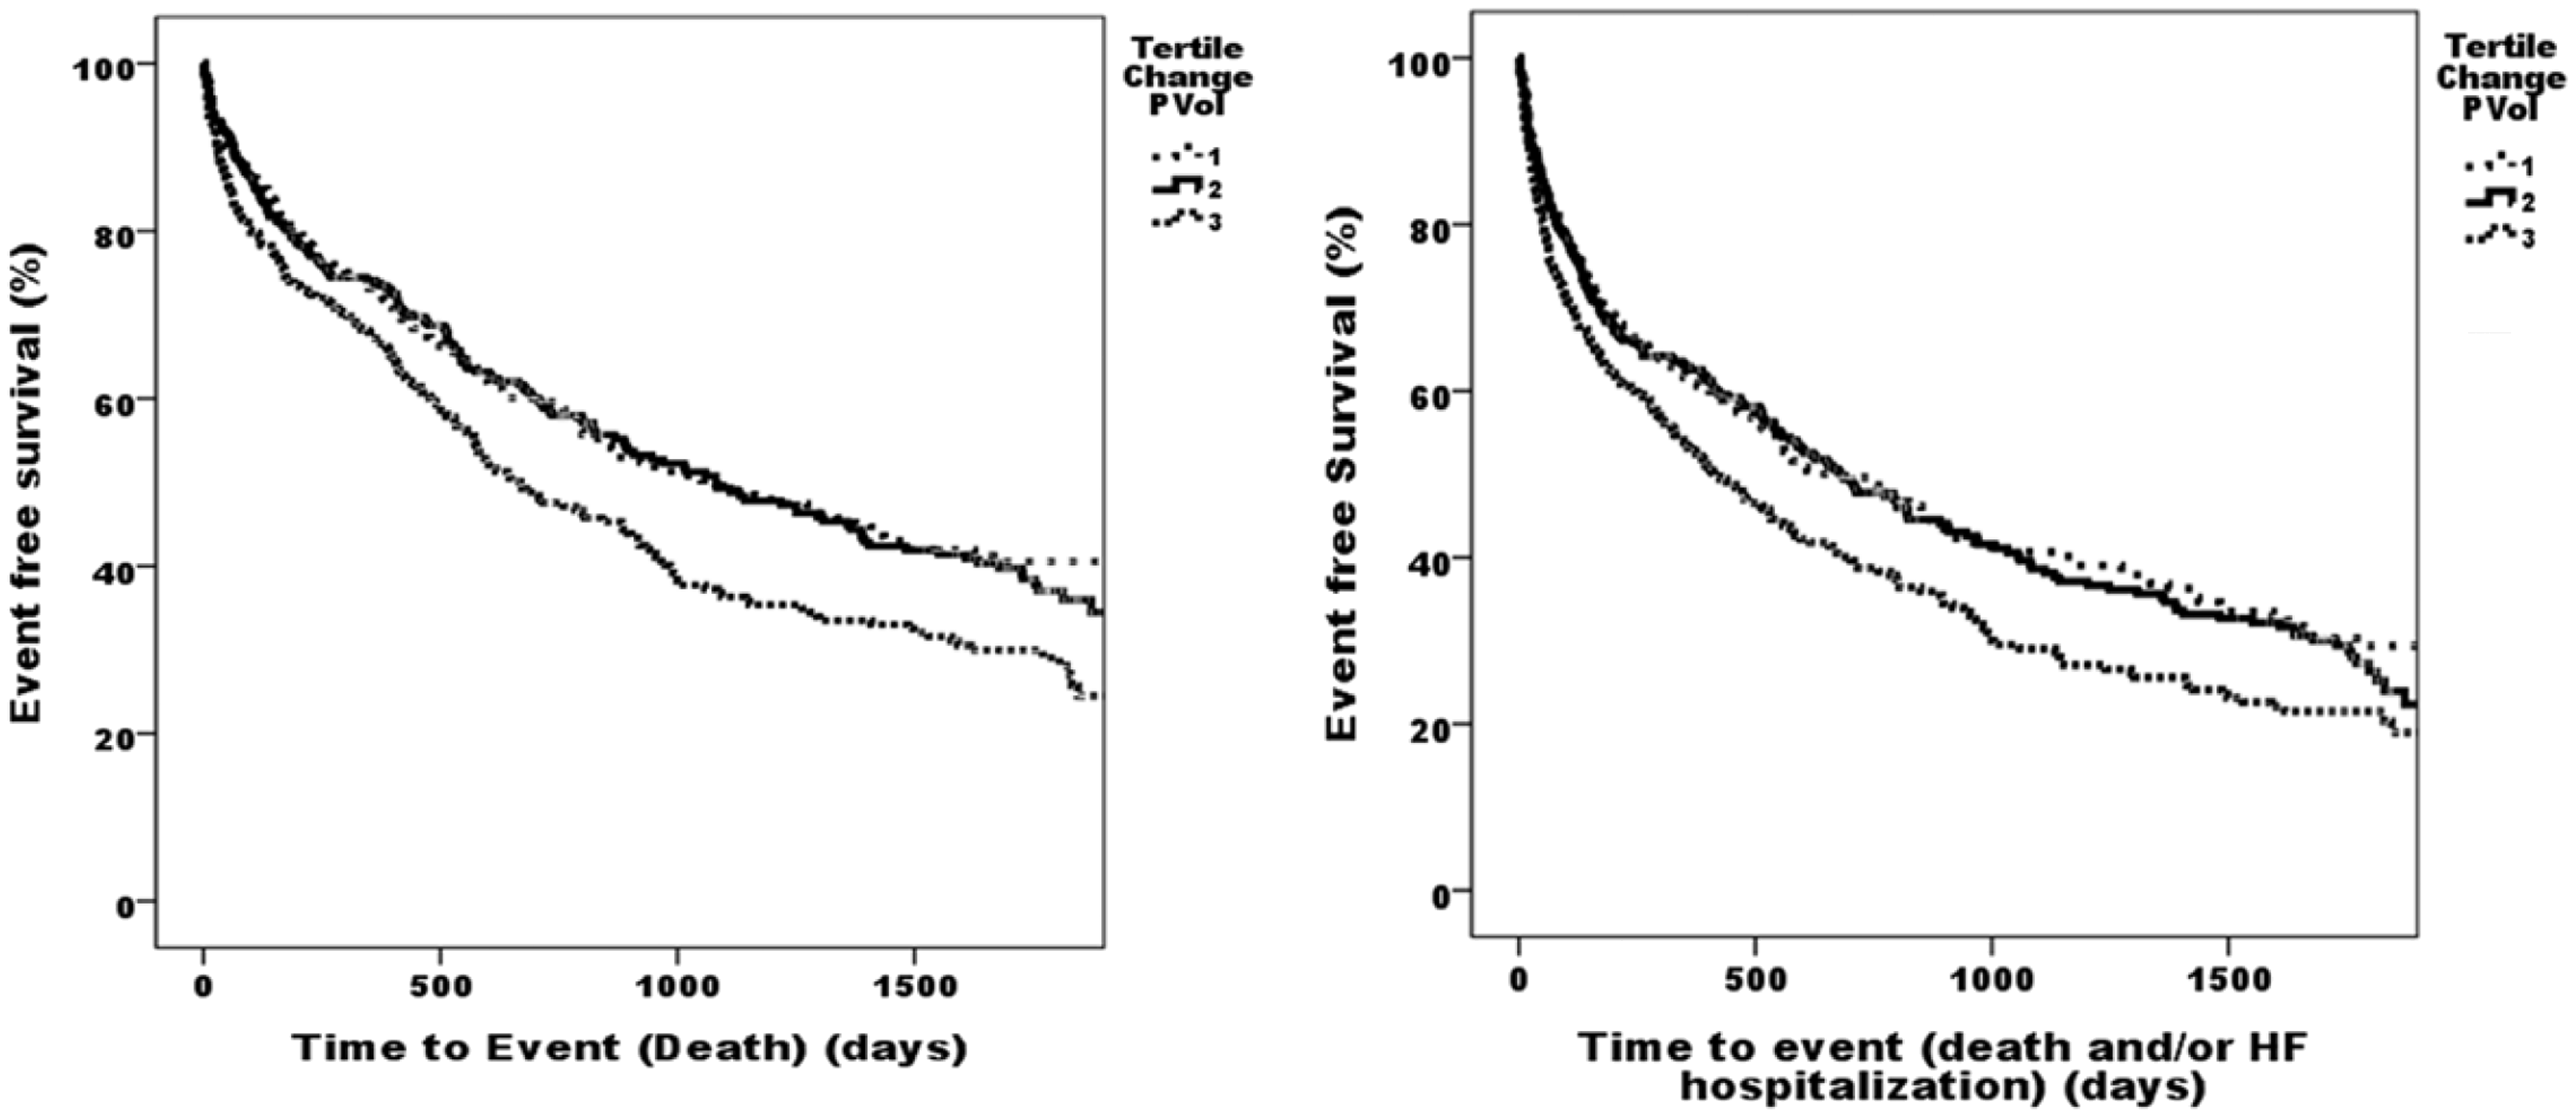
Comparison with ADHERE risk scores
Cox survival analysis for ADHERE score and Z change PVol for death.
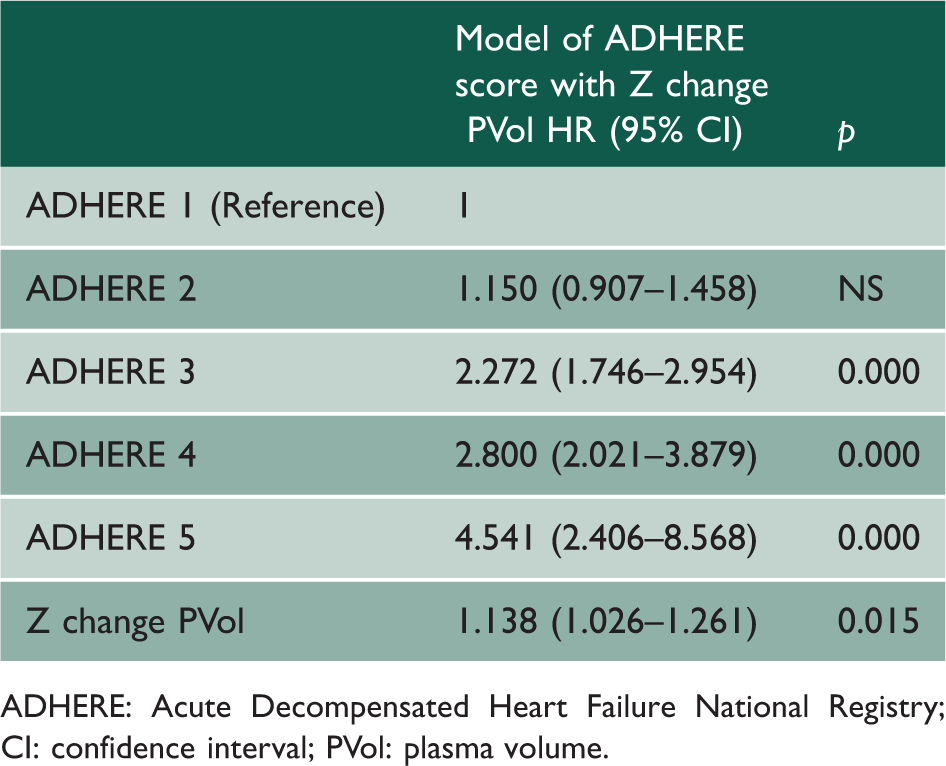
ADHERE: Acute Decompensated Heart Failure National Registry; CI: confidence interval; PVol: plasma volume.
Cox survival analysis for ADHERE score and Z change PVol for death and/or HF hospitalisation.
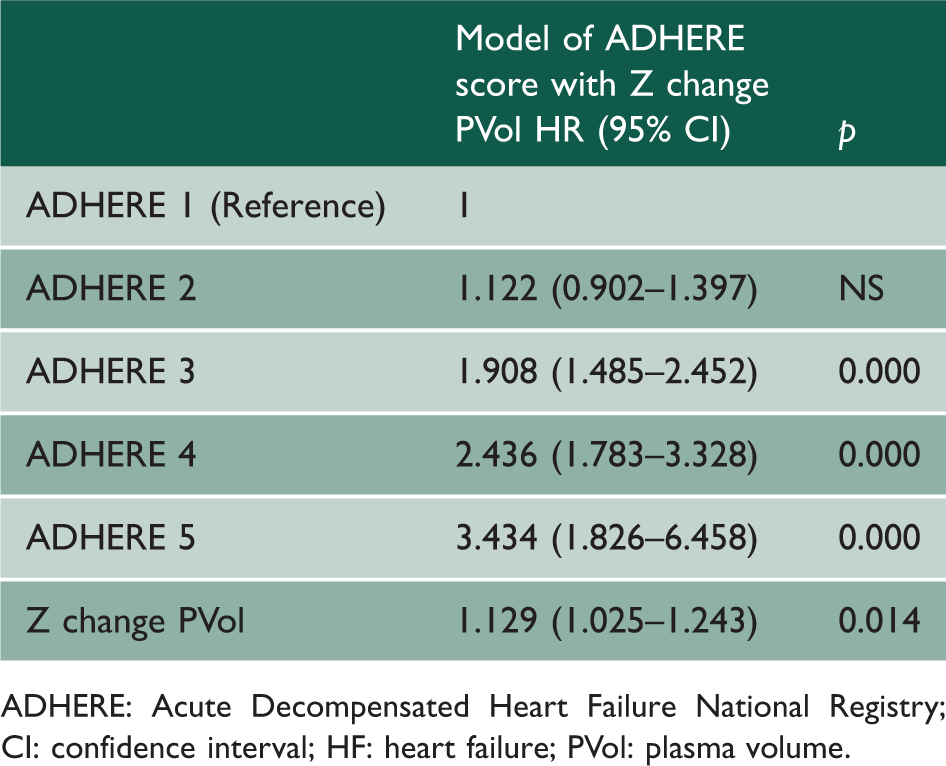
ADHERE: Acute Decompensated Heart Failure National Registry; CI: confidence interval; HF: heart failure; PVol: plasma volume.
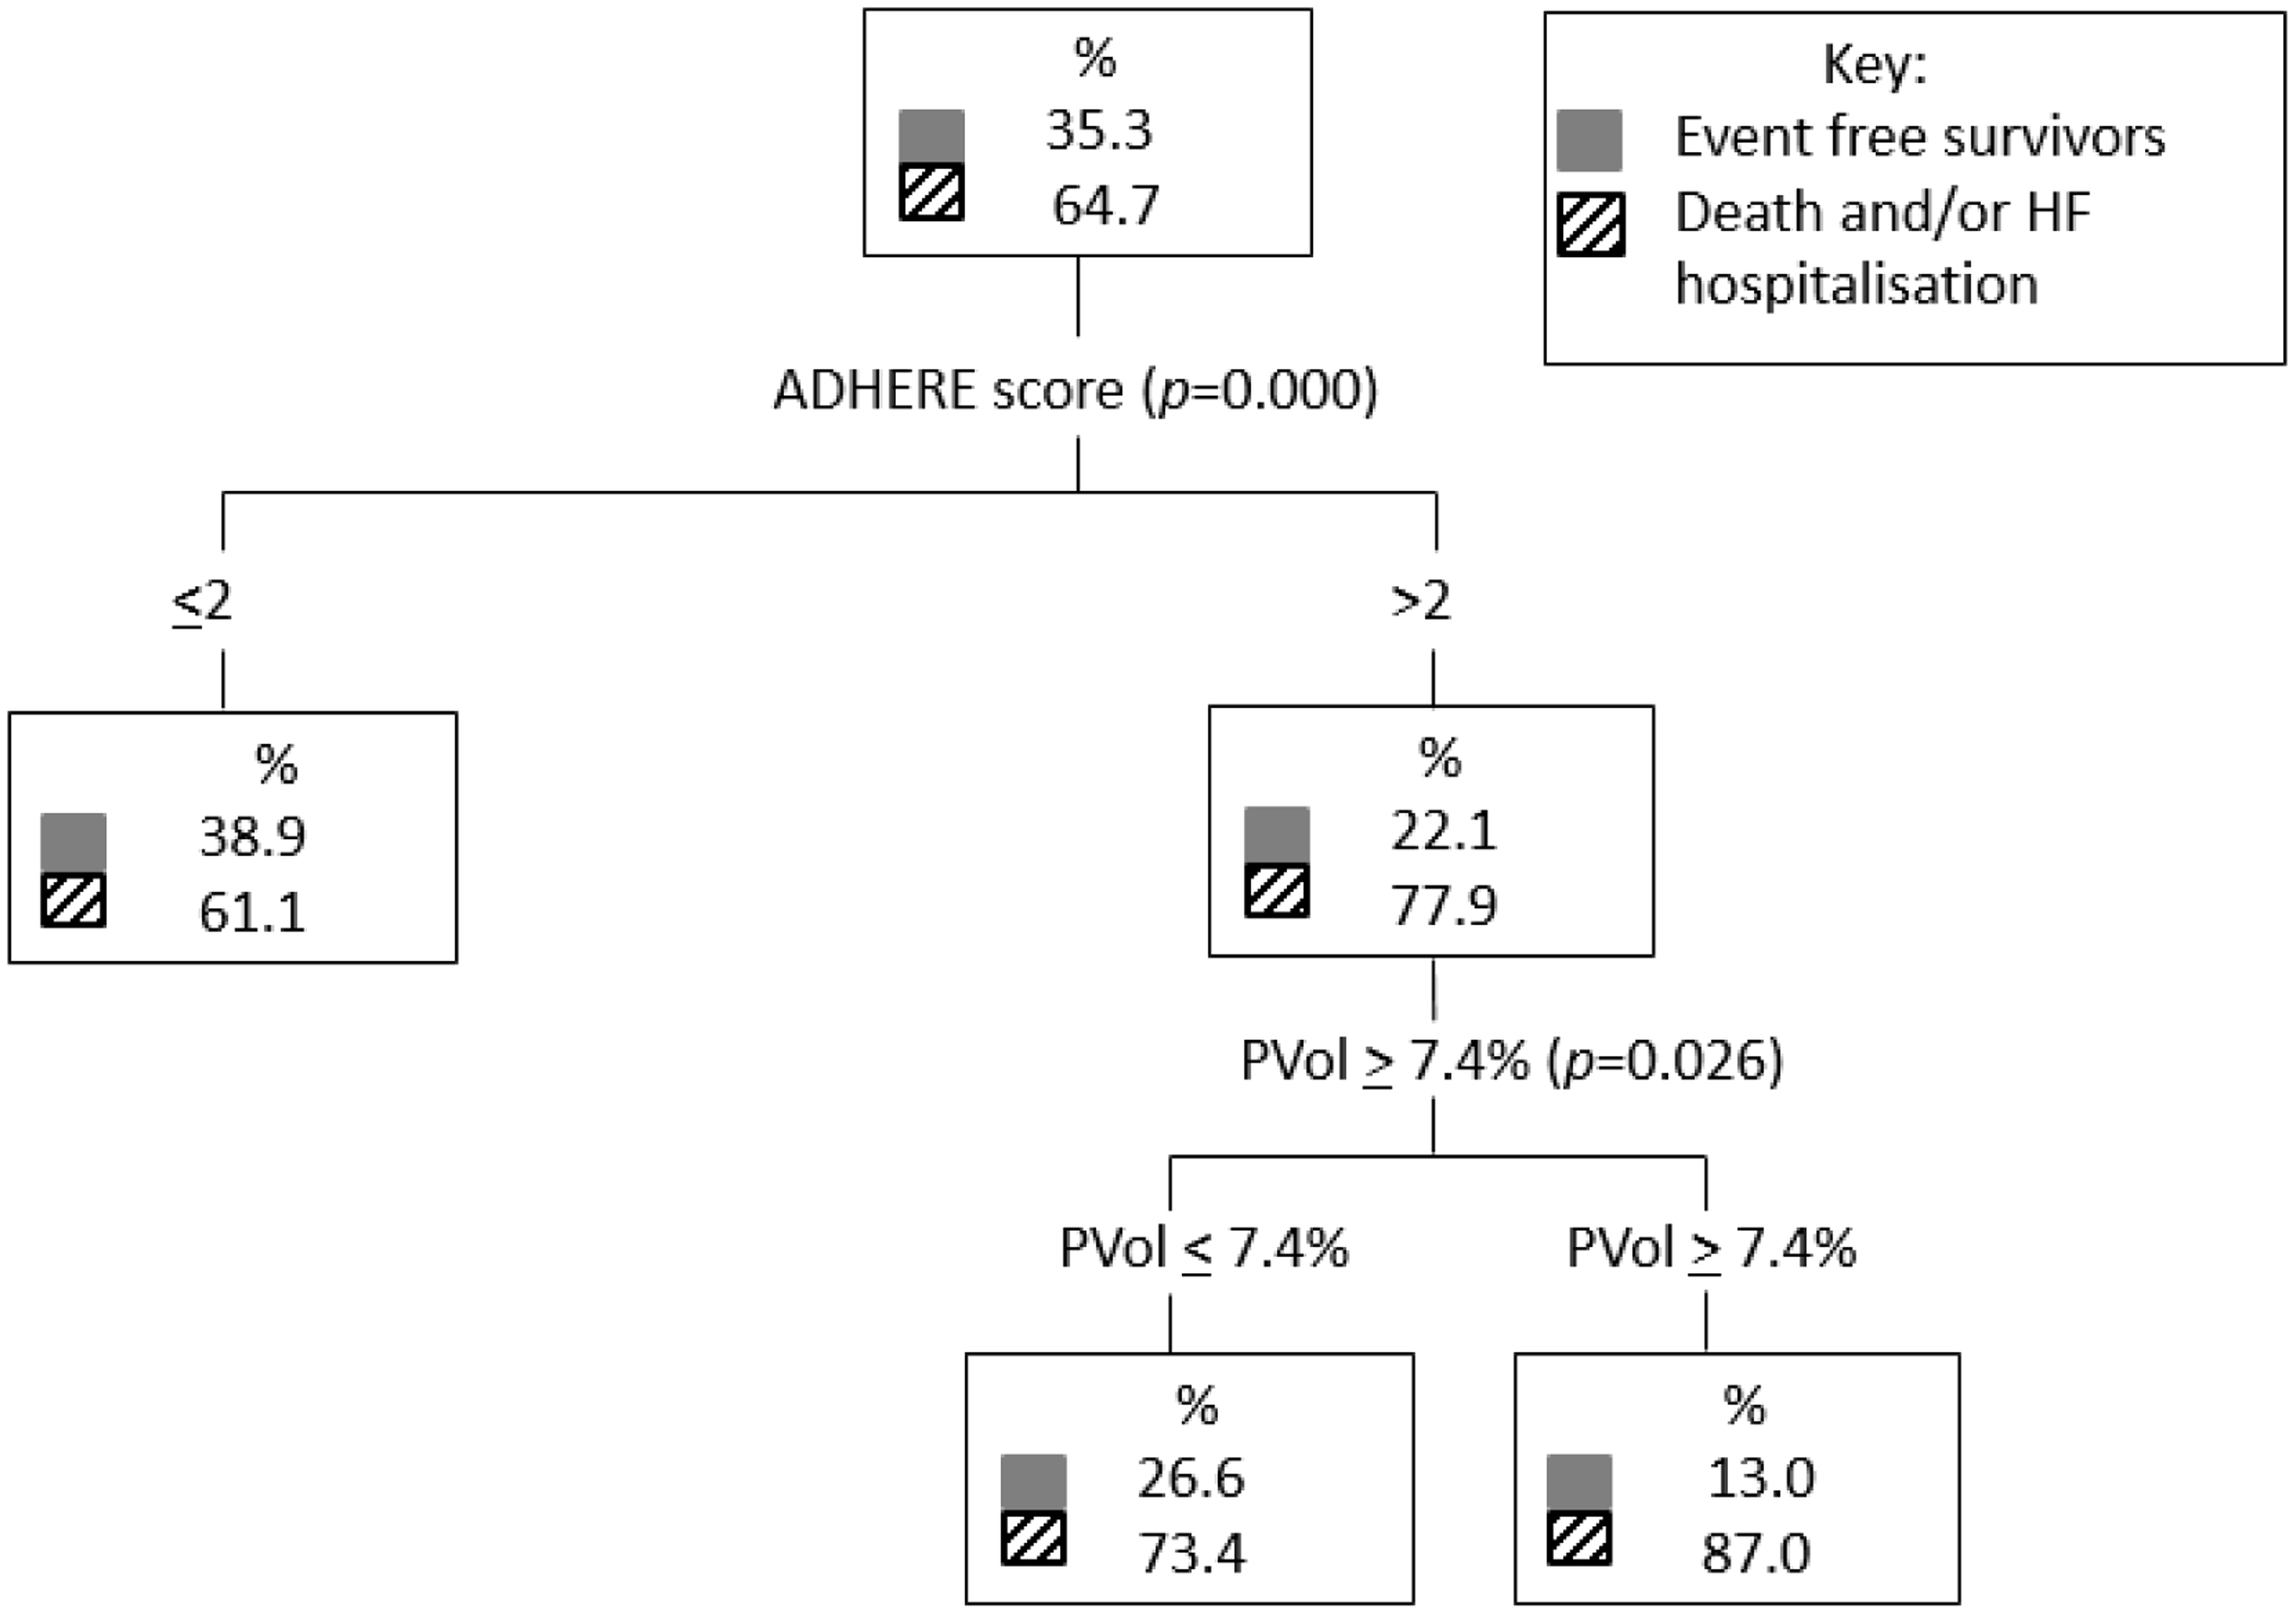
A classification and regression trees analysis comparing ADHERE score 1–5 and plasma volume lower tertiles (tertiles 1 and 2) and upper tertile (tertile 3) which corresponded to change in plasma volume <7.4% versus ≥7.4%, respectively, found that plasma volume further stratified the risk in both the low and high ADHERE risk groups for the death endpoint (Figure 2). For the death and/or heart failure hospitalisation outcome, plasma volume further stratifies higher-risk patients (Figure 3).
Classification and regression trees analysis comparing ADHERE score 1–5 and PVol lower tertiles (PVol ≤ 7.4%) and upper tertile (PVol ≥ 7.4%) for the death endpoint. ADHERE: Acute Decompensated Heart Failure National Registry; CART: classification and regression trees; PVol: plasma volume. Classification and regression trees analysis comparing ADHERE score 1–5 and PVol lower tertiles (PVol ≤ 7.4%) and upper tertile (PVol ≥ 7.4%) for the dead and/or HF hospitalisation endpoint. ADHERE: Acute Decompensated Heart Failure National Registry; CART: classification and regression trees; HF: heart failure; PVol: plasma volume.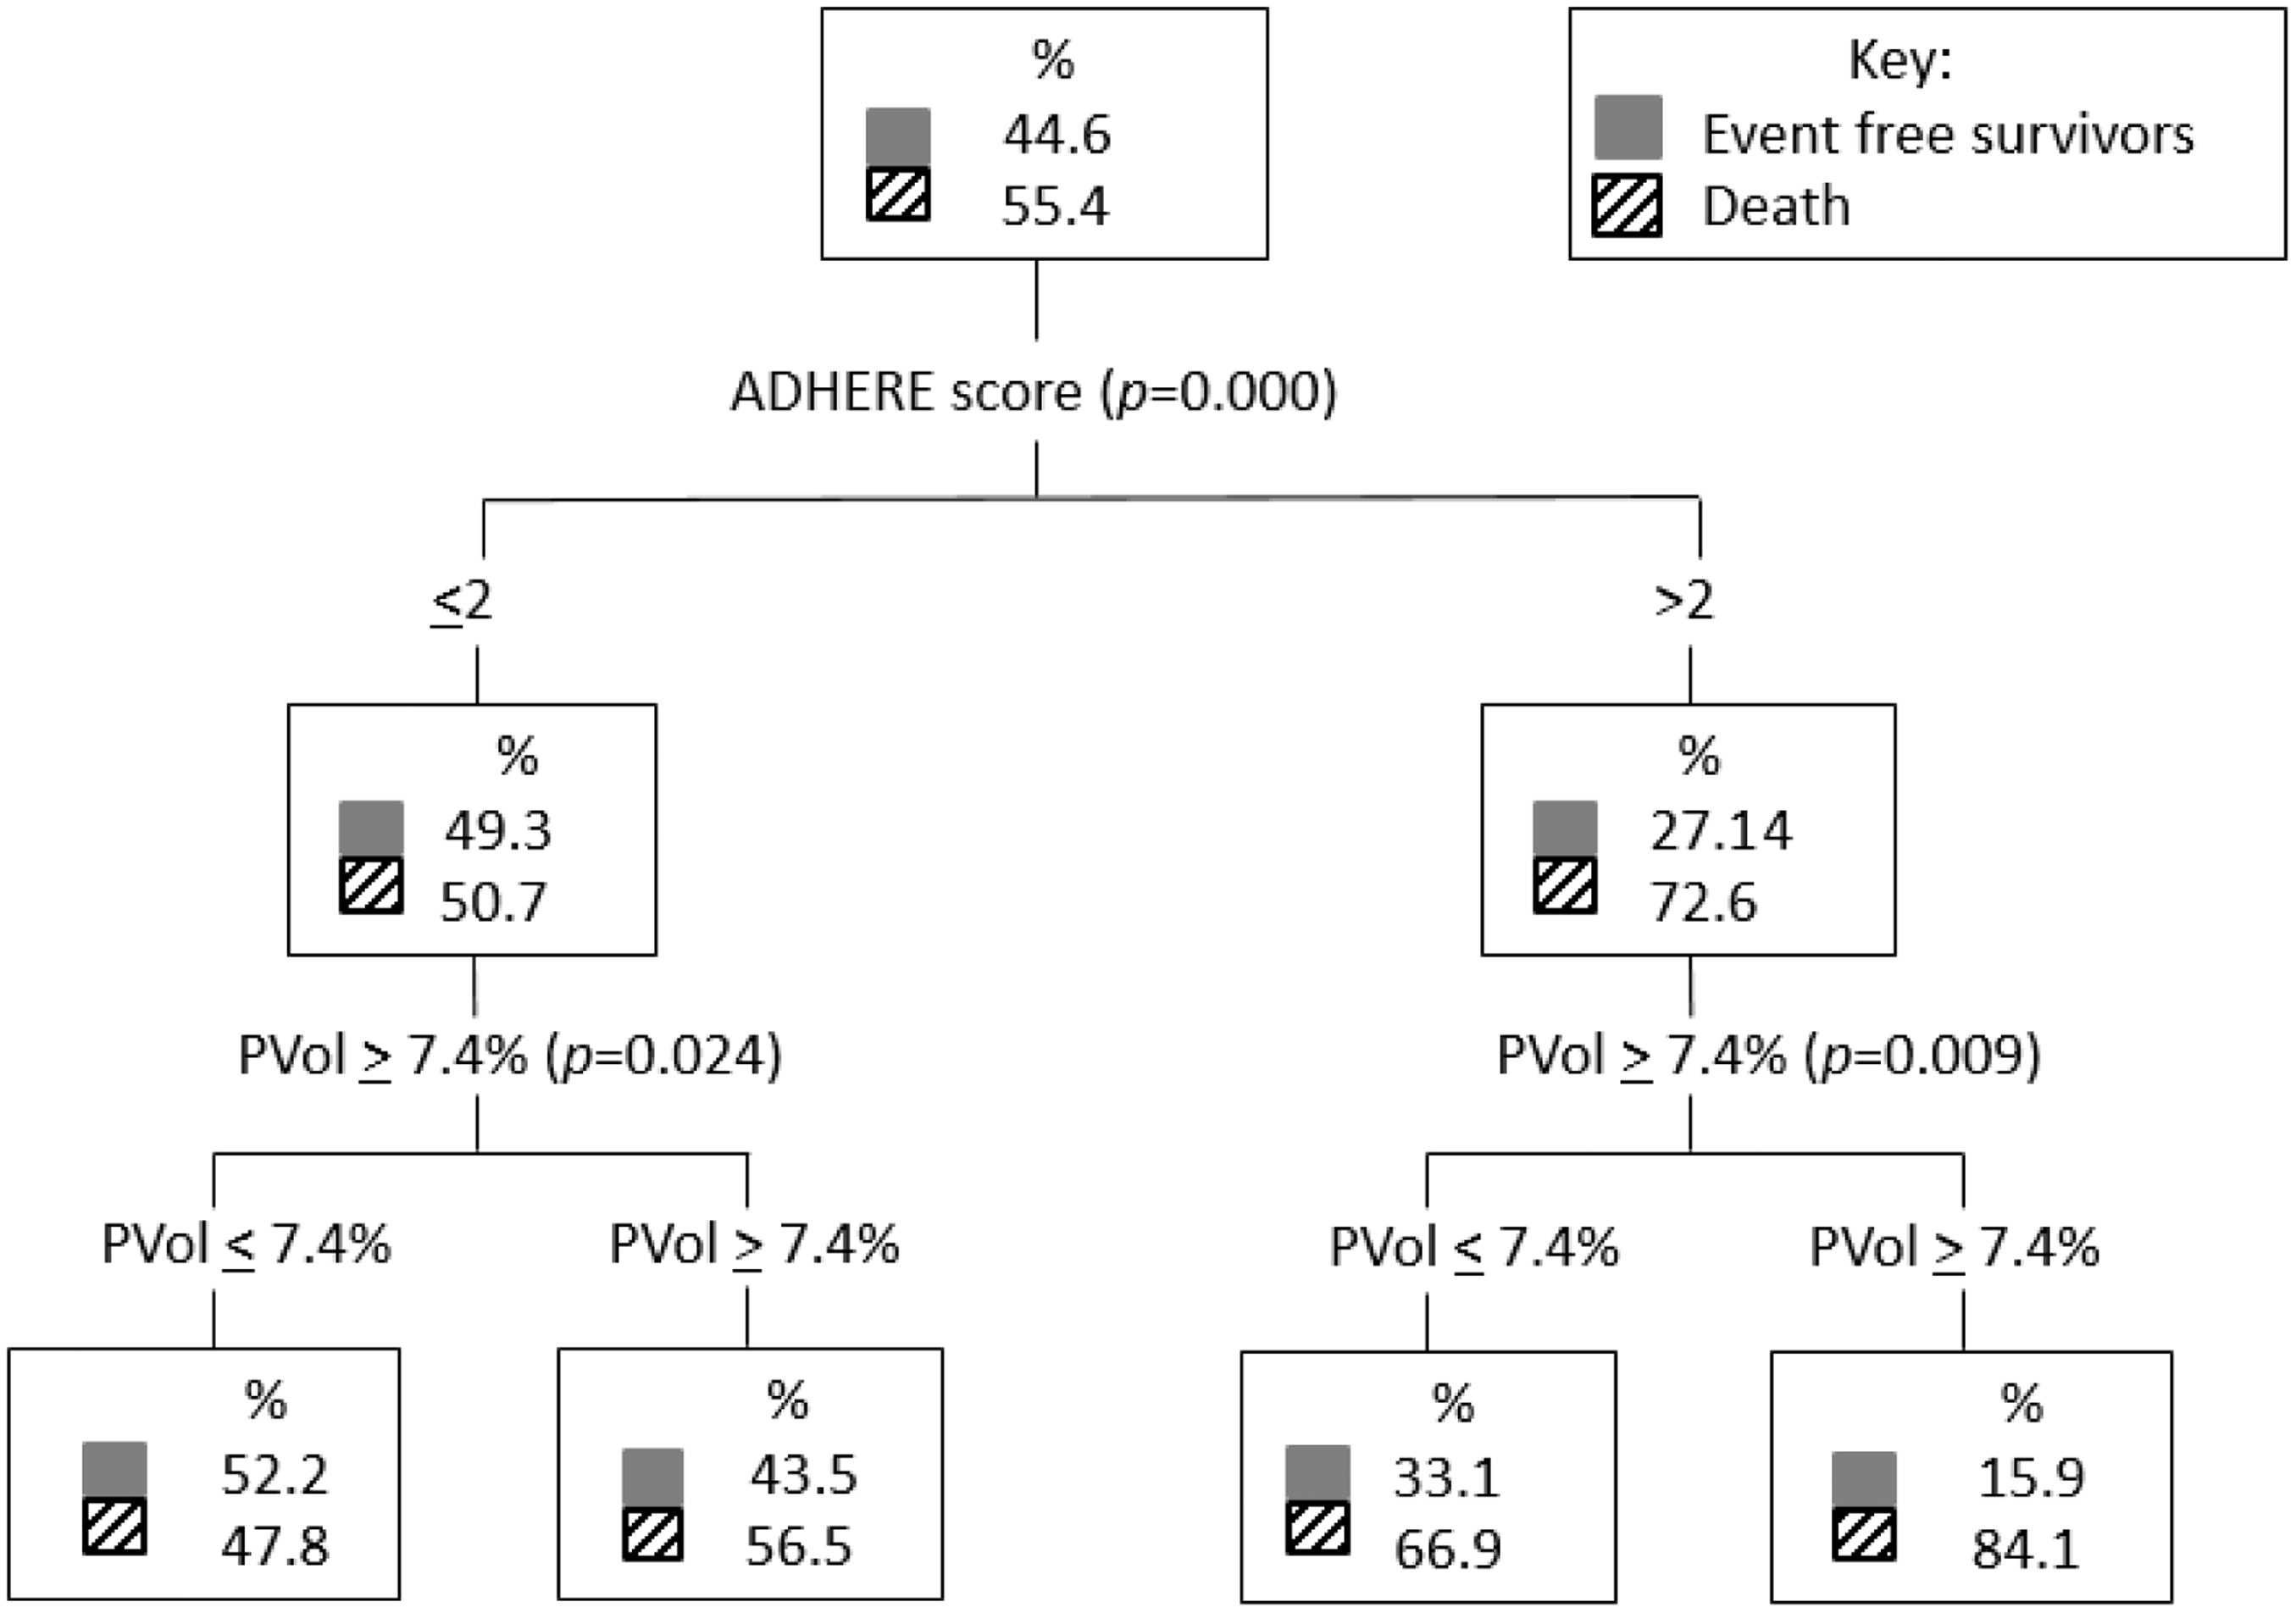
Discussion
In this observational cohort study of acute decompensated heart failure patients, we found change in plasma volume to be prognostic for death and/or heart failure hospitalisation and all-cause mortality in acute decompensated heart failure. This was independent of other covariates such as age, sex, systolic blood pressure, past history of hypertension, diabetes, heart failure, hypertension or ischaemic heart disease, serum creatinine, urea and sodium and New York Heart Association functional score. Unlike other molecular biomarkers of heart failure, change in plasma volume is calculated from routine blood test results without additional expense.
Change in plasma volume augments the value of the ADHERE risk score in predicting death or heart failure hospitalisation and all-cause mortality, as seen in Figures 2 and 3 with additional risk stratification at both higher and lower ADHERE risk groups.
This is a unique study due to its large size and application in acute decompensated heart failure. There is limited evidence (in the form of abstracts) evaluating change in plasma volume (utilising the Strauss–Davis–Rosenbaum formula) and prognosis in acute decompensated heart failure.4,16 Other studies looking at plasma volume and its prognostic capability have evaluated either interval change in haemoglobin, haematocrit, weight or a combination of haematocrit and weight in acute decompensated heart failure and chronic heart failure.16,17 The largest studies have been post hoc studies in chronic heart failure populations and are not directly comparable due to differences in the definition plasma volume change or status.7,16–18
A similar study by Norrington et al. found a mortality rate with a HR of 1.11 to predict death at six months and 12 months which is comparable to our study where a HR of 1.15 was found. 4 More robust data from post hoc analysis of the EVEREST study (also conducted in acute decompensated heart failure) found that haemoconcentration was associated with improved congestion and decreased mortality. 17 Dilutional anaemia was more likely in HFREF while a red-cell deficit was more likely in HFPEF. 19
The mechanism by which changes in plasma volume affect prognosis is not well understood. One recent explanation has been that plasma volume expansion results in reduction in intracellular volume that contributes to worsening renal function (WRF) in heart failure patients.20,21 Worsening renal function is used to describe a decline in renal function without renal injury in patients with heart failure. 22 It appears to have prognostic value. The most widely accepted definition of worsening renal function is a rise in creatinine of at least 26.5 µg/mol (0.3 mg/dL) from baseline.20,22–24 Our study found that change in plasma volume remains independently predictive of mortality despite including admission urea and creatinine as covariates.
Molecular biomarkers for prediction of outcome in heart failure exist such as NT-proBNP but are costly and are not routinely performed,25,26 especially with an ever-increasing pressure on existing finite healthcare resources. Active monitoring of change in plasma volume (estimated using serum haemoglobin and haematocrit values) during an acute decompensated heart failure hospital episode could guide in hospital patient management.3,4,16,18 For instance, clinicians could optimise diuresis, aiming for a low–medium-risk change in plasma volume in order to avoid worsening renal function which has been associated with poor prognosis. 27 In addition, change in plasma volume from admission to discharge could be used at discharge by clinicians without access to routine in-hospital BNP/NTproBNP testing to prioritise earlier postdischarge follow-up visits, which may allow for intensified heart failure therapy in those at highest risk, although the actual benefit from either intervention will require testing in a prospective controlled study.
Study limitations
The study was based on data collected at a single centre with two admitting hospitals and extrapolation to the wider population requires verification. plasma volume was estimated using a formula. It would have been ideal to compare the estimated plasma volume to the actual measured plasma volume to further validate the formula but measured plasma volume was not available in this patient sample and is invasive. The formula used has been validated in chronic, not acute heart failure.3,4
Patients may have received a blood transfusion during their admission. Information on transfusion was not available. To account for patients who were likely to have had a blood transfusion, patients were excluded if their haemoglobin increased by 30 g/dL or more during the admission. Clinical effectiveness studies are required to assess the use of change in plasma volume for management strategies in patients identified to have differing prognostic risk.
Conclusion
Change in plasma volume over an admission can be used for prognostication in acute decompensated heart failure and adds value to an existing estimator of risk, the ADHERE score. It can be easily and inexpensively calculated from routine blood tests. Clinically, this may facilitate risk stratification with targeted treatment of heart failure patients at greatest risk of an adverse outcome.