
Abstract
Introduction:
Intradialytic hypotension is a common complication of haemodialysis, but uncommon in peritoneal dialysis (PD). This may be due to lower ultrafiltration rates in PD compared to haemodialysis, allowing for sufficient refilling of the blood plasma compartment from the interstitial volume, but the underlying mechanisms are unknown. Here we assessed plasma volume and hemodynamic alterations during experimental PD with high versus low ultrafiltration rates.
Methods:
Experiments were conducted in two groups of healthy Sprague-Dawley rats: one group with a high ultrafiltration rate (N = 7) induced by 8.5% glucose and a low UF group (N = 6; 1.5% glucose), with an initial assessment of the extracellular fluid volume, followed by 30 min PD with plasma volume measurements at baseline, 5, 10, 15 and 30 min. Mean arterial pressure, central venous pressure and heart rate were continuously monitored during the experiment.
Results:
No significant changes over time in plasma volume, mean arterial pressure or central venous pressure were detected during the course of the experiments, despite an ultrafiltration (UF) rate of 56 mL/h/kg in the high UF group. In the high UF group, a decrease in extracellular fluid volume of −7 mL (−10.7% (95% confidence interval: −13.8% to −7.6%)) was observed, in line with the average UF volume of 8.0 mL (standard deviation: 0.5 mL).
Conclusion:
Despite high UF rates, we found that plasma volumes were remarkably preserved in the present experiments, indicating effective refilling of the plasma compartment from interstitial tissues. Further studies should clarify which mechanisms preserve the plasma volume during high UF rates in PD.
Introduction
Intradialytic hypotension is a common complication of haemodialysis and is associated with increased mortality and cardiovascular disease. 1 Even though high ultrafiltration (UF) rates can lead to intradialytic hypotension in haemodialysis, 2 this is typically not observed during peritoneal dialysis (PD) treatment. Fluid transport in PD occurs via osmosis across the peritoneal membrane, from the peritoneal capillaries to the peritoneal cavity. Blood plasma is then thought to be refilled by a trans-capillary flow of fluid from the interstitium, and via lymphatic vessels, preserving the plasma volume. The equilibrium between the plasma refilling rate and UF rate has been studied in haemodialysis in humans by measuring blood volume and extracellular volume (ECV), 2,3 indicating that the development of intradialytic hypotension is caused by a drop in blood volume which, in turn, may be due to a mismatch between the UF rate and the plasma refilling rate. Three classical factors are typically conceived as determining the refilling rate: lymphatic return, venous pressure and colloid osmotic pressure 4,5 of which the latter are typically influenced during haemodialysis in a direction favouring refilling. However, in contrast to haemodialysis, a large part of UF during PD consists of free-water transport which also acts to increase the crystalloid osmotic pressure in blood plasma. Experimental studies have shown that aquaporins have a major role in UF during PD, and up to 50% of the UF volume may be solute free water, 6 which is not the case in haemodialysis where water is removed simultaneously with small solutes. Whether or not crystalloid osmotic pressure influence the refilling rate during dialysis treatment is as yet an unresolved question, but there is little doubt that crystalloid osmotic forces govern water transport across peritoneal capillaries. 7
Intradialytic hypotension is essentially non-existent during PD which is commonly assumed to be due to the fact that UF rates are typically higher in haemodialysis. For example, even during a 4.25% glucose dwell, the UF rate during the first hour is typically well below 10 mL/kg/h, 8 a UF rate usually considered to be safe in haemodialysis patients. However, PD utilising very high UF rates is little studied, and to our knowledge there are no studies on the effects of high UF rates on the plasma volume during PD. The purpose of this study is to use a rat model of PD to compare the effects of high and low UF rates on the plasma volume assessed using radio-iodinated (125I) albumin and hemodynamic parameters.
Materials and methods
Experimental studies were performed in 13 healthy Sprague-Dawley rats and have ethical approval by the Ethics Committee for Animal Research at Lund University: 5.2.18-4905/16. Induction of anaesthesia was achieved by carefully placing a glass container over the rat, with an attached flow of isoflurane 5% in air. When anaesthesia had occurred, the glass container was removed, and the rat was ventilated through a mask with isoflurane 1.6–1.8% in air. A tracheostomy was performed after which the rat was connected to a volume-controlled ventilator (Ugo Basile; Biological Research Apparatus, Comerio, Italy) and ventilated with a positive end-expiratory pressure of 4 cm H2O and a tidal volume of 3 mL/kg. End-tidal CO2 was continuously monitored using a capnograph (Capstar-100, CWE, Ardmore, Pennsylvania, USA), and the respiratory rate was adjusted to obtain an end-tidal CO2 between 4.4–5.5 kPa (usually resulting in a respiratory rate between 65 and 75/min). The animal was placed on a feedback-controlled heating pad, keeping the body temperature at 37.2 ± 0.1°C.
Surgically, the rat was prepared for the experiment by catheterisation of the femoral artery and vein, with a central venous pressure gauge attached to the left femoral vein catheter and an arterial pressure gauge attached to the right femoral artery (BioPack Systems model MP150 with AcqKnowledge software version 4.2.0, BioPack Systems Inc., Goleta, California, USA). Heparin (5000 IE/mL, LEO Pharma A/S, Ballerup, Denmark) was used to flush the catheters and associated equipment to prevent clogging and thrombosis during the following procedures. Furthermore, a peripheral venous catheter (Venflon) Ø 1.7 mm was placed into the peritoneal cavity to serve as a PD catheter, similar to recent experiments. 9
High UF group
Seven 9-week-old Sprague-Dawley rats were used in the high UF experiments, having an average body weight of 290 g (209–323 g). Activity measurements were conducted in a gamma counter (Wizard 1480, LKB-Wallac, Turku, Finland). The dialysate that was used to perform PD in the high UF-group was BicaVera 4.25% glucose (Fresenius, Bad Homburg, Germany) spiked with additional glucose to achieve a glucose concentration of 8.5%. Two different radiopharmaceuticals were used during the study. Firstly, a chromium-51 radionuclide (51Cr-EDTA) (37 MBq, PerkinElmer Health Sciences B.V. Groningen, The Netherlands), and secondly iodine-125 human serum albumin, produced in the laboratory.
Low UF group
A low UF group that consisted of six 9-week-old Sprague-Dawley rats was also included. The rats had an average body weight of 302 g (224–380 g). This group underwent the same experiment in exactly the same manner as the group with high UF, the difference being that the Bicavera 1.5% glucose (Fresenius, Bad Homburg, Germany) was used as the dialysate, with the aim of producing little or no UF.
Experimental design
The present experiment consisted of two phases. In the first phase, the extracellular fluid compartments (the plasma- and extracellular fluid volumes) in the rat were quantified, and in the second phase, measurements were made while the rat was subject to PD. The method used to measure plasma volumes was also validated in a separate experiment. Mean arterial pressure (MAP), central venous pressure (CVP) and heart rate (HR) were registered continuously during the experiment.
Phase 1
Phase 1 began with a bolus IV injection of 0.3 mL 51Cr-EDTA and the start of a 0.05 mL/min IV-infusion of 51Cr-EDTA. The activity of the 51Cr-EDTA solution was measured in the gamma counter. Blood samples (75 µL) were taken 5, 10, 15, 30, 60 and 120 min after the start of the infusion and were analysed for erythrocyte volume fraction and blood concentration of 51Cr-EDTA. In addition, routine blood chemistry consisting of Na+, K+, Cl−, Ca2+, urea, glucose, total CO2, creatinine, erythrocyte volume fraction and haemoglobin was obtained at the end of the experiment. Urine volume was measured and urine activity of Cr-EDTA was determined, as well. Finally, a plasma volume measurement was performed, using I-125-albumin (RISA) as a marker. The details of the plasma volume measurements will be explained in detail in the next section. After all measurements in phase 1 were finished, 25 mL of BicaVera spiked with glucose to achieve a concentration of 8.5% was administered via the PD catheter and a new tube for urine collection was placed.
Phase 2
The start of PD marked the beginning of phase 2. Plasma volume assessments were conducted at 5, 10, 15 and 30 min after the start of dialysis. The plasma volume measurement procedure began with an IV injection of a known (pre-counted) amount of RISA, followed by a 5-min wait and a blood plasma sample of 25 µL, which was placed in the gamma counter to determine the activity of RISA in the sample. To determine the amount of RISA that was injected, the equipment used to perform the injection (syringe etc.) were analysed in the gamma counter, before and after the injection. This step is important due to the binding of albumin to plastic. 10 If consecutive measurements are conducted on the same animal, the residual activity of RISA in the blood must be determined before administering RISA for the next measurement. In the cases where there was a 5-min interval between plasma volume measurements, the plasma sample to measure the activity for estimating the plasma volume coincided with the sample to determine residual activity for the next measurement (Figure 1). Therefore, a separate blood sample to determine residual value was not taken in these cases. Similar methods have been used in other studies. 11,12 In addition to the blood samples, a sample of the intraperitoneal dialysate was taken at baseline. Urine was collected and the volume was measured, as well as the activity of 51Cr-EDTA in the collected urine. After the experiment, the rats were euthanised with an injection of potassium chloride.
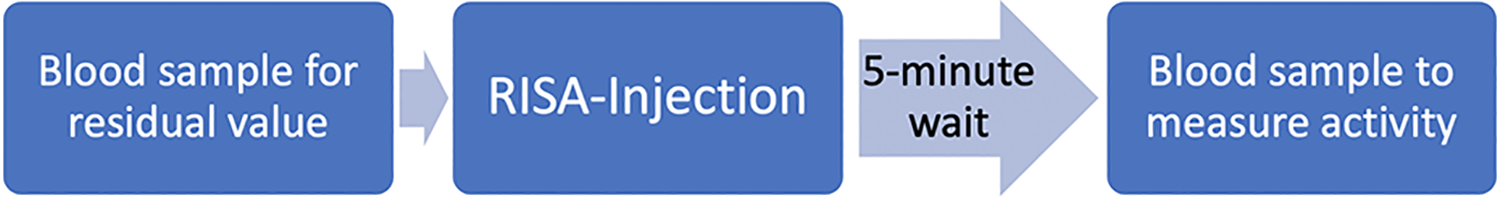
Flow chart over plasma volume measurements. Measurements start with a blood sample to determine any residual activity of RISA in plasma, closely followed by a RISA injection of known dose. After 5 min, a blood sample was taken and analysed to form a base for plasma volume calculation. RISA: radio-iodinated sodium albumin.
Validation of the plasma volume measurements
The validity of the plasma volume measurement method was examined before animal experiments were commenced. Briefly, in vitro plasma volume measurements were carried out in a beaker with 10 mL of heparinised rat’s blood. Plasma volume measurements were done in exactly the same manner as in the in vivo experiment at 0, 5, 10, 15, 20, 25, 30, 40 and 60 min from the start of the experiment. Thus, the only difference was that injections and blood sampling were performed on the beaker, rather than the animal. The blood was of known erythrocyte volume fraction, which was measured by centrifugation of glass capillaries. The volumetric plasma volume (i.e. (1-EVF) × 10 mL) was compared with the distribution volume of RISA. Estimated plasma volumes versus the volumetric plasma volume in the beaker are shown in Supplemental Table S1. As seen, the plasma volumes estimated using RISA were, on average 88% of the volumetric volume. Due to the low discrepancy in deviation from the theoretical plasma volume between the RISA dependent measurements (standard deviation (SD) of 2 percentage points), the error is likely to be systematic. Therefore, a correction factor of 1.136 (1/0.88) was used when estimating plasma volumes using RISA, to compensate for the systematic error. A Bland-Altman plot (Supplemental Figure 1) illustrates the spread of measurement points around the difference, of which all are set between the 95% confidence intervals of the mean difference. Finally, a power analysis showed that the method has 99.96% power to detect a 10% change of plasma volume (pwr package R).
Statistical analyses and mathematical models
All statistical analyses and other calculations were performed in R version 3.6.2 (2019-12-12) using R Studio. Data are summarised as mean values and SDs unless otherwise stated.
Non-linear regression model and ECV estimation
For phase 1 of the dialysis experiment, data were fitted to a theoretical model to calculate the ECV in the rat. The following equation was used as a model for the change in Cr-EDTA concentration C during infusion:
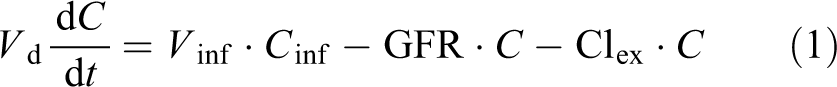
This differential equation states that the infused amount of Cr-EDTA, which equals
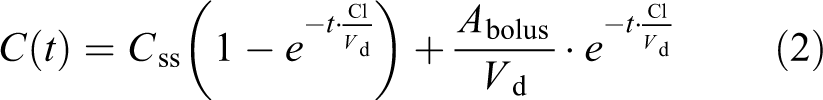
Where C ss is the steady-state concentration, Cl is the total clearance of Cr-EDTA and V d is the volume of distribution of Cr-EDTA, which is the estimated ECV. This equation was used in a non-linear least squares regression to approximate the V d, which is the only unknown variable.
Plasma volume estimation
For the second phase of the experiment, a script was written to calculate the change in plasma volume from the measured activity of RISA at 5, 10 15 and 30 min after the phase 2. This is an application of the dilution formula, as follows.

Where V P is the plasma volume, A RISA is the activity of the injected amount of RISA and C RISA is the activity of RISA in the blood sample. V ex is the volume that was added through injections and the infusion, which increases over time.
The plasma volume changes were tested against the null hypothesis that there is no change in plasma volume compared to baseline using one-way analysis of variance (ANOVA). Also, the change in plasma volume as a percentage of the baseline plasma volume was calculated.
Calculation of UF in PD
PD UF V uf was estimated as the volume V out of aspirated dialysate at the end of phase 2, minus the sum of the volume of the administered dialysate V in.

The residual volume V R was set to 3 mL in the calculations, based on previous measurements. 13
Calculation of change in ECV during dialysis using mass balance
Baseline extracellular volume ECV0, the volume of urine UV produced during phase 2, plasma volume change ΔPV, UF volume UF and the volumes added V injections and subtracted V samples are either known or measured. Because there is no other significant fluid loss or addition of fluid to or from the rat, it is possible to use the principle of conservation of mass. Therefore, it is possible to estimate the ECV at the end of phase two ECV30, 30 min after the start of dialysis, as follows:
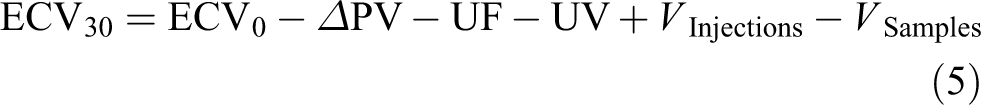
After calculating the end-ECV, the ECV-change was calculated and tested against the null hypothesis of there being no change in ECV, using a repeated measures ANOVA. One rat was excluded from the calculation due to contradictory values for the ECV.
Results
Baseline characteristics
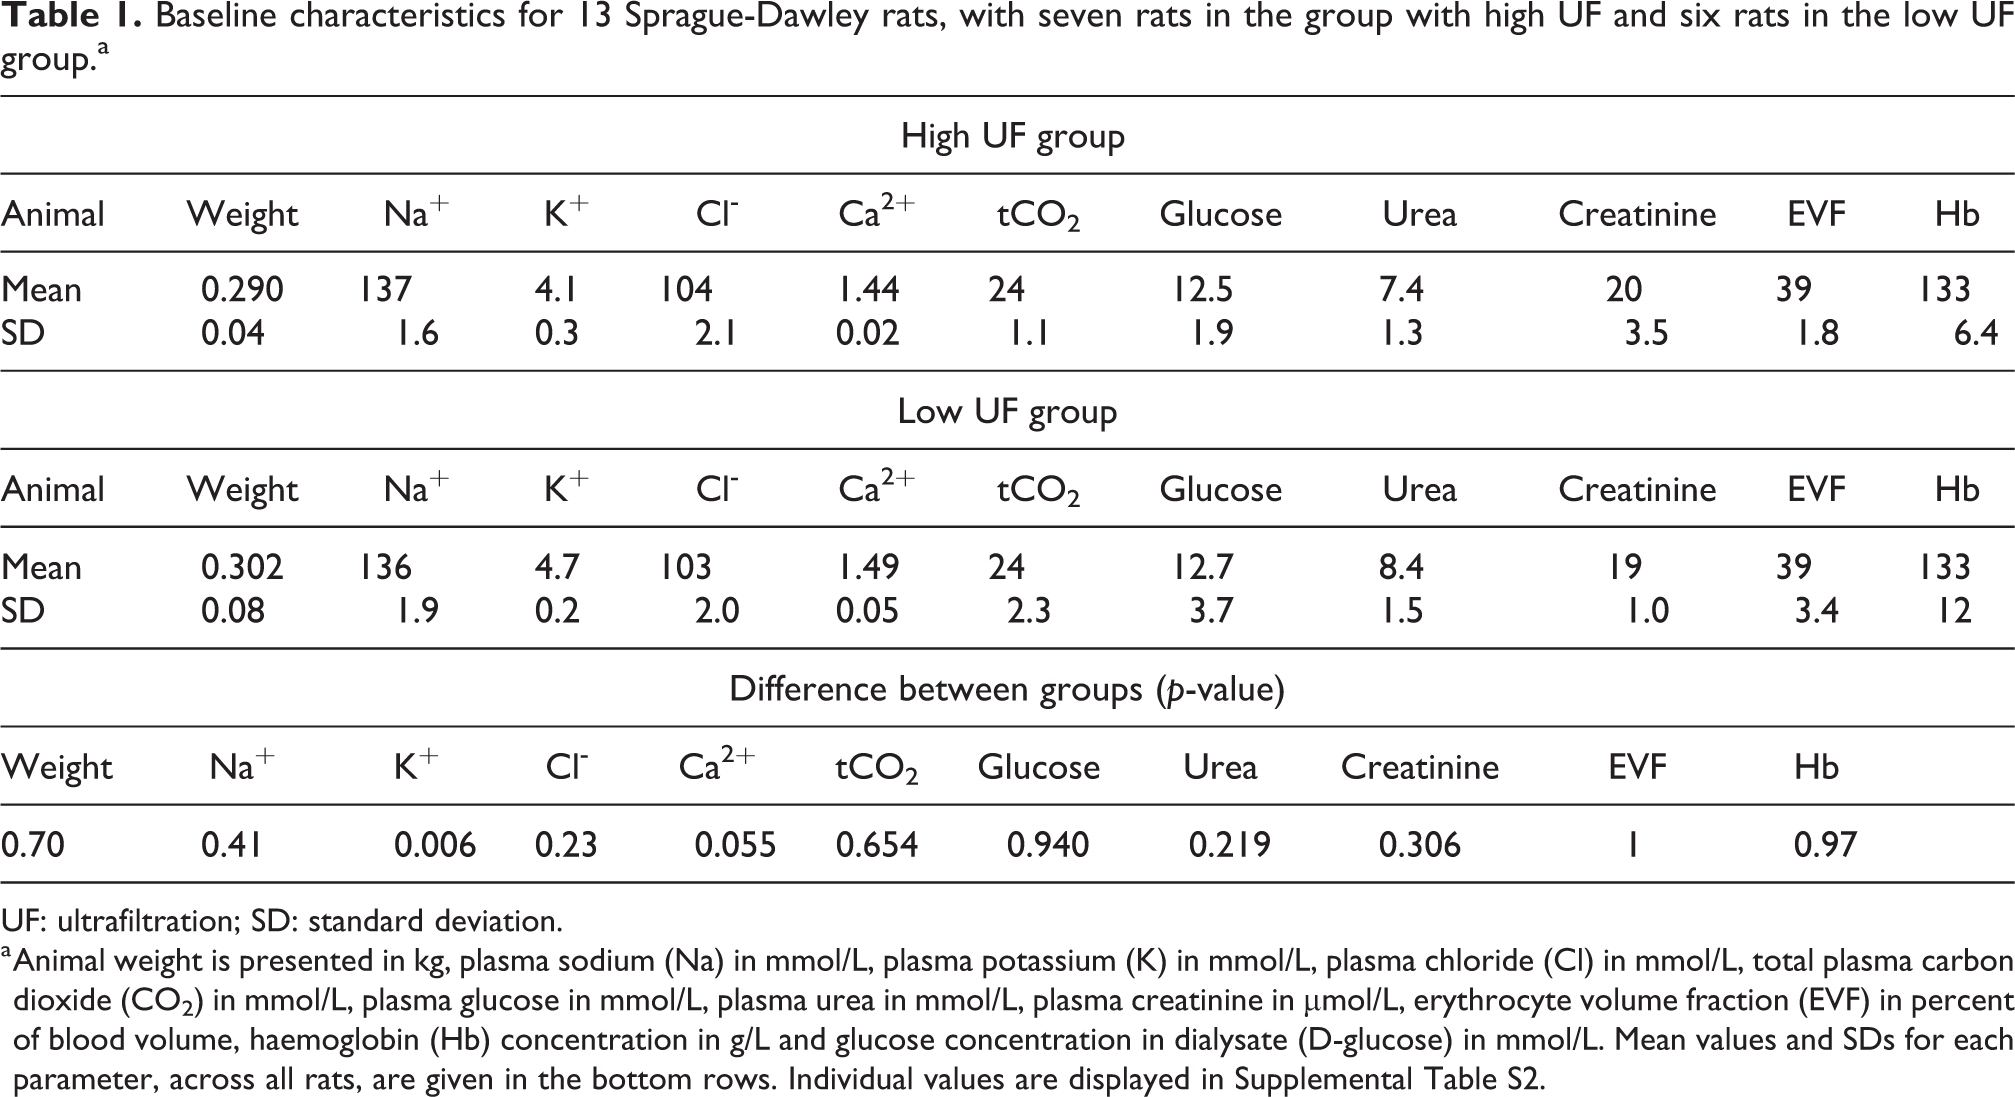
Baseline characteristics are presented in Table 1. Between the groups, there were no significant differences in baseline parameters. One of the rats had a weight that was 80 g below the mean value. All rats were about 9 weeks old at the time of the experiment. In the low UF group, there was some heterogeneity in blood glucose and in weight.
Baseline characteristics for 13 Sprague-Dawley rats, with seven rats in the group with high UF and six rats in the low UF group.a
UF: ultrafiltration; SD: standard deviation.
a Animal weight is presented in kg, plasma sodium (Na) in mmol/L, plasma potassium (K) in mmol/L, plasma chloride (Cl) in mmol/L, total plasma carbon dioxide (CO2) in mmol/L, plasma glucose in mmol/L, plasma urea in mmol/L, plasma creatinine in µmol/L, erythrocyte volume fraction (EVF) in percent of blood volume, haemoglobin (Hb) concentration in g/L and glucose concentration in dialysate (D-glucose) in mmol/L. Mean values and SDs for each parameter, across all rats, are given in the bottom rows. Individual values are displayed in Supplemental Table S2.
Plasma volume changes over time
The plasma volume change followed no apparent trend over time, ranging between a 2.2% decrease and a 1.6% increase over 30 min of dialysis (Figure 2) in the high UF group. In the low UF group, the plasma volume varied between a 4.3% decrease and a 1.3% increase over time.
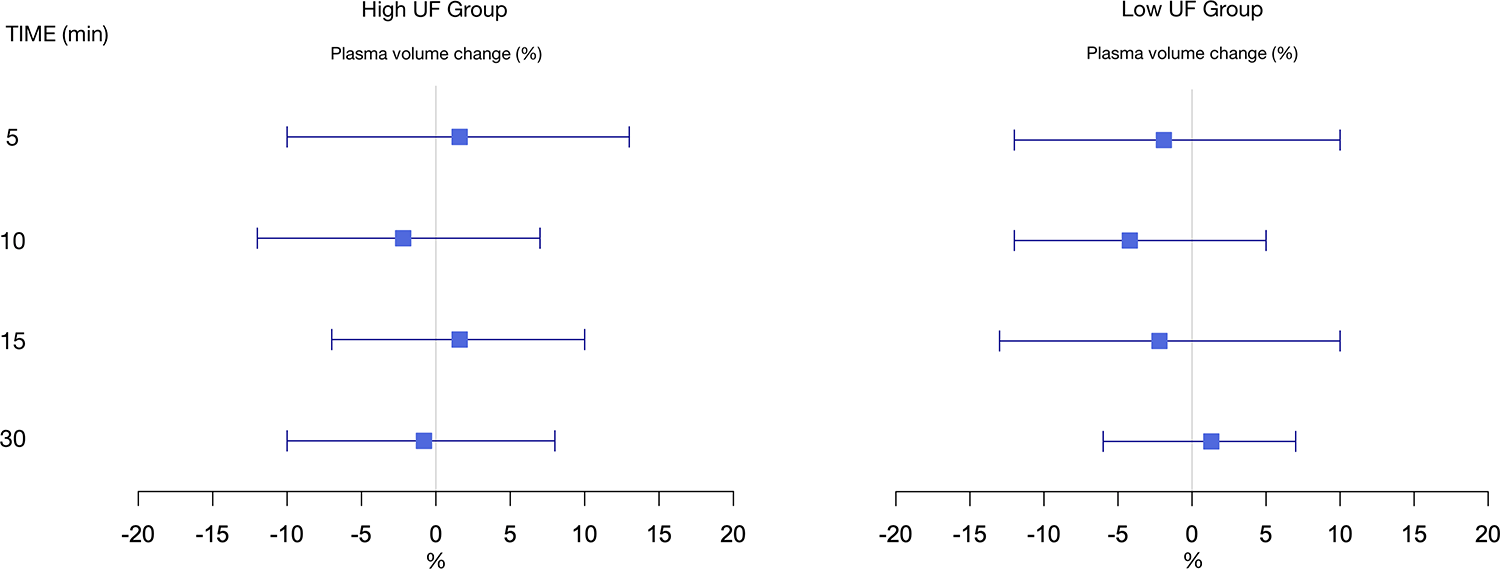
Forest plot of the plasma volume changes compared to baseline at 5, 10, 15 and 30 min from the start of dialysis. Differences are displayed as mean (%) and 95% confidence intervals.
Extracellular fluid volume changes during dialysis
As presented in Table 2, in the group with high UF, there was an apparent decrease in ECV of 10.7% (SD: 3.9%) of initial ECV after 30 min of dialysis, with a p-value of 0.003 (n = 6). The observed change in ECV during dialysis with ultra-high 8.5% glucose varied between −5.8% and −15.8%. In contrast, in the low UF group, the mean change in ECV was +3.0% (SD: 1.4%) of the initial ECV, with a p-value of 0.003 (n = 6), thus indicating a net gain of fluid.
ECV and ECV difference before and after dialysis.a
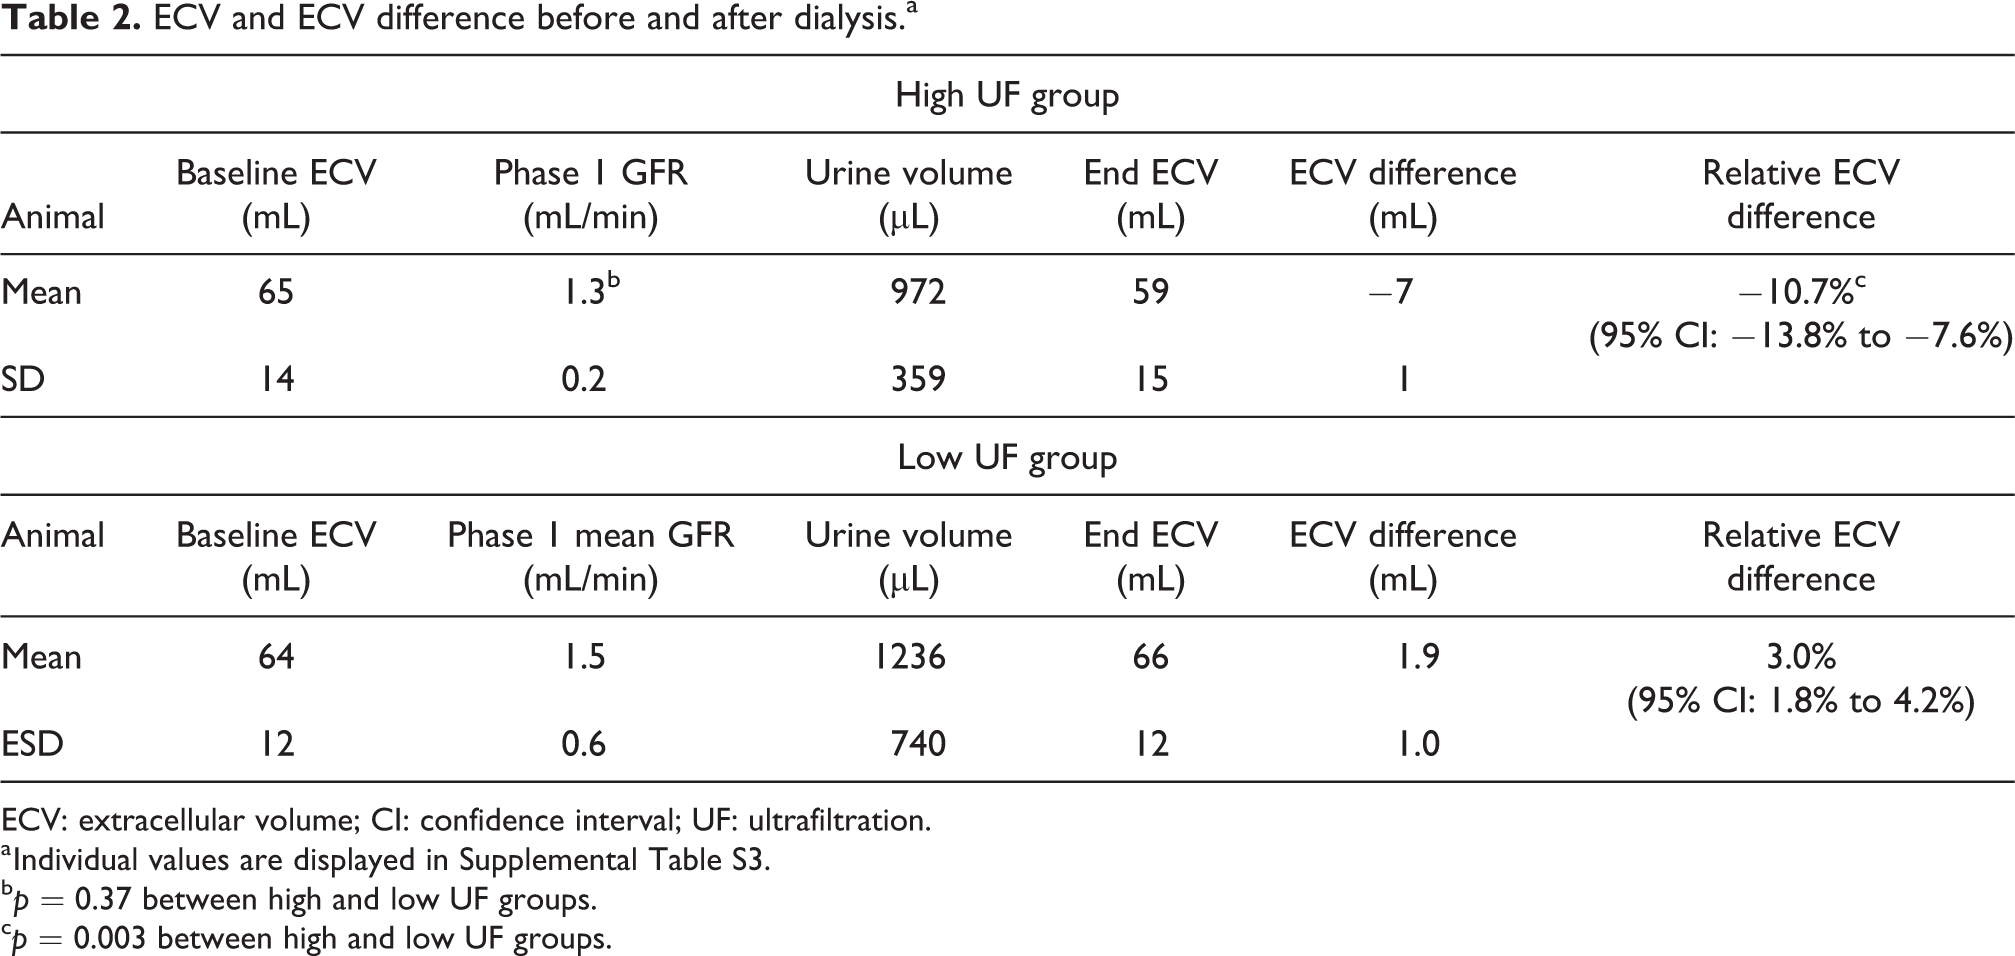
ECV: extracellular volume; CI: confidence interval; UF: ultrafiltration.
a Individual values are displayed in Supplemental Table S3.
b p = 0.37 between high and low UF groups.
c p = 0.003 between high and low UF groups.
Average glomerular filtration rate and ECV
Mean GFR values during phase 1 in the group with high UF were 1.25 mL/min on average, with an SD of 0.2 mL/min (n = 7) (Table 2). Calculated ECV had a median value of 220 mL/kg body weight (n = 6) with a lowest value of 158 mL/kg, a highest value of 363 mL/kg and an interquartile range from 186 mL/kg to 258 mL/kg. The mean GFR in the low UF group was slightly higher, with an average of 1.49 mL/min and an SD of 0.57.
Volume and rate of UF
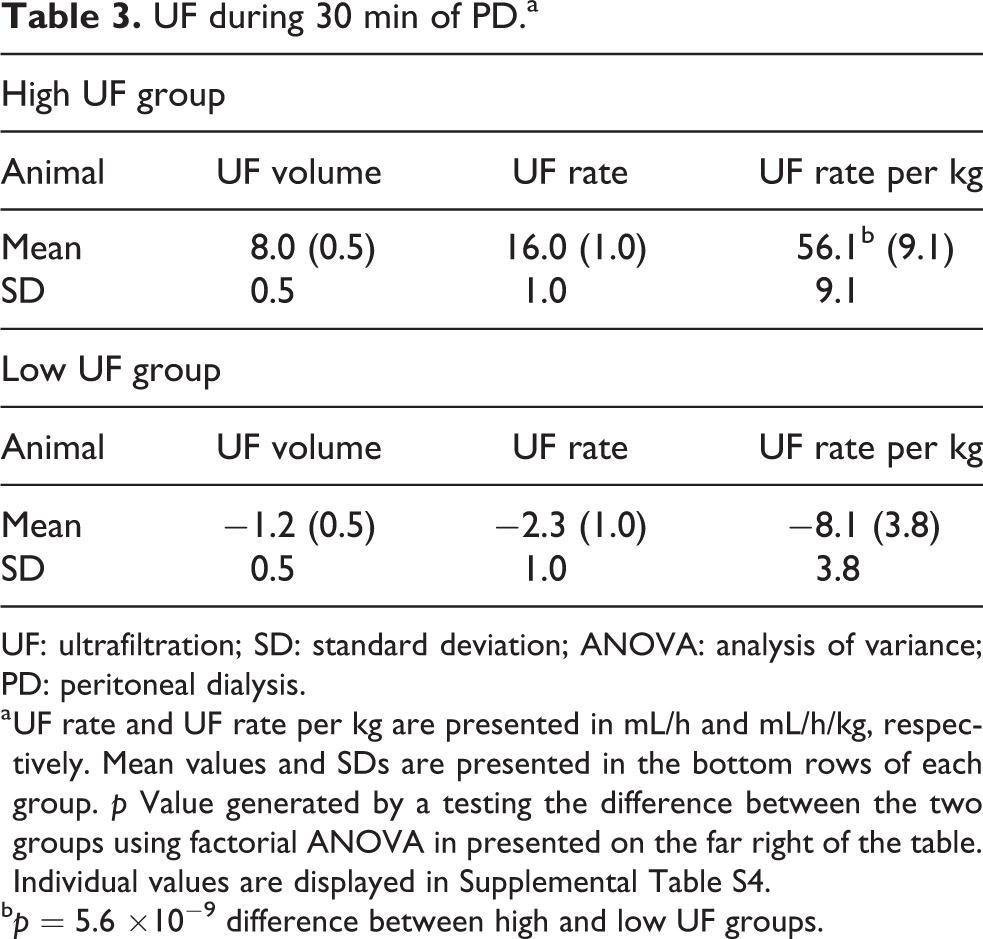
In the group with high UF, the UF volume, UF rate and UF rate per kilogram had means of 8.0 mL (SD: 0.5), 0.27 mL/min (SD: 0.02) and 0.94 mL/min/kg (SD: 0.15), respectively, and in the Low UF group, the corresponding values were and −1.2 (SD: 0.5), −0.04 (SD: 0.02) and −0.13, (SD: 0.06), as shown in Table 3.
UF during 30 min of PD.a
UF: ultrafiltration; SD: standard deviation; ANOVA: analysis of variance; PD: peritoneal dialysis.
a UF rate and UF rate per kg are presented in mL/h and mL/h/kg, respectively. Mean values and SDs are presented in the bottom rows of each group. p Value generated by a testing the difference between the two groups using factorial ANOVA in presented on the far right of the table. Individual values are displayed in Supplemental Table S4.
b p = 5.6 ×10⁻⁹ difference between high and low UF groups.
Changes in HR, MAP and CVP over time
There was little variation over time in mean HR and mean MAP (Figure 3). ANOVA based on heart rate and MAP at measurement points after baseline gave p = 0.30 and p = 0.60, respectively (Table 4). Mean CVP seemed to show a decreasing trend over time, but ANOVA resulted in p = 0.87 (Table 4).
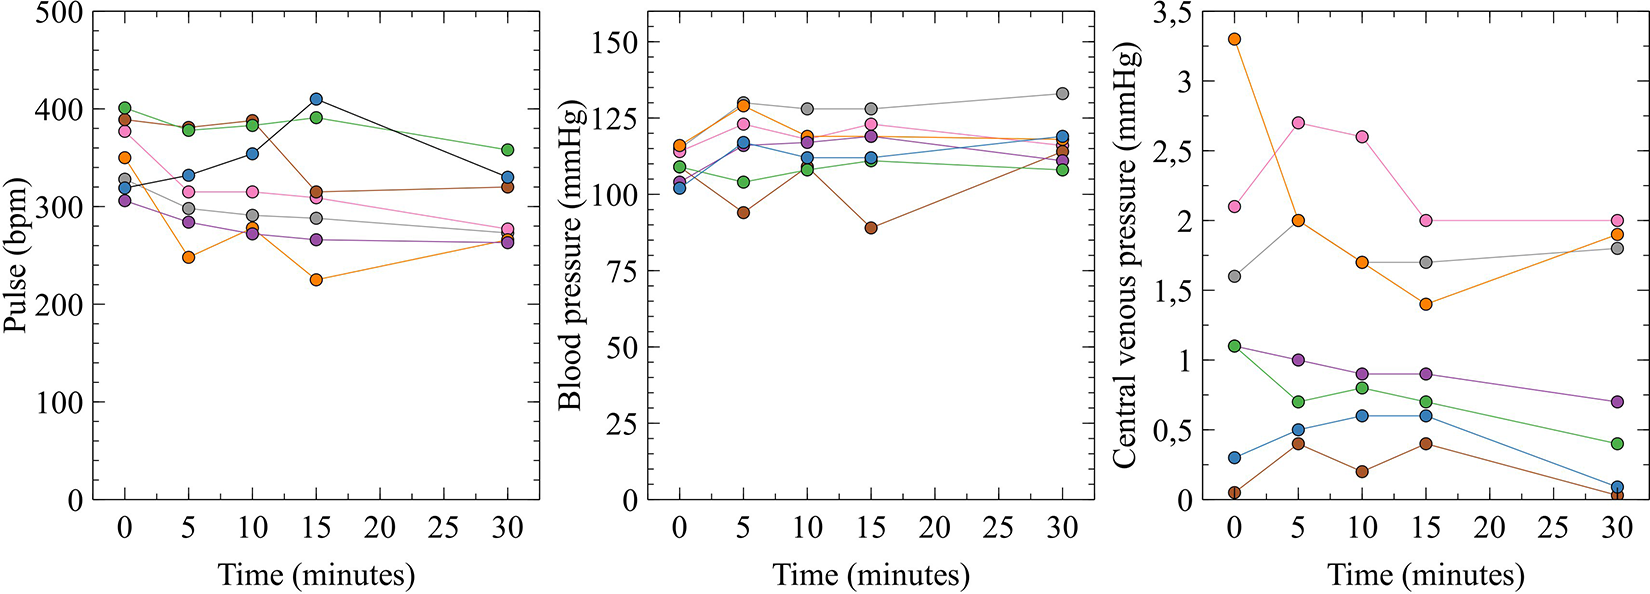
HR, MAP and CVP at 0, 5, 10, 15 and 30 min after the start of PD with high UF in Sprague-Dawley rats (n = 7). No significant change from the baseline value was noted in any of the parameters, with p values of 0.30, 0.60 and 0.87 for the change in HR, MAP and CVP, respectively. The null hypothesis was tested using a one-way analysis of variance. HR: heart rate; MAP: mean arterial pressure; CVP: central venous pressure; PD: peritoneal dialysis.
HR, MAP and mean CVP at measurement points 0, 5 10, 15 and 30 min after the start of PD.a
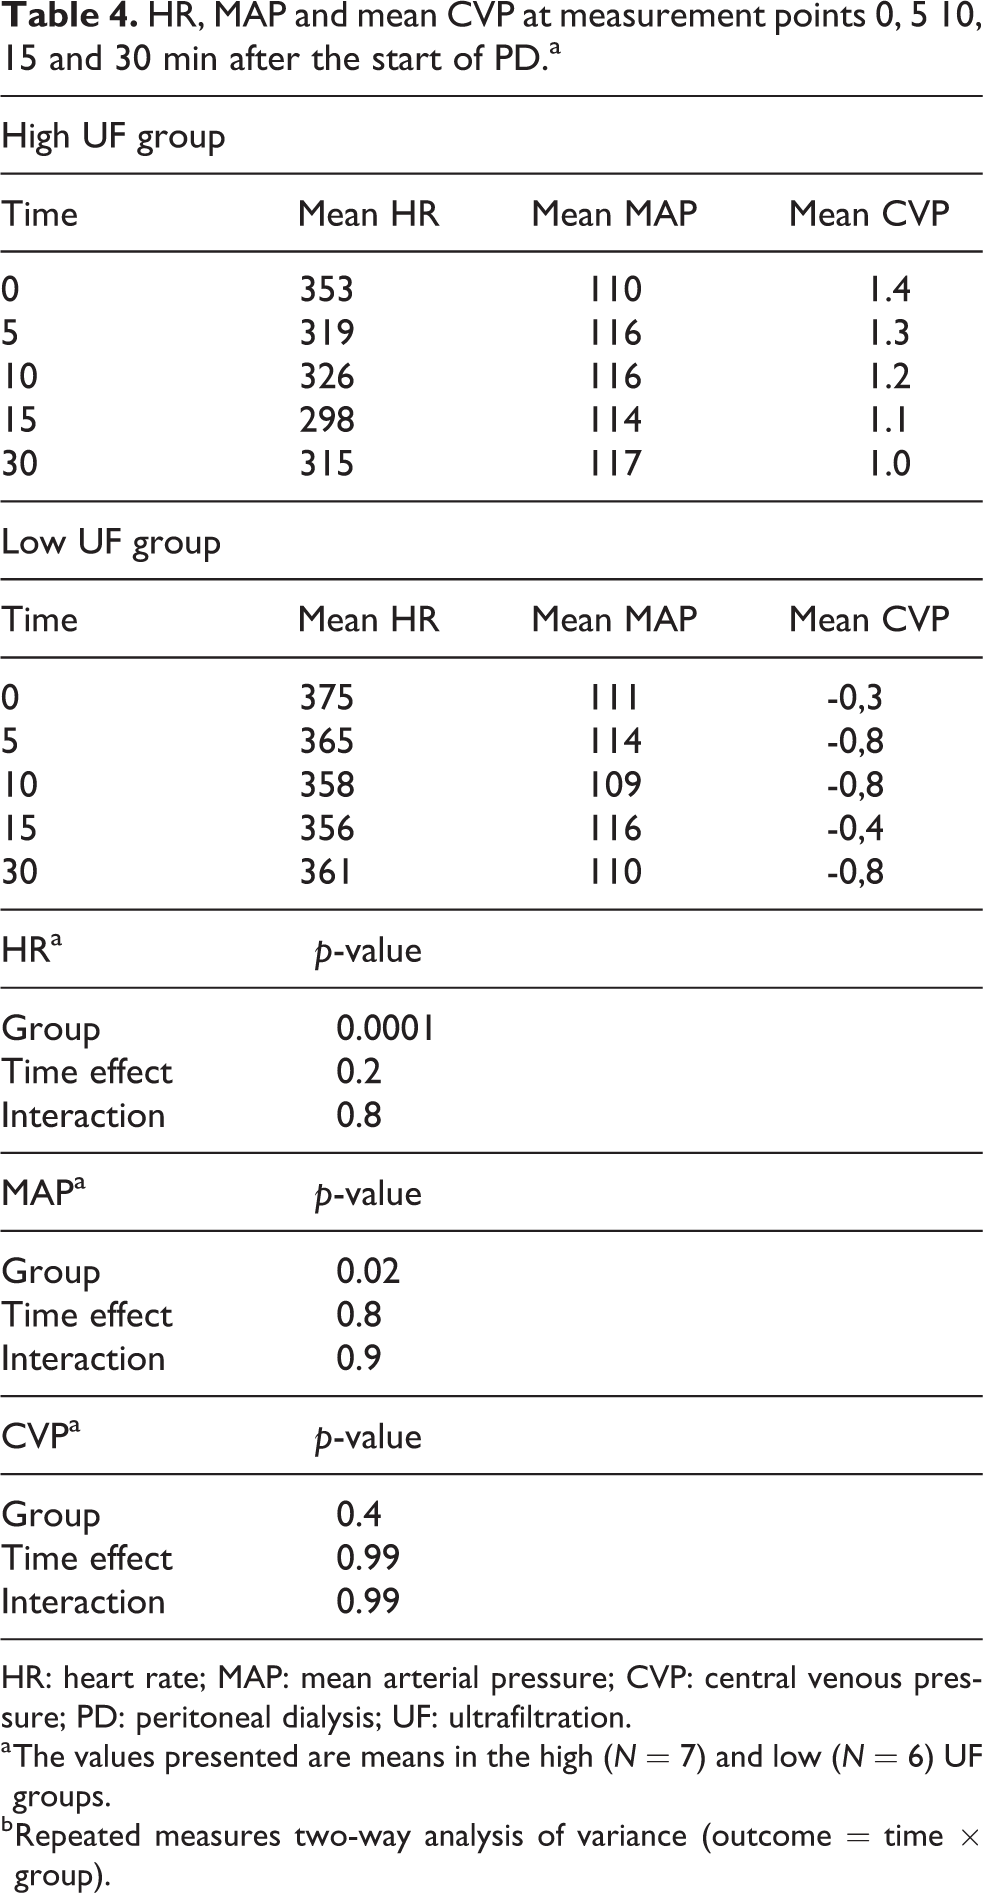
HR: heart rate; MAP: mean arterial pressure; CVP: central venous pressure; PD: peritoneal dialysis; UF: ultrafiltration.
a The values presented are means in the high (N = 7) and low (N = 6) UF groups.
b Repeated measures two-way analysis of variance (outcome = time × group).
Discussion
The purpose of this study was to investigate how the extracellular and plasma volumes changed during PD with very high UF rates. We hypothesised that the high UF group would exhibit lower plasma volumes over time compared to the low UF group, but, to our surprise, we observed no significant change in plasma volume over time despite quite extreme UF rates averaging 56 mL/h/kg. Since PD removes fluid directly from the circulation via osmosis, the plasma volume needs to be constantly ‘refilled’ to maintain an effective circulating volume. As such, the present results strongly indicate that fluid is directly and effectively recruited from the interstitium without any noticeable alterations in plasma volume during the course of the treatment even during quite high rates of fluid removal. Furthermore, mean arterial pressure was slightly higher in the high UF group combined with a somewhat lower HR which may represent activation of the baroreceptor reflex leading to pre-capillary vasoconstriction. The moderately increased MAP in response to the aggressive UF scheme may, in theory, enhance the refilling rate since vasoconstriction lowers the capillary pressure favouring fluid flow into the circulation. This may possibly be one of the mechanisms preserving effective circulating volume in the present study. However, no clear-cut differences were observed in venous pressure which would indicate an unaltered capillary pressure due to the low post-capillary resistance.
In contrast to haemodialysis, a major portion (approximately 40–50%) of the fluid that is drawn through PD-UF is solute- ‘free water’, 14 which could lead to an increase in the crystal osmotic pressure of the plasma and in turn could increase the TR rate, especially if there are aquaporins present in the vascular wall increasing the osmotic conductance to small molecular species. Furthermore, the colloid osmotic pressure should also rise following the withdrawal of solute-free water from plasma, also increasing the TR rate. In a study by John et al., 15 it was found that hypoalbuminemia was an important factor for tissue overhydration in PD-patients. The large difference in crystalloid osmotic pressure between the 8.5% glucose and the 1.5% glucose fluids makes possible the estimation of osmotic conductance to glucose (OCG) across the peritoneal membrane as follows
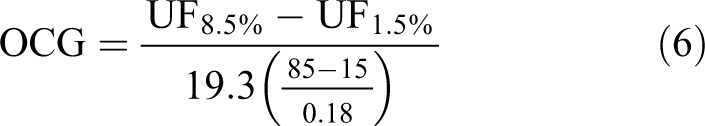
This results in a value for OCG of about 40 nL/min/mmHg which is very similar to previously obtained values in Sprague-Dawley rats (9) but slightly lower than the 62 nL/min/mmHg obtained by Zakaria and Rippe in Wistar rats. 16 This difference may in part be due to the higher fill volume used by Zakaria et al. (25 mL vs. 20 mL), which, by the square-cube law, 17 should result in a 16% higher OCG i.e. (25/20)2/3 ≈ 1.16 but there may also be differences between strains and also the fact that bio-compatible fluids were used in the present experiments.
It is important to note that the present studies were of an acute nature, which means that chronic effects could not be evaluated. Only one exchange was performed during a relatively short period of time (30 min). This short time interval was chosen, because the UF rate is higher in the beginning of the dwell. Also, these animals were not uremic, otherwise healthy, and essentially euvolemic as indicated by baseline ECV and PV measurements. Future studies could be performed in a more chronic setting to investigate if the findings in this study can be replicated in the uremic and hypervolemic condition.
The calculation of the change in ECV is based on simple mass balance (equation (6)) and therefore dependent on many of the measured parameters. In addition, the baseline ECV was somewhat heterogenous, probably indicating a rather large measurement error. Nevertheless, a previous study of extracellular fluid in rats 18 concluded that the extracellular fluid of Sprague-Dawley rats is roughly 24% of body weight, which is similar to the results of this study (22.4%). Also, the mean ECV in this experiment is around four to five times higher than the measured PV, which is the typical relationship in body fluid distribution. 19 The presence of a bolus dose caused the solution of the differential equation (2) to be non-linear, which means that non-linear regression techniques must be applied. However, a linear model would be better and give more robust results because linear regression provides a single unique solution as opposed to non-linear regression, which can result in several possible solutions. This could easily be achieved in future experiments by omitting the bolus dose of 51Cr-EDTA, which would allow for a linear solution to the differential equation. Urine volume is also an important parameter in the mass balance equation and another potential source of errors in these experiments. Because PD was performed simultaneously to urine collection, the present study had to rely on vesicular urine excretion, rather than catheterisation of the ureters, which introduced uncertainty as to which degree the bladder was emptied at the end of the experiment. The urine volume in phase 2 is similar across all rats, except for rat 2 and GFR-values are lower than values calculated in previous research. 20 This could indicate a possible underestimation of the urine volume, and subsequently an underestimation of the change in ECV during dialysis.
This study is the first of its kind examining changes in plasma volume during experimental PD treatment. Future experiments could be performed, for example using other osmotic agents such as icodextrin that generate less free water transport to elucidate whether this is a contributing factor in maintaining plasma volume during PD. Also, even higher rates of UF could be applied with the addition of interventions to manipulate parameters such as plasma osmolality and/or venous pressure. Future studies could also include groups with varying degrees of crystalloid and colloid osmotic pressures as well as different hydration states. We conclude that even at the high UF rates obtained by 8.5% glucose, no noticeable alterations in plasma volume occurred.
Supplemental material
Supplemental Material, sj-docx-1-ptd-10.1177_08968608211069224 - High versus low ultrafiltration rates during experimental peritoneal dialysis in rats: Acute effects on plasma volume and systemic haemodynamics
Supplemental Material, sj-docx-1-ptd-10.1177_08968608211069224 for High versus low ultrafiltration rates during experimental peritoneal dialysis in rats: Acute effects on plasma volume and systemic haemodynamics by Jakob Helman and Carl M Öberg in Peritoneal Dialysis International
Footnotes
Declaration of conflicting interests
The author(s) declared no potential conflicts of interest with respect to the research, authorship, and/or publication of this article.
Funding
The author(s) disclosed receipt of the following financial support for the research, authorship, and/or publication of this article: This study was supported by a grant by the Thure Carlsson foundation and Region Skåne (Medical Training and Research Agreement [Avtal om Läkarutbildning och Forskning; ALF]).
Supplemental material
Supplemental material for this article is available online.
References
Supplementary Material
Please find the following supplemental material available below.
For Open Access articles published under a Creative Commons License, all supplemental material carries the same license as the article it is associated with.
For non-Open Access articles published, all supplemental material carries a non-exclusive license, and permission requests for re-use of supplemental material or any part of supplemental material shall be sent directly to the copyright owner as specified in the copyright notice associated with the article.