
Abstract
Objectives
To determine if NHS reforms affect population mortality.
Design
Retrospective study using routinely published data.
Setting & participants
Resident population of England and Wales 1948 to 2012
Main outcome measure
All cause age sex directly standardised mortality England and Wales 1948 to 2012.
Methods
Using the CuSum technique and Change-Point Analysis to identify sustained changes in the improving age-standardised mortality rates for the period 1948-2012, and comparing the time of these changes with periods of NHS reform. Where observed changes did not fit with NHS reform, changes external to the NHS were sought as a possible explanation of changes observed.
Results
CuSum plotting and CPA showed no significant changes in female mortality trend between 1948 and 2012. However, this analysis identified a sustained improvement in the male mortality trend, occurring in the mid-1970s. A further change in the rate of male mortality decline was found around the Millennium.
Conclusion
The 1974 NHS reorganisation, changing service arrangements predominantly for women and children, is considered an unlikely explanation of the improved rate of male mortality decline. Thus, centrally led NHS reorganisation has never had any detectable effect on either male or female mortality and must be considered ineffective for this purpose. But some evidence supporting the view that increased funding improves outcomes is found.
Introduction
Britain’s National Health Service (NHS) aims to improve the health of the UK population both by delivering healthcare to the population that meets individual’s needs without personal cost at the point of access and by action on the causes of ill health. At its creation in 1948, the NHS acquired the mosaic of healthcare services that had evolved, but ensured central funding. Since then it has undergone several, centrally driven, structural and management reforms starting in 1962. Each time, these reorganisations aimed to reduce costs while improving healthcare delivery to patients and thus improving the health of the population. Reforming the NHS is an increasingly costly process and it is therefore important to investigate whether reorganisation improved health outcomes as expected.
This study therefore addresses an essential public health question, at a time when health services are experiencing demands to save money.
Evaluation of the NHS, and its reform, may be carried out in a number of ways. Most commonly, activity levels are used to monitor the ‘success’ of the NHS. So, NHS performance is reported in terms of achieving targets such as increasing numbers of staff, hospitals, beds and equipment, or operational indicators. Such targets were set out by The NHS Plan in 2000. 1 In this way, the evaluation of NHS reorganisation has compared targets such as surgical queues and healthcare activity reached before and after the introduction of an NHS reorganisation. 2
The impact of NHS reorganisation may also be measured using economic evaluation, such as cost-benefit analysis. Propper 3 examined the impact of the internal market reforms by investigating the effect of competition on prices, quality and quantity of production.
More recently, the concept of ‘mortality amenable to health care’ has been developed as a way of assessing the performance of healthcare services. Mortality amenable to healthcare refers to ‘deaths from certain causes that should not occur in the presence of timely and effective health care’. 4 However, this method fails to recognise health system performance beyond specific healthcare interventions, and is thus not conducive to assessing the performance of the health system as a whole. 5
Since preventing premature deaths is a fundamental aim of public health action, this study examines the public health effect of past NHS reorganisation and policy change on mortality in England and Wales over the first 65 years of the NHS' existence. All-cause mortality is used in this study as a marker for the effectiveness of the health service in totality, not just the healthcare component. While not a perfect indicator, it does directly reflect one primary public health aim to prolong healthy life. The use of mortality rates is a long established method of monitoring health systems. Higher mortality rates are expected in less healthy populations with higher unmet health needs.
Since Bunker 6 showed that around half the health gain in the post war period (i.e. throughout the operation of the NHS) is due to healthcare improvements, important changes in the effectiveness of healthcare delivery should detectably alter mortality rates; exemplified by using cancer survival rates (inverse mortality rates) to indicate cancer services effectiveness.
Methods
Timeline of NHS reorganisation
A timeline of NHS reorganisations between 1948 and 2012 was produced using Gorsky’s review of NHS historiography. 7
Mortality and population data collection
Routinely published mortality data and mid-year population estimates for England and Wales, from the Office for National Statistics, 8 were used to calculate directly age-standardised mortality rates (Appendix 1) using the European Standard Population 1976 9 as the reference population. Male and female populations were analysed separately, as factors may affect mortality in the two genders differently.
Data analysis
The data were analysed using the CuSum and Change Point Analysis methods. These Statistical Process Control (SPC) methods are widely used in industry and more recently in healthcare 10 for quality review and assurance.
In view of the known steady secular improvement in 20th century UK mortality, 11 that predates the NHS, the methods were adapted by adopting the least squares regression line as the putative central indicator. Using the deviations from this regression line as the input to both the CuSum 12 and Change-Point Analysis (CPA) sustained changes in the trend of mortality rates are highlighted indicating a sustained change occurring in the effectiveness of the NHS.
The CuSum technique (plotting the cumulative sum by subtracting the mean of all the data from each data point and cumulating these differences 13 ) highlights sustained changes in the data mean (Appendix 2). In this case we plotted the cumulating deviations from the regression line. When the gradient of a CuSum plot shifts for a sustained period of time, this indicates there has been a sustained change in the average mortality rate decline. Since centrally driven changes happen over a short period of time, the change in expected mortality should have been relatively brisk.
CPA methods develop the utility of CuSum methods to detect small changes of both mean and variance by estimating the probability of the occurrence of a sustained change. Taylor’s method 14 is novel, using a combination of CuSum plotting and bootstrap methods. While not commonly applied in the medical field, it is used by the Centers for Disease Control and Prevention (CDC) in their BioSense programme, a system designed for early detection of symptoms caused by bioterrorism. 15 A total of 10,000 bootstrap samples are generated by random reordering of the original data. The CuSum of each bootstrap is calculated. If no change has occurred, the bootstrap CuSums mimic the original CuSum. However, if the magnitude of change occurring in the bootstrap samples is less than the original CuSum, it can be said that a change has occurred. 13 For this study, Change-Point Analyzer Software was used. 16
Results
A timeline of NHS reform and reorganisation
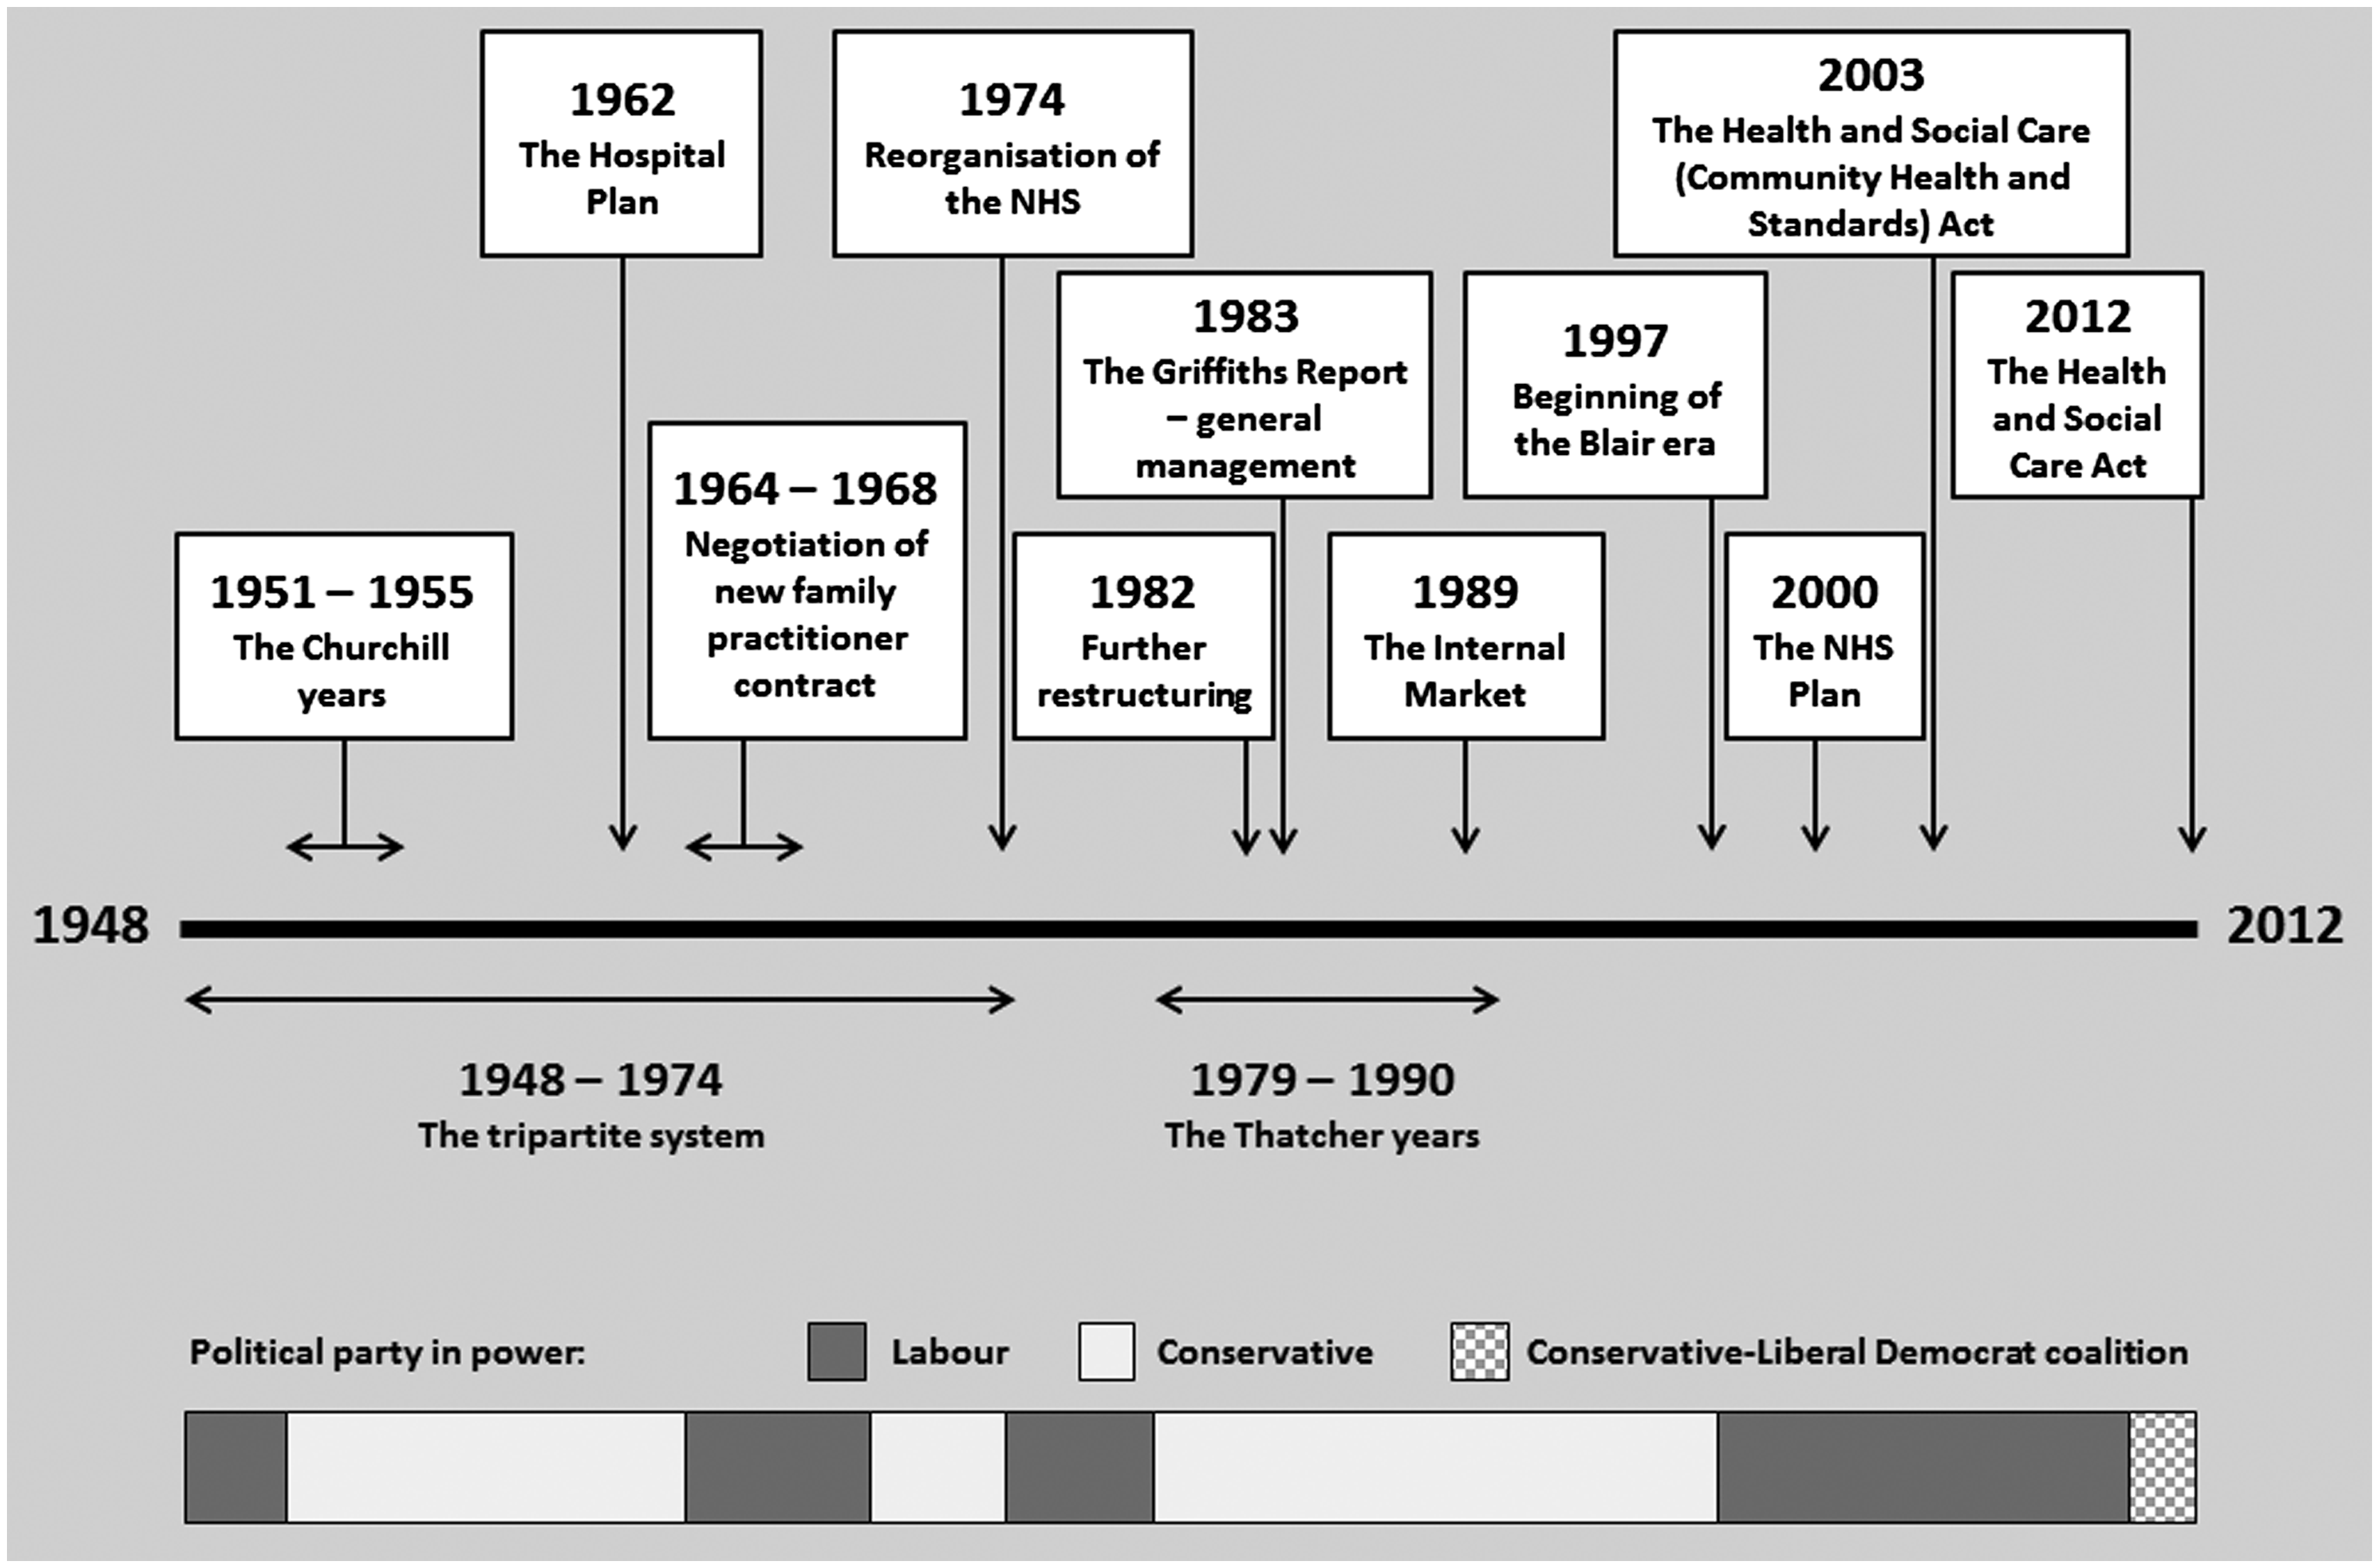
Figure 1 shows the timings of the major policy changes and reforms of the NHS between 1948 and 2012. The bar along the bottom shows how the political party in power changes at each point in time as an indication of the prevailing political view.
A timeline of NHS reform and reorganisation, 1948–2012. (Derived from Gorsky
6
.)
Analysis of female mortality
The plot of age-standardised mortality rates against year for the female population is shown in Figure 2. As expected, the age-standardised mortality data appeared to follow a constant downward trend, thus a single linear regression line fitted the data well.
Female age-standardised all-cause mortality rates, England and Wales 1948–2012.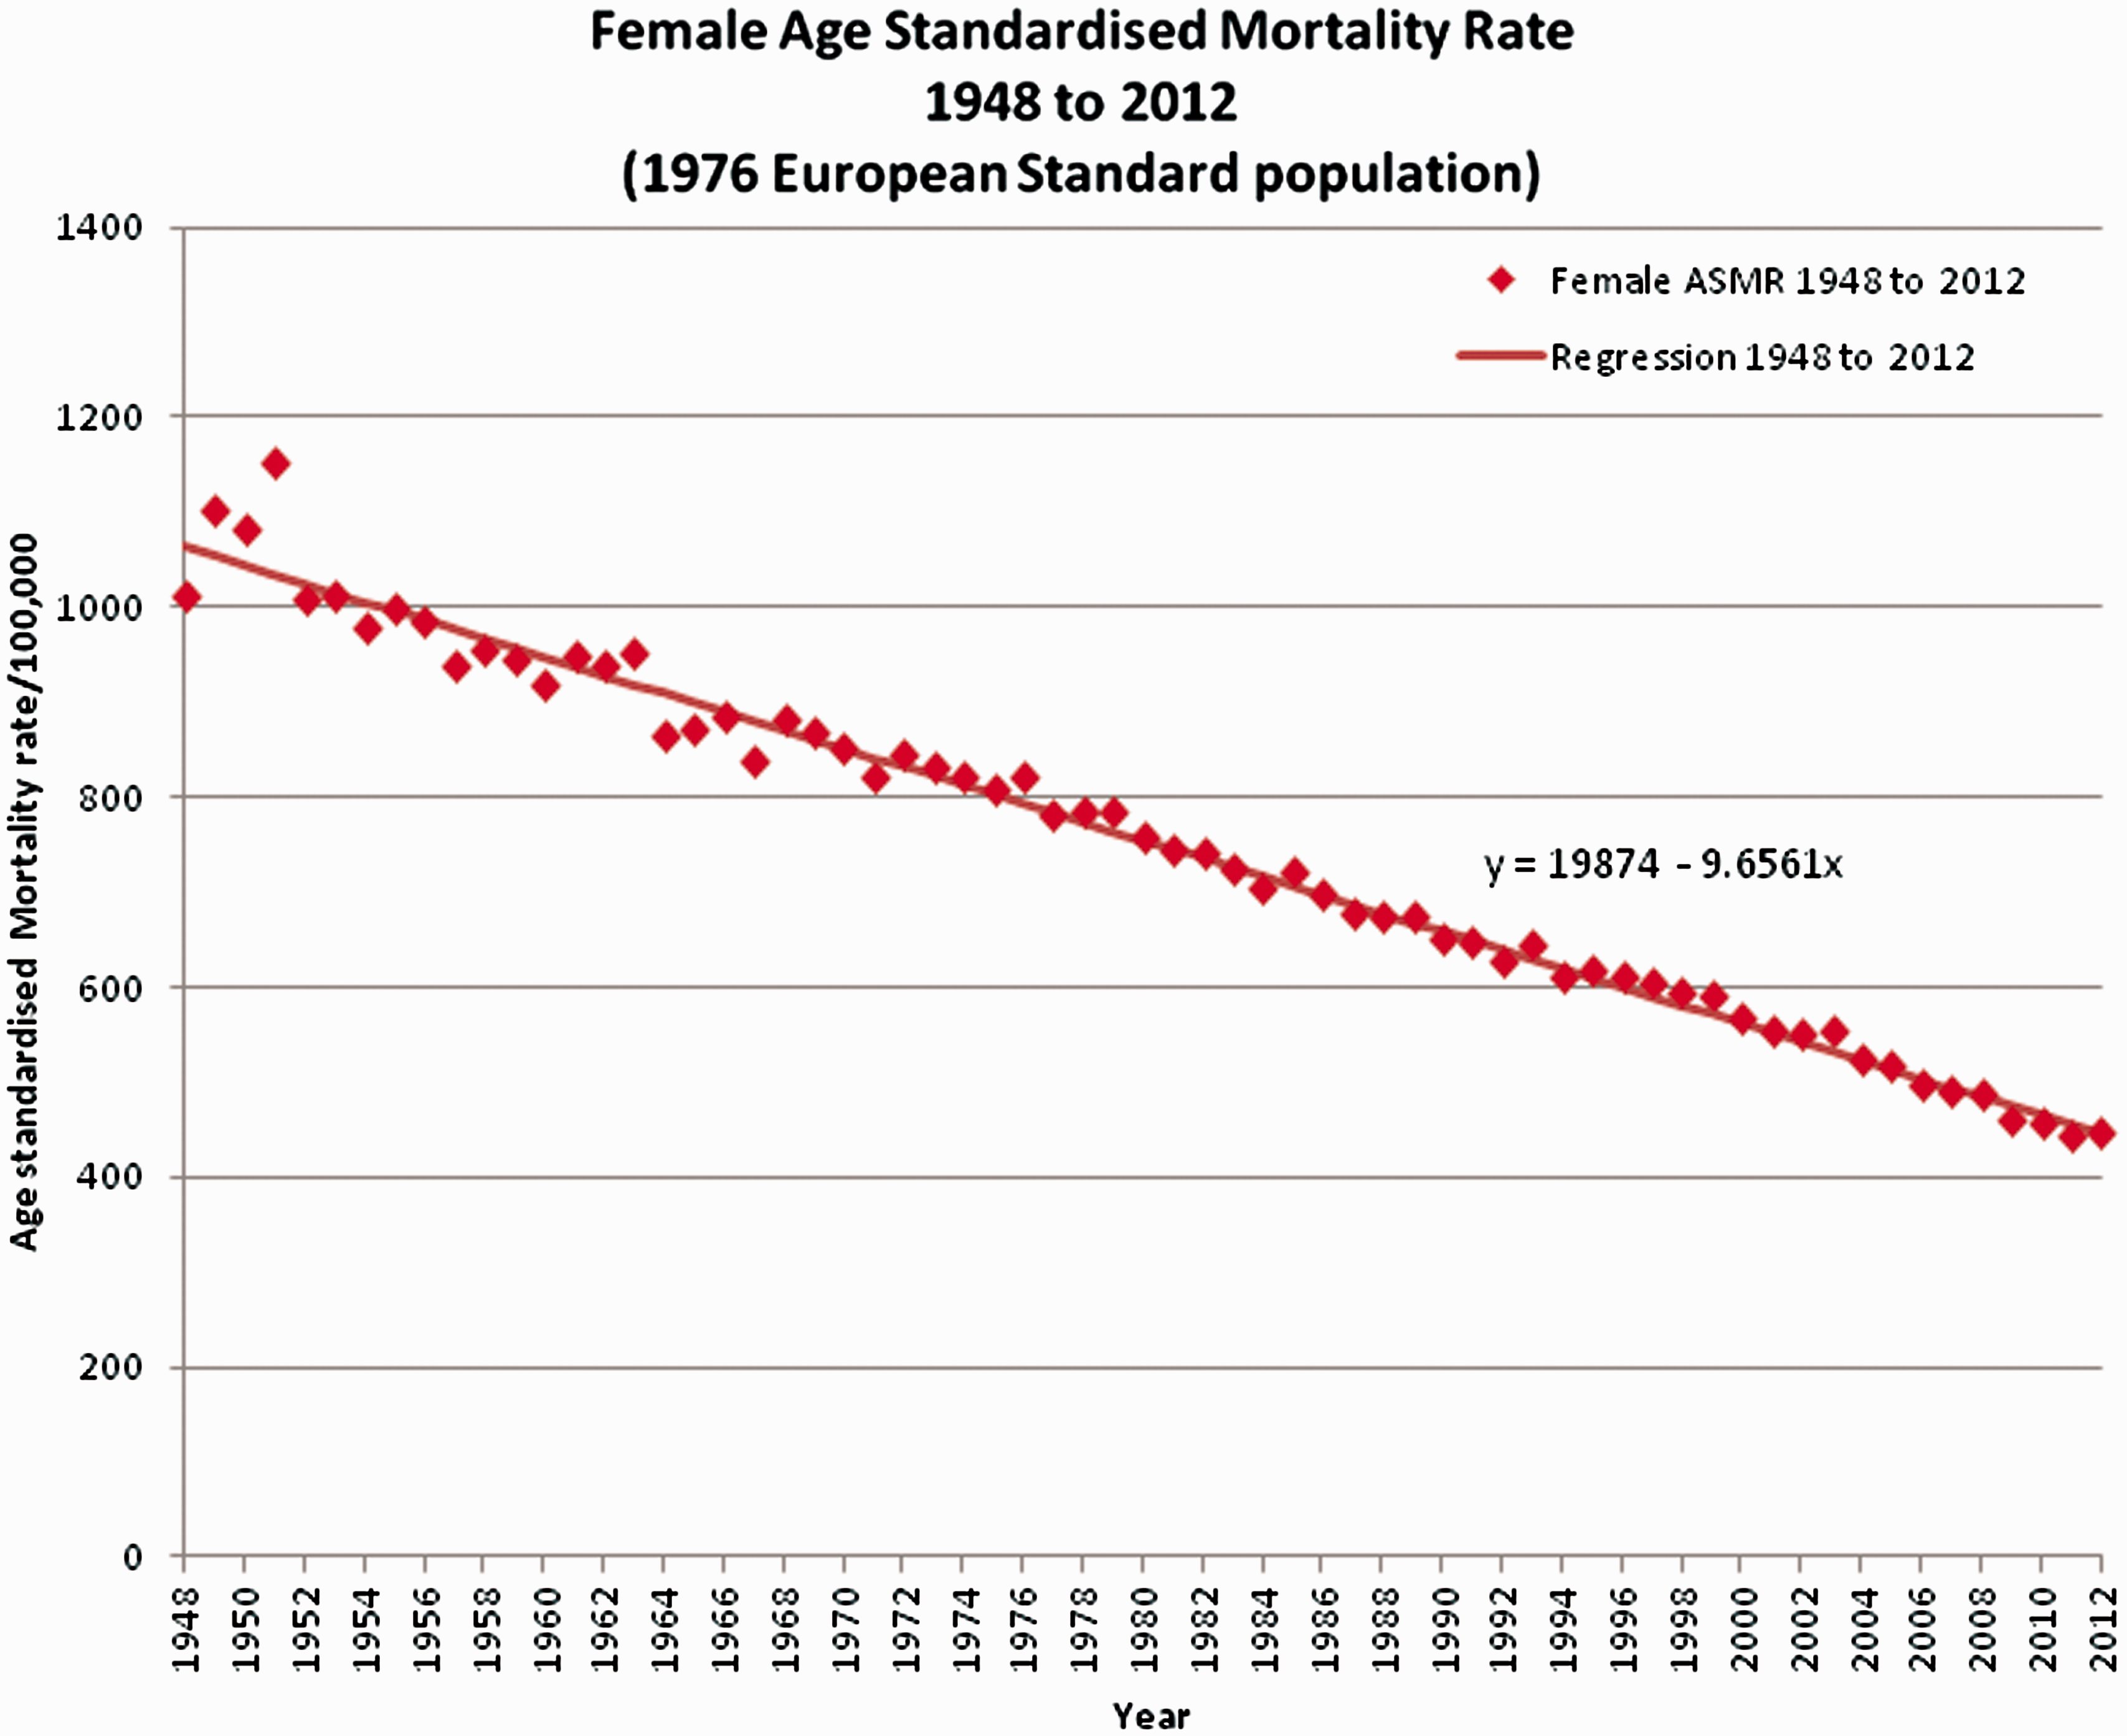
Visual review of the CuSum (Figure 3) shows no sustained change from the general trend, though a wave-like variation with a periodicity of about 35 to 40 years is suggested.
Female age-standardised all-cause mortality CuSum, England and Wales 1948–2012.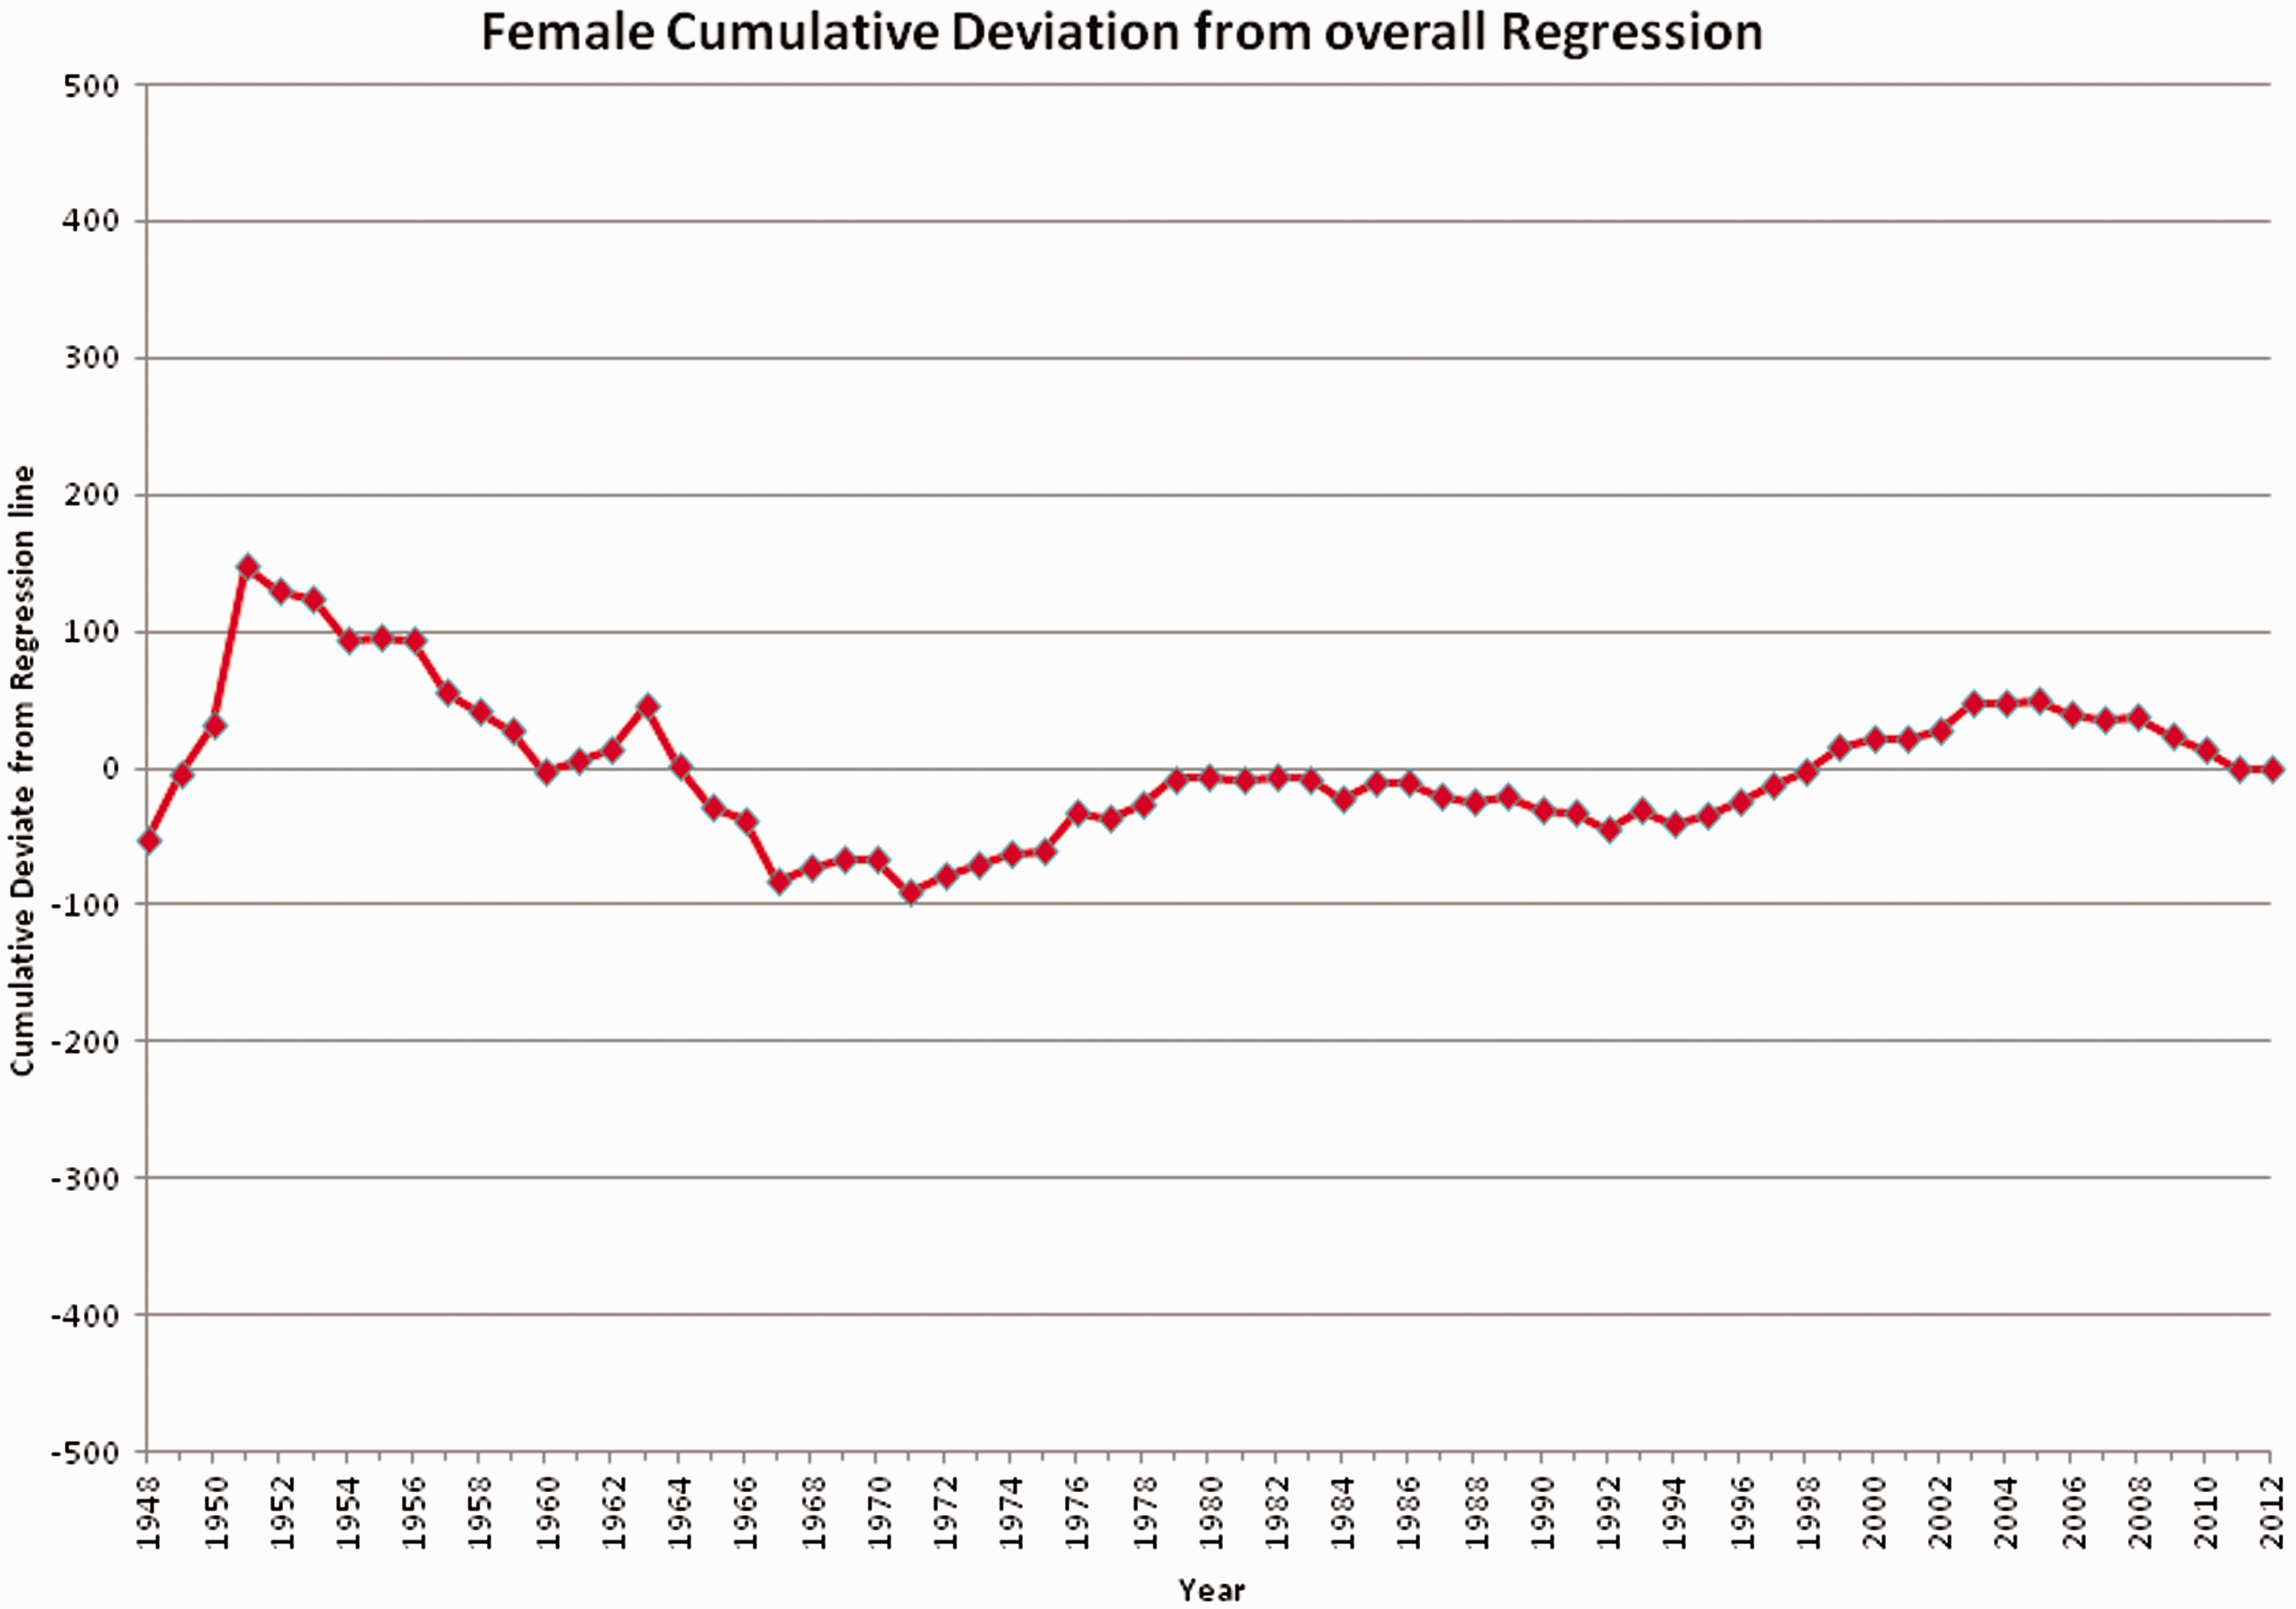
Change point analysis confirmed, at a 95% confidence level, that no sustained change in the rate of female mortality decline could be detected. After 10,000 bootstraps, no significant change was detected in either variability around the regression line or deviation from the regression line of age-standardised mortality rates.
Analysis of male mortality
The single uniform secular improvement assumption was invalid for male mortality. Linear regression was therefore applied to two subsections of the male mortality data, as shown in Figure 4. An initial regression line was fitted to the first 21 data points, 1948–1968, to set an expected level of mortality. The deviations from this regression were calculated for the full set of data, 1948–2012 (Figure 5).
Male age-standardised all-cause mortality rates, England and Wales 1948–2012. Linear regression applied to subsections. Male age-standardised all-cause mortality CuSum, England and Wales 1948–2012. (Regression Base 1948–1968.)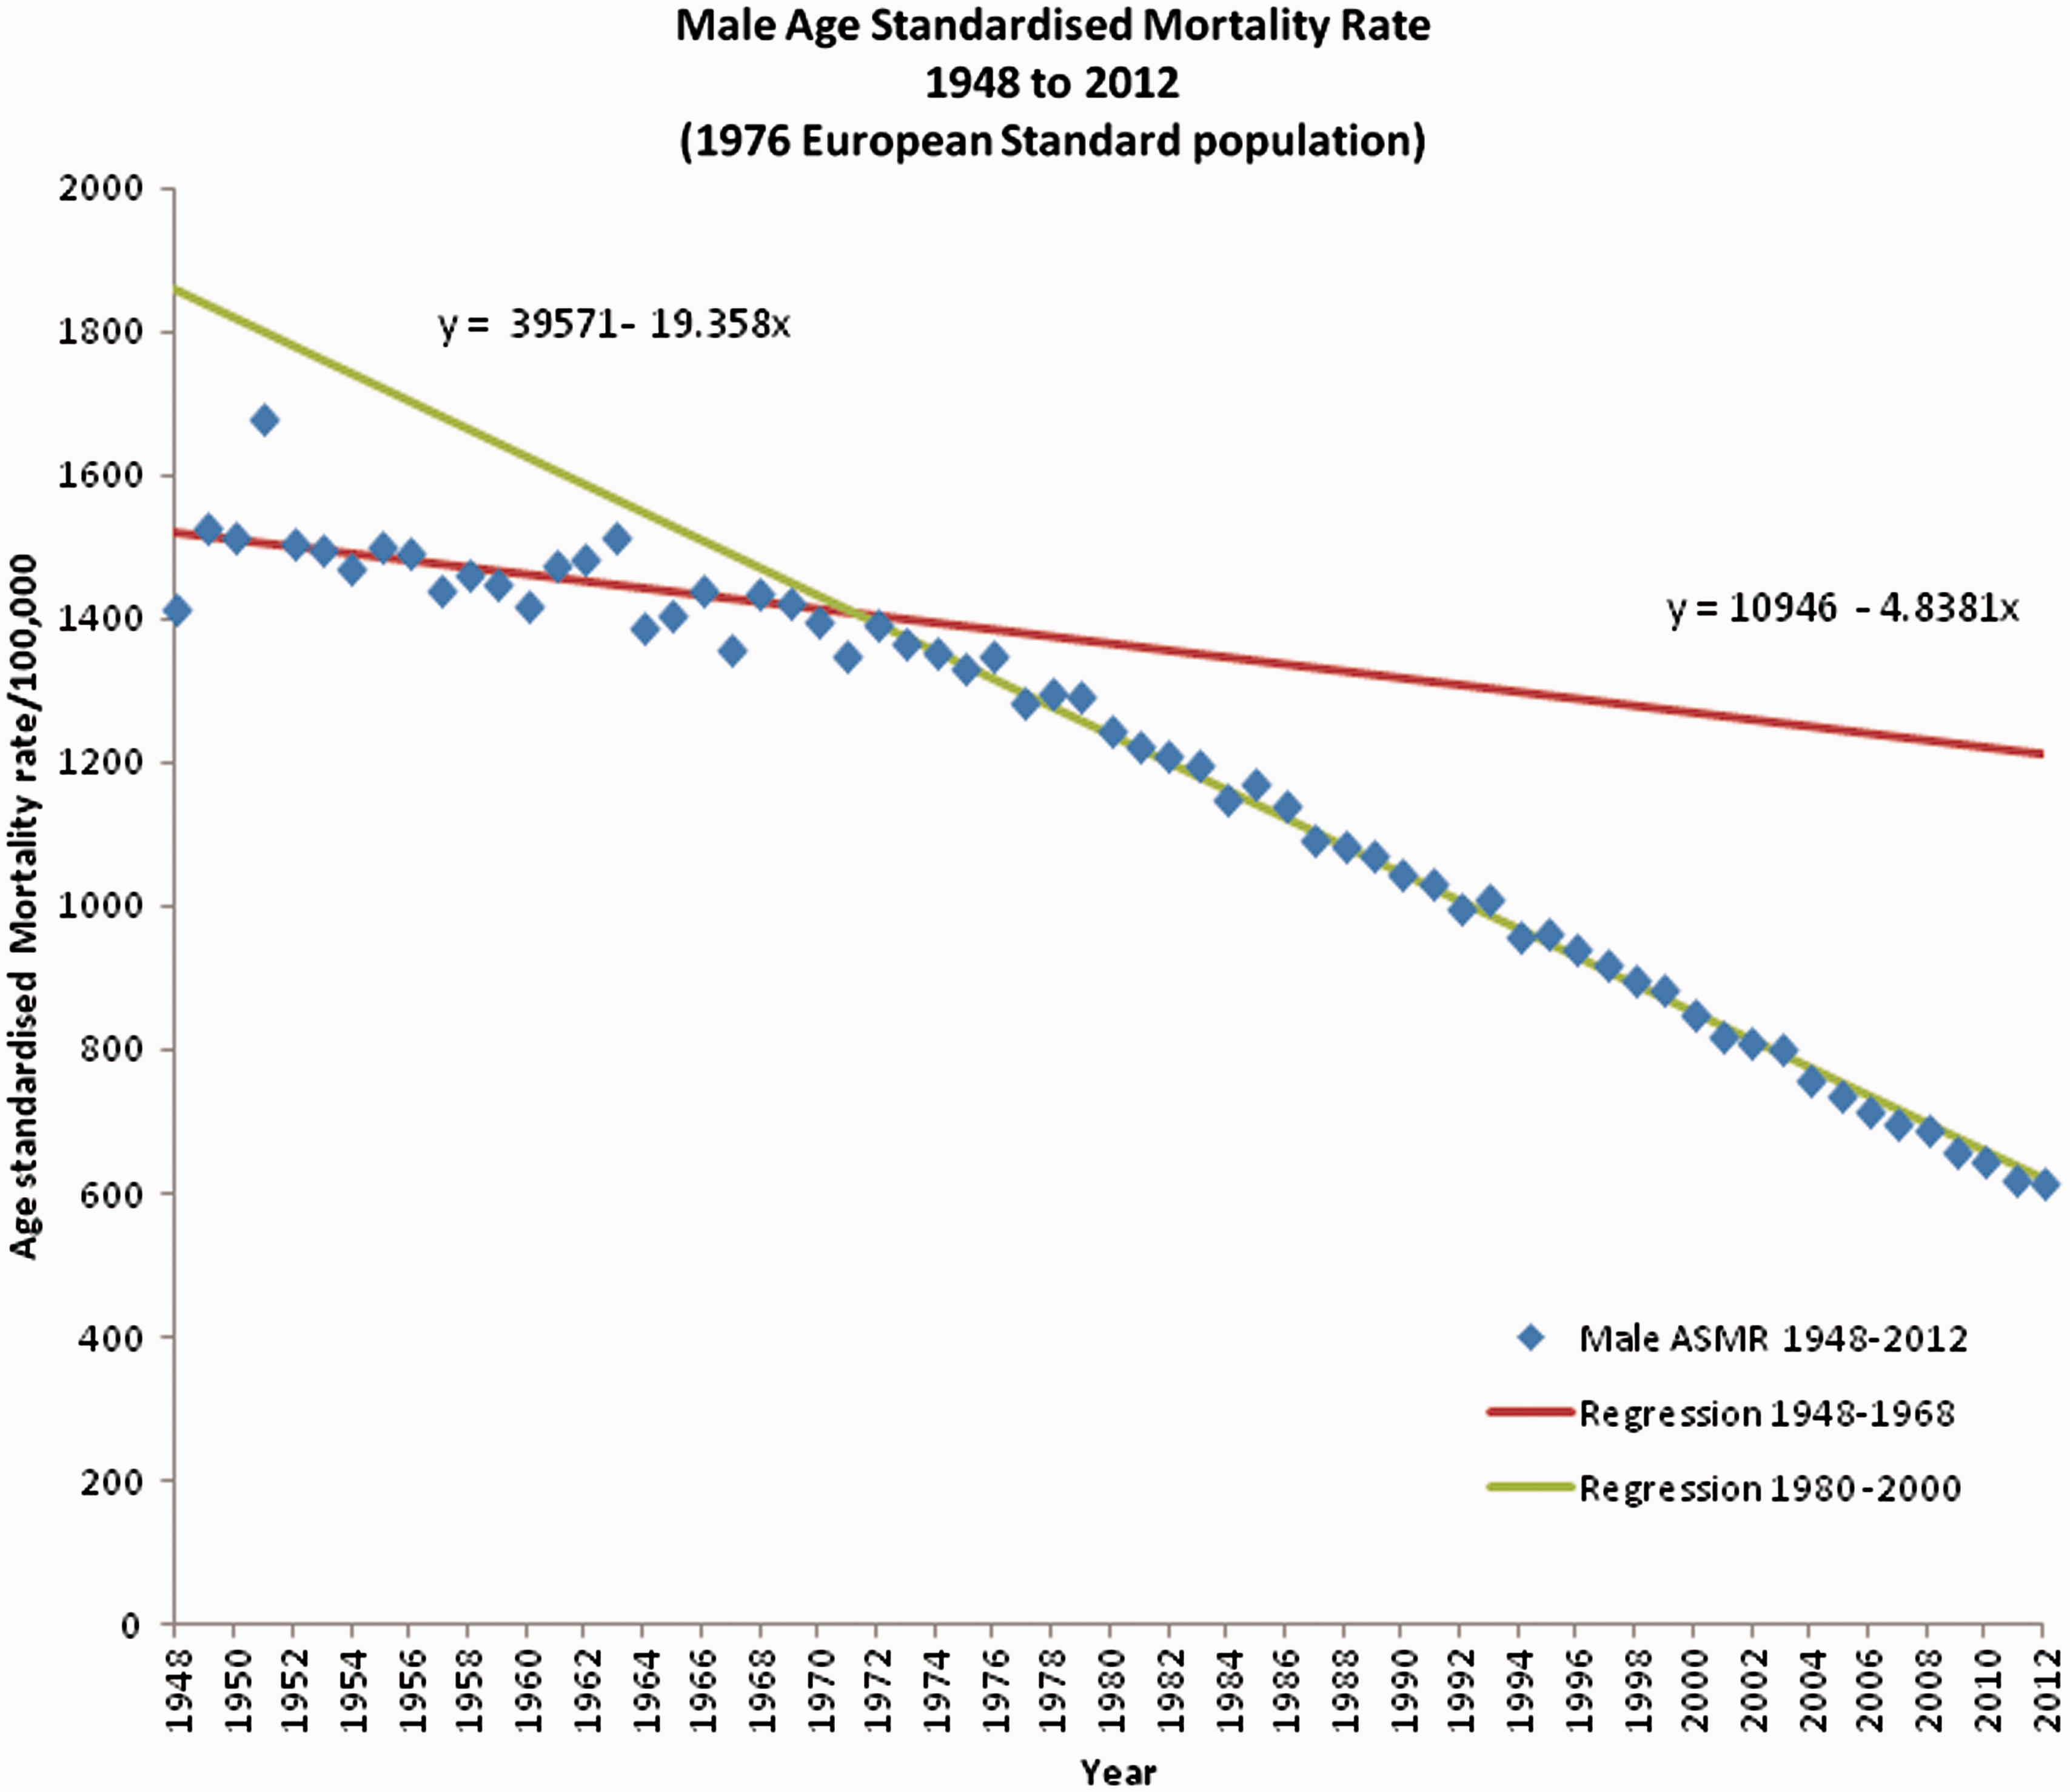
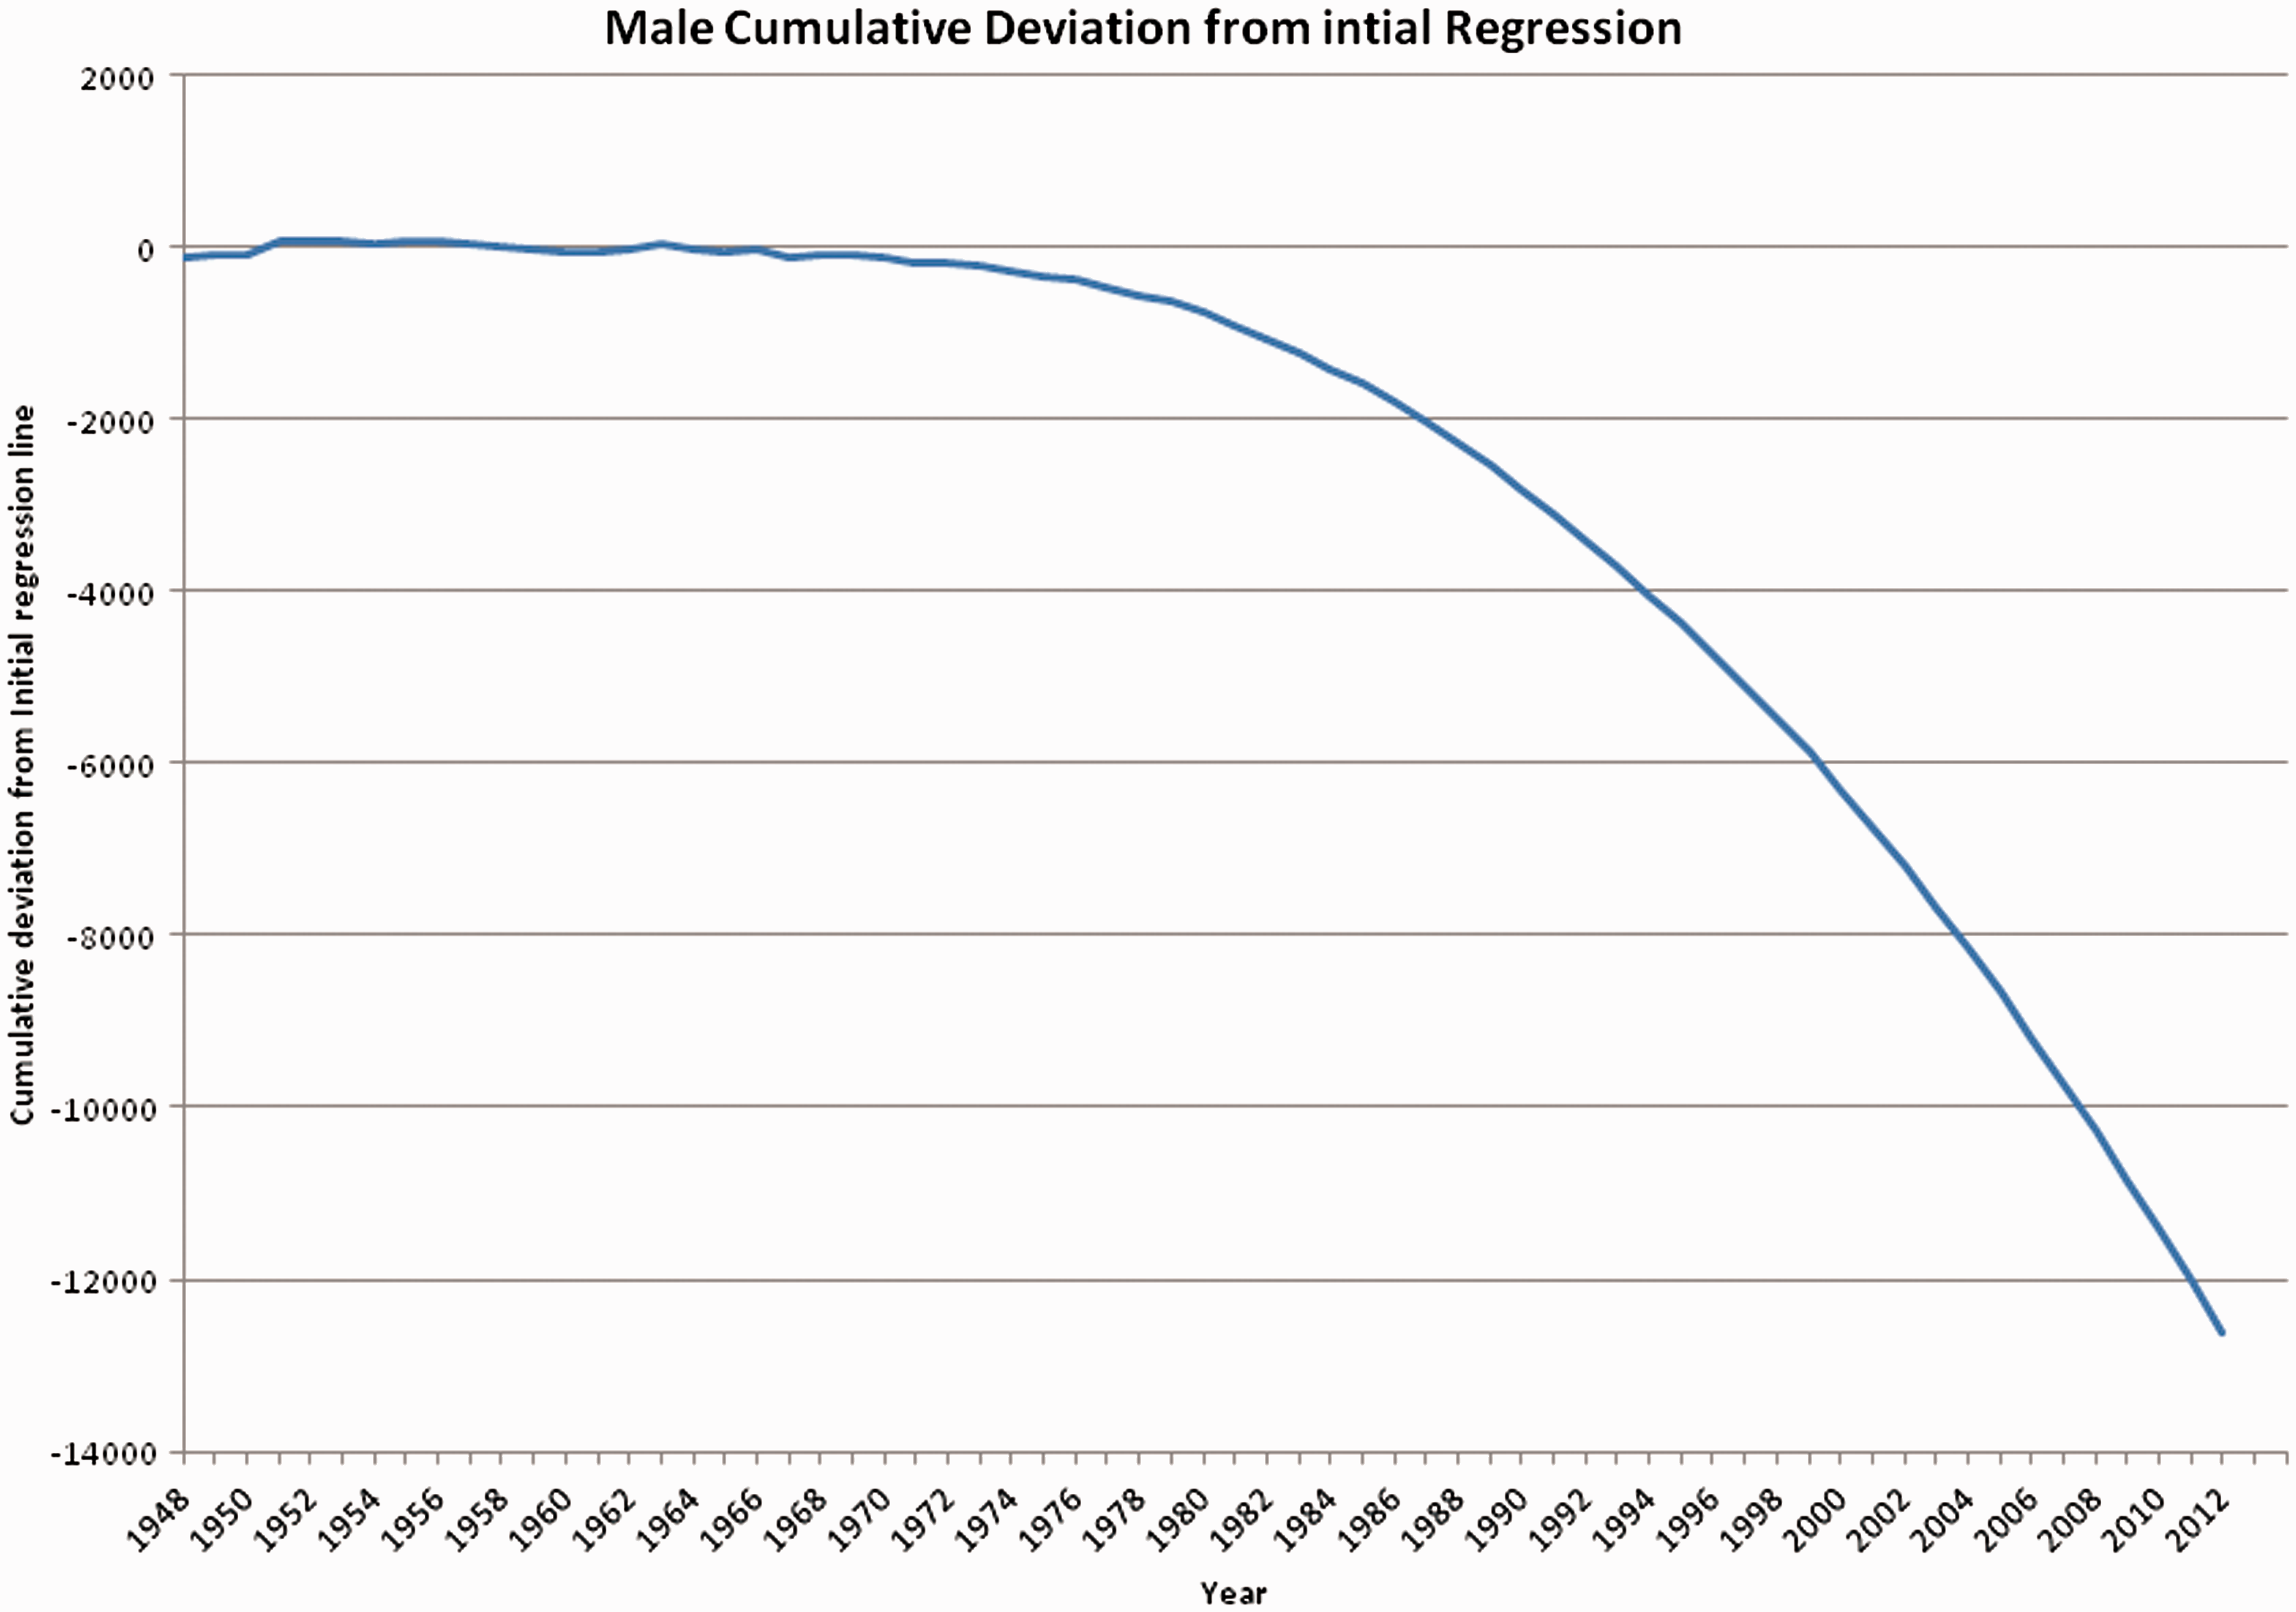
Visual review of the CuSum plot indicated that a change in the trend occurred early in the 1970s. In addition, the chart suggested that the decline was sustained from the 1980s onwards. It was therefore assumed that a change happened in the mid-1970s, and was established by 1976. A second regression line was fitted, this time to the final 21 points in the 20th century, 1980–2000. Using this regression equation, the mean deviation from this regression line was calculated and this was then used to plot the CuSum from after this reset point forward, 1976–2012 (Figure 6).
Male age-standardised all-cause mortality CuSum, England and Wales 1976–2012. (Regression Base 1980–2000.)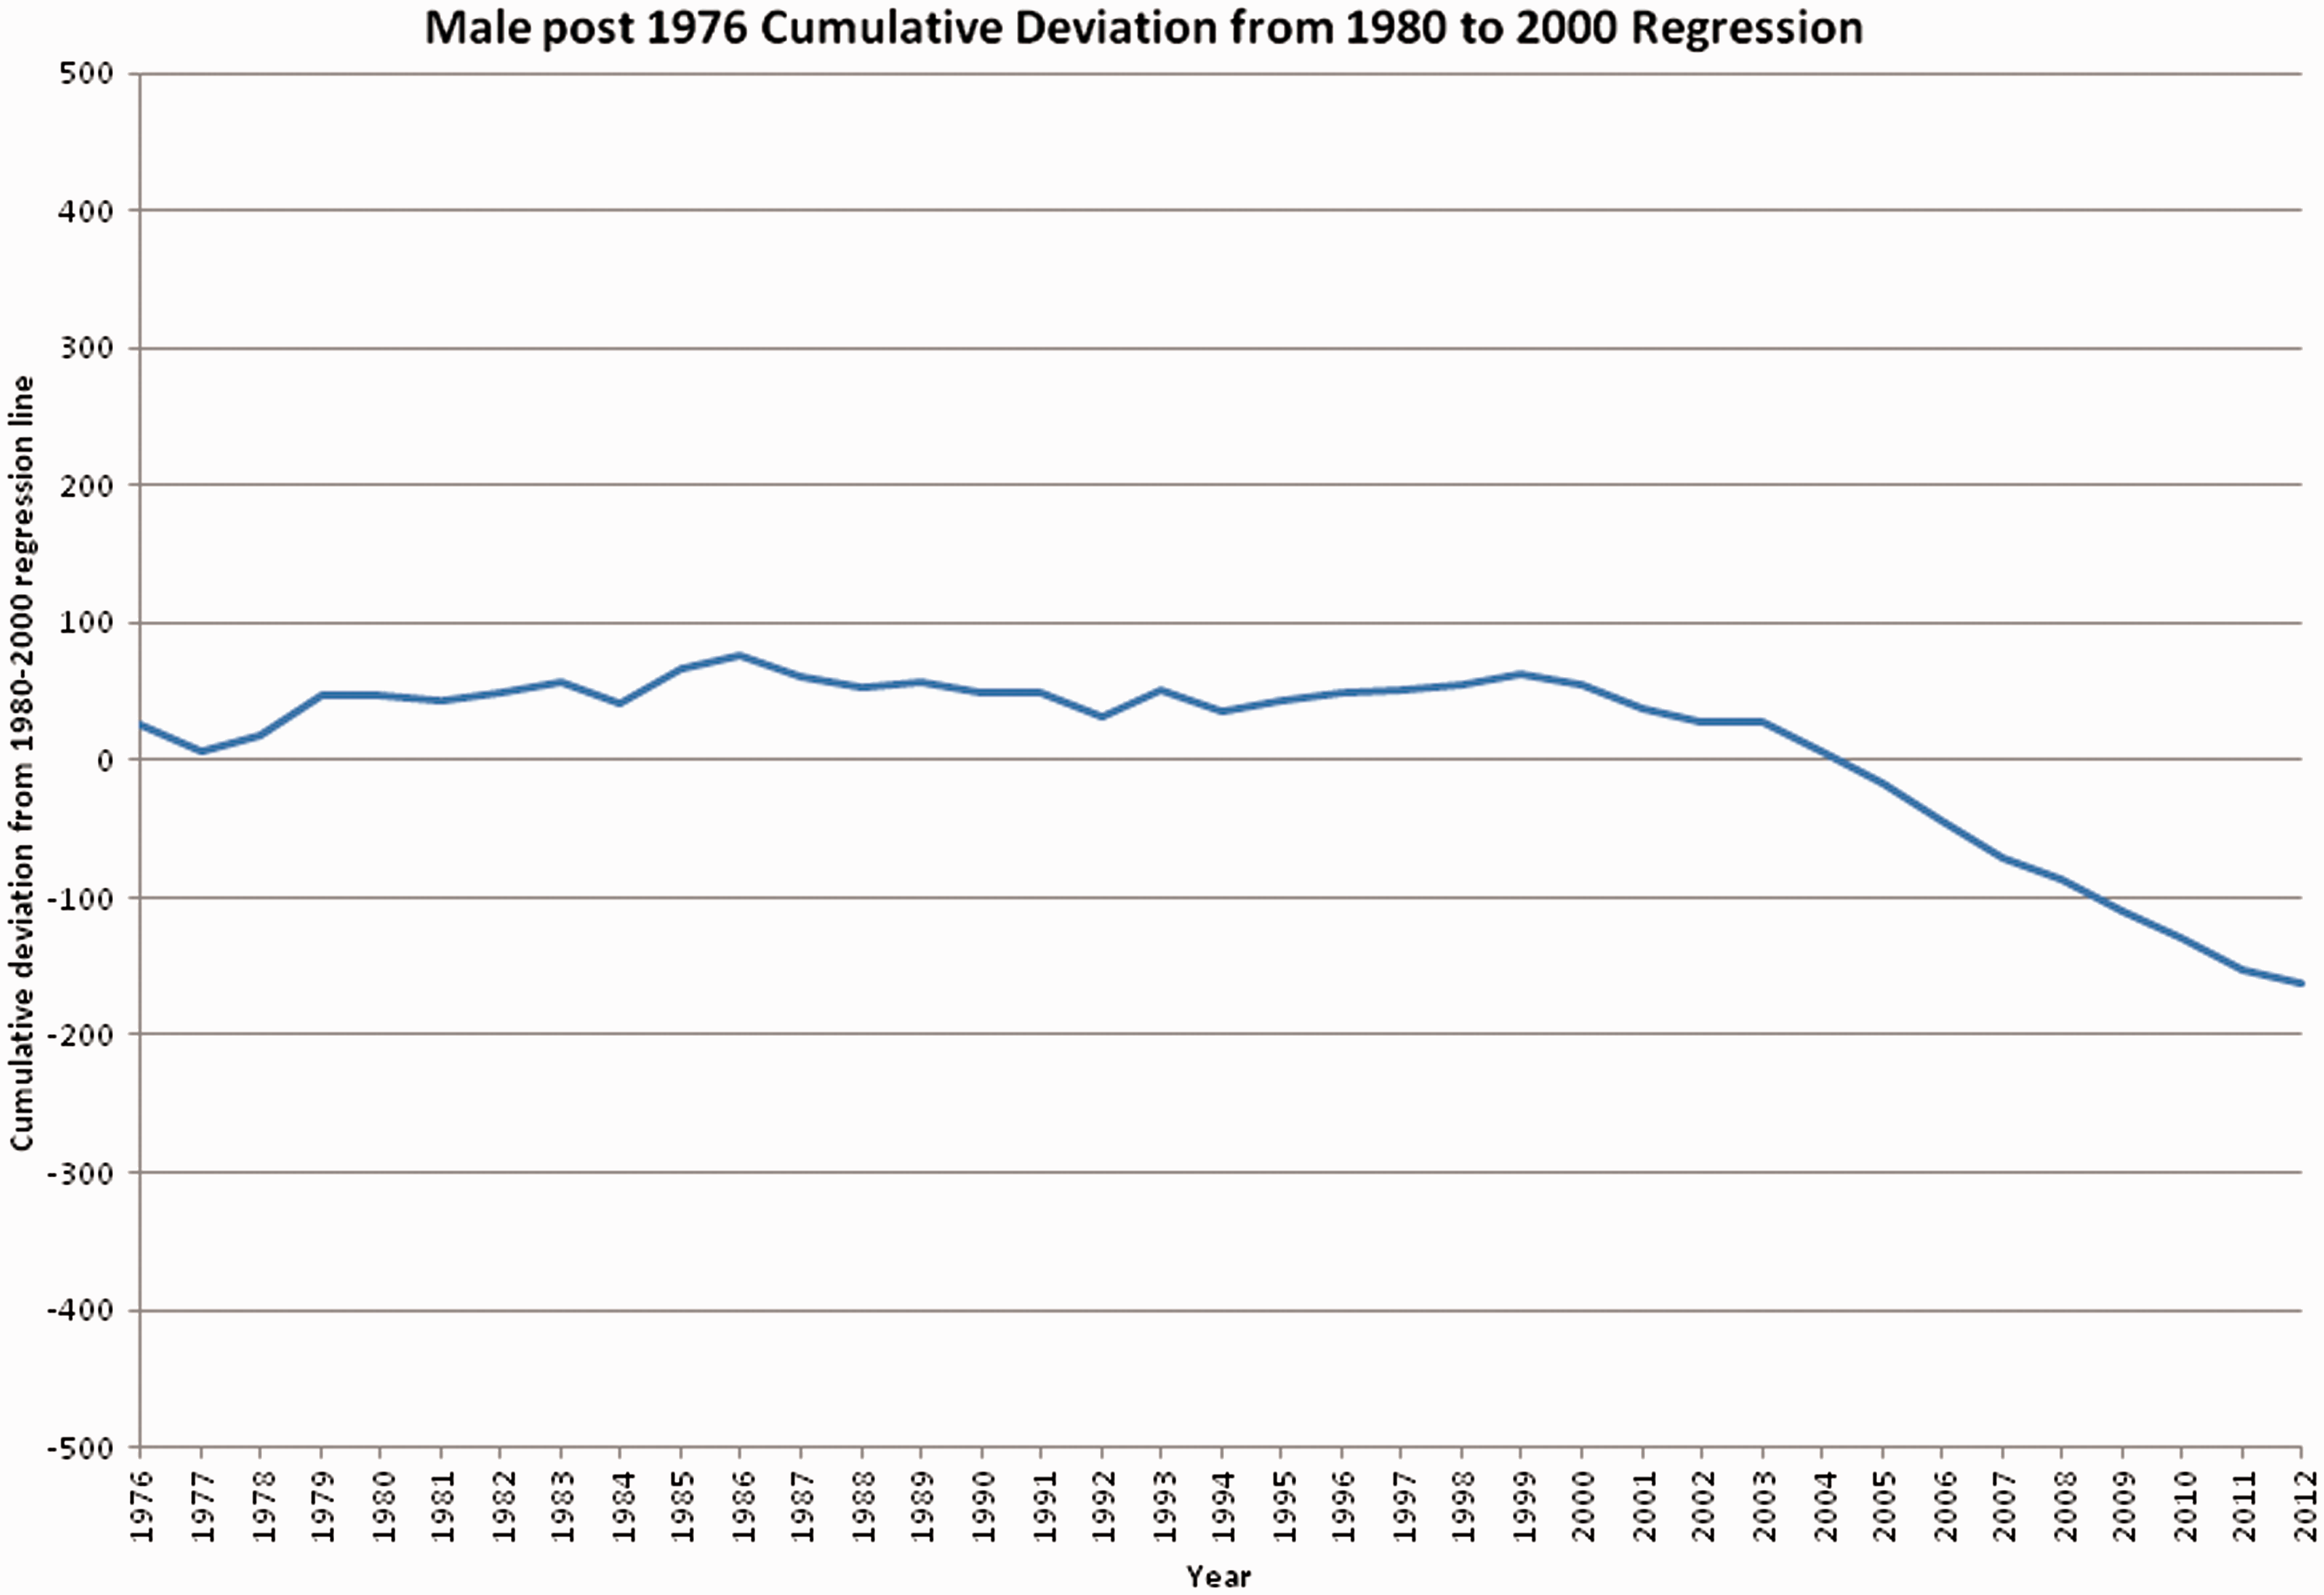
Taylor’s CPA indicates, at a 95% confidence level, that there was no significant sustained change in both rate of decline and variability in male mortality between 1948 and the mid-1970s. However, after 1977 the change in rate of decline is so extreme that the CuSum ‘runs off the chart’ due to a shift in the mean rate of improvement. 13 The CuSum requires resetting from 1976. The second analysis, for the time period 1976 to 2012, shows no significant deviation from the regression line, at a 95% confidence level, until 2000 when an improvement occurred. This improvement suggests the Mean ASMR had been lowered by around 19.9 male deaths/100,000 per annum, with a 99% confidence. The data is tabulated in Tables 1 to 3 after Appendix 2.
Summary
These analyses show no sustained change in female mortality decline since 1948, suggesting that NHS reorganisation failed to improve female mortality over that which can be attributed to both general health measures and continuing improvements in healthcare. However, male mortality decline underwent a sustained improvement during a short period in the mid-1970s and again in the new millennium which was sustained until 2012. This suggests that in the early 1970s something changed which improved male health, but had no impact on female health. Similar arguments apply to the changes observed in 2000.
Discussion
The National Health Service Reorganisation Act 1973, 17 effective from 1 April 1974, was the first major reorganisation of the NHS since its beginning, designed to improve efficiency and effectiveness. Prior to 1974, the NHS was based on a tripartite system, divided into three separate areas comprising hospital care, primary care and community services. The 1973 Act abolished the tripartite system; instead all health services came under the control of district health authorities and local family practitioner committees. So the link in time might indicate a causal effect. However, the major effect of the 1974 reorganisation was to bring maternity and childcare into the NHS. Thus it is unlikely to have had an effect on male mortality alone, since services affected were predominantly aimed at women and children. Are changes in society outside the NHS more likely explanations for the improved reduction in male mortality?
Likely candidates include the Health and Safety at Work Act 1974. 18 This act aimed to improve safety and working conditions particularly among heavy industrial occupations such as mining, fishing, manufacturing and construction; the types of work with the highest fatal accident levels and which employed a predominantly male workforce. The Health and Safety Executive 19 report an 82% reduction in fatal injuries to employees in the workplace since 1974. The timing of the Act is strongly associated with the change found in this investigation. Hence the Health and Safety at Work Act could plausibly account for some of the sustained improvement in male mortality seen since the mid-1970s.
In addition, the UK entered a period of economic and industrial decline in the early 1970s. This was accompanied by a growth in the service sector. The reduction in the heavy industrial sector employment 20 is likely to have been coupled with a reduction in fatal injuries in the workplace and the adverse health effects of heavy industry on employees.
The 1970s also saw a rapidly changing attitude towards cigarette smoking: an increase in anti-smoking campaigns, a variety of bans on cigarette advertising, widespread public education about the health effects of smoking via television documentaries and health warnings on cigarette packs. 21
It is probable that all these changes (the Health and Safety at Work Act, the change in the industrial landscape and the attitude towards cigarette smoking) combined to affect the changes seen in the male mortality trend, as they impacted on men more than women.
As well as considering periods of change in mortality trends, periods of no change are equally informative and should be addressed. The NHS entered a long period of continual reformation and restructuring from 1974 onwards. The Griffiths report in 1983 22 which introduced general management into the NHS, and the 1989 market reforms, are two major changes that were intended to better services and to benefit population health. However, analysis of mortality for this period, 1976 to 2012, showed no significant deviations from the long-term trend for women. For the male population there was a sudden and sustained improvement in the mortality trend in 2000 when an increase in healthcare funding was made available, but no reorganisation. The data demonstrate that no improvement in mortality reduction has arisen from this lengthy period of reform. This is strong evidence that the belief that management reform improves health service delivery and population health is false.
Strengths of the study
Mortality is a hard epidemiological endpoint which is easy to measure, and is a universally accepted marker of health in the population. As the ONS – a respected independent source with a long record of providing reliable population statistics for England and Wales – publishes the data used in this study, it is unlikely that these data were biased.
The analytical tools used in this study, while unusual in the healthcare domain, are widely accepted in industrial practice, where they are found to be both useful and reliable. The changes in outcome measures are taken as a measure of the quality of the health-care process. In this case by assuming the health system aims to create a steady improvement in mortality, any change in the organisation of the system that alters this rate would be detectable by changes in outcome. So it is reasonable to apply these methods in the current context.
This method should detect a sustained change of about half a standard deviation in the standardised mortality rate, about 12 deaths per 100,000 annually or an improvement in outcome of about 0.5%. Since outcome improvements of greater than 10% are currently being sought, the change detectable by our methods must be considered trivial by policy makers.
The study data start with the foundation of the NHS. Thus it only considers all-cause mortality since the NHS as a comprehensive health system has been in place. Extending the study to earlier years (including two world wars with the population being blockaded as a tactic as well as direct attacks on civilians), would have weakened the focus of the study.
Weaknesses of the study
The method for age-standardising mortality rates, though widely accepted, uses the mid-year population estimates as a marker for the population at risk. However, mortality is measured at the end of each calendar year, thus producing an endpoint difference between the estimation of population and mortality. Despite this, the daily variation in mortality for England and Wales is small in comparison with the overall population. Age-standardising is therefore unlikely to produce biased rates.
Relationship and context to current literature
Remarkably little research has been conducted into the health effects of NHS reform. The National Health Service Reorganisation Act 1973 was criticised for its addition of multiple tiers of administrative decision-making 23 and the increased administrative costs that resulted. However, its effect on the health of patients appears not to have been addressed.
The literature surrounding NHS general management is predominantly focused on either the cost of implementing management, 23 or issues surrounding the efficient functioning of the managerial system. 24 The Griffiths report 22 recognised the need for more stringent monitoring of health outcomes. Despite this, the relationship between management and health has not been studied in great depth.
The essential aims of the 1990 market reforms were to decrease costs and increase quality. While quality of care and efficiency have been examined in the literature, 25 the impact of the market reforms on health is under-researched. This is in part due to the failure of the government to set in place official monitoring systems. 26
Implications for policy and practice
A common theme each time reform is implemented is the absence of systems to monitor its progress and effectiveness. Governments are reluctant to set in place such provisions. Kenneth Clarke, when Secretary of State for Health, ‘denied the need for formal monitoring and evaluation and expressed the view that calling on the advice of academics in this way was a sign of weakness’. 27 The recent Health and Social Care Act also fails to acknowledge the need for such evaluation. As the NHS enters a new period of reorganisation, it would seem sensible to implement evaluative systems alongside the changes. In this way, the impact of the changes would be clarified.
As reorganisation involves multiple changes across a large range of NHS sectors, and can be measured using a variety of different variables, the net effect is difficult to measure. 26 The director of policy at The King’s Fund states that ‘any research evaluation will have to be flexible and iterative tracking the reform process in real time in a variety of different contexts’. 28 The current study uses SPC methods to investigate the effect of historical reorganisations on population mortality. SPC methods are both flexible and, as this study demonstrates, are more usually used to highlight changes in real time. So this study proffers one possible approach for monitoring the effects of the current changes.
Conclusion
This study provides strong evidence that all the changes made to NHS management and structure, between 1948 and 2012, have had no sustained effect on mortality. This indicates that major NHS reorganisations have minimal impact on male or female population health. However, major increases in funding, while not having much impact on female health, appears to improve male outcomes.
Since the increased expenditure associated with each reform has not improved outcomes, the efficiency of the service must have reduced with each. Therefore, politically led management changes to the NHS seems to be a wasteful ineffective practice.