
Abstract
U.S. cities experienced a sanitary revolution during the nineteenth and early twentieth centuries. The abandonment of cesspools, privy vaults for waste containment and cisterns, pumps, and shallow wells for water delivery brought about a large increase in living standards. While the gains are impressive, investments were often made reluctantly. Scientific advances clarifying the origins of waterborne illness improved, and filtration plants and universal access to water and safe sewerage offered a solution. Yet few cities made those investments. Only with chlorination, a low-cost purification solution, did rapid adoption occur. These delays came at a large human cost.
Water and waste systems are a crucial but often neglected piece of infrastructure in the United States. A 2018 survey found that 16 percent of U.S. water mains are beyond their usable life and that, on average, a water main breaks every 2 minutes. 1 The situation is also getting worse. The frequency of main breaks increased by 27 percent between 2012 and 2018; in the same period, the break rate for cast iron pipes, which many cities installed 50 to 100 years ago, increased by 43 percent. In its 2021 infrastructure report card, the American Society of Civil Engineers assigned a C- to U.S. drinking water systems and a D+ to U.S. wastewater systems.
This article provides context for this state of neglect by arguing that U.S. water and waste management has a long history of being more reactive than proactive. Throughout the nineteenth and early twentieth centuries, key aspects of water and waste management in U.S. cities often lagged behind changes in scientific, economic, or bureaucratic forces. Initial infrastructure investments typically occurred after a city outgrew its local sources, not before. Cities were also slow to purify their water supplies despite known technological solutions and an improved understanding of the origins of waterborne disease. While U.S. cities ultimately eliminated waterborne disease, delayed intervention was harmful to human health.
The reasons why cities’ water policies were (and continue to be) more reactive than proactive are complex and involve many social, economic, and political factors. The history of how U.S. cities came to eliminate waterborne disease demonstrates that reluctance to act is a reoccurring feature of water infrastructure policies.
Waterborne Disease as a Barrier to Growth
As the U.S. urbanized throughout the nineteenth century, local water sources delivered insufficient quantities or were polluted with industrial or human waste. 2 Human and household wastes were often stored in cesspools and privy vaults, which were not problematic if they were watertight and emptied frequently. However, receptacles were rarely impervious, and when located near underground wells, leaking waste could saturate both the soil and the water supply. This contamination was a common mode of transmission for typhoid fever and other waterborne illnesses. 3 In some cities, rivers and streams provided a convenient place to deposit sewage and industrial waste, in turn contaminating the drinking water for those residing downstream.
Allowing sewage to leech into the water supply left individuals vulnerable to typhoid fever. 4 Typhoid fever is a serious infection caused by the bacterium Salmonella Typhi. At least until the early twentieth century, typhoid fever was caused almost exclusively by contaminated water. Most cases involve a severe fever, with body temperatures reaching as high as 105ºF (40.6ºC). Three weeks after incubation, patients are often delirious and emaciated. One in five victims experiences a gastrointestinal hemorrhage, and the risk of pulmonary complications, such as pneumonia and tuberculosis, is high. Roughly half of all victims experience neuropsychiatric disorders (brain-swelling, Parkinson-like tremors, confusion, or hallucinations). Despite the severity of these symptoms, 90 to 95 percent of individuals survive the initial infection, although recovery can take months, and survivors face an elevated mortality risk that can linger for years.
The available evidence suggests that typhoid fever was widespread. Typhoid’s case fatality rate of 5 to 10 percent means that for every observed typhoid fever death, there were 9 to 19 people who contracted the disease and survived. Werner Troesken scales available mortality data to estimate that 21 to 42 percent of Americans born in the mid to late-nineteenth century would have contracted typhoid fever at some point during their life. 5 This is likely to be a lower bound estimate, as the varied and indistinct nature of typhoid fever symptoms makes it difficult to diagnose. 6
Evolution of Infrastructure Investment
Waterworks infrastructure investments span two key periods of U.S. urban development. 7 Joel Tarr refers to the period spanning 1790 to 1870 as the “Walking City,” a term capturing the idea that cities were compact out of necessity, as most residents walked to work. These cities were quick to feel the strain of population growth. Important technological developments to overcome these challenges include sanitary infrastructure, fire hydrants, and improved construction methods. The “networked city” emerged between 1870 and 1920, as utilities and transit systems became more centralized, with a push to connect households and businesses to these networks. A crucial benefit of networking is its automated service. A reliable supply of water, electricity, and waste disposal paved the way for a wide array of modern conveniences, such as flush toilets, washing machines, refrigerators, modern stoves, and heating. Robert Gordon 8 argues that these urban networks are responsible for a substantial transformation in standard of living that will never be repeated. Networks, and the conveniences that followed, facilitated intense urbanization among the largest cities, and with that came some experimentation with urban form, with the development of distinct business/commercial districts and streetcar suburbs.
Investment in waterworks also occurred in distinct phases. Figure 1 plots the diffusion of waterworks construction by city population in 1900 and the year waterworks were built. 9 The pre-1850 period may be referred to as an experimentation phase, since construction occurs almost exclusively among the largest cities in the United States. After 1850 (an early diffusion phase), the pace of construction increased, but construction was concentrated among large and medium-sized cities. By 1880, nearly every major U.S. city had a waterworks. While there was some investment among small cities and towns starting around 1870, the pace of investment increased dramatically after 1880 (a proliferation phase). Between 1880 and 1897, the share of small cities (populations between 5,000 and 25,000 in 1900) increased from 30 percent to 90 percent. About 10 percent of small towns (populations between 2,500 and 5,000) had water supply infrastructure works by 1880, but by 1897, this figure would increase to roughly 75 percent.
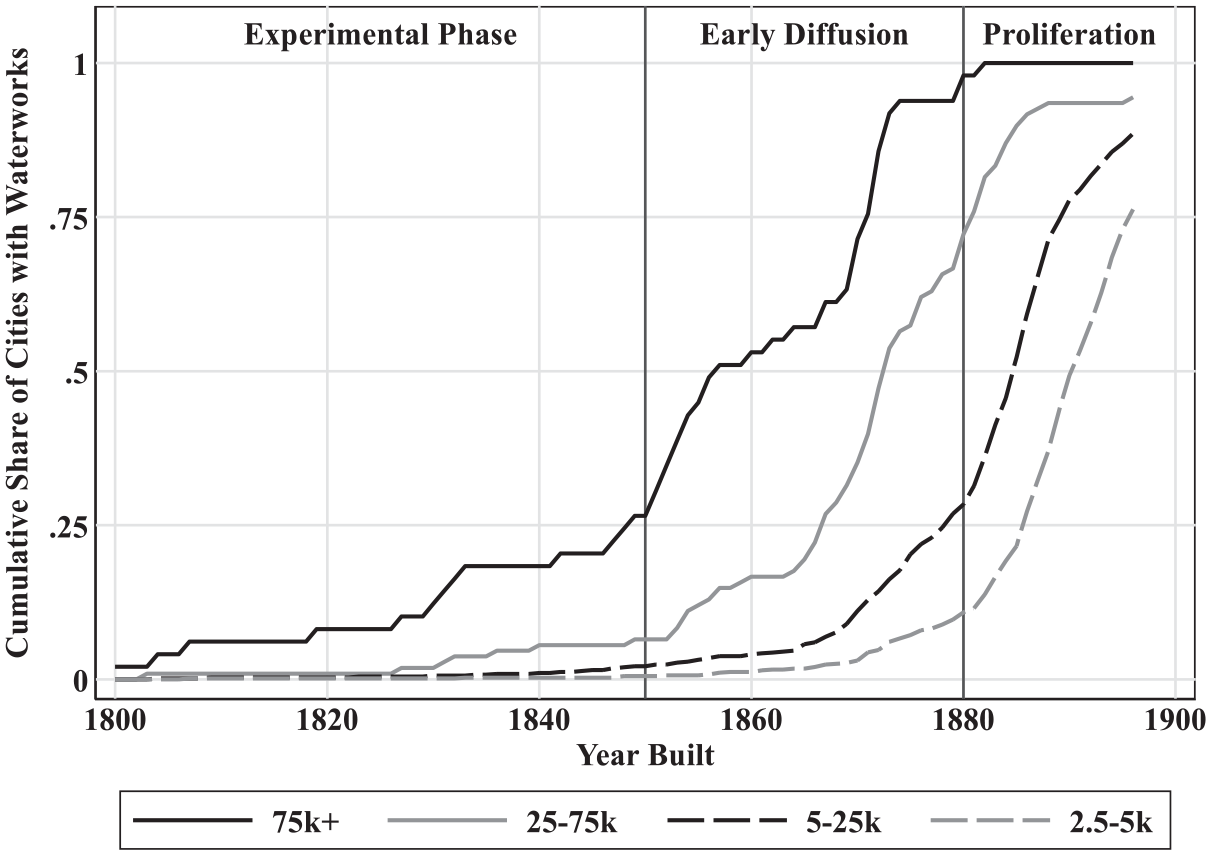
Diffusion of waterworks construction by city size in 1900.
Experimental Phase (1800-1850)
During the experimental phase, the fifty largest U.S. cities were the ones building waterworks. This is understandable. Despite a more limited understanding of the causes of waterborne disease, many recognized when their water and sewer infrastructure was inadequate. Philadelphia offers a paradigmatic example. Yellow fever ravaged the city in 1793, killing an estimated 5,000 residents, with another 20,000 fleeing the city. These numbers are substantial: the 1790 census records Philadelphia’s population as 44,096. Yellow fever is spread through mosquito bites, although Carlos Finlay would not present his mosquito-vector hypothesis until 1881 and it would take another 20 years before Walter Reed’s work confirmed Finlay’s theory. Thus, in 1793, when the prevailing wisdom was that disease originated from foul air, it was suggested that cleansing streets, houses, and clothes would help protect against yellow fever. This required an abundant supply of clean water, as judged by clarity and smell. Philadelphia rose to this challenge and became the first large city to build a municipal waterworks in 1801. 10
Bringing water into the city required finding solutions to several technological hurdles. Most cities looked to transport water from an unpolluted source. If a city was lucky, their identified source would be at a higher elevation and the water could be fed by gravity. If this was not the case, then a typical solution involved pumping water into a storage tank, at which point it could then be fed by gravity. Finally, it was necessary to build mains that could transport water throughout the city without rupturing from the pressure.
Early adopters achieved mixed results. Philadelphia’s 1801 waterworks relied on two steam engines to pump water from the Schuylkill River into wooden tanks, which fed water through a network of wooden mains with gravity. Problems with this design appeared immediately. The engines were expensive to run and frequently broke down. When one engine broke down, the supply of water was often shut off completely. Even when the engines were running, the supply was often inadequate. Growing frustration motivated Philadelphia to build a replacement waterworks. Philadelphia’s second waterworks, The Fairmount Waterworks, was more successful, opening in 1815 and continuing to operate until 1909.
Technology was not the only experimental area. Aaron Burr founded The Manhattan Company in 1799 and received the exclusive right to supply water to New York City. The company’s charter allowed for surplus capital to be used for banking transactions, which was Burr’s primary interest. Instead of bringing water from outside the city, the company dug a series of wells and used remaining funds to start the Manhattan Bank, which became Chase Manhattan Bank in 1955 and J.P. Morgan Chase in 2000. New York City continued to suffer the consequences of poor water quality for several decades. Around 1830 it was recognized that the Croton River offered a solution, but transporting water into the city was an engineering feat involving a dam and a 41-mile aqueduct. Croton River water arrived in the city in 1842, but even then, health improvements were limited because many households felt the costs of connecting to this source outweighed the benefits. 11
While New York City is an extreme example, cities experimented with administrative arrangements throughout the nineteenth century. Toward the start of the twentieth century there was a push for waterworks to be a public enterprise. New waterworks were increasingly likely to be publicly owned, and existing private works were municipalized en masse between 1890 and 1920.
Scientific Advances and Early Diffusion (1850-1880)
Around 1850, key components of the supply chain were more established and technological innovation started gaining momentum. 12 The first water mains were constructed out of bored wooden logs, which were difficult to work with and prone to leaking. Iron pipes were preferable, but they were expensive to import. Domestic suppliers gradually appeared, and after 1820, the use of cast iron became more frequent. Irregularities in the casting process and corrosion from water exposure affected the strength and lifespan of iron pipes. The vertical casting technique (developed in 1845) produced a more uniform cast, and in the 1850s, manufacturers learned that lining pipes with other materials reduced corrosion, increasing the pipe’s lifespan by a factor of two or more. Pumping technology improved in the 1860s with the refinement of the Worthington Pump and the Holly Rotary Pump. These pumps were more reliable and offered more uniform pressure, which reduced reliance on reservoirs or water towers, in turn lowering construction costs.
These technological advances arrived just as smaller cities started recognizing the benefits of infrastructure investment. The “Sanitary Idea” that epidemic disease results from environmental conditions rather than personal morality gained momentum following Edwin Chadwick’s 1842 Inquiry into the Sanitary Condition of the Laboring Population of Great Britain. As the Sanitary Idea took hold in England, it was increasingly seen as the government’s responsibility to supply water and remove waste. U.S. enthusiasm for infrastructure investment lagged England, in part because American cities were less dense. But as U.S. cities grew, so did the prevalence of filth and disease, which motivated investment. 13
As cities invested in water infrastructure, waste disposal emerged as a new problem. Access to running water increased daily water consumption from about 2 to 3 gallons per capita to 50 to 100 gallons per capita. 14 Water consumption increased even further once water closets started to be installed. The problem, as Tarr notes, was that cities did not invest in water and sewer infrastructure simultaneously and existing disposal methods (cesspools and privy vaults) were not designed to handle this increased capacity. 15 Overflowing cesspools and privy vaults forced action. The first U.S. municipal sewers appeared in Brooklyn (1855), Chicago (1856), and Jersey City (1859). We lack comprehensive data on sewer construction, but the complementarity between water and sewer infrastructure suggests that the pace of sewer construction mirrored waterworks construction but with a lag to account for when existing waste systems became overwhelmed.
American engineers were in the fortunate position that many of the associated technological challenges had already been solved in England. Most systems were designed to move wastewater and stormwater away from the city, preferably to a nearby waterway. Smaller cities had less of a need for stormwater diversion, and so they tended to build sewer networks that were dedicated to waste disposal. At the time, it was thought that the churning of rivers and streams purified water, and rudimentary chemical testing seemed to confirm that idea. 16 Bacterial science refuted this idea in the 1880s and 1890s, but by then large cities had already made substantial infrastructure investments.
Proliferation (1880-1900)
The pace of waterworks construction increased dramatically in the final decades of the nineteenth century. Figure 2 provides a sense of the scale of these investments by plotting, by city size, the number of waterworks constructed in each five-year bin. The patterns in Figure 2 are somewhat predictable. Since there are more small cities than large cities, it is not surprising that the solid black bars are much smaller in magnitude. From 1800 to 1860, it was rare to see more than twenty waterworks being constructed in any given five-year period. Even so, the pace of waterworks construction in the final decades of the nineteenth century is striking, topping out at nearly four hundred between 1885 and 1890.
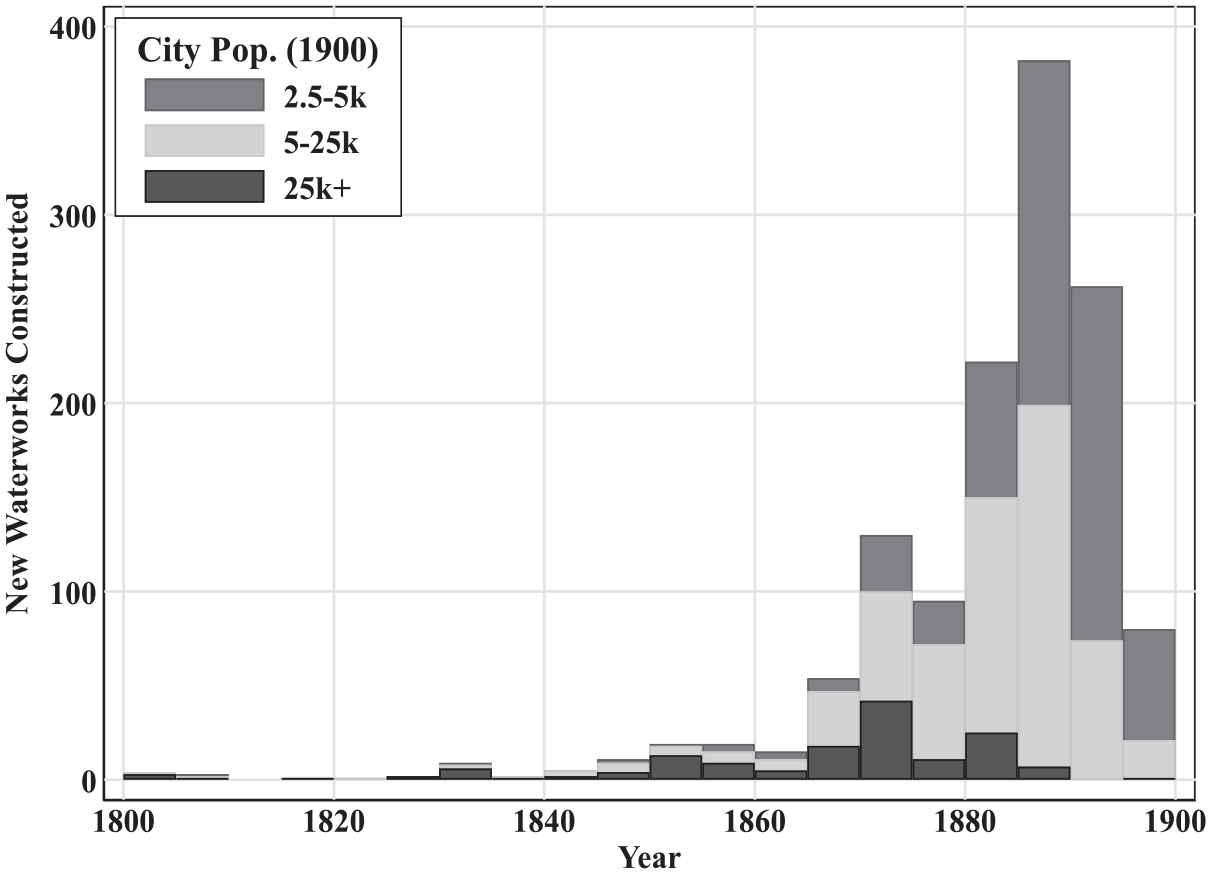
New waterworks construction by city size and year.
The forces that drove smaller municipalities to invest in the final decades of the nineteenth century differed from the forces at play in earlier periods. Before 1880, investment occurred as cities outgrew local water supplies. It is unlikely that so many large towns (2,500-5,000 inhabitants) and small cities (5,000-25,000) outgrew their waterworks in such a brief period of time. Larger cities (25,000 or more inhabitants) did not outgrow their local water supplies all at once. Taking the year of construction as a rough approximation of when cities outgrew their supplies, Figure 2 indicates that some large cities outgrew their local supplies as early as 1800, while other large cities did not outgrow their local supplies until nearly 1900.
What explains the seemingly coordinated wave of investments among smaller cities and larger towns after 1880? David Cutler and Grant Miller argue that there was pent up demand for waterworks and that the wave of investments after 1880 reflected public finance innovations that allowed cities to raise the capital to construct waterworks. 17 Their argument is that the Panic of 1873 motivated the adoption of constitutional reforms to restrain public borrowing, but waterworks were one of the few purposes for which a local government could borrow beyond the legally established debt limit. Those reforms established the attractiveness of municipal debt, allowing even the smallest of cities to issue waterworks bonds at favorable interest rates. A key piece of evidence offered in favor of this hypothesis is time series evidence on municipal borrowing in New England, but the interest rates used are mostly for Massachusetts municipalities, which had an average bond yield lower than any other state. 18 There is thus a need for additional evidence relating public finance innovations and municipal borrowing costs to waterworks construction.
It seems reasonable to assume that municipalities financed late-nineteenth-century waterworks investments at favorable terms. 19 Municipal water bonds are often tied to tangible assets that can be seized (and easily redeployed) in the event of bankruptcy. But bankruptcy was rare, as waterworks often raised more than enough revenue to offset operating costs and debt repayment. In some cases, waterworks generated enough revenue to service other debts as well. The revenue stream is also reliable, as demand for piped water was more likely to increase than decrease during this period. Delivering water is not labor intensive and the key input (the water that enters the pipe) is virtually costless. These features suggest that financial markets viewed municipal water bonds favorably regardless of constraints on other types of borrowing.
While small municipalities could borrow to construct waterworks in the late nineteenth century, this does not explain why small cities and large towns across the country made these investments effectively all at once. This phase of investment, as with the adoption of other technologies, is a natural next step as waterworks construction diffuses from larger to smaller cities. Adoption was likely stimulated by greater demand for clean water as individuals started to understand the causes of disease and lower construction costs. Fixed costs of construction may have been pivotal for smaller cities, which were more limited in their ability to spread those costs across households. To the extent that waterworks were profitable, cities might have built waterworks hoping that it might help raise revenue. This seems particularly relevant if cities were constrained by their ability to borrow for other purposes. Smaller municipalities may have built waterworks to help establish their legitimacy: The amount and character of property owned by any municipal or quasi-municipal corporation, especially in the less settled Southwest and West, and especially when the population is a matter of hundreds or scant thousands, have an important bearing upon the permanency of the settlement. . . Nothing else makes for stability and security like a good waterworks, operated and owned by the municipal corporation.
20
Letty Anderson also cites “boosterism” as a distinct driver of investment, as smaller towns competed for people and industry. 21 Vancouver, British Columbia, was one city that hoped public health investments would attract additional residents. 22
Controlling Waterborne Disease
Improvements in water and sewer infrastructure helped cities to control waterborne disease. The neighboring cities of Newark and Jersey City offer an illustrative example. For many years, both cities obtained their water from the heavily polluted Passaic River, and as Figure 3 shows, typhoid fever mortality in the two cities was remarkably similar. When Newark abandoned the Passaic River in 1892, its typhoid fever mortality rate fell by 60 to 70 percent. Typhoid mortality in Jersey City remained at the high baseline until 1896, when Jersey City also abandoned the Passaic River. In 1898, Jersey City temporarily augmented its supply with previously abandoned sources on the Passaic River, and a sharp but temporary uptick in typhoid fever rates occurred. A similar situation occurred in 1899 when a cold spell decreased the supply of water from the Pequannock River and Newark was forced to rely on the Passaic River.
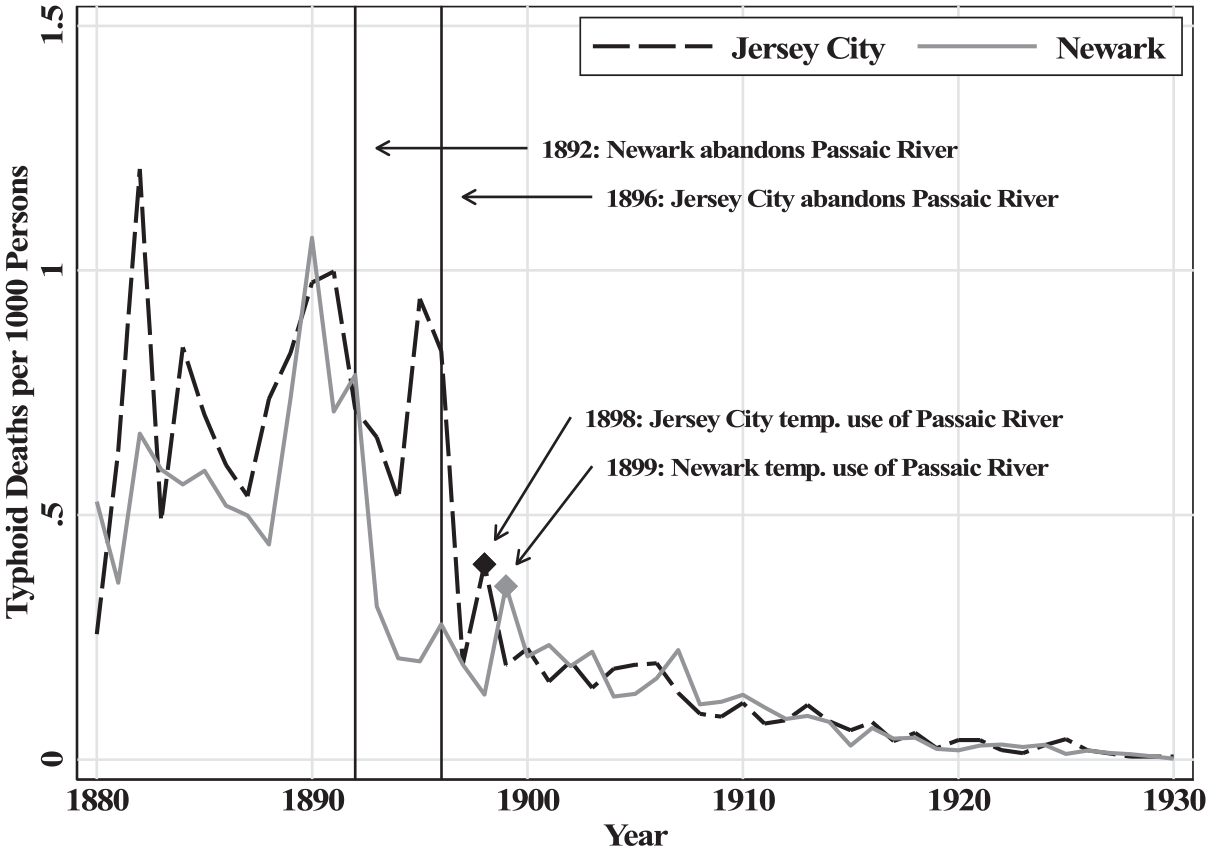
Typhoid patterns in Jersey City and Newark, 1880-1930.
The responsiveness of typhoid fever reflects complementary infrastructure investments that were made decades earlier. The waterworks that Jersey City and Newark built to draw from the Passaic River were built in 1852 and 1867, but key components of those waterworks (such as mains and taps) were not abandoned when the cities switched sources. The network of mains that transported water throughout each city, which was developed over several decades, could transport water from any source. Thus, once Passaic River water was flushed from the mains and replaced with a purer source, any resident with pre-existing access to the city water would benefit from consuming relatively uncontaminated water. This helps explain the sharp decline in the overall typhoid fever mortality rate observed in Figure 3 but also highlights how a switch to a purer source might generate smaller health improvements in cities with a less-developed network of mains.
Purifying Contaminated Sources
In the 1890s it would be established that, when it came to waterborne illness, water filtration systems were an effective and viable substitute to obtaining water from untainted sources. In the United States, this lesson originated in Lawrence, MA, which has the distinction of being the first city to filter its water for the purposes of controlling waterborne disease.
For nineteenth-century textile towns like Lawrence, rivers were an important resource. First, rivers offer an abundant source of energy that could be used to power textile mills. Second, rivers provide an easy solution for removing human and industrial wastes: simply deposit the wastes into the river and allow it to flow downstream. Finally, if other sources were unavailable, a town could also obtain its drinking water from the river, ideally from a point that lies upstream from sewage and other waste outflows.
Unfortunately for the residents of Lawrence, the water entering the city’s river intakes was heavily polluted from sewage and other waste. Health officials attributed at least part of the blame to the neighboring city of Lowell, located ten miles upstream. As one Lawrence health official put it: “Whenever [typhoid fever] has appeared in Lowell we have noticed the appearance of it here in less than three weeks, and always in a more violent form than in Lowell.” 23 The situation was not much better in Lowell, as until about 1893, the water that entered Lowell’s mains was also frequently contaminated.
The health situation in Lawrence and Lowell degraded rapidly after about 1887. From 1883 to 1886, annual typhoid rates in Lawrence and Lowell averaged 0.52 and 0.69 deaths per 1,000 persons. 24 For perspective, Manchester (NH), another textile town located along the Merrimack River, drew its water from a nearby lake and its average typhoid death rate was 0.46 deaths per 1000 persons. Typhoid mortality in Lawrence and Lowell nearly doubled in 1887 and remained elevated for several years while Manchester’s typhoid fever mortality held constant.
The situation in Lawrence and Lowell was at its worst during the 1890 to 1891 typhoid epidemic. Between January and August of 1890, typhoid fever killed 0.64 of every 1,000 residents of Lowell, a 30 percent increase relative to 1889. But between September and December, the cumulative death rate would increase by 0.94 deaths per 1,000 residents, a 154 percent increase in deaths relative to September to December of 1889. 25 As was often the case, when Lowell suffered from typhoid fever, so did Lawrence. The epidemic arrived in Lawrence toward the end of October and lingered until the spring of 1891.
The 1890 to 1891 typhoid epidemic proved to be a turning point. In December 1890, the Lowell water board enlisted the help of the prominent public health scholar William Sedgwick to determine whether the Merrimack River was responsible for the epidemic. Sedgwick’s investigation traced the origins of the epidemic to an outbreak of typhoid in North Chelmsford, whose waste entered the Merrimack River roughly 2.5 miles upstream from Lowell’s intake crib. Sedgwick’s summary contains only the following sentence: “In view of all the foregoing facts I find myself compelled to report to your Honorable Board my firm conviction that there is danger, both constant and grave, in the water of the Merrimack River at Lowell.” 26 At this point, Lawrence and Lowell accepted the responsibility to protect residents from typhoid fever.
Lowell’s solution was to abandon the Merrimack in favor of water from a driven-well system located away from the river. Because of their depth, driven wells are unlikely to be contaminated. The location of Lowell’s wells was determined by the experiments of Sedgwick and others. Lowell’s transition to driven wells started in 1893 and by 1896 the city was no longer supplying drinking water from the Merrimack River. 27 As Lowell increased its reliance on driven wells, its typhoid fever death rate quickly converged to the lower rate of Manchester.
Lawrence’s solution involved the development of a filtration system. 28 The Massachusetts Board of Health constructed an experimental filtration station at Lawrence in 1886. Early experiments showed that sewage could be filtered from water supplies, but the filtration rate was so slow that it was infeasible to filter the entire water supply. Sedgwick’s findings on the 1890 to 1891 typhoid epidemic illustrated the urgency of finding a way to successfully filter Lawrence’s water supplies. The state board of health scaled up their filtration experiments, and after identifying a successful solution, the board advised Lawrence on how to filter its water. Construction started in 1892 and the plant opened on September 20, 1893. In 1894, the first year of continuous operation, Lawrence’s typhoid fever mortality rate converged to that of Manchester for the first time in nine years. From 1895 to 1898, Lawrence’s typhoid fever mortality rate was consistently lower than Manchester’s rate.
Lawrence offered compelling evidence on the benefits of slow sand filtration as well as a blueprint for a successful model, but it was not enough to spur widespread investment. Many large cities relied on rivers and lakes for their drinking water and were thus subject to the same disease environment as Lawrence. As of 1905, a full decade after Lawrence illustrated that typhoid fever was preventable, only 20 percent of large cities that drew their water from surface sources filtered their water.
A likely explanation for this slow adoption is cost. In Pittsburgh, it was recognized that a filtration plant would solve the typhoid fever problem. Pittsburgh, like Lawrence, drew its water from rivers and suffered from high typhoid rates because of the amount of sewage that was dumped upstream. The city approved the construction of a filtration plant in 1899, but construction was delayed for several years as politicians fought over the allocation of the funds. If the cost of a filtration plant was deemed prohibitive, officials may have delayed acting in hopes that a cheaper option might soon arrive. The 1890s, after all, saw considerable innovation in the field of water filtration. 29
The experience with chlorination offers further evidence that cities may have delayed investment because of cost concerns. In 1908, Jersey City became the first U.S. city to continuously treat its water with chlorine. The chlorination plant was constructed because of a legal battle, not because Jersey City was suffering from high waterborne disease rates (see Figure 3). 30 Jersey City awarded a contract to impound water from the Rockaway River, but the contract specified that the water be “pure and wholesome and free from pollution deleterious for drinking and domestic purposes.” There was a concern that because a filtration plant was not built that the water had the potential to be polluted, and thus the company had failed to fulfill the contract. The chlorination plant allowed the company to fulfill the contract, as early tests showed the efficacy of chemical chlorination. The plant was built at a cost of $20,456 with an annual operating expense of $2,100. In contrast, diverting sewage would have cost several hundred thousand dollars.
Figure 4 plots the adoption of filtration and chlorination among large and medium-sized cities. The sample of cities is restricted to those with an estimated population of 30,000 or more in 1915. A city relies on surface water sources if any of its water comes from rivers, streams, lakes, ponds, creeks, or brooks. Underground sources are deep wells. The main takeaway from Figure 4 is that while cities were slow to build large filtration plants, even after Lawrence’s demonstrated success in 1893, they were quicker to build chlorination plants. By 1910, about 10 percent of the sample had started chlorinating the water supply; by 1914, that figure would approach 35 percent. These investments were concentrated among cities that relied on easily-contaminated surface water sources, which provides further support for the idea that investment in filtration was slow because of cost concerns.
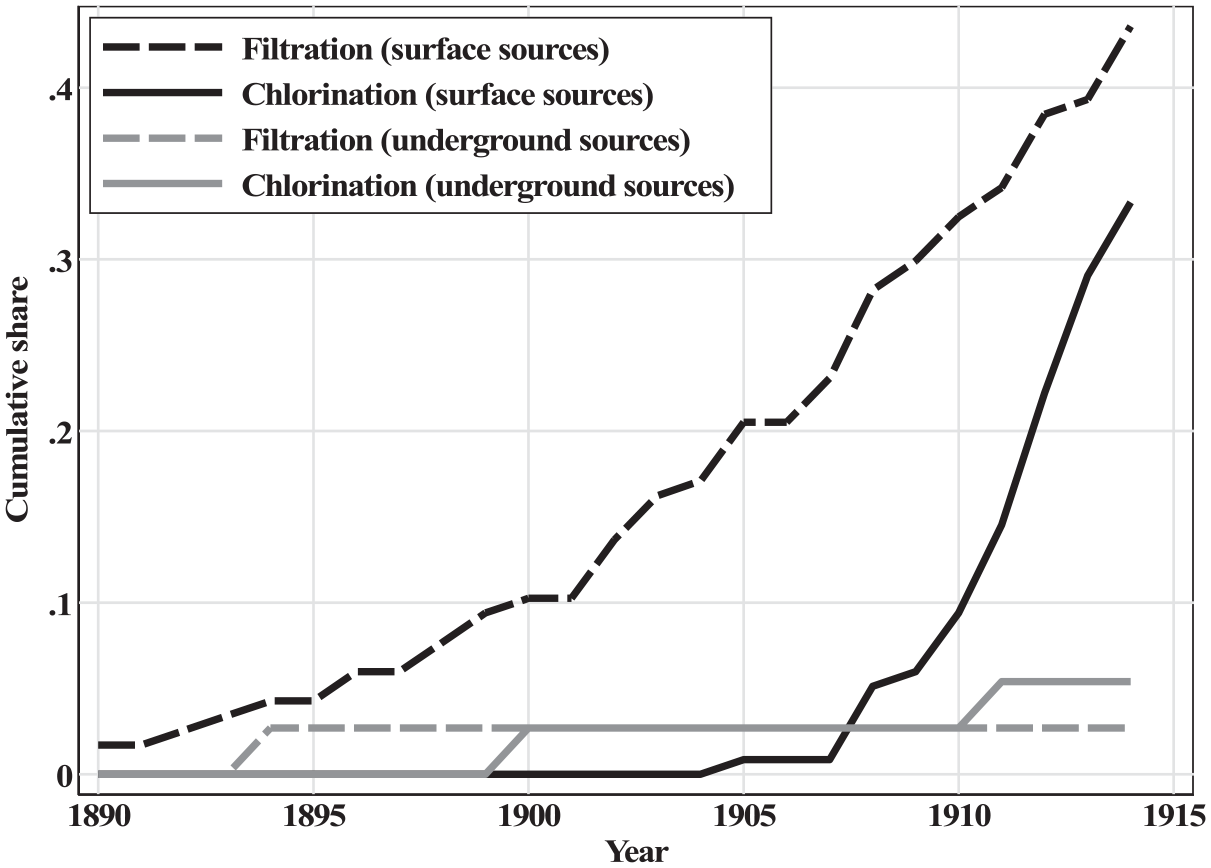
Water purification adoption by water source.
Infrastructure Access
Infrastructure access did not come all at once. Even among some of the largest cities in the United States, it was uncommon to see universal access to running water and flush toilets by 1940. Charleston (SC) is an extreme example where only 63 percent of households had access to running water and only 44 percent had access to a flush toilet. More racially segregated cities had lower household connection rates (94 percent for running water compared to the sample average of 98 percent; 81 percent for flush toilet access, with 90 percent in the total sample), even though racially segregated cities tended to build waterworks earlier than integrated cities. 31 Segregated cities were also slower to eliminate typhoid fever. These patterns are consistent with segregated cities building waterworks that excluded neighborhoods with larger Black population shares. Since segregated cities lagged in their ability to control waterborne disease, it appears that cities may have been reluctant to make the final wave of investments where the benefits would have disproportionately benefited Black households.
Residents without access to pure sources of water tend to draw on contaminated sources, which undermines public health. An 1899 report by Lawrence’s Board of Health, for example, notes: “The fact that, in spite of repeated warnings, Canal water is occasionally drank by the mill employees and that water from different wells around the city is constantly used, may account for these sporadic cases.” 32 Many low-income households continuing to rely on shallow (and polluted) wells because the cost of a water connection exceeded the perceived benefit, which undermined the efficacy of New York City’s Croton Aqueduct. As Edward Glaeser and James Poterba argue, New York City’s waterborne disease rates remained elevated until 1866, when it was decided that homeowners could be fined for failing to connect to water and sewer systems. 33
On the Consequences of Delayed Investment
At first glance, one might conclude that typhoid fever was not a major issue. Our most reliable source for U.S. mortality statistics is the U.S. Census Bureau’s “Mortality Statistics” publications, which start in 1900. 34 The 1900 report shows that typhoid fever was the 15th largest killer, responsible for 2.4 percent of all deaths. The 1880 census mortality schedules are more comprehensive but of lower quality. There, typhoid fever accounts for 1.7 percent of all deaths in the fifty largest cities and 3.6 percent of all deaths in the rest of the country. This may reflect the largest cities having already made some progress in preventing the contamination of water supplies by 1880, errors due to differential misdiagnosis, or competing risks in urban areas—the idea that the typhoid fever death rate would have been higher if deaths were not crowded out by other infectious diseases, like tuberculosis, which may have killed first.
What the above exercise misses is the virulence of typhoid fever, which often left survivors susceptible to other threats. Modern medical literature shows that typhoid fever can cause substantial and lingering damage to the heart, liver, kidneys, and broader circulatory and nervous systems. 35 This damage, particularly when the scope for medical intervention was limited, suggests that the ultimate health impact of typhoid fever extends beyond its seemingly low case fatality rate.
The health multiplier associated with eliminating typhoid fever is often referred to as the Mills-Reincke Phenomenon. The name originates from chief engineer Hiram Mills (Lawrence, MA) and Dr. J.J. Reincke (Hamburg, Germany), who independently noted that after their cities started filtering their water in 1893, mortality rates declined by more than what could be explained by typhoid fever. In Lawrence, typhoid fever mortality declined by 0.95 deaths per 1,000 persons in the five years following filtration relative to the five years before, but total mortality declined by 4.45 deaths per 1,000 persons. A similar comparison in Hamburg shows a relative decline in typhoid mortality of 0.4 deaths per 1,000 persons and a decline in total mortality of 6.3 deaths per 1,000 persons. 36
One concern with the above comparisons is that any estimate of the multiplier effect will be biased upward if cities that purified their water supplies also made other sanitary improvements. The idea of a valid counterfactual is one that we still struggle with today. In 1904, Allen Hazen’s solution was to implement what we would now call a difference-in-differences methodology: comparing mortality patterns in cities that purified their water supplies to mortality patterns in similarly situated cities that did not change their water supply. 37 Hazen’s comparisons of 18 American cities (five of which improved their water quality) indicate that total mortality in the treated cities declined by 4.4 deaths per 1,000 persons while in the control cities mortality declined by 1.37 deaths per 1,000 persons. This yields a treatment effect of 3.03 deaths per 1,000 persons, 0.71 of which is accounted for by the direct effects of typhoid fever. Hazen somewhat cautiously concludes that the multiplier is “probably between 2 and 3.” Joseph Ferrie and Werner Troesken’s case study of Chicago finds a health multiplier between 2.3 and 5.
The aggregate effects of water and sanitary improvements remain an open question. D. Mark Anderson, Kerwin Charles, and Daniel Rees revisit the issue with a sample of twenty-five cities and a broader set of public health interventions. Aside from water filtration, which reduced infant mortality by about 10 percent, no specific intervention had a large effect on total and infant mortality. 38
In some ways, the range of results reflect methodological challenges. One issue is that infrastructure is an important omitted variable because of a lack of data. The experiences of Lawrence, New York, and many other cities illustrate that unless water and sewer connections are universal, water and sanitation investments can be undermined as individuals drinking from contaminated sources. A second issue is that cities invested in a range of technologies—clean water projects, sewerage, filtration, and chlorination. Sometimes those investments were substitutes while other times they were complements, and a small set of those investments should probably be ignored because they failed to generate meaningful improvements in water quality, as was the case with Jersey City’s chlorination plant which is better thought of as offering insurance against future contamination.
Marcella Alsan and Claudia Goldin take a slightly different approach, examining the role of sanitary infrastructure in sixty Boston-area municipalities. 39 They find evidence that clean water and safe sewerage (independently) improved health, but that it was important to have both types of infrastructure. Infant and child mortality fell by about one-third once a city had clean water and sewerage. This large benefit, which also highlights the complementarity between the two types of infrastructure, suggests that delayed and incomplete investments had large health costs.
Conclusion
U.S. cities experienced a sanitary revolution during the nineteenth and early twentieth centuries. The abandonment of cesspools, privy vaults for waste containment and cisterns, pumps, and shallow wells for water delivery brought about a large increase in living standards. First, in terms of health, as urbanites became much less exposed to waterborne illness, and second, in terms of labor savings.
While the gains are impressive, a theme of this article is that there was a general reluctance to make these investments. Scientific advances clarified understanding of the origins of waterborne illness and filtration plants and universal access to water and safe sewerage offered a solution. Yet few cities made those investments. Only with chlorination, a low-cost purification solution, did we see rapid adoption. Delay was costly. Without access to safe water and sanitation, residents were left vulnerable to typhoid fever and other waterborne illnesses, and the available evidence suggests that the mortality penalty for this exposure was large.
The U.S. experience during this sanitary revolution provides a useful perspective for interpreting modern infrastructure challenges. Perhaps the most prominent contemporary critic on the state of U.S. water and waste infrastructure is President Biden, who has tried to secure funding to replace the lead pipes that serve homes and schools. 40 Historical observers knew that lead was toxic, although they had a more incomplete understanding of the size of the threat. By 1920, it was understood that water-lead levels could be lowered by altering the chemistry of water supplies, but the first national water-lead standard would not be set until 1975. The installation of lead service lines was banned in 1986, and somewhere between 6 and 10 million lead service lines remain in use in the United States. 41 If history is a guide, we should not anticipate municipalities to be proactive in removing these service lines.
Footnotes
Declaration of Conflicting Interests
The author(s) declared no potential conflicts of interest with respect to the research, authorship, and/or publication of this article.
Funding
The author(s) received no financial support for the research, authorship, and/or publication of this article.