
Abstract
Representative bureaucracy theory predicts that mirroring social groups in the composition of the bureaucracy will lead to inclusive policies and less overall exclusion of diverse individuals. While supporting evidence on policy outcomes is abundant, findings on subjective perceptions are mixed. This study tests three hypotheses linking representative bureaucracy to perceived same-group discrimination in the general population. It introduces a novel multidimensional index of bureaucratic underrepresentation, and uses mixed effects hierarchical models to approximate answers. Exploratory findings suggest an “awareness” mechanism may explain the counterintuitive relationship between underrepresentation and feelings of exclusion, in which more diverse public sectors develop alongside higher awareness of discrimination.
Introduction
The last decade has seen vibrant discussions around the role of public administrations in the pursuit of social equity (e.g., Frederickson, 2010; Gooden, 2015; Guy & McCandless, 2012). A prominent aspect in these debates relates to the way the social composition of the civil service matters for different democratic and social outcomes. Systematic reviews on the topic show that more representative bureaucracies lead to beneficial societal outcomes (Bishu & Kennedy, 2020; Bradbury & Kellough, 2011; Riccucci & Van Ryzin, 2017). These outcomes often take the form of organizational achievements (e.g., Andrews & Ashworth, 2015; Andrews et al., 2014), but are more generally reflected on the efficiency, efficacy, and legitimacy of public services and policies (Liang et al., 2020; Meier et al., 1999; Meier & Nicholson-Crotty, 2006; Riccucci & Van Ryzin, 2017, among others).
In advancing its propositions, the literature on representative bureaucracies has sought to elucidate how representativeness affects bureaucratic behavior and clients’ attitudes differentially (Nicholson-Crotty et al., 2016). In that sense, while most works have focused on the former (e.g., Kennedy, 2013), citizen attitudes have been comparatively much less studied (e.g., Riccucci et al., 2014, 2018).
The study of individual perceptions acquires fundamental importance in the evolving context of representative organizations, where discussions have moved from equality and diversity toward the idea of inclusion (Andrews & Ashworth, 2015; Oswick & Noon, 2014). A number of studies address how diversity affects feelings of exclusion or discrimination within public organizations (e.g., Andrews & Ashworth, 2015; Bae et al., 2017; Ritz & Alfes, 2018), with some scholars showing a complex and nuanced picture (e.g., Alteri, 2020; Choi & Rainey, 2010; Naff, 1995).
Most noteworthy is, perhaps, the marked lack of research on how the representativeness of bureaucracies affects feelings of exclusion beyond organizational boundaries and into the general population. Representative bureaucracy theory presents several arguments by which more closed civil services may lead to concrete exclusions for the underrepresented groups. At a basic level, democratic governance considers the bureaucracy a critical arena where social power is deployed, and hence, inequalities of access to the civil service can be interpreted as unequal access to power (Kennedy, 2014). Similarly, a key tenet of representative bureaucracy is that the makeup of the civil service will determine whether broad social interests are considered in the design and implementation of public policy (Kennedy, 2014; Selden, 1997). Beyond representation, the composition of the civil service has the potential to alter the daily administrative procedures citizens engage in. There is, in that sense, extended evidence that citizen-bureaucrat interactions represent critical instances where exclusions and discrimination can occur (see discussion in Jilke & Tummers, 2018) and where client-group characteristics matter for bureaucratic responses (Alizade et al., 2021). Lastly, the interest in social equity and public administration invites discussion about the role of the civil service in providing equal opportunities (Groeneveld & Van de Walle, 2010). Since the public sector the largest employer in many economies (Thijs et al., 2017), restriction in access to bureaucratic jobs can be interpreted as a form of job market exclusion.
This exploratory study aims to expand research on how bureaucratic compositions matter for social equity by posing the question: how does the level of societal representation in the bureaucracy affect citizens’ perception of same-group discrimination within societies? It advances initial insights on the possible factors that shape the nature of this relationship by using a stepwise approach to hypothesis testing. Methodologically, the article presents three empirical innovations that address critical gaps in the literature. First, it deviates from the study of single diversity dimensions that has predominated in representative bureaucracy studies. The recent review by Bishu and Kennedy (2020) shows that the field is heavily biased toward the study of gender and race, and that “characteristics such as disability, age, LGBTQ status, religion, or country of origin are severely understudied or not studied at all” (p. 580). Rather, this study proposes a novel multi-dimensional index of bureaucratic underrepresentation encompassing measures on gender, age, ethnicity, disability, and nationality. Second, the index enables unprecedented conditions for cross-country comparability, with 27 European countries covered in the analysis. This approach is intended to alleviate a contradiction faced by representative bureaucracy theory: it claims generalizability to democratic contexts, yet, it has been very narrowly applied. Bishu and Kennedy (2020) show that almost 80% of the works included in their meta-review relate exclusively to the American context. Sabharwal et al. (2018) further show that only 7% of works on representative bureaucracy are set outside the U.S. Finally, the present empirical analysis makes use of hierarchical models that are able to account for explanatory variables operating at both the individual and institutional (national) level, enabling a more complete picture of how system-level aspects affect individual perceptions (Bae et al., 2017; Bradbury & Kellough, 2011).
The study’s initial findings present an interesting puzzle: robust estimations show that the more socially representative a bureaucracy is, the more likely an individual in the general population is to report a feeling of same-group discrimination. It is here proposed that the two most likely explanations stand in contrast to one another: the first, a possible “backlash” effect from predominant groups; the second, an increased social awareness of discrimination in countries where diversity is better embedded institutionally. The empirical exploration suggests the awareness effect predominates, as evidenced by the increased number of diversity dimensions that are likely to trigger discrimination perceptions in countries with more diverse bureaucracies.
The next section will offer an overview of the literature on representative bureaucracy, with a particular focus on works concerned with subjective outcome measures of exclusion. Based on the literature, section 2 will subsequently describe the stepwise process of hypotheses testing. Section 3 will present the empirical strategy and introduce the variables and sources of data for the estimation models. It will explain how the novel multidimensional Index of Bureaucratic Underrepresentation (IBU) is built and show descriptive patterns for the sample of European countries at hand. Section 4 will report the findings emerging from the hierarchical models and their implications for hypotheses testing. Section 5 will resume the discussion on public administration and social equity in light of the findings, and stress the study’s limitations. Section 6 will offer a brief conclusion and ideas for future research.
The Role of Representative Bureaucracy in Perceptions of Social Inclusion
Abundant research shows that greater representativeness in the public sector workforce leads to desirable social outcomes (e.g., Bishu & Kennedy, 2020; Bradbury & Kellough, 2011). The consensus is generally strong when it comes to so-called passive representation, the idea that bureaucracies should mirror in their composition the groups that exist in the general population (Mosher, 1968). More debate has emerged, however, with regards to how passive representation operates in practice to benefit disadvantaged groups (Lim, 2006). At least two mechanisms have been proposed. The first suggests that passive representation leads to active representation, that is, civil servants actively benefitting clients from their respective social group. The second suggests that a more diverse workforce operates symbolically by changing the organizational climate as well as generating more positive feelings and attitudes from a diverse citizenship (Guul, 2018; Riccucci & Van Ryzin, 2017; Theobald & Haider-Markel, 2009). Symbolic representation operates without any conscious or purposeful action by the bureaucracy; instead, the mere demographic features of a bureaucrat may elicit feelings of trust and familiarity in citizens alike, which ultimately enhances government legitimacy and the chances of virtuous cooperation (Riccucci & Van Ryzin, 2017).
In testing the principles of representative bureaucracy, the empirical literature has sought to incorporate more nuances to the causal mechanisms leading to more representative policy and organizational outcomes. Scholars have pointed at different mediating factors such as the levels of distributional equity (Nicholson-Crotty et al., 2011), bureaucratic discretion (Sowa & Selden, 2003), organizational socialization (Wilkins & Williams, 2008), organizational mission (Sneed, 2007), community networking (Davis et al., 2011), and diversity management and leadership (Ashikali & Groeneveld, 2015; Choi & Rainey, 2010; Pitts, 2009), among others. There also seem to be nuances in the diversity dimensions for which the passage from passive to active representation operates (without clear agreement, see, e.g., Keiser et al., 2002).
At the same time, the interest has tended to focus on objective outcome variables, such as the design of policy, the allocation of resources, or frontline case workers’ decisions (Liang et al., 2020; Meier & Nicholson-Crotty, 2006; Park & Liang, 2019, among many others). Yet, subjective feelings matter particularly when the focus is placed on inclusion, an area where management studies are markedly less advanced (Oswick & Noon, 2014; Shore et al., 2011). A few works in the field of symbolic representation have measured the impacts of representation on citizens’ perceptions of bureaucratic legitimacy. A survey experiment by Riccucci et al. (2018), for example, focuses on how citizens view and judge law enforcement agencies as a function of their workforce diversity. Their findings show that citizens’ trust and perceived performance of the police is largely determined by the level of mirroring between citizens and bureaucrats’ race. A similar finding is reported in Riccucci et al. (2014) with regards to the role of gender in the perceived legitimacy of domestic violence units within police departments. Also in relation to police behavior, Theobald and Haider-Markel (2009) find that the perceived trustworthiness of public servants’ actions is shaped by the interaction between citizen and officer race. Gade and Wilkins (2013), in turn, find that U.S. war Veterans report higher satisfaction with rehabilitation programs when they believe that their councilor is also a Veteran.
When it comes to assessing the impacts of representativeness on feelings of inclusion, however, the closest literature is found in organizational studies interested in workplace conditions. 1 The work of Andrews and Ashworth (2015) finds that representativeness in terms of gender and ethnicity in UK civil service organizations increases feelings of organizational inclusion and reduce discrimination and bullying. Bae et al. (2017) also stress how relevant relational demography is in the context of perceptions of employee inclusion in public organizations. Their findings suggest that a greater gender balance has a positive association with organizational inclusion, although the link varies highly between females and males.
Since perceptions of personal discrimination are explained in part by actual institutionalized practices and prejudice (Salupo-Rodríguez, 2008), it becomes important to test whether these links extend beyond the organizational level. Democratic governance theories suggest concrete mechanisms by which perceptions of exclusion may be triggered by under-representative bureaucracies. A first mechanisms relates to unequal access to power. Democratic governance theories will consider the importance of both elective and non-elective power arenas in the overall picture of social power balance (Mosher, 1968). If citizens from specific social groups are denied access to the bureaucracy, the lack of passive representation may be perceived as a deficit in legitimacy (Portillo et al., 2022). In that sense, a more diverse workforce is thought to be better at addressing historical biases (Alexander & Stivers, 2020), and that such environment will reduce prejudice and discrimination. A second, more indirect mechanism relates to policy design and implementation. Discussions on active representation suggest that greater demographic matching will result in policies that better serve the clients from the newly represented social groups (Riccucci & Van Ryzin, 2017; Selden, 1997). A third mechanism relates to the quality of treatment that citizens receive from public servants, and the former’s behavioral responses to this treatment. Empirical literature suggests that citizens react more favorably in the presence of alike bureaucrats (Meier & Nicholson-Crotty, 2006) as well as environments that signal generalized diversity and openness (Riccucci & Van Ryzin, 2017). A fourth mechanism more linked to the role of public administration in social equity relates to how (deep) underrepresentation can be interpreted de facto as a job market exclusion. In Europe, the public sector represents between 17% and 35% of the GDP, and is in most countries the largest employer (Thijs et al., 2017). In countries like Germany, recent studies on diversity in the public administration show, for example, that people with migration background are heavily underrepresented with respect to the private economy (Ette et al., 2021). 2
Given these considerations, this study departs from a first hypothesis directly derived from representative bureaucracy theory:
Hypothesis 1: a more representative bureaucracy leads to a decreased probability that individuals in the general population report feelings of same group societal exclusion and discrimination.
As anticipated, the counterintuitive empirical results derived from this test lead to the next set of hypotheses, following a sequential process of hypothesis testing (Liu, 1974).
In that sense, two alternative theoretical arguments could offer an explanation for the evidence showing that in countries with more representative bureaucracies, citizens have a higher probability of reporting same group discrimination. One of these arguments dates back from early discussions on diversity in the U.S. It suggests that increased levels of representativeness might prompt a “backlash” and, in this way, trigger greater feelings of discrimination rather than prevent them (e.g,. Yoder, 1991). Based on this view, as diversity starts to increase in any given unit (the workforce or the society at large) dominant groups tend to see the newly empowered minorities as “intrusive” and threatening to their advantaged positions (see discussion in Tolbert & Grummel, 2003). In a classic study that conceptualized the idea of “tokenism,” Kanter (1977) describes how as minorities (“tokens”) start to occupy positions in small proportions, the majority reacts with heightened discriminatory behavior. In such contexts, the tokens tend to feel highly visible, more isolated and with less career opportunities (Stroshine & Brandl, 2011). Some studies provide moderate evidence for this theory, especially with regards to race in the policing forces (Gustafson, 2008; Stroshine & Brandl, 2011). On the basis of this theory, the following hypothesis is laid out:
Hypothesis 2a: a more representative bureaucracy leads to an increased probability that individuals report feelings of same group societal discrimination due to a backlash effect from dominant nonminority groups.
While the backlash hypothesis would explain a positive association between representativeness and discrimination based on an objective increase in discriminatory attitudes, another possibility for such pattern could be that the complexity of subjective experiences plays a more fundamental role, one in which individuals see their awareness of discrimination increased. This may happen, for example, due to the higher saliency of diversity issues in the public debate leading to changes in the workforces, or a more conscious reflection of discrimination as a result of increased exposure to the issue in exchanges with public service providers.
It is well-known that subjective aspects bear fundamental importance in discrimination perceptions, and that objective and subjective discrimination may evolve differently (Blank et al., 2004; Hopkins, 1980). It is also well documented that perceptions of discrimination vary on a substantial number of individual-level variables (Salupo-Rodriguez, 2008). Crosby (1984) shows, for example, that while people may recognize discrimination in their organizations, they are less likely to report having been personally discriminated. The work of Naff (1995) examines how is it possible that feelings of discrimination in the U.S. federal workforce persisted or even increased in spite of allegedly game-changing legislation such as the Civil Service Reform Act (1978). Her findings suggest the answer lies in the difference between objective and subjective discrimination, and that uniformity assumptions about how people perceive discrimination cannot be made, particularly within minorities themselves. The recent work by Alteri (2020) finds that increases in the ratio of racial minority workers and females predict increases in the rates of race and gender discrimination complaints in the federal U.S. workforce. Her data suggests, moreover, that silence and failure to report happen regularly. These results are interpreted by the author as signals of the need of safety and confidence before discrimination is reported, and that higher diversity represents lower organizational levels of tolerance for discrimination. Many works on discrimination show that when the conditions are not appropriate, minorities naturalize discriminatory behaviors more than dominant groups (e.g., Auer & Ruedin, 2019; Ruggiero & Major, 1998). Auer and Ruedin (2019), for example, highlight the overall complexity of subjective discrimination, and its associated difficulties for measurement. In a survey of migrants in Switzerland, they find a generalized lack of awareness of unequal treatment, and that this awareness is influenced by multiple factors that operate at the individual level. In an experimental study, Perozzo et al. (2016) study the link between social identity and perceived discrimination, to find that the ambiguity of discrimination cues (overt vs. ambiguous discrimination) plays a role, and that public debates and other awareness events can help change the discrimination context (and hence perceptions). Individual group members might, in that sense, increase or decrease their in-group identification. In the EU (2008) context, for example, discrimination based on religious beliefs is perceived as more widespread in countries where immigration debates have been more prominent. The key role of debates and exchanges is also supported by a recent study by Rozado et al. (2021) showing that the use of prejudice-denoting words like “sexist” or “racist” in mainstream U.S. media has soared in the period between 2010 and 2019. While an equivalent study does not exist for European media, the authors suggest that this trend might be indicative of shifts in public perceptions of prejudice.
Given these considerations, an “awareness” causal mechanism is alternatively proposed:
Hypothesis 2b: a more representative bureaucracy leads to an increased probability that individuals report feelings of discrimination due to an awareness effect operating within underrepresented groups.
Empirical Strategy
This study will use individual and country-level information to model the multiplicity of demographic, institutional, and socio-economic factors that may influence individuals’ reported feelings of discrimination.
A core source of information is the ninth edition (with data for 2018) of the long-established European Social Survey, published in the summer of 2020 (ESS, 2020), along with a series of complementary external data sources. The ESS is a cross-national representative survey conducted across Europe every 2 years since 2001. It measures the attitudes, beliefs, and behavior of diverse populations in more than thirty European countries, aiming to provide rigorous and comparable data for scientific analysis. 3 The use of nationally-representative survey data is common practice in the study of representative bureaucracies (e.g., Grissom et al., 2009), as it is also the sub-sampling of public sector employees from general population surveys (e.g., Esteve et al., 2017).
Dependent Variables
The main dependent variable in the study is a binary variable capturing whether an individual expresses feelings of societal exclusion in the form of discrimination toward the individual’s identity group. This variable is captured through the question in the ESS round 9 asking: “Would you describe yourself as being a member of a group that is discriminated against in this country?”
In order to test the backlash hypothesis (2a), survey responses measuring attitudes toward diversity will be assessed through three themes, namely attitudes toward (a) immigrants, (b) gays and lesbians, and (c) young working parents (implicitly women). The survey items for these are: (a) “Is [country] made a worse or a better place to live by people coming to live here from other countries?” (0 = worse place to live; 10 = better place to live); (b) “Gay men and lesbians should be free to live their own life as they wish.” (1 = agree strongly; 5 = disagree strongly); and (c) How much do you approve or disapprove if a woman/man has a full-time job while she/he has children aged under 3? (1 = strongly disapprove; 5 = strongly approve).
Independent Variables
The main explanatory variable of interest is the level of bureaucratic underrepresentation at the national level. This variable is captured through a multidimensional index of bureaucratic underrepresentation (IBU). 4 This index profits from the representativeness of the ESS, which captures whether individuals work for the government (either the central or local government or in decentralized public services such as health or education), and hence allows a valid comparability between the demographic characteristics of governmental officials versus the broader country population. It also profits from the unique cross-country comparability across the 27 countries covered.
The index is able to capture five diversity dimensions, commonly acknowledged in the literature as sources of social fractures: gender, ethnicity/race (multiple works, see e.g., Bishu & Kennedy, 2020), age (e.g., Choi & Rainey, 2010; Malone, 2019), nationality (Trondal et al., 2015), and disability (Riccucci & Van Ryzin, 2017; Selden & Selden, 2001). In the context of European public services, the variable on age considers the underrepresentation of the younger population, given their struggles in entering the labor market and particularly in the context of bureaucratic demographics biased toward older public servants (Selden & Selden, 2001). Moreover, the data shows that the younger population feels on average more discriminated than their older peers. The variable on nationality acquires particular relevance in the context of the EU single market and the bloc’s aspirations for high intra-EU labor mobility.
The core principle in the construction of the index is to replicate the way in which most studies of representative bureaucracies operate, namely capturing differences in the ratios of minorities between a given area of the public sector and the population at large (Grissom et al., 2009; Liang et al., 2020; Meier and Nicholson-Crotty, 2006; Park & Liang, 2019; Wilkins & Williams, 2009, among many others). In its multidimensional nature, it takes inspiration from the indices of multidimensional poverty (Alkire & Foster, 2011), in that it accounts for two simultaneous factors determining underrepresentation: its incidence and its depth. The first expresses the number of dimensions where underrepresentation happens, while the second accounts for the average depth of the underrepresentation in each dimension.
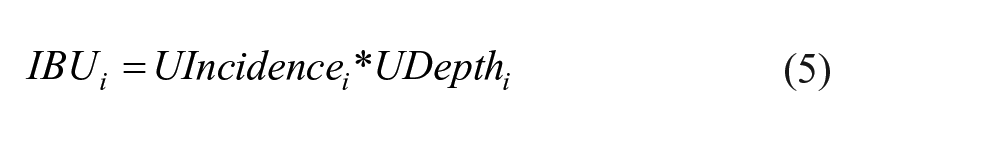
The index is then calculated as the product of the incidence of underrepresentation and its depth for each country i. These measures are calculated in a series of steps, as follows:
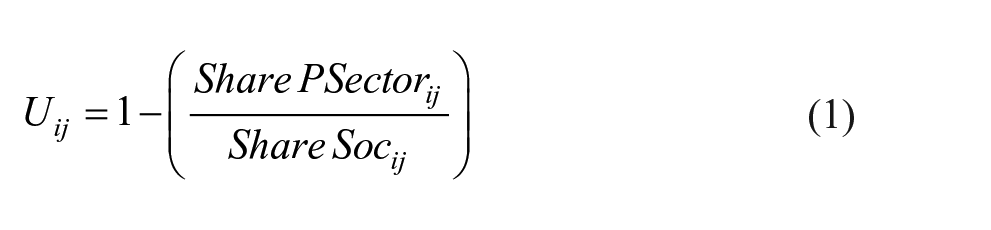
Where U is a measure of the level of bureaucratic underrepresentation for each diversity dimension j {female; ethnic minority; non-national; young; disabled} and each country i. Positive numbers reflect underrepresentation, negative numbers overrepresentation. Shares are calculated considering the needed analytical weights according to the ESS survey guidelines, which minimize design, non-response, and country size biases.
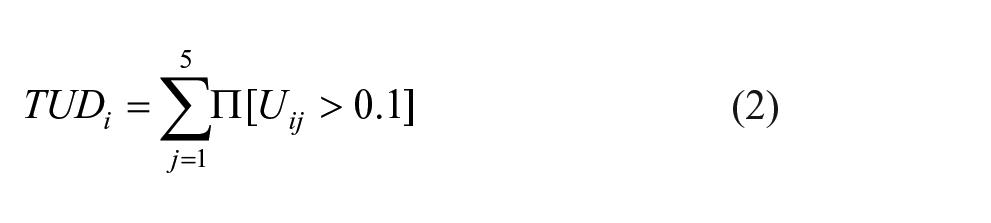
Where TUD is the total number of underrepresented dimensions for country i. An underrepresented dimension is considered such if Uij is greater than 0.1, meaning that people in diversity category j (in country i) are underrepresented by more than 10% in the public sector with respect to the overall society. This threshold is set in order to account for the necessary margin of error that emerges in any sampling exercise.
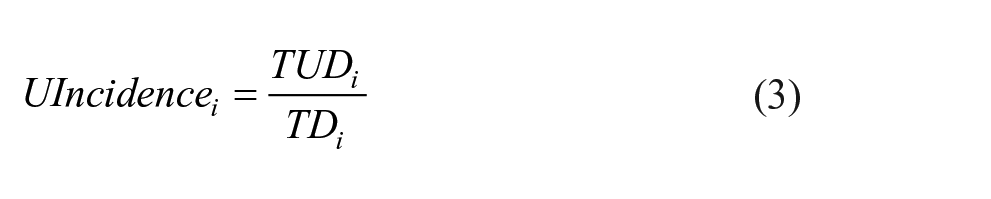
The incidence of underrepresentation is then calculated as the total number of underrepresented dimensions divided by the total number of dimensions considered in each country i, (TDi, which for the index presented here is 5).
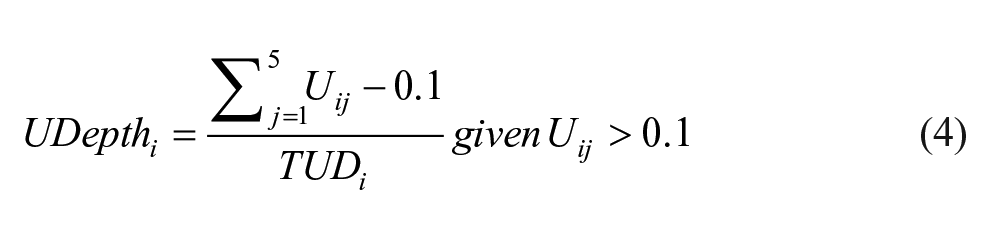
The depth of underrepresentation is calculated as the average gap across dimensions between the threshold of 0.1 and the existing level of underrepresentation for each underrepresented dimension. With equations (3) and (4) it is possible to calculate the final index for each country:
The index has a number of advantages. These five dimensions do not represent the universe of diversity dimensions of interest in the literature, but they amount to a markedly more comprehensive measure than existing ones. Importantly, the evidence shows that each diversity dimension operates differently, which speaks in favor of capturing them both individually and in aggregate (Choi & Rainey, 2010). In addition, the index enables the possibility to move beyond gender and ethnicity, which have been widely covered, and addresses less researched aspects such as nationality, disability, and age (Bishu & Kennedy, 2020). The index assumes that all diversity dimensions are present in the society, even if in small numbers.
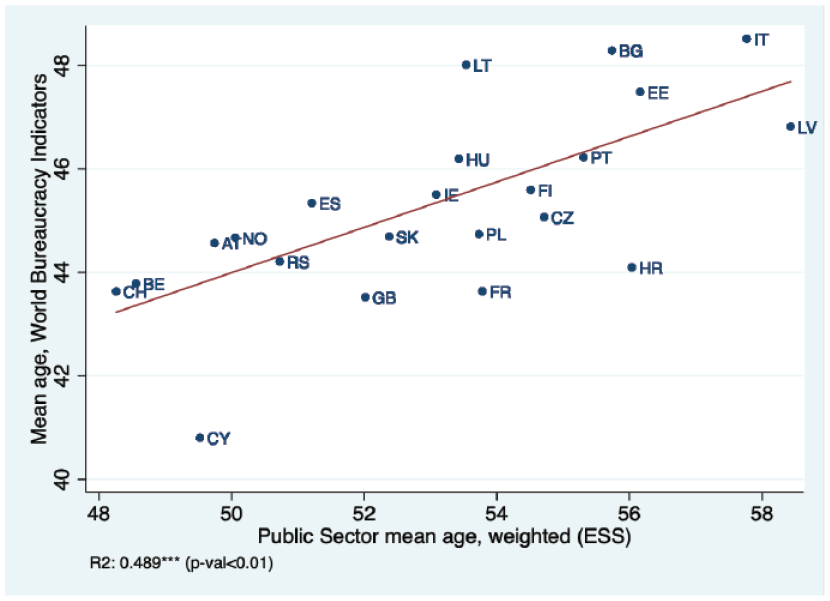
The validity of the diversity measurements can be corroborated, for example, through the high correlation the IBU index has with data from authoritative sources such as the World Bureaucracy Indicators (World Bank, 2020). The latter does not provide information on diversity, but it does offer some demographic information such as the share of females in the civil service and the mean age of public employees. Both of these categories are contrasted in the scatterplots are shown in Supplemental Annex 8C.
As a final note on index construction, the IBU index gives equal weight to each diversity dimension, and an equal weight to the depth and the incidence of underrepresentation. These are not normative decisions, but rather an empirical departing point to understand the level of demographic mirroring between sectors. There is no underlying assumption that countries should always achieve a perfect mirroring of social compositions, although there is an assumption that high levels of underrepresentation are problematic.
Controls
Perceptions of discrimination are largely determined by a long list of individual-level characteristics. Although the key interest here lies on a country-level variable, it is critical to include these to avoid ecological fallacy problems (Bae et al., 2017; Bradbury & Kellough, 2011). The European Social Survey offers an unparalleled opportunity to this end. Following literature on perceived discrimination from social psychology, the first variables included are the same demographics used for measuring bureaucratic underrepresentation, namely gender, age, ethnicity, nationality, and disability (e.g., Gil-González et al., 2013; Layton & Smith, 2017). Other individual-level identity aspects include: religious denomination, years of education, perceptions about the fairness of an individual’s salary, pension or social benefits, and the main economic activity (including a binary variable on unemployment; Layton & Smith, 2017). Additional controls relate to the level of public engagement, mindset, and/or the empowerment felt by the subject, common social structure moderators of perceived discrimination (Fiske, 1998). These include the self-reported ideological leaning in terms of left-right scale, the individual’s confidence to participate in politics, the level of social trust, perceptions about the inclusiveness of the political system, and the national governments’ representativeness and approval. Finally, a general measure of life satisfaction is included as control.
At the country level, the model controls for the levels of GDP per capita, unemployment rate, the level of democracy, the size of the public sector and the ideology of the party or parties in power. Supplemental Annex 8A offers a list of variable descriptions, summary statistics, and sources.
Given the binary nature of the independent variable, and the existence of individual-level determinants nested at the country-level, a hierarchical linear model in the form of a multilevel logit is deemed appropriate. In order to corroborate the convenience of this multi-level approach, the intra-cluster correlation coefficient of multilevel unconditional models is tested, which is statistically significant at the 1% level. This suggests the presence of country-level fixed effects, and hence the non-independence of the residuals would not be well handled in a traditional model.
To facilitate the interpretation of the coefficients in terms of probabilities, odds ratios are used. Odds ratios are interpreted here as how much a variable increases or decreases the odds that an individual will feel part of a discriminated-against group. Below 1 odds ratios indicate a decreased probability, and the opposite is true for above 1 odds ratios. Variance inflation factor statistics and correlation coefficients suggest that multicollinearity is not a risk in these models (see Supplemental Annex 8B).
Findings
Table 1 tests the starting hypothesis that higher bureaucratic representation at the national level decreases individual feelings of discrimination. The results show what may be considered a counterintuitive empirical pattern: the greater the level of underrepresentation, the lower the probability that an individual will report feeling discriminated. This result is robust to multiple alterations, such as small variations in index construction, changes to the explanatory model and sample of countries, and alternative variable measurements. The coefficients indicate that a decrease of 0.1 points in the index (which in this pool of countries ranges from 0 to 0.42) increases about 11% the odds of reporting a feeling of discrimination, other things equal. This result is significant at the 99% confidence level, and hence, fail to provide support to hypothesis 1.
Country and Individual-Level Determinants of Discrimination Feelings in 26 European Countries.
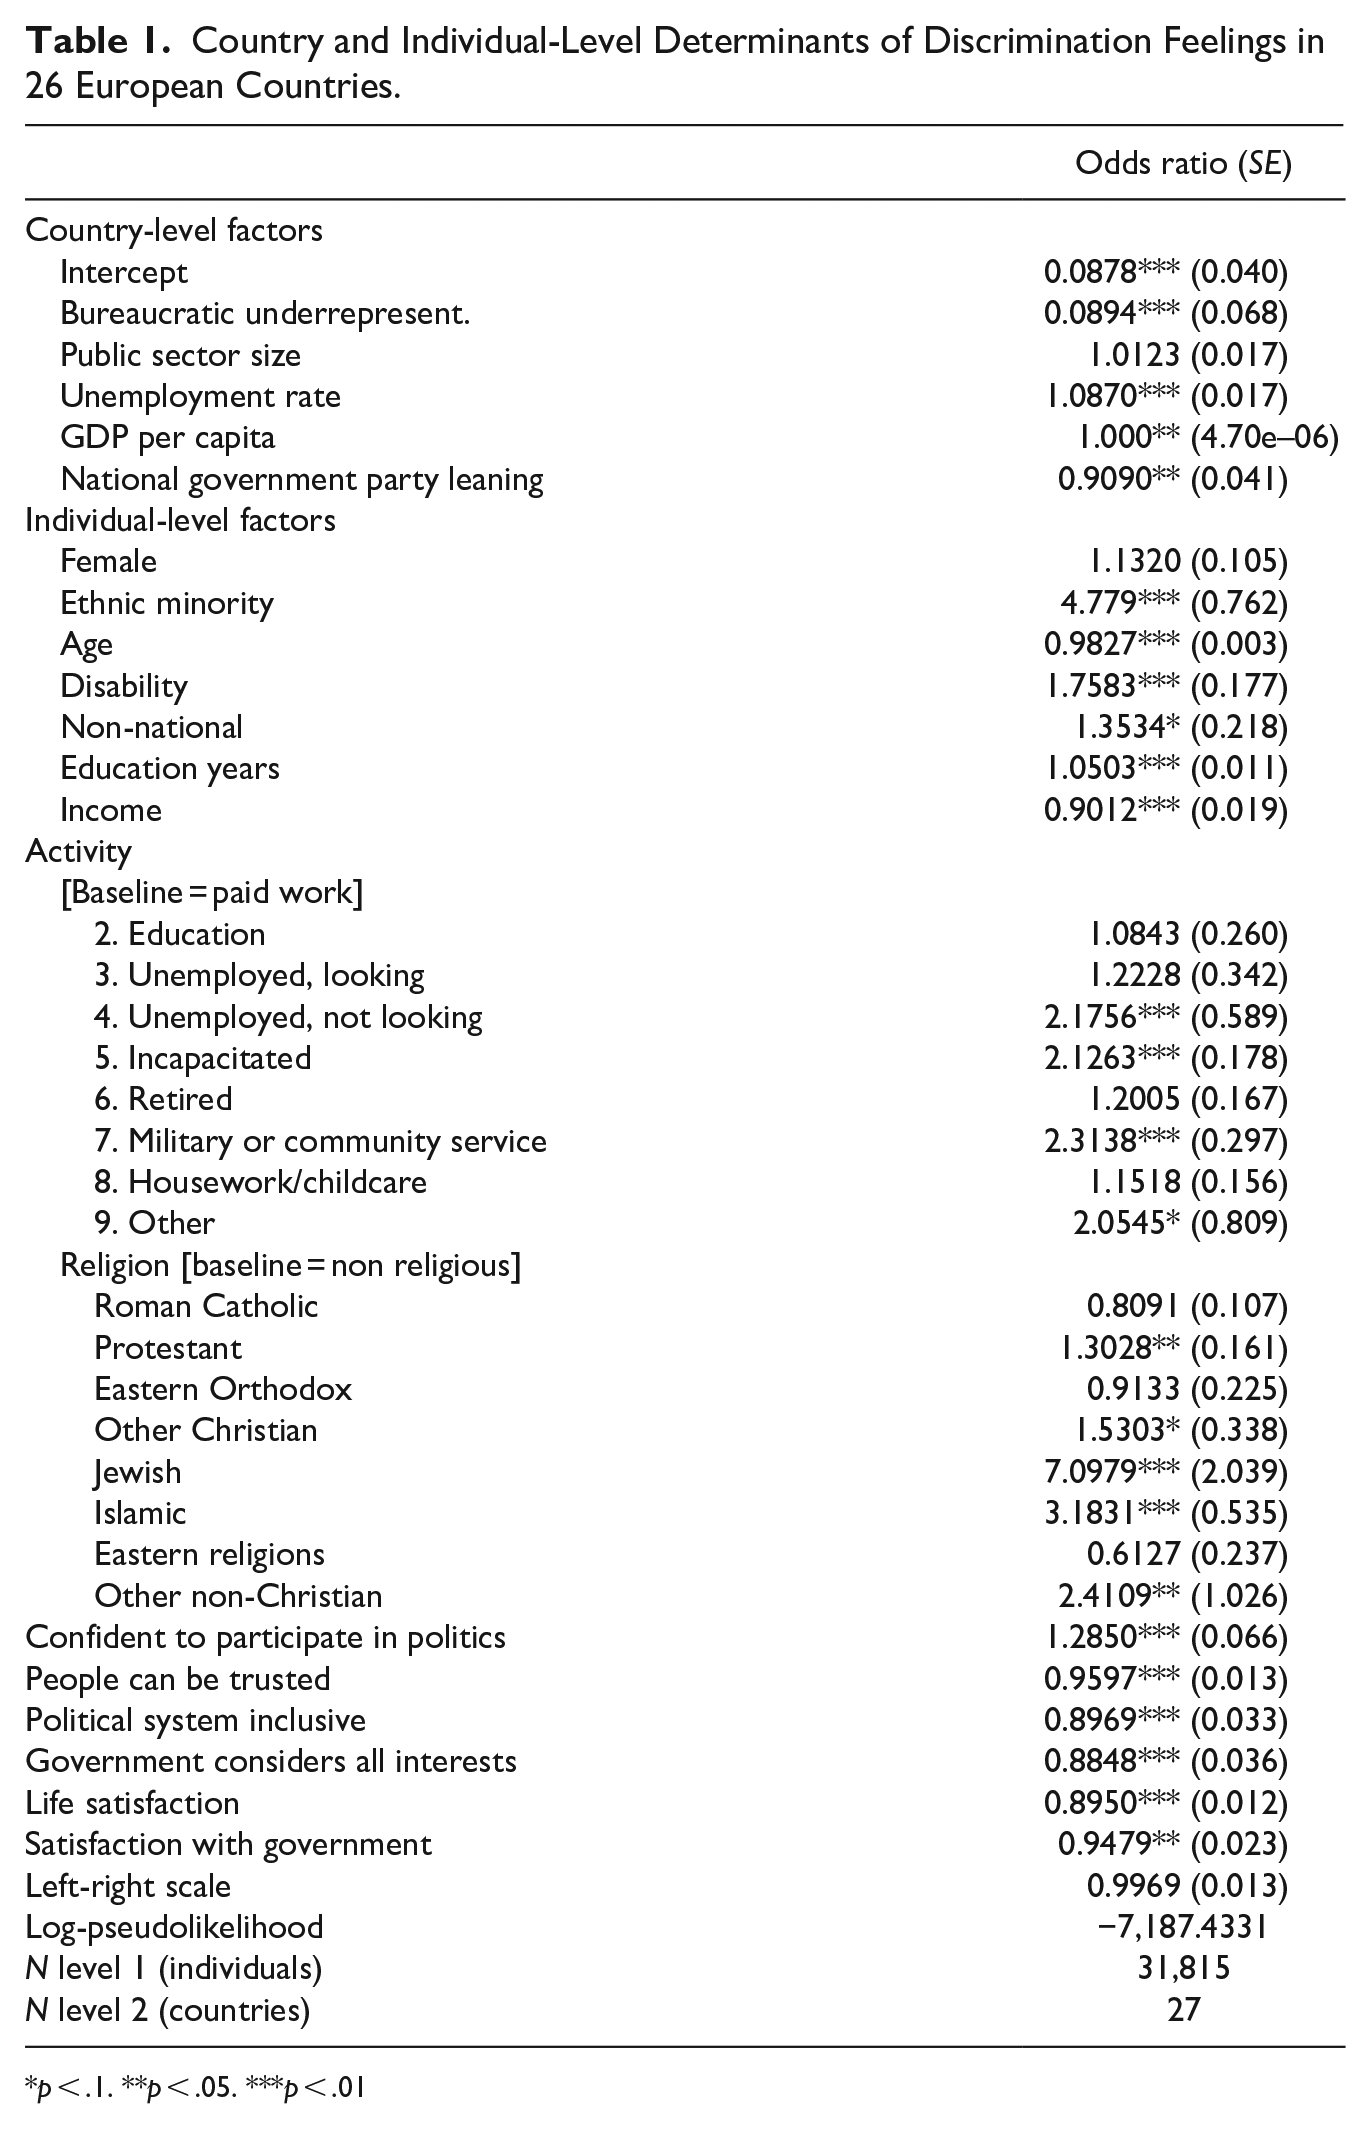
p < .1. **p < .05. ***p < .01
These results lead to the second part of the theoretical exploration, which aims at clarifying the mechanisms at play in the positive association between bureaucratic representation and feelings of discrimination (hypotheses 2a and 2b). While it is difficult to test a precise causal mechanism with cross-country statistical data, it is at least possible to find hints in certain directions. Along these lines, Table 2 tests the “backlash” hypothesis (2a) suggesting that traditionally powerful groups may have deepened discriminatory behavior in a context of growing diversity. For that, the model tests whether an interaction effect exists between being a member of these traditionally powerful groups (defined as not belonging to any of the five diversity dimensions conceptualized in this study) and higher levels of bureaucratic representation when explaining attitudes toward minorities. Model 1 tests attitudes toward immigrants, model 2 tests attitudes toward gays and lesbians, and model 3 tests attitudes toward working parents of children aged below 3 (which given the model and empirical data on childcare roles is implicitly testing attitudes toward young mothers). All three variables are taken here as continuous and hence standard multilevel regressions are run. While these three categories do not correspond exactly to the diversity dimensions in the index (as a result of the data available in the original survey), they do cover an important range of aspects that are informative enough to capture a possible backlash effect.
Attitudes Toward Minorities and Representative Bureaucracy in 27 European Countries.
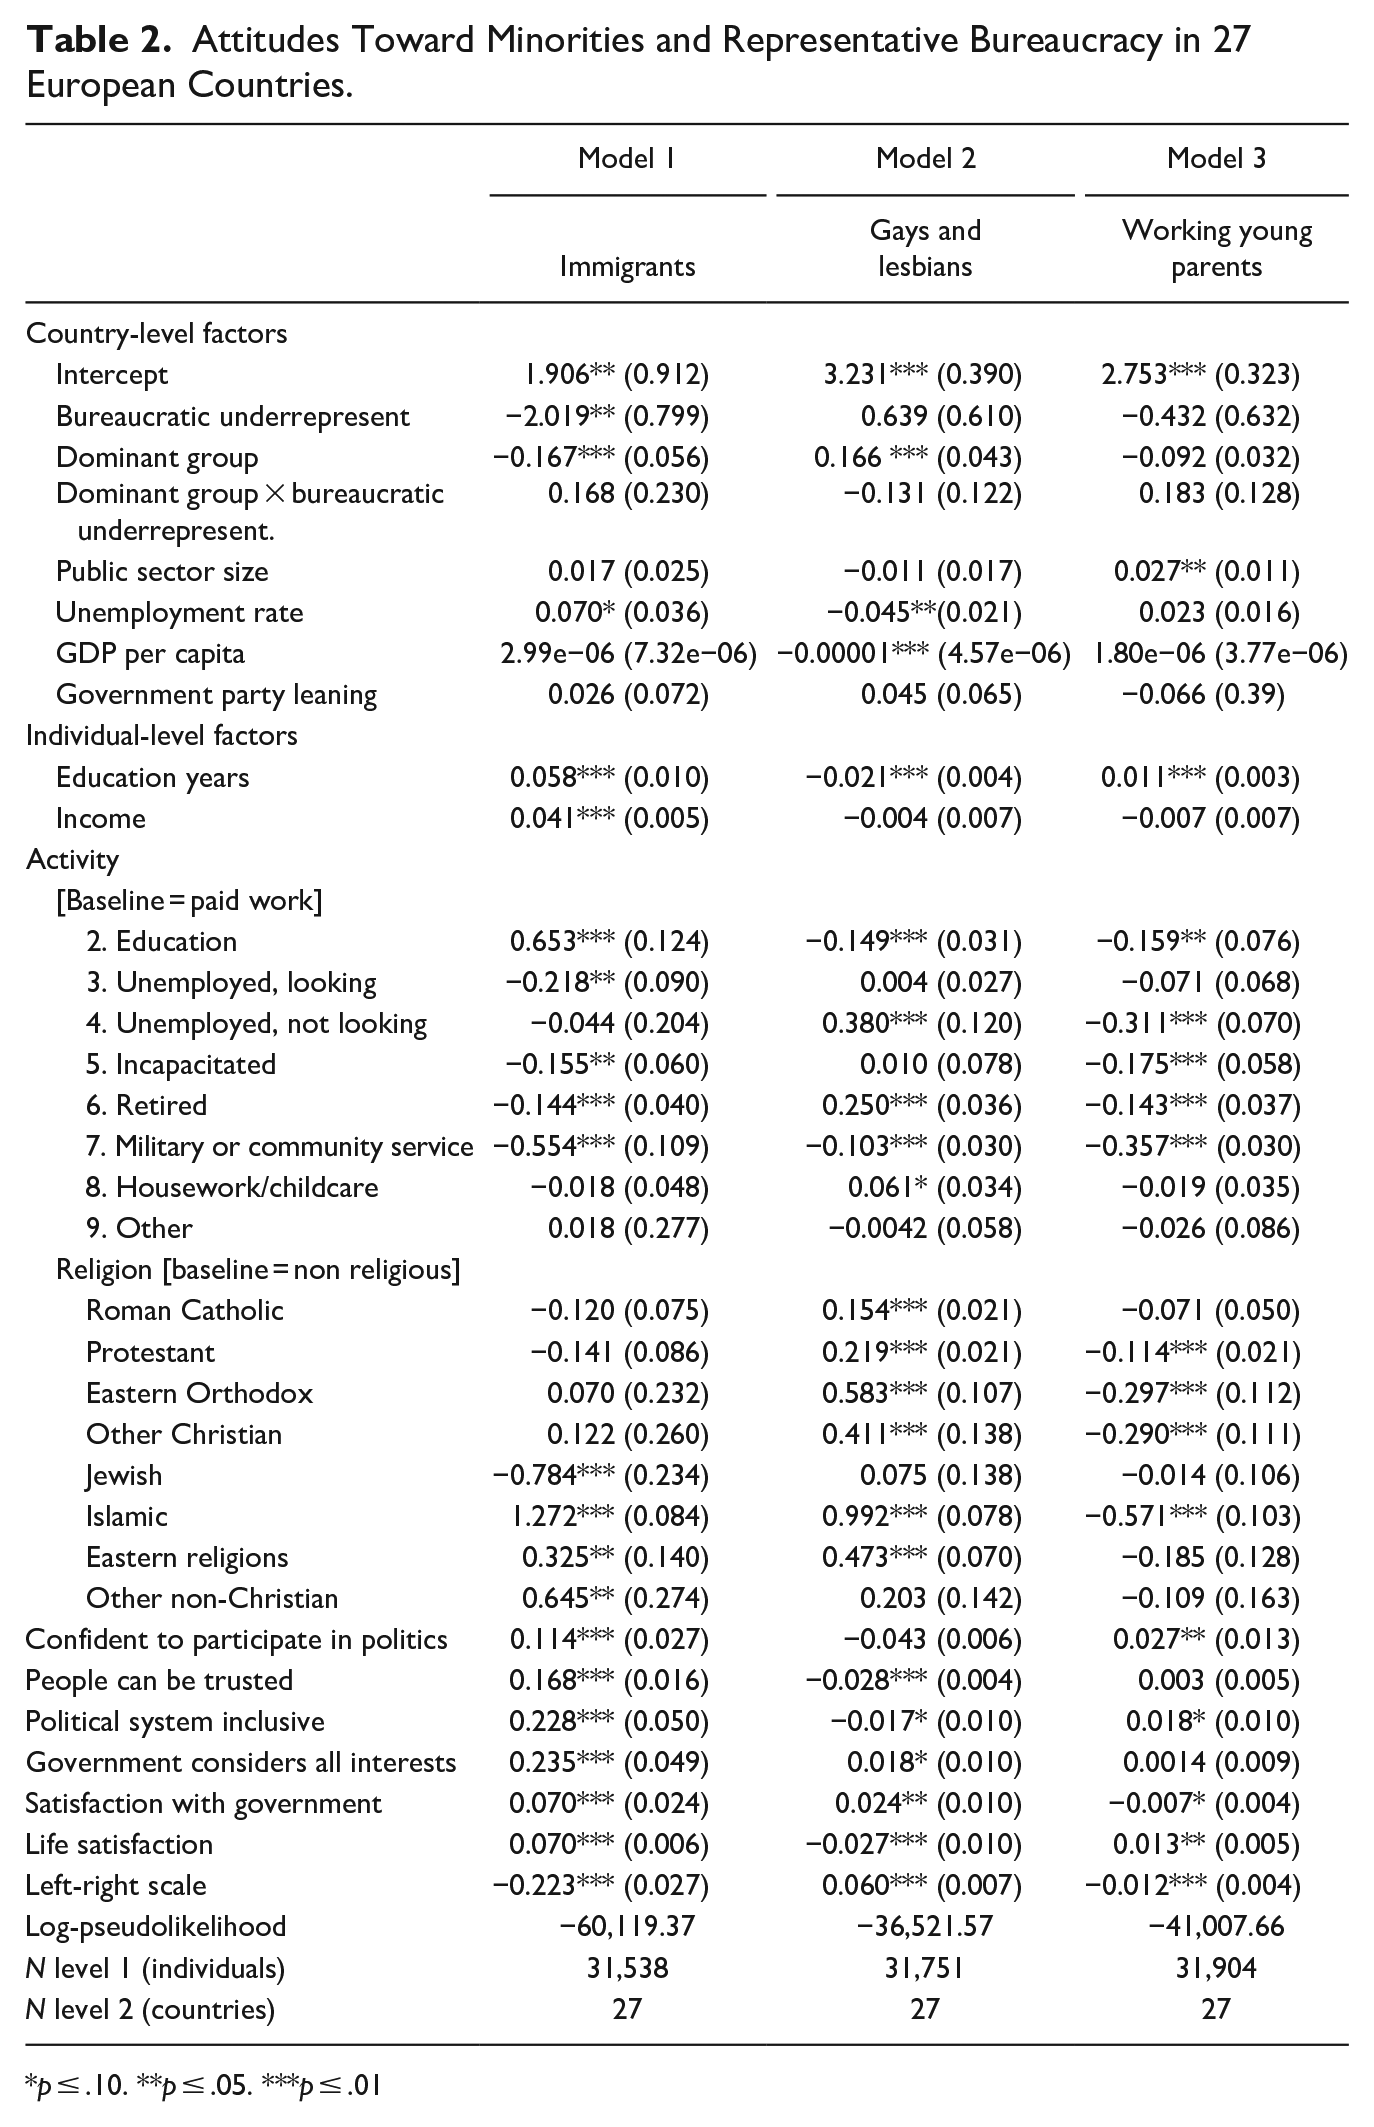
p ≤ .10. **p ≤ .05. ***p ≤ .01
If this effect were to occur along the lines of hypothesis 2a, a positive interaction term should be observed, indicating that there is a greater backlash from non-minority groups in countries where bureaucracies have become more representative of the social composition, other things equal. This effect is not observed in any of the models.
The patterns in Table 2 suggest that hypothesis 2a is unlikely to provide an accurate picture of the counterintuitive nature between representative bureaucracy and discrimination. Figure 1 helps examine more in detail the subjective nature of discrimination perceptions, which connects to the alternative causal channel laid out in hypothesis 2b. This channel speaks of an “awareness” effect, aided by the existence of a more representative bureaucracy. The scatterplot in Figure 1 shows a negative association between the number of individual-level determinants of reported discrimination (replicating the same individual-level model as in Table 1 on discrimination) and the level of bureaucratic underrepresentation, other things equal. The size of the slope is −0.25 and it is significant at the 99% confidence level. These patterns suggest that in contexts with more representative bureaucracies, individuals tend to consider a broader set of variables when reflecting on discriminatory behavior or institutions (and hence, its increased probability), arguably giving support to hypothesis 2b (Figures 2 and 3).
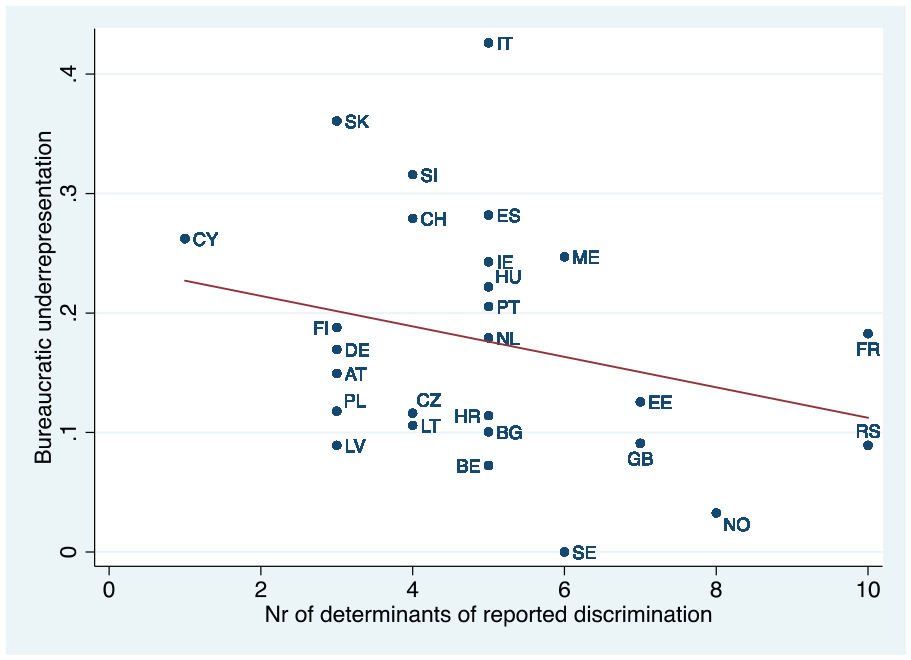
Representative bureaucracy and the number of determinants of reported discrimination in 27 European countries.
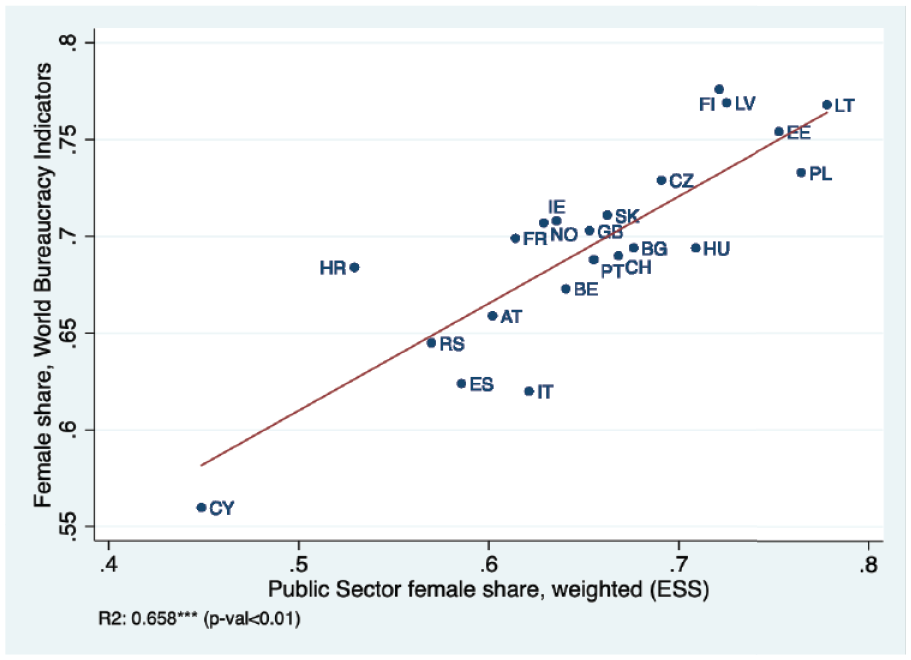
Correlation between public sector female share in the World Bureaucracy Indicators and the Index of Bureaucratic Underrepresentation (with ESS data) 2018.
Correlation between public sector female share in the World Bureaucracy Indicators and the Index of Bureaucratic Underrepresentation (with ESS data) 2018.
Discussion
Recent years have seen a growing interest in understanding how the rules, structures, and governance of public agencies reproduce or disrupt patterns of social inequality (e.g., Gooden, 2015). The levels of bureaucratic representation are considered a critical aspect shaping the allocation of policy outputs and a long list of socially desirable outcomes (Bishu & Kennedy, 2020). While the literature on democratic governance suggests multiple channels by which less representation may lead to increased exclusions, it becomes important to test whether this holds true with regards to subjective perceptions of exclusion as well (Andrews & Ashworth, 2015). The findings robustly show that after controlling for multiple possible determinants, individuals have a higher probability of reporting discrimination in countries with higher bureaucratic representativeness. In order to further understand this counterintuitive finding, two contrasting causal mechanisms are approximated: a backlash effect from traditionally powerful groups in countries with growing diversity in the public sector (Tolbert & Grummel, 2003; Yoder, 1991), and an awareness effect from potentially discriminated individuals, aided by this increased diversity. The findings lend more support to the second mechanism. This mechanism suggests that in more representative bureaucracies, individuals are aware of a larger set of possible discrimination dimensions and hence, more likely to report these feelings of exclusion. These results do not contradict traditional theories of representative bureaucracy for two main reasons. First, objective and subjective measures of discrimination are proven to differ substantially (Alteri, 2020; Naff, 1995). In fact, the results do show that individuals that consider the political system more inclusive have a reduced likelihood of reporting discrimination (see Table 1). This perception, however, does not straightforwardly correlate with objective levels of bureaucratic representation. This should prompt a deeper discussion on the role of citizen attitudes in connection to representation, and an expansion of the outcomes sought to be explained by representative bureaucracy theory. Second, the individual-level predictors do not suggest minorities in terms of nationality and ethnicity (the two most underrepresented dimensions) have a lack of awareness of discrimination in less representative settings, but only that more representative bureaucracies are likely to help problematize a larger set of issues at play.
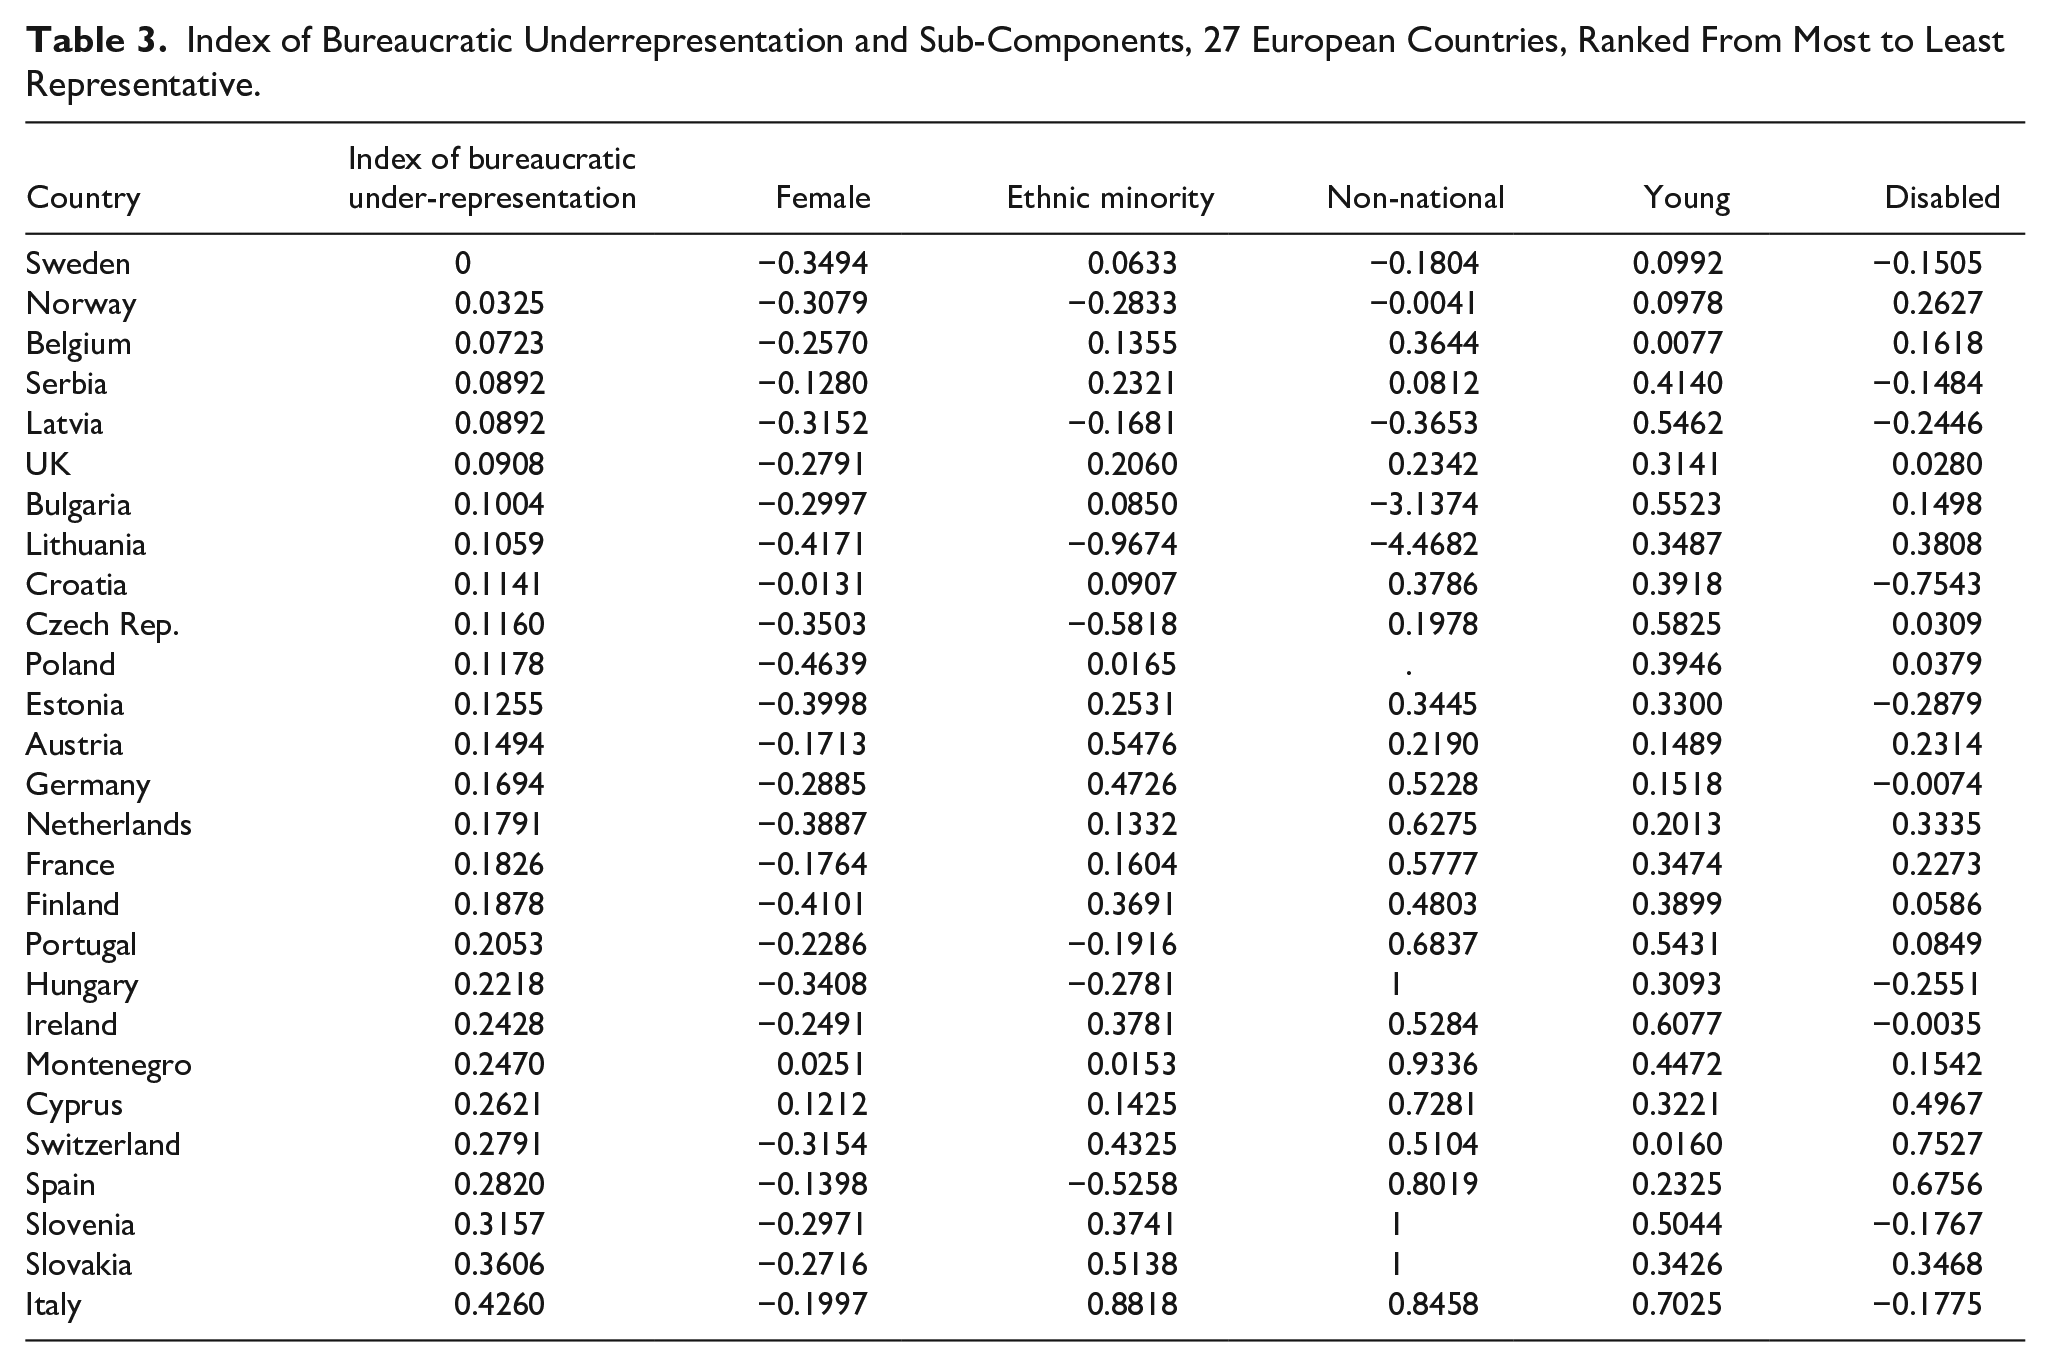
Given the exploratory nature of the study, several limitations should be acknowledged. The most important relate to the tradeoffs involved in the novel index that is here presented. The index includes only five diversity dimensions, which are enabled by the nature of the survey data available. Other critical aspects such as sexual orientation and identity, religion, socio-economic status, geographical origin (within national borders), or the intersection of diversities are here not included. This is due to the lack of necessary data or appropriate sample size. Here, all five dimensions are treated equally for the sake of comparability, but their relative importance varies by context, which suggests caution when interpreting the indices for individual cases. Similarly, the index does not take into account hierarchies or power dynamics, but rather takes the public sector as a whole. Valuable indices such as the World Bureaucracy Indicators contain deeper information in this regard, even if only for the gender dimension. Also, some of the dimensions captured rely on self-reported information (such as ethnicity and disability). While this is the only feasible way to capture them, self-perception introduces contextual and cultural biases. At the same time, it is important to highlight that the IBU index only captures overall underrepresentation. Overrepresentation can be captured through the individual sub-components (see, e.g., the case of gender in Table 3), but in the overall index, the depth of overrepresentation does not play a role. This is a conscious choice, as to avoid overrepresentation in one dimension counterbalancing underrepresentation in others. At the same time, it is worth noting that the index inherits the limitations embedded in the design and administration of the ESS survey, such as how key questions are phrased, which may induce different interpretations and reactions in different national contexts. Similarly, the findings on the relationship between bureaucratic underrepresentation and discrimination should not be interpreted outside the European context, given the relevance that context has for the topic (von Maravić et al., 2013). The patterns found here should be tested in the future in other socioeconomic and institutional contexts.
Index of Bureaucratic Underrepresentation and Sub-Components, 27 European Countries, Ranked From Most to Least Representative.
Concluding Remarks
The present exploratory effort highlights the importance of a multidimensional approach to the issue of representative bureaucracies in order to avoid reproducing the current biases in the literature. This study reinforces the idea that there is a multiplicity of dimensions to be considered and empirically incorporated in future research on the topic. In particular, more should be done to achieve valid cross-country comparable measures of diversity in the bureaucracy, in order to avoid inflexible and unidimensional approaches that fail to tackle the complexity of the institutional dynamics existing in each particular context.
Supplemental Material
sj-docx-1-aas-10.1177_00953997221137562 – Supplemental material for Representative Bureaucracy and Perceptions of Social Exclusion in Europe: Evidence From 27 Countries
Supplemental material, sj-docx-1-aas-10.1177_00953997221137562 for Representative Bureaucracy and Perceptions of Social Exclusion in Europe: Evidence From 27 Countries by Luciana Cingolani in Administration & Society
Footnotes
Acknowledgements
I am grateful to Johanna Mair, Michaela Kreyenfeld, Sébastien Mena, Mujaheed Shaikh, Ruth Ditlmann, Lukas Graf, and participants at the Hertie School’s Social Policy seminar series; Marlene Jugl and participants at Bocconi University’s SPS Seminar Series; and participants at the EGPA 2021 panel on “Administration, Diversity and Equal Treatment.” I am also grateful to the insightful feedback from two anonymous reviewers.
Declaration of Conflicting Interests
The author declared no potential conflicts of interest with respect to the research, authorship, and/or publication of this article.
Funding
The author received no financial support for the research, authorship, and/or publication of this article.
Supplemental Material
Supplemental material for this article is available online.
Notes
Author Biography
References
Supplementary Material
Please find the following supplemental material available below.
For Open Access articles published under a Creative Commons License, all supplemental material carries the same license as the article it is associated with.
For non-Open Access articles published, all supplemental material carries a non-exclusive license, and permission requests for re-use of supplemental material or any part of supplemental material shall be sent directly to the copyright owner as specified in the copyright notice associated with the article.