
Abstract
This research note measures the political attitudes held by Canadian Military Colleges (CMC) graduates, as compared with the general population on issues related to Canadian democratic life. It employs survey data from a sample of over 1000 alumni of CMCs, complemented by data on the general population from the 2021 Canadian Election Study. The results show that CMC graduates tend to be more interested in politics and have higher levels of political efficacy than a comparable sample of civilians. However, they are no more satisfied with democracy in Canada. They tend to favor personal, rather than institutional responsibility, and tend to be slightly more right-leaning than their peers. These results show some differences between the military population and the Canadian population, although the differential is insufficient for it to have a material bearing on civil–military relations in Canada. CMC graduates are neither alienated from nor dismissive of Canadian society.
Keywords
Research posits a gap in political beliefs between civilians and military populations. This gap matters insofar as soldiers’ and especially officers’ political neutrality and party affiliation have a bearing on civil–military relations in general, and how the military behaves relative to political executives from different political parties in particular. In the United States this gap is hypothesized to be consequential for American civil–military relations: it is thought that the US military is becoming alienated from American society and, in the process, has been adopting a misplaced sense of moral superiority. This observation has raised concerns over the provision of credible military advice or even the willingness of the military to implement policies that they do not believe are based on a full consideration of the advice offered. By comparison, the gap between civilian and military attitudes has been postulated to be smaller among allies, yet perceived and constructed by the military as larger than it is (Steinbrecher & Biehl, 2020).
In Canada, the debate regarding a military-civilian gap commonly relates to the amount of autonomy that the military is given to engage in professional self-regulation, or, more often, the degree to which the military should be required to implement social policy changes that some believe could erode combat effectiveness (Leuprecht, 2011). Other issues that affect operational and institutional effectiveness and thus drive the gap include resource allocation, procurement preferences, bureaucracy, government not taking national security sufficiently seriously, and investments in the defense industry. By way of example, Okros et al. (2008) found Canadian Armed Forces (CAF) leaders to have extremely low levels of confidence in either their political masters or senior government officials, a conviction that senior officer were being listened to by the political authority, and that government decisions did not reflect the national interest, or at least Canada’s national security interests. Plenty of reasons, in other words, to explore the civilian–military gap in the Canadian context.
Previous research on the civilian–military gap in political attitudes has been explained as an effect of self-selection into the military institution, or institutional socialization manifesting as the impact of military service on attitudes held by uniformed members. Military colleges play a special role in this regard: candidates must go out of their way to self-select, and the institution then socializes them systematically over several years, by design. Does this have ramifications for the profession of arms and civil–military relations in Canada? Which begs the question: Are Canadian Military College (CMC) graduates different from Canada’s general population, and if so, to what extent? In particular, does this sub-sample of the profession of arms in Canada reflect fundamental beliefs in Canadian society writ large?
This research note measures the political attitudes held by CMC graduates, as compared with the Canadian general population on issues related to Canadian democratic life—including their levels of political interest, satisfaction with democracy, feelings of political efficacy, personal vs. institutional responsibility, and ideology. It employs survey data from a sample of over one thousand alumni of CMCs, complemented by data on the general population produced by the 2021 Canadian Election Study (CES). A methodological novelty of this study is thus to test whether these CMC graduates differ from a comparable cohort of the Canadian population with a similar education level, while controlling for intervening factors such as age, Indigeneity, province, and place of birth.
The results show that CMC graduates tend to be more interested in politics and have higher levels of political efficacy (believing the government cares what “people like me think”) than a comparable sample of civilians. However, they are no more satisfied with democracy in Canada. As one might expect based on the U.S. research on civil–military relations, they tend to favor personal, rather than institutional responsibility, and tend to be slightly more right-leaning than their peers. Indeed, these results do show some differences between the military population and the Canadian population, although qualitatively and quantitatively the differential is insufficient for it to have a material bearing on civil–military relations in Canada. Our survey research affirms that CMC graduates are neither alienated from nor dismissive of Canadian society.
The findings broadly align with a Canadian study 20 years ago, which was limited in scope to a much smaller subset of mid to senior officers who had been identified for further career advancement, which necessarily had bearings on the generalizability of results (Okros et al., 2008). Its limitations to officers who went through CMCs notwithstanding, the present study affords a much wider, more representative sample from graduates across age ranges spanning several decades. While the finding that attitudes among military personnel are necessarily heterogeneous is well established, so too is the finding that military attitudes nonetheless diverge from those of society (Ender et al., 2014). This research note questions to what extent, and the consequences of that divergence for the profession of arms and civil–military relations in Canada.
The Civilian–Military Gap
The gap in attitudes between members of the military and civilian society and its implications for civil control of the armed forces, especially in an increasingly militarized American society, is a matter of long-standing debate in U.S. civil–military relations (e.g., Lasswell, 1941). By contrast, civil–military relations in Europe tend to be more concerned with civic participation (e.g., Cottey et al., 2002). Initially hypothesized by Huntington (1957) and Janowitz (1960), the literature on the existence and nature of the gap garnered empirical attention in the 1990s following the end of the Cold War and the end of conscription in the United States (Holsti, 1998). 1 Feaver and Kohn’s (2001) study on the size and character of the gap proved to be particularly seminal, as it was the first large scale survey-based study aiming to test the existence and nature of the gap in the United States. The debate gained further traction after 9/11 and the subsequent Iraq and Afghanistan wars, and was studied in cross-sectional research on U.S. military cadet and civilian populations (Rohall et al., 2006).
However, just how problematic differences between the military and the civil society are up for debate. For instance, Feaver and Kohn’s (2001) study, as well as Jennings and Markus’, yielded limited evidence of such a gap, although Jennings and Markus (1977) had previously postulated implications for political trust and attention frames (i.e., a higher awareness of current political issues and threats). Steinbrecher and Biehl (2020) find the supposed gap to be more a matter of perception than reality; that is, military personnel perceive the gap to be far greater than it actually is.
For the United States, there is also no consensus on the sources of a civil–military gap (Shields, 2020), and whether they are driven by selection or socialization effects (Rohall et al., 2006). Both Huntington and Janowitz argue that differing values and priorities between the civil society and the military has led to tensions with respect to decisions around military activity (Burk, 2002; Holsti, 1998; Huntington, 1957; Janowitz, 1960). The gap was also suggested to stem from tensions created by the contrast between the strict, tightly-coupled communitarian culture fostered by the military and the more relaxed, individualistic culture of civil society (Ricks, 1997; Schreiber, 1979).
In addition, some have observed that differences between the military and civil society can often be explained by a self-selection effect. People who join the military do so because of pre-existing political and ideological values instead of acquiring them because of socialization within the military (Dorman, 1976; Rohall et al., 2006). The military tends to draw primarily from certain political inclinations, gender and education levels (among other demographic factors), which potentially results in considerable variation in values between the military and civil society (Ricks, 1997). Civil–military attitudinal gaps in the U.S. have been shown to be driven by gender, political party, and the political position of respondents on the left-right ideological spectrum (Laurence et al., 2016). Rohall et al. (2006) observed explanatory effects of the gap between military cadets and civilians as a function of gender and political affiliation, which led the authors to conclude that the gap was driven by a selection effect rather than differences in military (as opposed to civilian) culture per se. This was particularly relevant insofar as the civilian–military differences observed were driven by the over-representation of men among West Point cadets. For other attitudinal predispositions, (American) military culture as an explanatory variable is mitigated once political ideology and religious affiliation are controlled for (Ender et al., 2016). Since self-selection is necessarily a more significant factor in militaries whose country does not have conscription (Klinger & Chatagnier, 2013), all-volunteer forces are an interesting object of study because they allow us to control for selection effects (Szvircsev Tresch & Leuprecht, 2011). To that end, Bachman et al. (2000) found that both socialization and self-selection played a role in influencing values and opinions within the military. Moreover, both generation and cohort effects are at work, which can be difficult to disentangle (Ender et al., 2014; Okros, 2020): the generation analyzed can also influence findings on socialization and self-selection (Teigen, 2006).
Complicating matters is that differences in values and priorities between the military and civil society are intermediated by current affairs. For example, Rohall et al. (2006) observed that the terrorist attacks on and following 9/11 resulted in a “civil–military fusion” in which views became considerably more aligned between both sides. On a similar vein, Teigen (2007) found that campaigning strategies can be effective in temporarily swaying veterans’ political preferences, thus potentially coloring survey results taken around election periods.
Research Contributions
This research note makes three important contributions to this literature on the civil–military gap. First, the focus of this study on
Second, most studies on the civil–military gap focus on the American case. That is hardly surprising, since the US military is a trillion-dollar industry. A salient exception is Haltiner and Weibull’s study of cadets and civilian students in 11 European countries, Turkey and South Africa, which found variation in values between the military and civil society to depend on the country’s culture rather than the institutions themselves (Haltiner & Weibull, 2007). The
Third, cadets have often been the subjects of these studies (Snider et al., 2001), including in the Canadian context (Chouinard & Garnett, 2023; Nicol et al., 2007; Scoppio & Luyt, 2016), in part due to their easy access by academic researchers. However, we are unaware of another cross-sectional survey of
Nonetheless, the sample has an important limitation: it gives us limited traction on socialization effects of military colleges because it is not designed to control for attitudes between military college graduate and Direct Entry officers from civilian universities. The latter population group can be difficult to access in a representative sample size. In the Canadian context specifically, military colleges graduates comprise 20% to 30% of military officers; the broader validity of findings can thus be difficult to extrapolate for the majority of officers, let alone for the corps as a whole.
Hypotheses
This research note compares the fundamental political attitudes of CMC graduates with the general population. We study and compare five variables: political interest, democratic satisfaction, political efficacy, personal vs. institutional responsibility, and ideology.
The first variable,
The second variable,
The third factor considered is
The fourth variable is value placed on
The final variable tested is
Method
In Canada, as elsewhere, national security provisions and the closed nature of government bureaucracy make it difficult for academics to survey serving military members (Goldenberg, 2020; Richter, 2020; Soeters et al., 2014). Instead, the researchers leveraged the alumni association of CMCs. In Canada, students selected for the Regular Officer Training Plan (ROTP) may be assigned to study at one of Canada’s two (formerly three) degree-granting military colleges—the Royal Military College of Canada in Kingston, Ontario or the Royal Military College in St. Jean, Quebec. A former military college (Royal Roads Military College) near Victoria, British Columbia closed in 1995. The sample thus also harnesses some benefits of a most-similar systems design by enabling some degree of control and comparison for effects across military colleges in the same country. Upon completion of an undergraduate degree, students are commissioned as officers in the Canadian Armed Forces. All three environments (Army, Navy, Air Force) study together at the Colleges.
This research note relies on data from two surveys: an original survey of CMC graduates (term used in this research note for any former students at CMCs), and the CES as a measure of the general Canadian population.
The survey of CMC graduates was fielded online using the Qualtrics platform for a period of two months, between March 23, 2023 and May 23, 2023. CMC graduates were contacted through the Royal Military Colleges Alumni Association, which agreed to contact former Officer Cadets by email directly through its listserv. CMC graduates of any class, from any of the CMCs, were eligible to participate. After reading the recruitment letter, participants could choose to complete the survey, or not; 1050 survey completions were recorded, but only 809 were usable for analysis. The higher-than-normal number of non-completions may be a function of both the length of the survey and an age range that included many older prospective respondents. See Appendix B for descriptive data on these respondents.
The scope of respondents does not cover all those who have served in the military (ex. Non-Commissioned Members), and it does not cover all officers (e.g., direct entry regular force officers), or even all students, since a degree of selection takes place for those who fail to graduate, including some who are unwilling to accept or adopt the worldview promoted through professional socialization. 2 We endeavor to control for this limitation by studying a comparable cohort from the Canadian population. While a fuller sample may be desirable, obtaining access to the necessary email databases, and permission to publish results without constraints imposed by the Department of National Defense would be near impossible; so, for the purpose of both, a proof of concept to survey CMC graduates, and a subset of former and current military officers, this sample and research design is as robust as possible in the Canadian context. The sample and survey design nonetheless gives us unprecedented insights into the attitudes of CMC graduates who, in most cases, went on to serve in leadership roles of the military, as they were involved in shaping the Canadian Armed Forces during their years of service.
The CES is used to compare these CMC graduates with the general Canadian population. 3 The CES is fielded before and after each federal election in Canada by a consortium of scholars via telephone and internet. For this study, the 2021 CES is used. This does not correspond directly to the timeline of the fielding of the ex-Cadet survey, so it must be cautioned that any differences between groups could be related to the different timelines. However, since we are studying fundamental attitudes (rather than more fast-moving attitudes like vote choice or partisan affiliation), it is less likely these would change among the general population over the course of roughly 1.5 years. This survey includes questions about a variety of aspects of Canadian political life and the raw data are freely available to researchers. Note that it is impossible to control for who among the general population surveyed had served in the military, though other data suggests that percentage of Canadians who served in the military is about 1.5%, and an even smaller percent would have served as officers, and only about 30% of officers graduate from CMCs. 4
For this study, we are mainly interested in how CMC graduates who became military officers differ from the general Canadian population, and from a comparison group of similarly educated individuals. We are interested in their fundamental attitudes toward civic life to respond to the question of whether the military attracts and/or produces more or less civic-minded individuals, given their aptitude for, and experience of, serving Canada through their military careers. Furthermore, we are interested to know whether they are ideologically different from the general population.
Five major variables that capture civic attitudes are studied, using the following survey questions (see Appendix A for further details about question wording, response options and re-coding):
POLITICAL INTEREST—“How interested are you in politics GENERALLY? Use a scale from 0 to 10, where 0 means no interest at all, and 10 means a great deal of interest.”
DEMOCRATIC SATISFACTION—“On the whole, how satisfied are you with the way democracy works in Canada?” (categorical)
POLITICAL EFFICACY—“The government does not care much about what people like me think.” (This is measured across five categories, but tested as a three-category variable in the ordered logistic regression models.)
PERSONAL vs. INSTITUTIONAL RESPONSIBILITY—“People who don’t get ahead should blame themselves, not the system.” (This is measured across five categories, but tested as a three-category variable in the ordered logistic regression models.)
IDEOLOGY—“In politics, people sometimes talk of left and right, where 0 means the left and 10 means the right, where would you place yourself on this scale?”
We are interested in predicting how these variables differ between groups (the military sample and the civilian sample). Since all CMC graduates, by definition, have some post-secondary education, only those with post-secondary education from the general population are included in the results below. Since the general population and CMC graduate groups are likely to also be different according to other key socio-demographic variables, thus we control for: age, gender, Indigenous background, whether the respondent was born in Canada, and the province they come from. See Appendix A for question wording for each variable in both surveys.
For some of these variables, the number of respondents among the CMC graduate population is quite small, especially the Indigenous population (only 19 self-identified Indigenous CMC graduates responded to the survey). For this reason, additional models without this variable are found in Appendix D. While the numbers for women and those born outside of Canada are also small, they are a larger percentage of the total respondents (approximately 10% of the sample of CMC graduates).
Results
Political Interest – “How interested are you in politics generally?”
It was hypothesized that CMC graduates of the CMCs would have a greater level of political interest. Comparing the data from the CMC graduates survey with the general population with a comparable education level, we see that CMC graduates do have a higher mean political interest level (7.36 on a 0–10 scale) compared with the general population (6.80) (Figure 1).
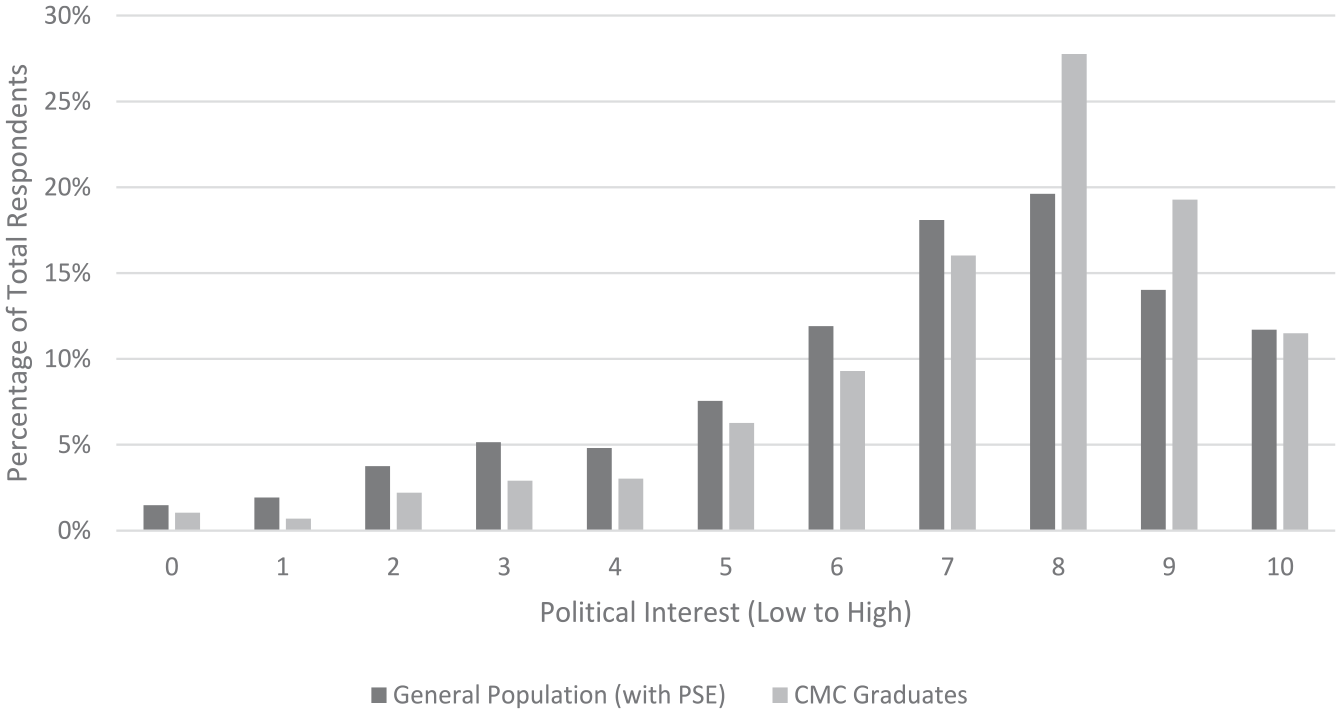
Political Interest.
However, we know that there are other factors that distinguish CMC graduates from the general population. Thus, regression models compare CMC graduates with the general population that has post-secondary education as well. In addition, controls are included (see Table 1, for all five main dependent variables, and the table in Appendix C for models with groups split).
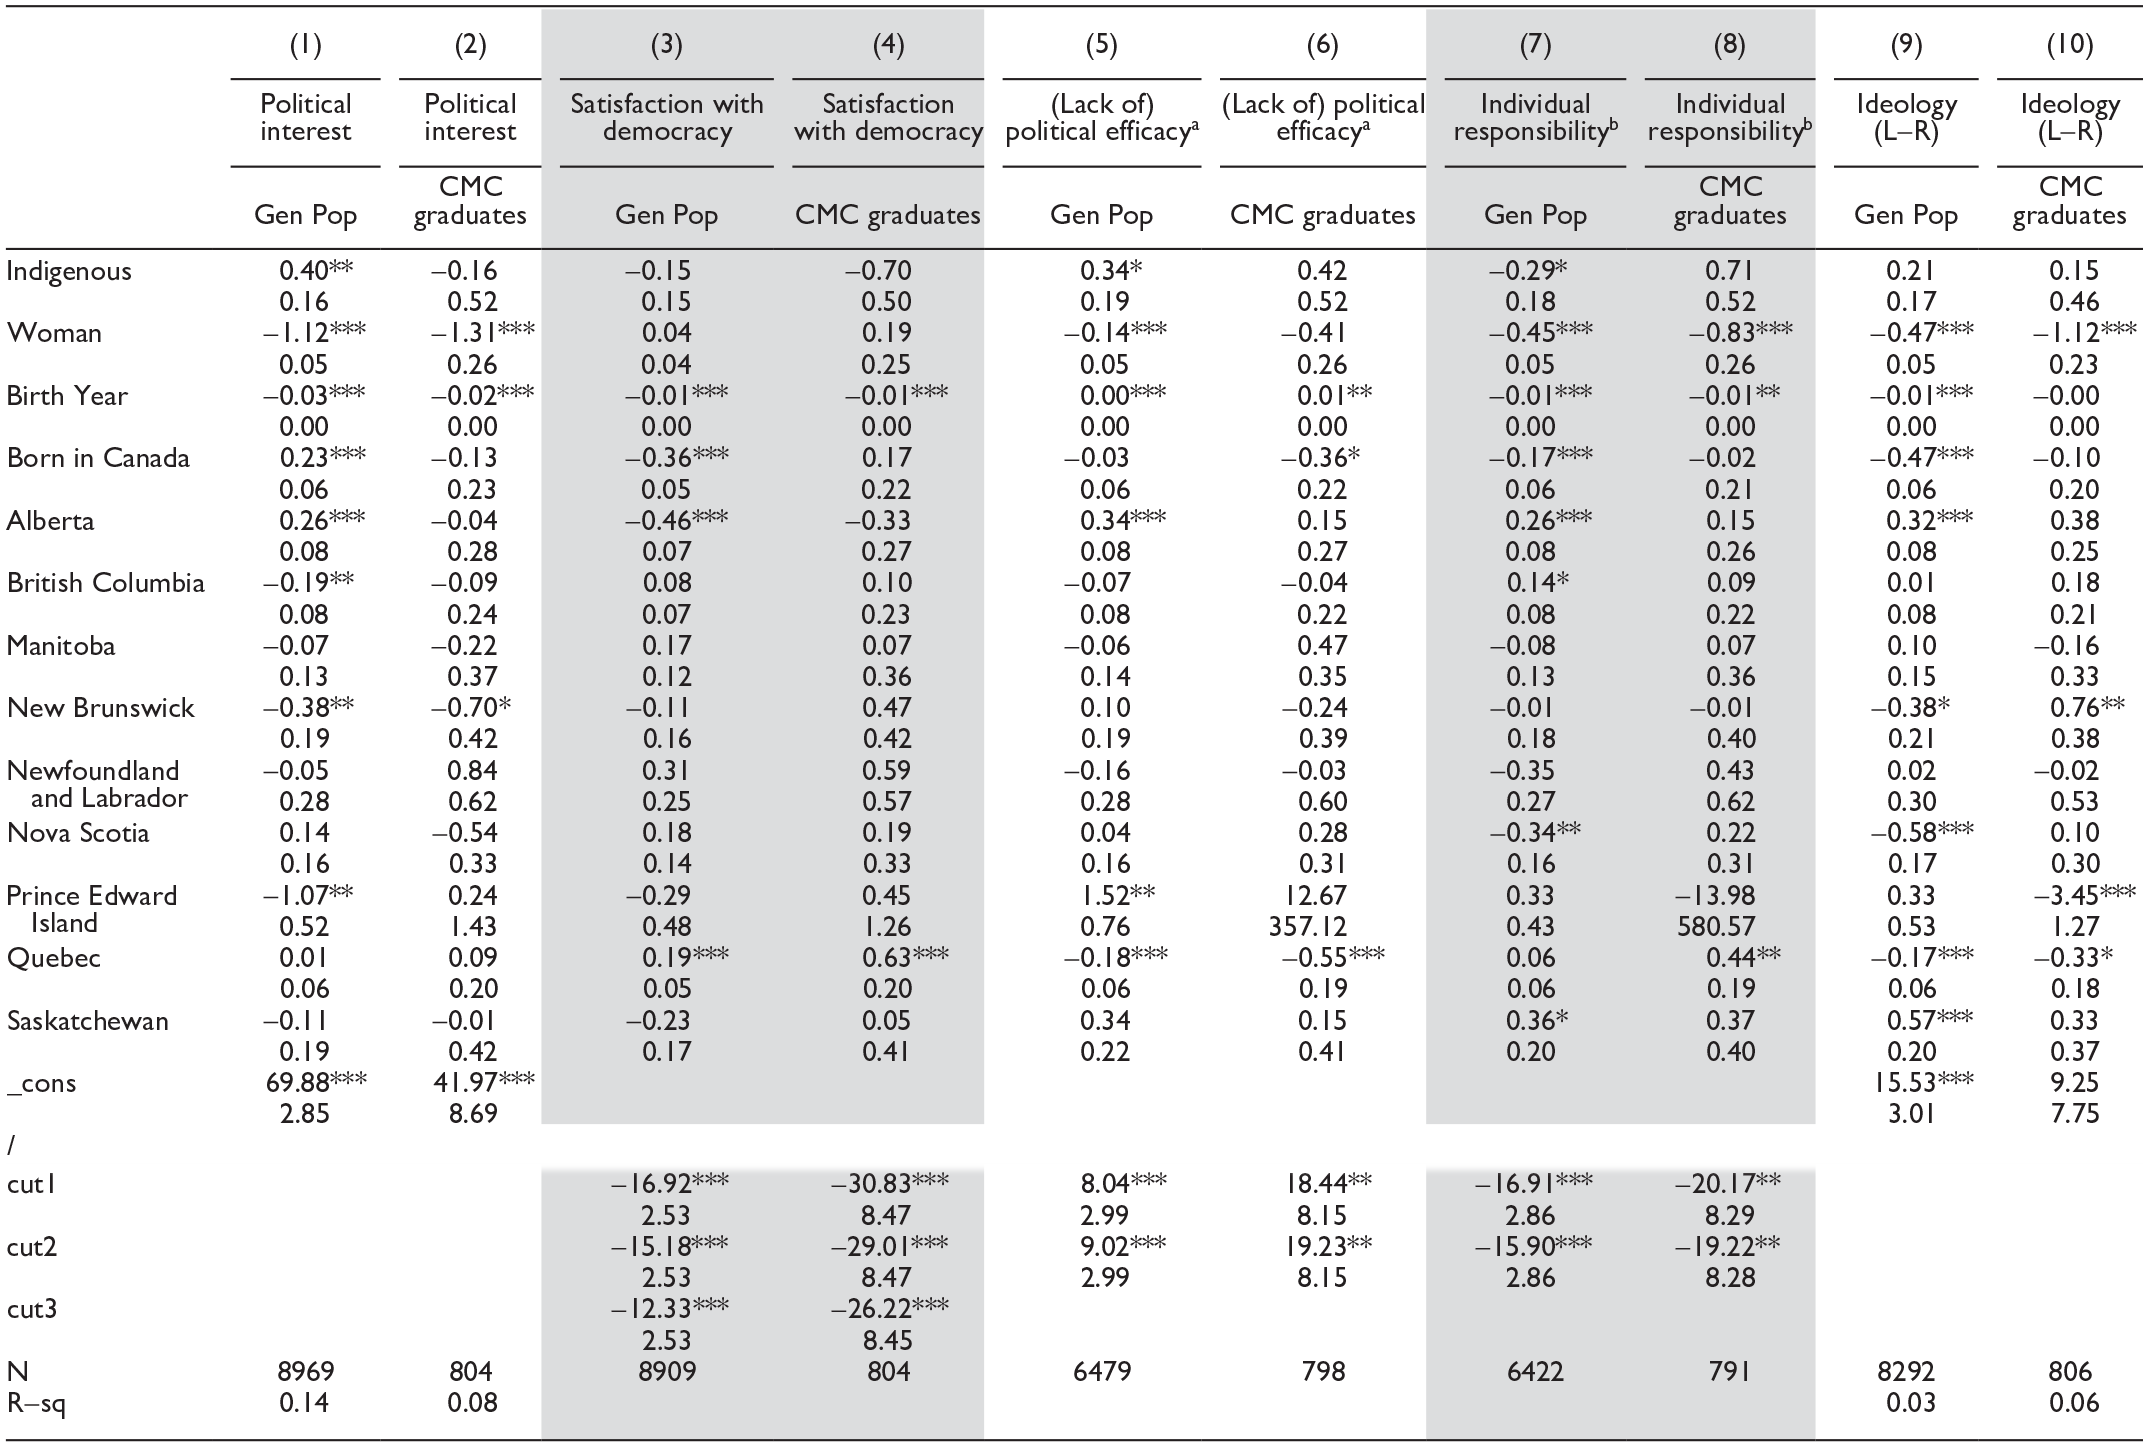
Regression Models With Control Variables (Combined General Population and CMC Graduates).
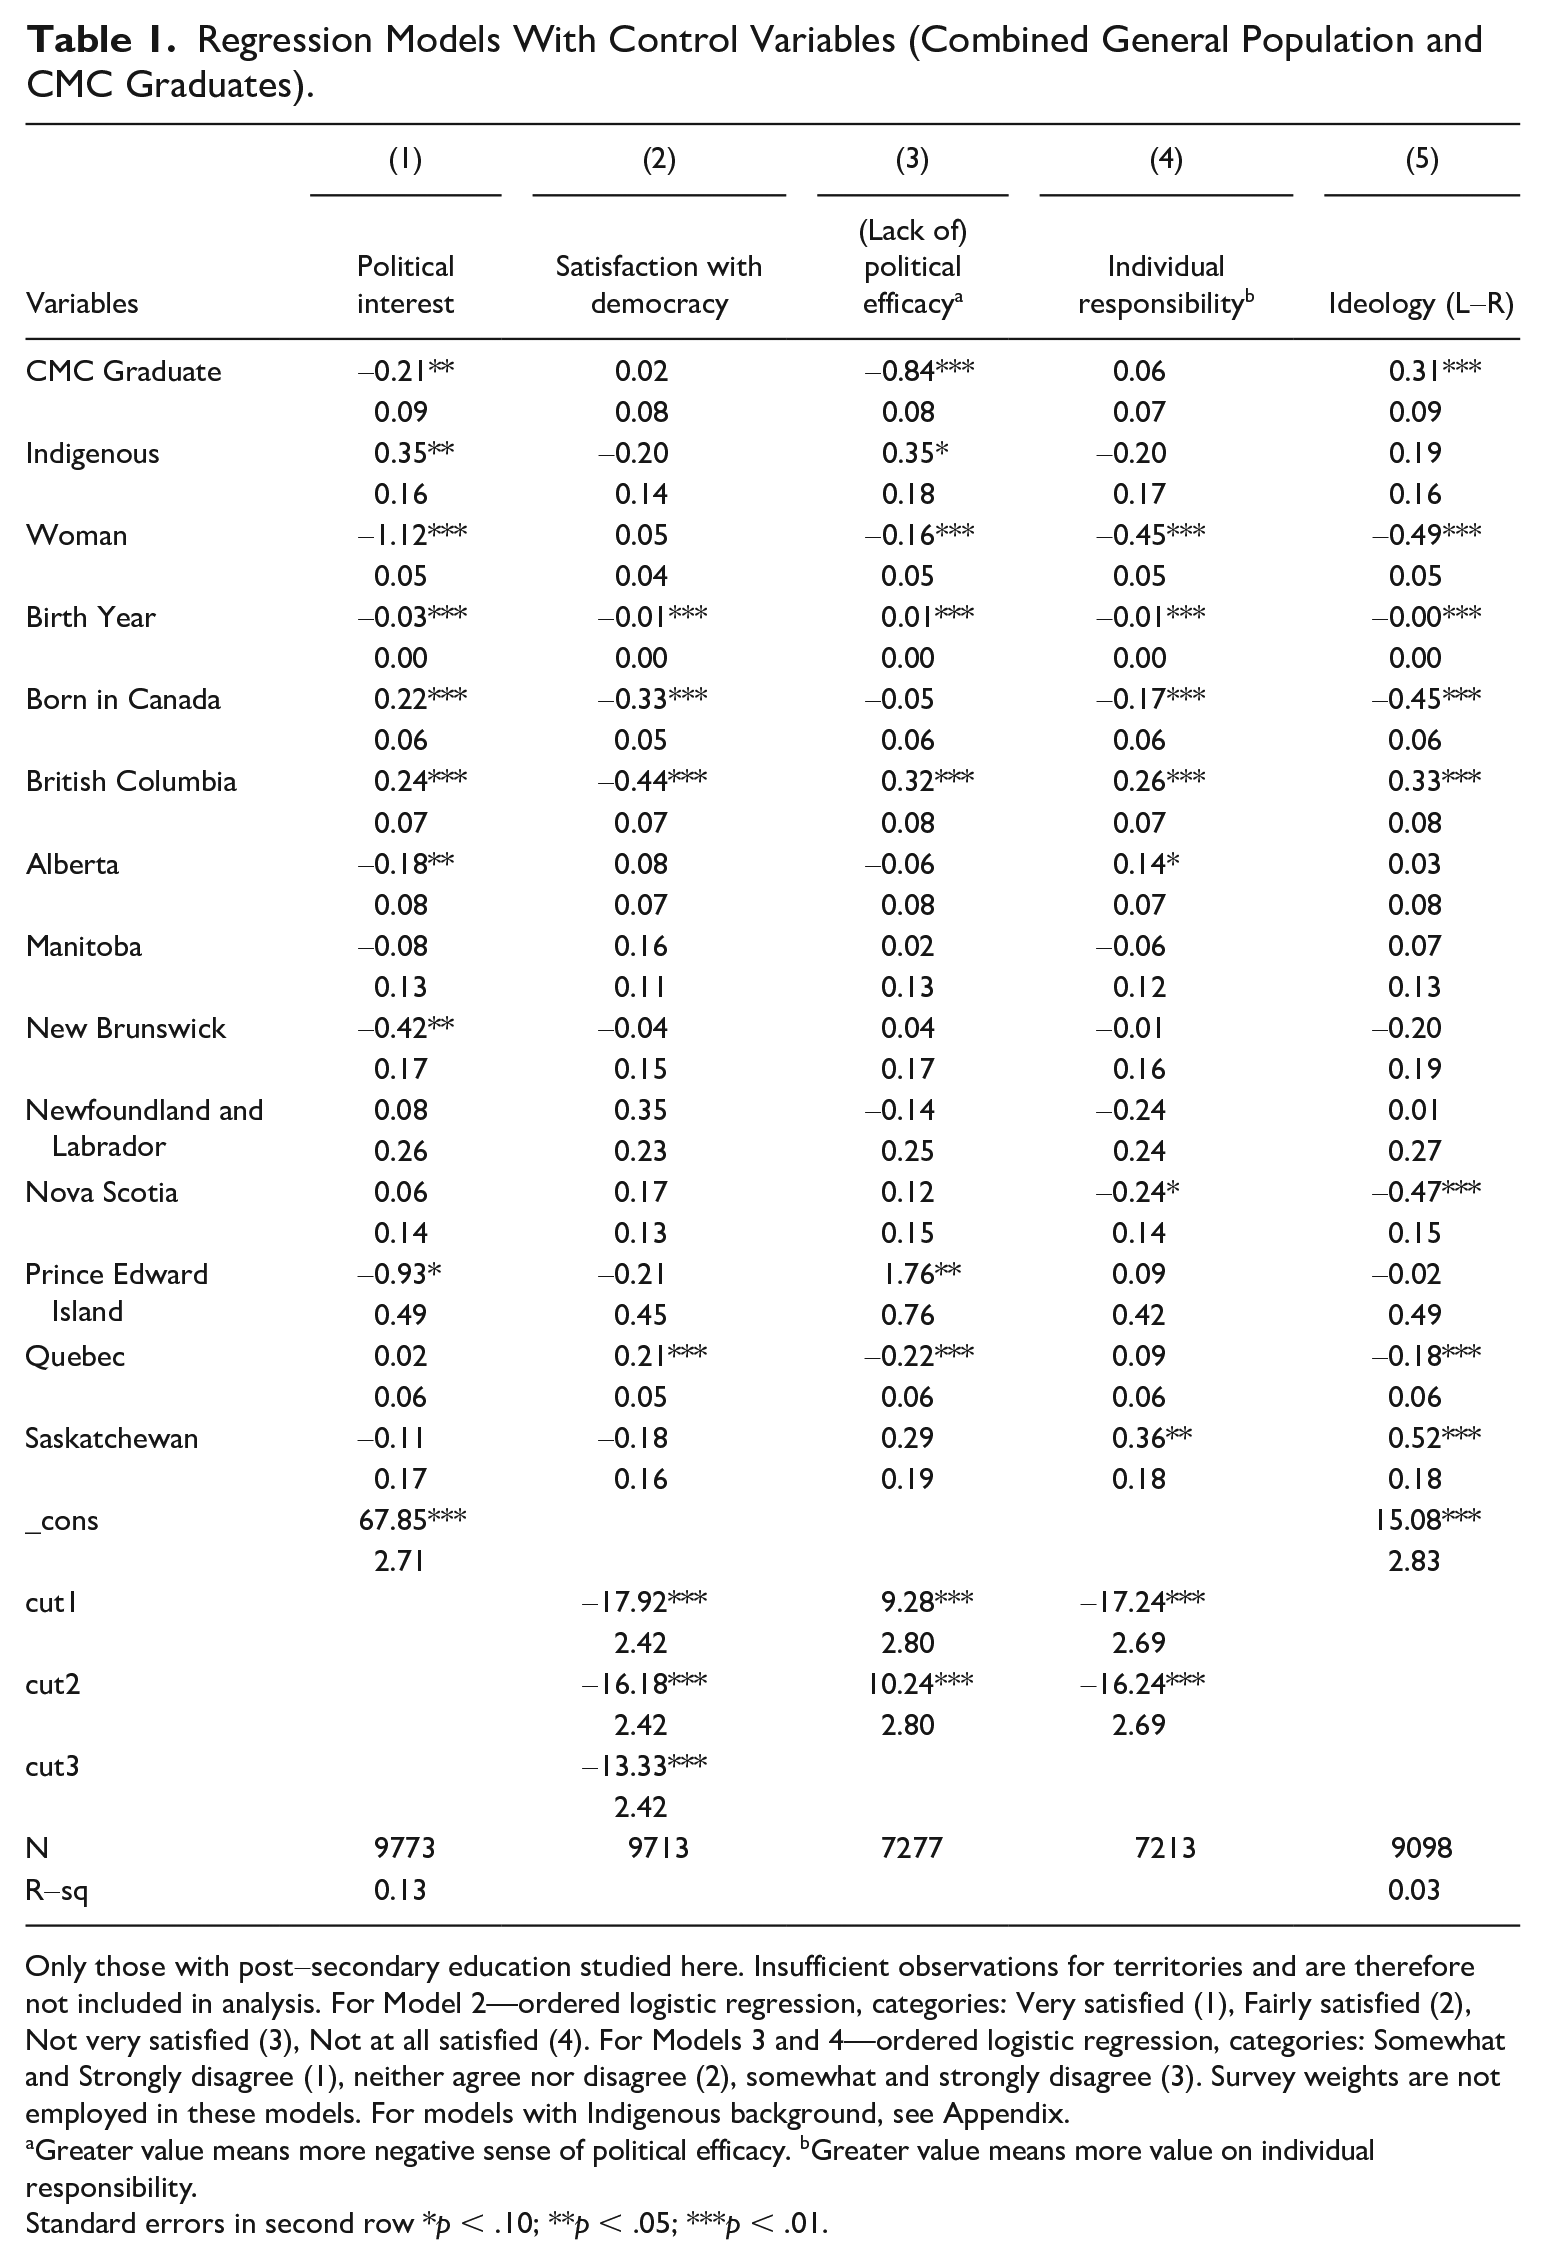
Only those with post-secondary education studied here. Insufficient observations for territories and are therefore not included in analysis. For Model 2—ordered logistic regression, categories: Very satisfied (1), Fairly satisfied (2), Not very satisfied (3), Not at all satisfied (4). For Models 3 and 4—ordered logistic regression, categories: Somewhat and Strongly disagree (1), neither agree nor disagree (2), somewhat and strongly disagree (3). Survey weights are not employed in these models. For models with Indigenous background, see Appendix.
Greater value means more negative sense of political efficacy. bGreater value means more value on individual responsibility.
Standard errors in second row *p < .10; **p < .05; ***p < .01.
The results in Table 1, Model 1, show that CMC graduates do not have higher levels of political interest than the general population (that also has post-secondary education), when controlling for other variables likely to influence the respondent’s level of interest. In fact, the coefficient is negative. Given that the two groups are comparable in the other control variables except for gender (The sample of CMC graduates is only 9% women vs. 55% women in the general population sample, see Appendix B), and women appear to generally have lower political interest than men in both samples (for CES only—women mean interest 6.14, compared with men mean interest 7.5), gender could be driving this direction change in the coefficient. In fact, the predicted political interest for women is nearly indistinguishable (overlapping 95% confidence intervals) when comparing the two sample groups for only this subgroup. In fact, when testing the two groups (general population and CMC graduates) separately (Appendix, Table 1, Model 1–2), we do not see any large differences in terms of direction of the relationship with political interest for other control variables. For both groups, women and younger respondents (larger birth year) had lower interest in politics.
Satisfaction With Democracy – “On the whole, how satisfied are you with the way democracy works in Canada?”
The next fundamental political attitude tested is satisfaction with democracy. Comparing the two groups, CMC graduates are slightly more likely to be “very satisfied” with democracy (Figure 2). However, once again, it is important to control for other variables. The ordered logistic regression models (Table 1, Model 2) show satisfaction with democracy to be no different among CMC graduates than among their peers from the general population with post-secondary education. When comparing the predictors of satisfaction with democracy between the two groups (Appendix D, Models 3–4), there are no statistically significant differences. Instead, for both groups, age is a prominent driver of predictor of satisfaction with democracy—as a respondent gets older, their satisfaction increases.
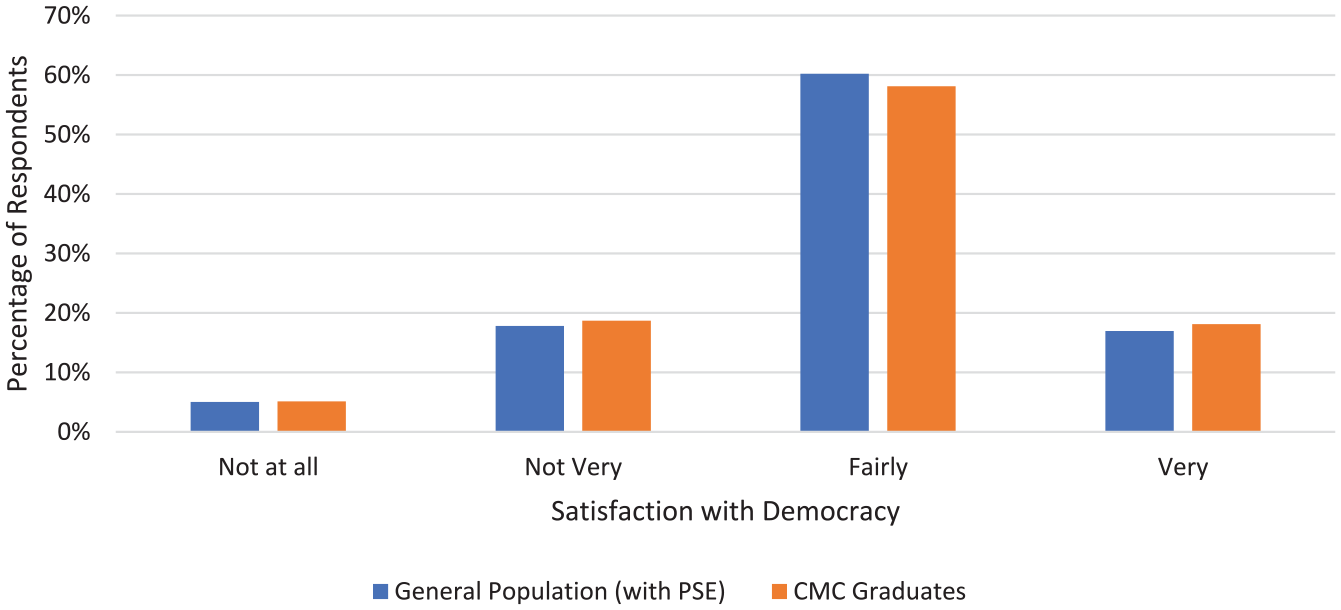
Satisfaction With Democracy.
Political Efficacy—“The Government Does Not Care Much About What People Like Me Think.”
Looking at levels of political efficacy, measured through responses to the prompt “The government does not care much about what people like me think,” we find again CMC graduates less likely to say that they somewhat or strongly agree with this statement and more likely to somewhat or strongly disagree (Figure 3). This means that the sample of CMC graduates feel like the government does care about what they think, and thus have a higher level of political efficacy, or feeling like they have some meaningful input into what the government decides. Considering the regression models (Table 1, Model 3), we see that this finding holds when control variables are included.
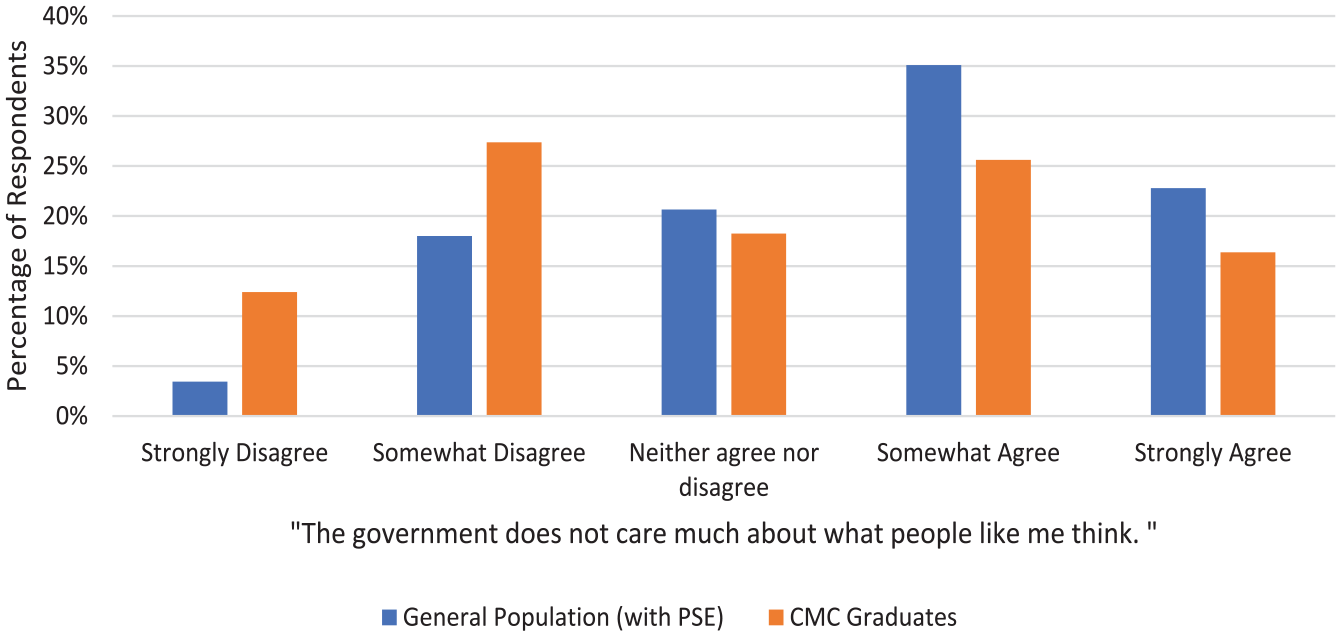
Political Efficacy.
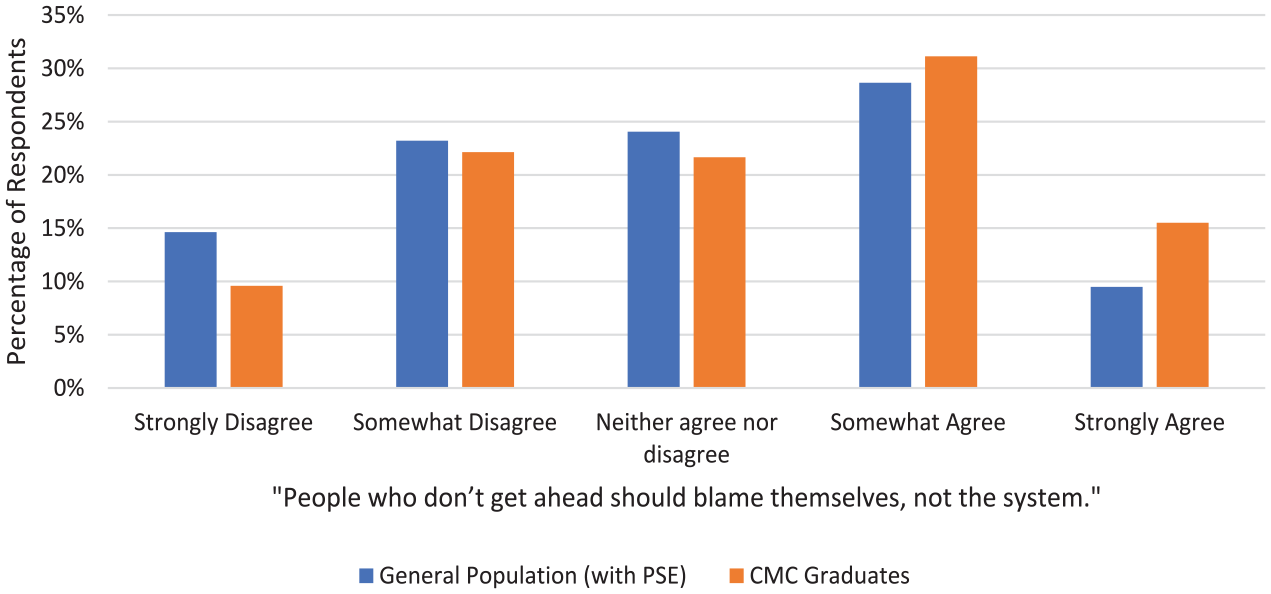
Individual vs. Institutional Responsibility—“People Who Don’t Get Ahead Should Blame Themselves, Not the System.”
Another fundamental political attitude is the contrast between individual and institutional responsibility. CMC graduates are more likely to agree strongly with the statement “People who don’t get ahead should blame themselves, not the system” (Figure 4). However, the ordered logistic regression in Table 1, Model 4 shows that CMC graduates do not significantly differ from their general population counterparts. In the separate models in Appendix C, we see that instead, factors like gender and age are more important predictors of whether a respondent believes in personal compared with institutional responsibility, than their military service.
Personal vs. Institutional Responsibility.
Ideology –“. . . where would you place yourself on [the left -right] scale?”
CMC graduates lean slightly toward the right end of the spectrum, with a mean ideology of 5.44 (on a 0–10 scale, where 0 is more left-leaning and 10 is more right leaning), compared with the general population (with comparable education level)’s mean of 4.90 (Figure 5). The differences between the general population and CMC graduates appears in Table 1, Model 5, with a positive coefficient for CMC graduates, meaning that CMC graduates tend to be slightly more right-leaning, controlling for other factors. For both groups (see split models in Appendix C), being a woman is statistically significant predictor of more left leaning-ideology for both the general population and CMC graduates (Appendix D, Models 9–10). However, the predicted ideology of a woman CMC graduate remains more right leaning (4.97) than a woman from the general population (4.66), with no overlap of 95% confidence intervals. This suggests that, unlike the findings for political interest, the gender imbalance between CMC graduates and the general population is not driving this gap.
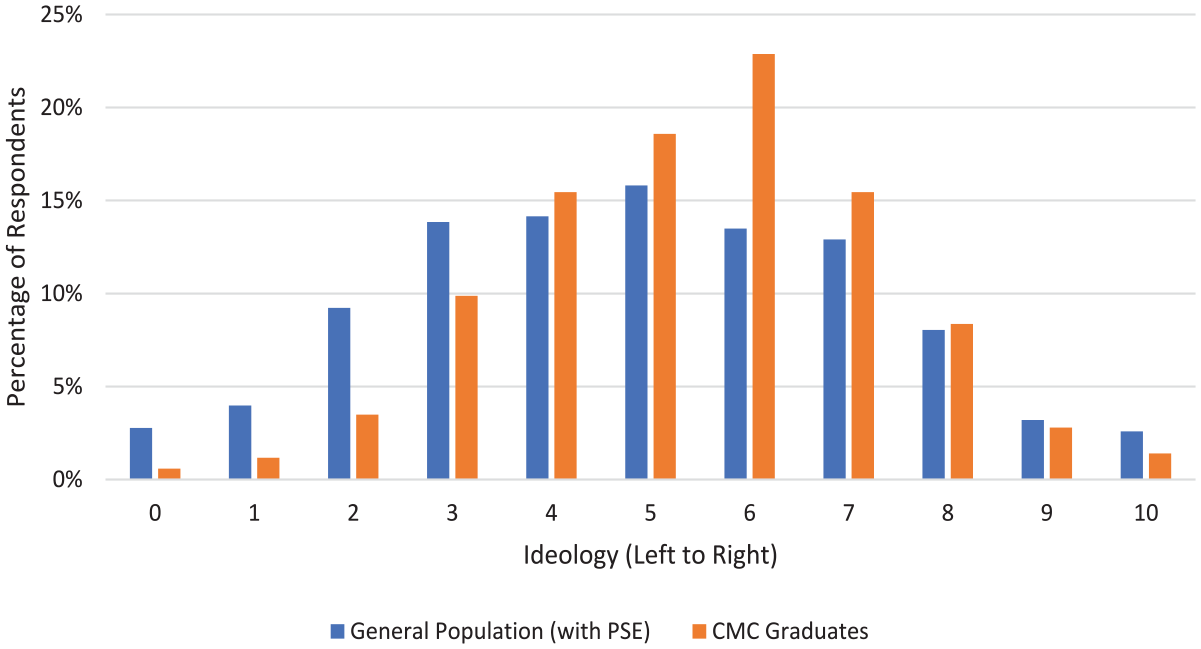
Ideology.
Conclusion
This study compared the political attitudes of former Canadian Officer and Naval Cadets (CMC graduates) with the general Canadian population. Two surveys were used: a new survey of CMC alumni, and the 2021 CES, a large survey of Canadians during this electoral period. Both surveys asked respondents about their fundamental attitudes toward political life, allowing for a comparison between former military members and civilians. Controlling for factors we know are related to self-selection into the military, and that influence these fundamental beliefs, the results were as follows:
CMC graduates tended to have higher overall levels of
There was no evidence that CMC graduates had higher levels of
CMC graduates had a greater sense of
CMC graduates tended to favor
CMC graduates did tend to be slightly more
Due to the aforementioned limitations, we caution about extrapolating from these results more broadly about the Canadian officer corps or the CAF writ large. Insofar as graduates of the CMCs, however, is concerned, the results do suggest that their political attitudes differ somewhat from the general population. That is in line with expectations, based on research on militaries, military officers, and officer-cadets elsewhere. In line with the limitations of cognate research elsewhere, whether these effects are driven by selection or socialization, generation or cohort, is difficult to ascertain, which is partially a function of the cross-sectional research design.
That CMC graduates score higher on political interest and express positive sentiments of political efficacy is good news for civil–military relations in Canada, and constructive relations between CMC graduates and their relationship with the government. In other words, CMCs would appear to be doing reasonably well ensuring that the senior military leadership aligns leaders in the profession of arms with the expectations and wishes of the Canadian citizenry. But as the survey was limited to CMC graduates, whether these results are a function of the 4–5 years of initial socialization at a CMC or due to subsequent CAF socialization/experience is hard to say. The moderating effect of post-secondary education, and thus the extent to which CMC or CAF university graduates hold views that are more moderate than they otherwise might, or views that are more moderate than CAF members without post-secondary education, we do not know. However, among a sample of CMC officer-cadets (Nicol et al., 2007), had identified a socialization effect: an ideological shift to the right that correlates with increased social dominance orientation (SDO) among CMC graduates. Whether that effect is driven by the officer-cadets’ military or educational experiences was unclear. If there are SDO socialization effects, complemented by broader institutional socialization effects that engender an ideological shift to the right over time, the findings suggest that the executive branch in Canada, as elsewhere, actively has to mediate relations between the CAF and Canadian society.
Footnotes
Appendix A
Variables.
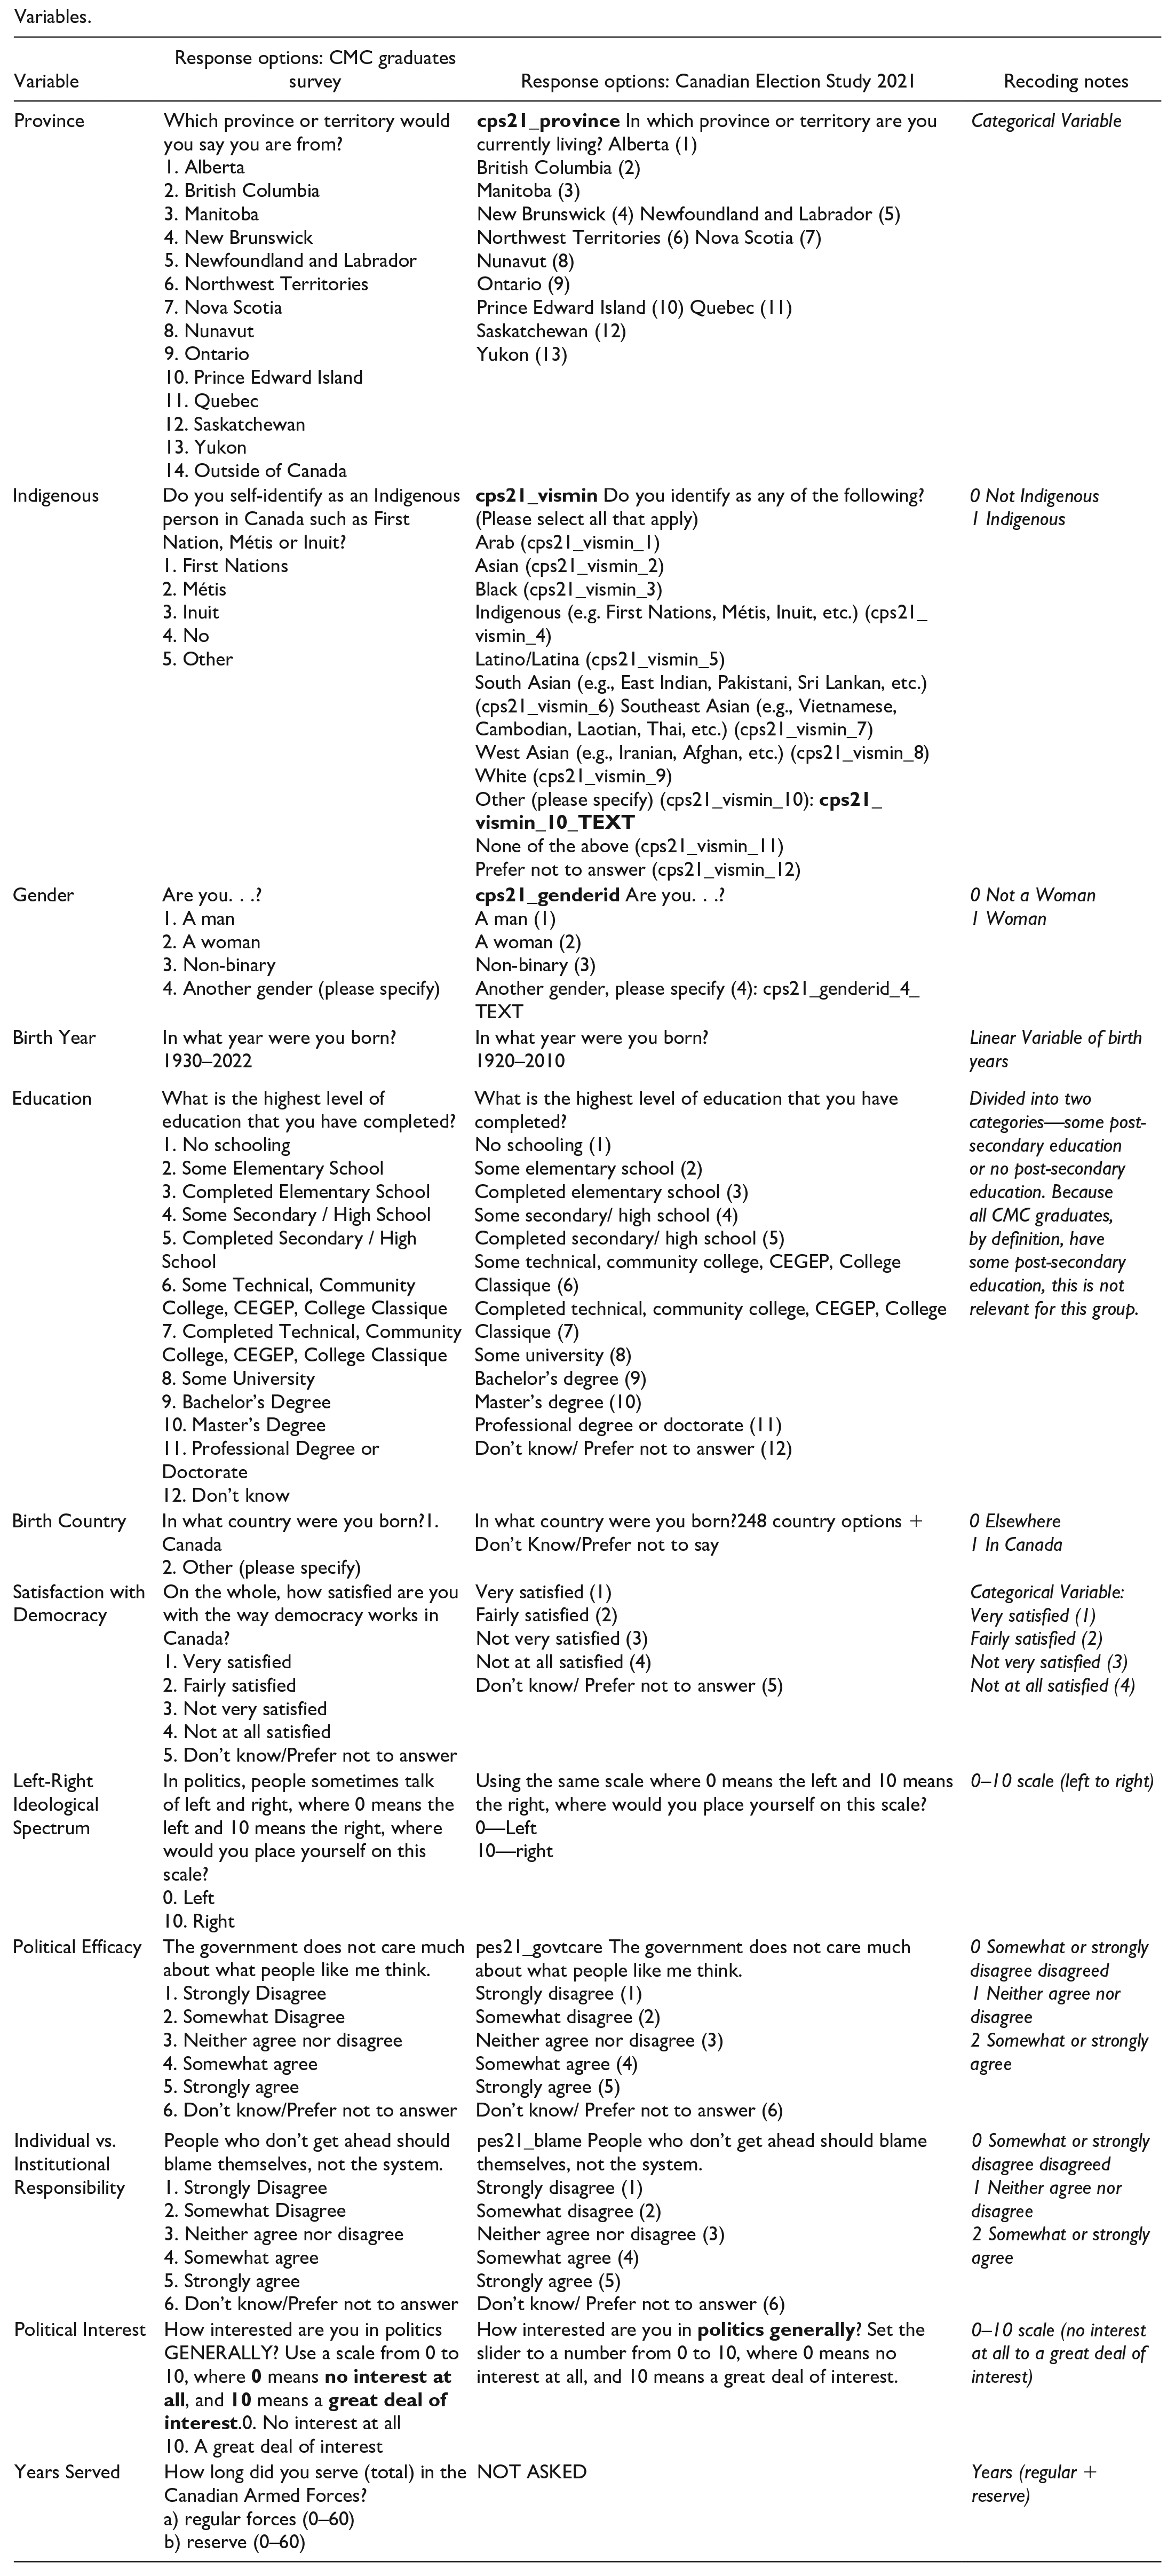
| Variable | Response options: CMC graduates survey | Response options: Canadian Election Study 2021 | Recoding notes |
|---|---|---|---|
| Province | Which province or territory would you say you are from? 1. Alberta 2. British Columbia 3. Manitoba 4. New Brunswick 5. Newfoundland and Labrador 6. Northwest Territories 7. Nova Scotia 8. Nunavut 9. Ontario 10. Prince Edward Island 11. Quebec 12. Saskatchewan 13. Yukon 14. Outside of Canada |
British Columbia (2) Manitoba (3) New Brunswick (4) Newfoundland and Labrador (5) Northwest Territories (6) Nova Scotia (7) Nunavut (8) Ontario (9) Prince Edward Island (10) Quebec (11) Saskatchewan (12) Yukon (13) |
Categorical Variable |
| Indigenous | Do you self‑identify as an Indigenous person in Canada such as First Nation, Métis or Inuit? 1. First Nations 2. Métis 3. Inuit 4. No 5. Other |
Arab (cps21_vismin_1) Asian (cps21_vismin_2) Black (cps21_vismin_3) Indigenous (e.g. First Nations, Métis, Inuit, etc.) (cps21_vismin_4) Latino/Latina (cps21_vismin_5) South Asian (e.g., East Indian, Pakistani, Sri Lankan, etc.) (cps21_vismin_6) Southeast Asian (e.g., Vietnamese, Cambodian, Laotian, Thai, etc.) (cps21_vismin_7) West Asian (e.g., Iranian, Afghan, etc.) (cps21_vismin_8) White (cps21_vismin_9) Other (please specify) (cps21_vismin_10): None of the above (cps21_vismin_11) Prefer not to answer (cps21_vismin_12) |
0 Not Indigenous
1 Indigenous |
| Gender | Are you. . .? 1. A man 2. A woman 3. Non-binary 4. Another gender (please specify) |
A man (1) A woman (2) Non-binary (3) Another gender, please specify (4): cps21_genderid_4_TEXT |
0 Not a Woman
1 Woman |
| Birth Year | In what year were you born? 1930–2022 |
In what year were you born? 1920–2010 |
Linear Variable of birth years |
| Education | What is the highest level of education that you have completed? 1. No schooling 2. Some Elementary School 3. Completed Elementary School 4. Some Secondary / High School 5. Completed Secondary / High School 6. Some Technical, Community College, CEGEP, College Classique 7. Completed Technical, Community College, CEGEP, College Classique 8. Some University 9. Bachelor’s Degree 10. Master’s Degree 11. Professional Degree or Doctorate 12. Don’t know |
What is the highest level of education that you have completed? No schooling (1) Some elementary school (2) Completed elementary school (3) Some secondary/ high school (4) Completed secondary/ high school (5) Some technical, community college, CEGEP, College Classique (6) Completed technical, community college, CEGEP, College Classique (7) Some university (8) Bachelor’s degree (9) Master’s degree (10) Professional degree or doctorate (11) Don’t know/ Prefer not to answer (12) |
Divided into two categories—some post-secondary education or no post-secondary education. Because all CMC graduates, by definition, have some post-secondary education, this is not relevant for this group. |
| Birth Country | In what country were you born?1. Canada 2. Other (please specify) |
In what country were you born?248 country options + Don’t Know/Prefer not to say |
0 Elsewhere
1 In Canada |
| Satisfaction with Democracy | On the whole, how satisfied are you with the way democracy works in Canada? 1. Very satisfied 2. Fairly satisfied 3. Not very satisfied 4. Not at all satisfied 5. Don’t know/Prefer not to answer |
Very satisfied (1) Fairly satisfied (2) Not very satisfied (3) Not at all satisfied (4) Don’t know/ Prefer not to answer (5) |
Categorical Variable: Very satisfied (1)
Fairly satisfied (2) Not very satisfied (3) Not at all satisfied (4) |
| Left-Right Ideological Spectrum | In politics, people sometimes talk of left and right, where 0 means the left and 10 means the right, where would you place yourself on this scale? 0. Left 10. Right |
Using the same scale where 0 means the left and 10 means the right, where would you place yourself on this scale? 0—Left 10—right |
0–10 scale (left to right) |
| Political Efficacy | The government does not care much about what people like me think. 1. Strongly Disagree 2. Somewhat Disagree 3. Neither agree nor disagree 4. Somewhat agree 5. Strongly agree 6. Don’t know/Prefer not to answer |
pes21_govtcare The government does not care much about what people like me think. Strongly disagree (1) Somewhat disagree (2) Neither agree nor disagree (3) Somewhat agree (4) Strongly agree (5) Don’t know/ Prefer not to answer (6) |
0 Somewhat or strongly disagree disagreed
1 Neither agree nor disagree 2 Somewhat or strongly agree |
| Individual vs. Institutional Responsibility | People who don’t get ahead should blame themselves, not the system. 1. Strongly Disagree 2. Somewhat Disagree 3. Neither agree nor disagree 4. Somewhat agree 5. Strongly agree 6. Don’t know/Prefer not to answer |
pes21_blame People who don’t get ahead should blame themselves, not the system. Strongly disagree (1) Somewhat disagree (2) Neither agree nor disagree (3) Somewhat agree (4) Strongly agree (5) Don’t know/ Prefer not to answer (6) |
0 Somewhat or strongly disagree disagreed
1 Neither agree nor disagree 2 Somewhat or strongly agree |
| Political Interest | How interested are you in politics GENERALLY? Use a scale from 0 to 10, where 10. A great deal of interest |
How interested are you in |
0–10 scale (no interest at all to a great deal of interest) |
| Years Served | How long did you serve (total) in the Canadian Armed Forces? a) regular forces (0–60) b) reserve (0–60) |
NOT ASKED | Years (regular + reserve) |
Appendix B
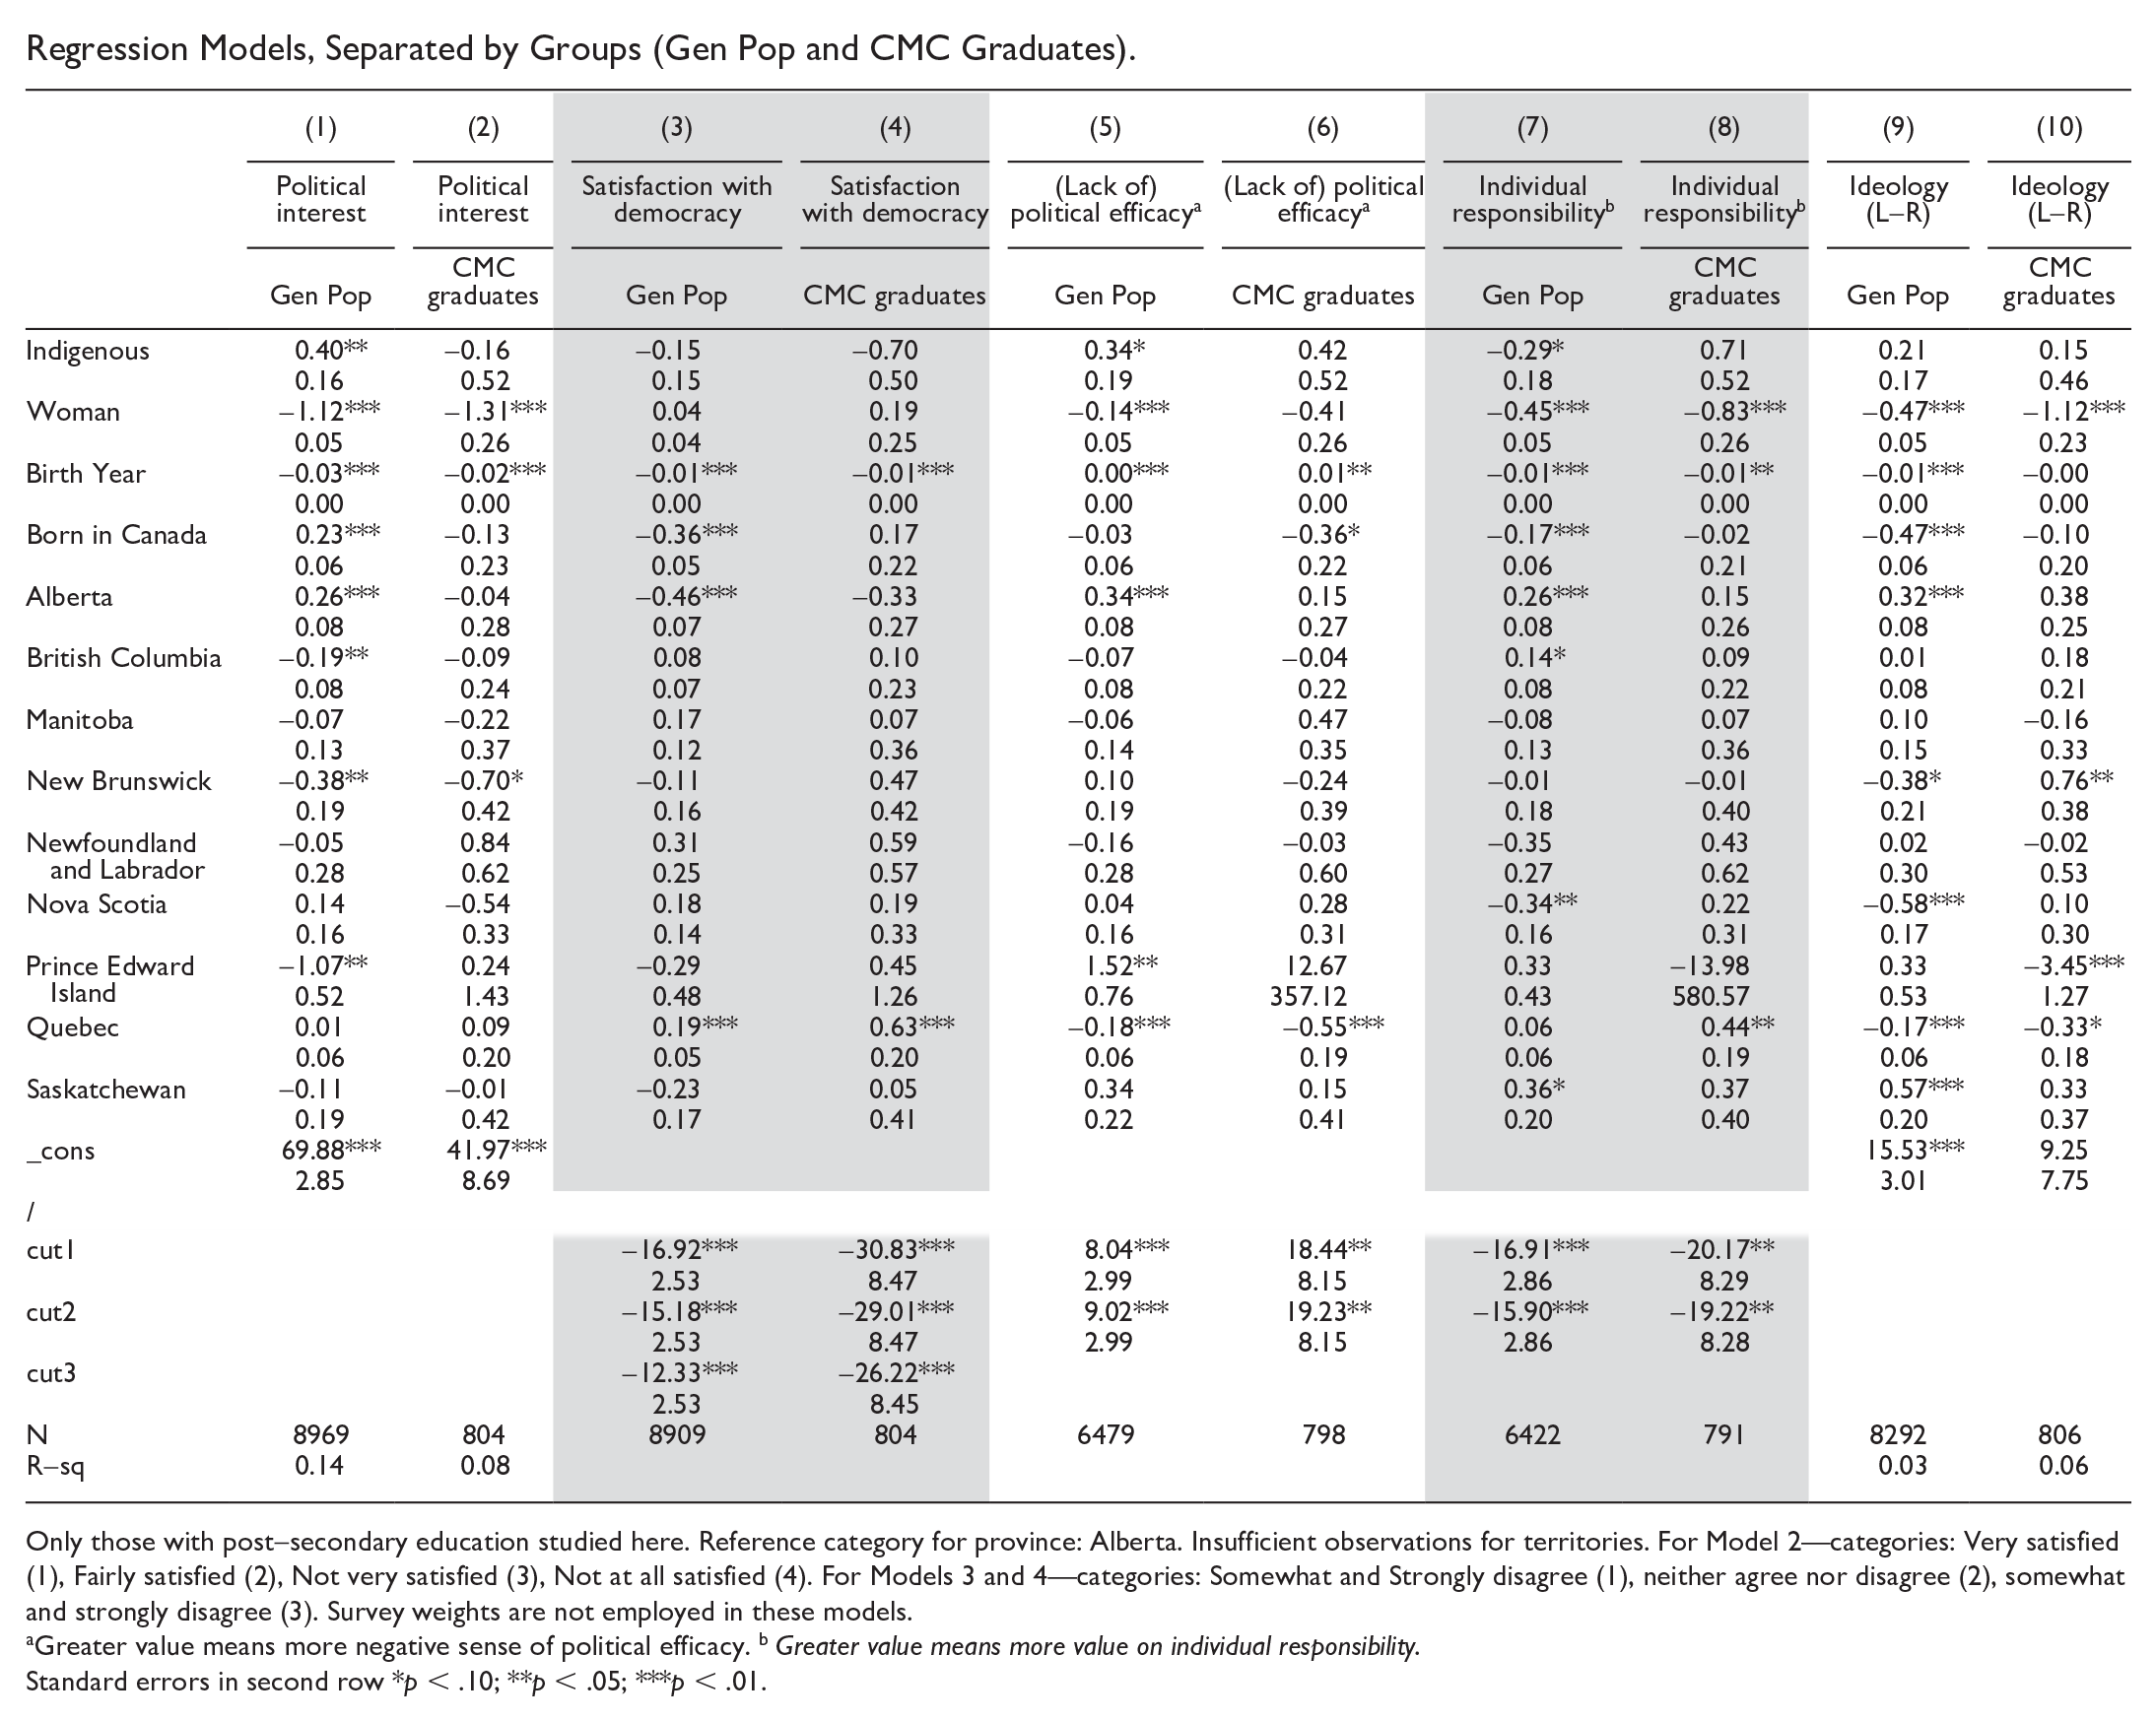
Appendix C
Regression Models, Separated by Groups (Gen Pop and CMC Graduates).
|
Only those with post-secondary education studied here. Reference category for province: Alberta. Insufficient observations for territories. For Model 2—categories: Very satisfied (1), Fairly satisfied (2), Not very satisfied (3), Not at all satisfied (4). For Models 3 and 4—categories: Somewhat and Strongly disagree (1), neither agree nor disagree (2), somewhat and strongly disagree (3). Survey weights are not employed in these models.
Greater value means more negative sense of political efficacy. b Greater value means more value on individual responsibility.
Standard errors in second row *p < .10; **p < .05; ***p < .01.
Appendix D
Declaration of Conflicting Interests
The authors declared no potential conflicts of interest with respect to the research, authorship, and/or publication of this article.
Funding
The authors disclosed receipt of the following financial support for the research, authorship, and/or publication of this article: We acknowledge financial support from the Royal Military College Class of 1965, by way of the endowment for the Class of 1965 Professorship in Leadership, held by Dr. Christian Leuprecht (2017–2023) and held by Dr. Holly Ann Garnett (2023–present).