
Abstract
This research compares food insecurity for U.K. veterans and nonveterans using the United States Department of Agriculture (USDA) 10-item Adult Food Security Survey Module (AFSSM) for a sample of 1,492 participants. We find 1 in 10 veterans are living in a food-insecure household but that veteran status is not related to food insecurity. In addition, income and housing benefits are correlated with food insecurity for veterans and for nonveterans, but disability benefits are correlated with food insecurity among veterans only. Specifically, veterans with disability benefits averaged 1.12 (95% confidence interval, [0.42, 1.82]) more points (indicating more food insecurity) on the AFFSM than veterans without those benefits. These findings raise concerns that low-income disabled veterans with housing needs are a unique population at risk of living in food insecurity. Given the absence of research on food insecurity among U.K. veterans, it is necessity to study this population in greater detail and implement screening protocols where possible.
Keywords
Introduction
Food insecurity is unevenly distributed within the U.K. population and disproportionately affects people because of their race, ethnicity, gender, age, income, disability status, and the area of residence. 1 What is missing from these distributional studies of food insecurity is an analysis of military veterans and whether they are more likely to be food insecure than nonveterans. 2 The paucity of U.K. veteran research on food insecurity is notable given (1) the U.K. government’s emphasis on the physical and mental well-being of veterans, especially as emphasized in recent initiatives by the Armed Forces Covenant and the Office of Veterans’ Affairs; (2) the disproportionate number of military personnel who come from socioeconomic hardship often characterized by food insecurity prior to enlisting; and (3) the high prevalence of conditions in the veteran population that are often associated with food insecurity such as poor mental health, drug/alcohol addiction, and/or physical disabilities. 3 As a result, we suggest that food insecurity among the veteran population deserves additional study.
From a policy standpoint, food insecurity among veterans is important to understand because it is often correlated with problems that may be prevalent when leaving military service. For instance, Forces in the Mind Trust (2013) estimates that transitioning from military to civilian life costs the U.K. government roughly £100 million annually as veterans face alcohol misuse (£35 million), mental health problems (£26 million), are unable to find employment (£21 million), become homelessness (£5.5 million), and often cope with family breakdown (£16 million). To address the health concerns associated with food insecurity the U.K.’s National Health Service (NHS, 2019: 119) states that they will “expand support for all veterans as they transition out of the armed forces” by 2023-2024 fiscal year as part of The Long Term Plan. To ensure the Plan is a success, Fadeeva et al. (2022) contend decision makers need to better document evidence that may contribute to health challenges. As Lieutenant General Richard Nugee of the Ministry of Defence recently pointed out, “policy makers and service providers [must] consider the Armed Forces community from an evidence-based position” (Cited in Doherty et al., 2020, iv). We propose that part of this evidence base must include an investigation into veterans’ food insecurity.
The present study addresses three important questions about veteran food insecurity. First, how prevalent is food insecurity among U.K. veterans and how does it compare with the nonveteran population? Second, is veteran status correlated with U.K. food insecurity while controlling for other potential explanations of food insecurity? Third, what variables, if any, are uniquely correlated with food insecurity scores in the U.K. veteran population when compared with the nonveteran population? Prior to describing the methods used to answer these three questions, we explore the definition of food insecurity and its hypothesized relationship with veteran status in greater detail.
Prior Research on Veterans and Food Insecurity
We begin our study of veterans and food insecurity by defining what it means to be food secure. Food security exists when “all people, at all times, have physical, social, and economic access to sufficient, safe, and nutritious food that meets their food preferences and dietary needs for an active and healthy life” (Food and Agriculture Organization of the United Nations, 2002:190). Individuals who are not food secure are food insecure, a situation that affects approximately one in six adults in England, Wales, and Northern Ireland (Armstrong et al., 2021a, 2021b, see also Pool & Dooris, 2022). Food insecurity is correlated with a number of adverse health-related conditions such as anemia, poor mental health, depression, anxiety, suicidal ideation, drug and alcohol addiction, tooth decay and other oral health problems, diabetes, high hypertension, and obesity (Boateng et al., 2020; Brucker, 2017; Cook et al., 2004; Garthwaite et al., 2015; Gundersen & Ziliak 2015; Kamdar, Horning, et al., 2021; Lee et al., 2012; Martinez et al., 2019; McIntyre et al., 2013; Seligman et al., 2007; Whitaker et al., 2006). As previously noted, existing data sources on food insecurity and veteran status are nonexistent in the United Kingdom (except see Sharp et al., 2021). The two major U.K. surveys that collect data on food insecurity are the Food and You survey (https://www.food.gov.uk/research/food-and-you) conducted in England, Wales, and Northern Ireland by the Food Standards Agency and the Family Resources Survey (https://www.gov.uk/government/statistics/family-resources-survey-financial-year-2019-to-2020) carried out by the U.K. Department of Work and Pensions. These two national surveys do not include a data field on veteran status. Consequently, researchers cannot use these conventional datasets to study the prevalence of food insecurity in the veteran population. This omission of veteran status in large national studies that measure food insecurity may help explain why there is a lack of research on veteran status and food insecurity in the United Kingdom. To be sure, research on the prevalence and predictors of food insecurity among veterans does exist in countries outside of the United Kingdom where secondary data on food insecurity and veteran status are more readily available. As a result, we draw upon this existing literature to create two tentative hypotheses about food insecurity among U.K. veterans.
Outside of the United Kingdom, existing research on the prevalence of food insecurity suggests that between 2% and 26% of U.S. military veterans are food insecure (Brostow et al., 2017; Miller et al., 2016; Pooler et al., 2021; Rabbitt & Smith, 2021) For instance, Brostow et al. (2017) found that 6.4% of the 2,560 male veterans they studied were food insecure compared with 11.9% of the nonveteran males. In a study of 388,680 U.S. households in the U.S. Population Survey—Food Security Supplement, Miller et al. (2016) also found that veterans were less likely to live in food-insecure households (11.7% of the sample) than nonveterans (19.8% of the sample). In another study of food insecurity, Kamdar, Lester, et al. (2021) compared 155 veterans with 310 nonveterans and found that veteran status and food insecurity were unrelated. Nevertheless, Kamdar, Lester, et al. (2021) report that veterans who were food insecure tended to be classified as “severely food insecure” while nonveterans who were food insecure tended to be classified as “moderately food insecure,” suggesting that food insecurity may be more serious when veterans experience that condition. Rabbitt and Smith (2021) conducted one of the few studies that supply evidence that veterans may have a higher risk of food insecurity than nonveterans. They point out that food insecurity among veterans who served in 911 Gulf War have higher levels of food insecurity than nonveterans (see also Widome et al., 2015).
Overall, except in the case of post-911 Gulf War, studies of food insecurity among the U.S. veteran population suggest that veterans have equivalent or lower levels of food insecurity than nonveterans. This finding is not necessarily unexpected as military service can improve educational attainment and therefore lead to more “human capital” and better financial wherewithal to withstand problems associated with financial hardships (Wang et al., 2015). An increase in human capital could therefore reduce food insecurity later in life when transitioning from the military to civilian life. Military service can also improve economic and personal gains after leaving the service and therefore reduce the probability of being food insecure (Spiro et al., 2016). Finally, retired veterans that stay in service long enough often benefit from significant pension income and can have more financial resources than nonveterans—improving financial access to food after they retire from service (Tamborini et al., 2016). Based on this research, we hypothesize that the prevalence of food insecurity is lower among the U.K. veteran population than among the U.K. nonveteran population.
Researchers have also examined factors that influence food insecurity in veterans-only samples. Brostow et al. (2017) established that younger veterans had higher levels of food insecurity than older veterans. Miller et al. (2016) also found higher levels of food insecurity among younger veterans and recommends that food insecurity interventions should therefore target this unique population. Pooler et al. (2021) found that 22.5% of the 5,146 low-income veterans they studied reported elevated levels of food insecurity. Moreover, veterans who were unemployed and/or receiving benefits were more likely to be food insecure than those who were employed and not on benefits (see also Wang et al., 2015). Research on the impact of gender, veteran status, and food insecurity is also revealing. Female veterans have higher levels of food insecurity than male veterans (Cypel et al., 2020; Narain et al., 2018). These persistent gender findings exist despite controls for income. Pooler et al. (2021) found that low-income female veterans had higher levels of food insecurity than low-income male veterans (29.6% vs. 21.8%). Research is also clear that disabled veterans are more likely than non-disabled veterans to experience food insecurity. Pooler et al. (2021) observed that about one in four disabled veterans is food insecure (vs. 17.2% for non-disabled veterans) while Wilmoth et al. (2015) estimate that disabled veterans are 3.72 times more likely to be food insecure than non-disabled veterans.
In sum, and as Cohen et al.’s (2022) research illustrate, food insecurity is highest among those veterans who are racial/ ethnic minorities, women, low-income, single, disabled, and/ or that lack adequate housing. It is likely that many of these factors are also related to food insecurity in the nonveteran population (Department for Environment Food & Rural Affairs, 2021). Given the current state of research on veterans’ characteristics associated with food insecurity, we hypothesize that U.K. veterans with the highest levels of food insecurity will be those that are (1) low-income, (2) racial/ ethnic minorities, (3) working age, (4) female, (5) unemployed, (6) physically or mentally disabled, and/ or (7) on benefits.
While research on the prevalence of food insecurity in the U.K. veteran population is virtually nonexistent, one important U.K.-based study did account for veterans’ food insecurity as an independent variable. Sharp et al. (2021:1) found that “a [unique] group of [UK] veterans need mental health and alcohol treatment services.” Among the factors Sharp et al. (2021) identify as potentially indicative of vulnerable veteran status is food insecurity. Sharp found that 2% (or n = 31) of the 1,562 U.K. veterans in the sample agreed that they “had difficulty accessing enough food.” This food insecurity (vs. no food insecurity) in the veteran population was associated with an increase in the odds of (1) experiencing a common mental disorder by a factor of 2.32, (2) engaging in hazardous drinking by a factor of 1.64, and (3) an increase in feeling lonely by a factor of 3.91. As a result, Sharp et al.’s study gives researchers an important first glimpse into the prevalence of food insecurity among U.K. veterans. Thus, the current study builds on Sharp et al.’s (2021) findings to focus on food insecurity in the U.K. veteran population as a dependent variable.
Method
Sample
The present study employed a cross-sectional survey design to study veterans in the United Kingdom, non-veterans, and food insecurity. We relied on YouGov (www.YouGov.com) to collect survey data in June 2022. YouGov is an international research data and analytics group that engages in marketing research. YouGov recruited the participants for this study from their online survey platform consisting of more than 1 million adults living in England, Scotland, and Wales. 4 The company used stratified random sampling methodology on their representative participant platform to create a group of veterans and a group of nonveterans that could be compared for the purposes of this study. YouGov accomplished this by taking two samples. The first sample is a stratified random sample (proportionate to size) of n=1,000 U.K. adults aged 18 and older that YouGov selected according to age, gender, social class, education, and country of residence (i.e., England, Scotland, or Wales). A total of n = 927 nonveterans and n = 73 veterans come from this sample. The n = 73 veterans made up 7.3% of that sample, an estimate of the proportion of the U.K. veteran population that is only slightly greater than the Ministry of Defence (2019) estimate of 5% in England, Wales, and Scotland. To increase the number of veterans in this study, YouGov obtained an additional random sample of military veterans. Participants in this second sample were screened into the sample according to veteran status using the question “have you previously served in the armed forces? (i.e., British Army, Royal Navy, Royal Air Force, the Royal Marines).” A total of n = 492 veterans make up that second sample.
Our sampling strategy consisted of combining veterans (n = 565) and nonveterans (n = 927) to compare food insecurity between and within these two groups. Because veterans had a greater probability of being included in the joint sample, adjustments were needed so that estimates are unbiased (Tracy & Carkin, 2014). As a result, when we analyzed veterans and nonveterans together (i.e., all n = 1,492 cases), we utilized post-estimation weights to account for the overrepresentation of veterans in the sample. We did not, however, weight cases when veterans and nonveterans were analyzed separately. In that case, both groups were treated as separate samples chosen randomly to accurately reflect their respective target populations.
YouGov collected data on food security and combined it with existing demographic data held on their platform. YouGov informed all survey respondents that their participation in the food security study was voluntary and that their answers would be kept confidential and only presented to others in aggregate. In addition, YouGov anonymized data so it could not be used to identify individuals who completed the survey. The Northumbria University Ethics Panel (Submission no. 45803) approved our use of the YouGov data (see Supplemental Material) used in this study on May 04, 2022.
Variables
Food Insecurity
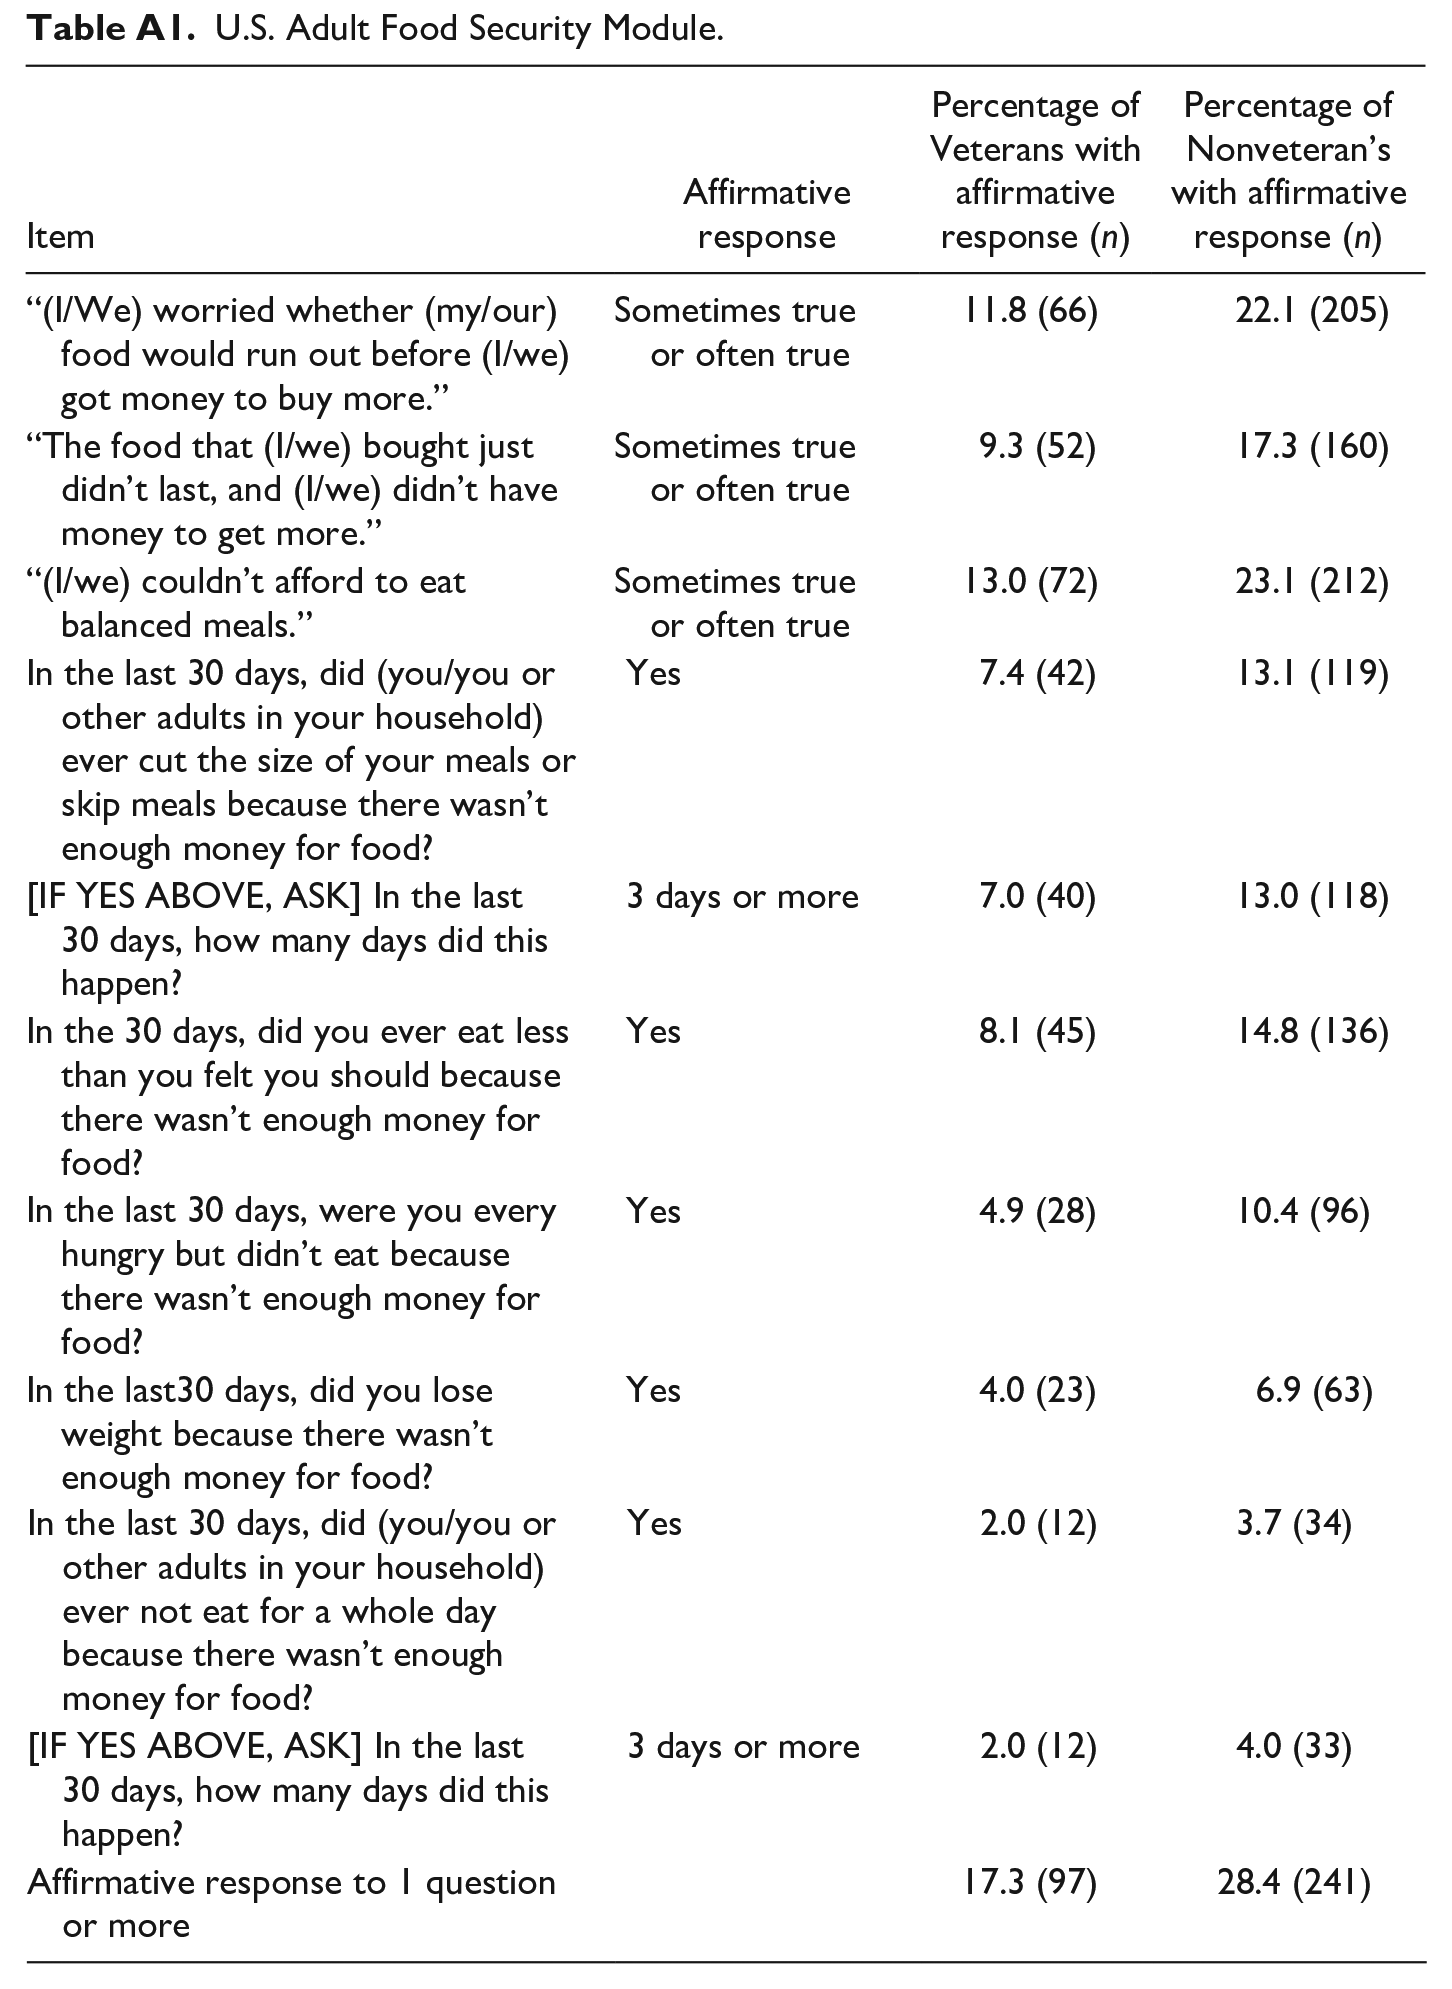
There are two primary food insecurity variables used in this research. Both variables are created using items that compose the United States Department of Agriculture (USDA) 10-item Adult Food Security Survey Module (AFSSM; USDA, 2013). The AFSSM is a well-known source for measuring food insecurity, and items in the module have been confirmed (Nord et al., 2009). Importantly, both measures of food insecurity used in this study are created using scoring protocols set out in the AFSSM by the USDA that have been used in research on food insecurity around the globe (Baer et al., 2015; Ding et al., 2015; Kelly & Pemberton, 2016; Nikolaus et al., 2019). Also, in the United Kingdom, the AFSSM is also used by the U.K.’s Department of Work and Pensions in their Family Resource Survey to get an official government measure of food insecurity. We also use the AFSSM to create two different food insecurity variables because Kamdar, Lester, et al. (2021) suggest that changing the way food insecurity is operationalized can produce different results. Consistency across these variables would therefore help to provide additional evidence that the AFSSM is a reliable and valid indicator of food insecurity in the present study.
We labeled the first food insecurity variable the Food Insecurity Scale. This variable is a measure of the level of food insecurity in households over the past 30 days and is summarized on a scale of “1” (no food insecurity) to “10” (high food insecurity) in the participant’s household during the past 30 days. To create the scale, each affirmative answer to an item (see Appendix A for the 10 items) shows a greater amount of food insecurity. The scores on the scale were calculated by assigning “1” point to each affirmative answer and then summing those points up for the overall measure.
The second food insecurity variable is dichotomous and labeled Food Insecurity Indicator. Participants who answered affirmatively to 3 or more of the 10 items on the AFSSM were classified as living in a “food insecure” household and assigned a score of “1,” while participants who answered affirmatively to 2 or fewer AFSSM items were assigned a score of “0” and classified as not living in a food-insecure household. This scoring system is consistent with the AFFSM scoring categories that assign scores of 3 or above on the AFSSM as having low or very low food security.
Veteran Status
Veterans Status identifies whether a participant served in the U.K. military (scored “1” for “yes” and “0” for “no”). We used Veteran Status to examine the prevalence of food insecurity among the veteran population and determine the impact of veteran status on food insecurity while controlling for other variables that may influence food insecurity.
Control Variables
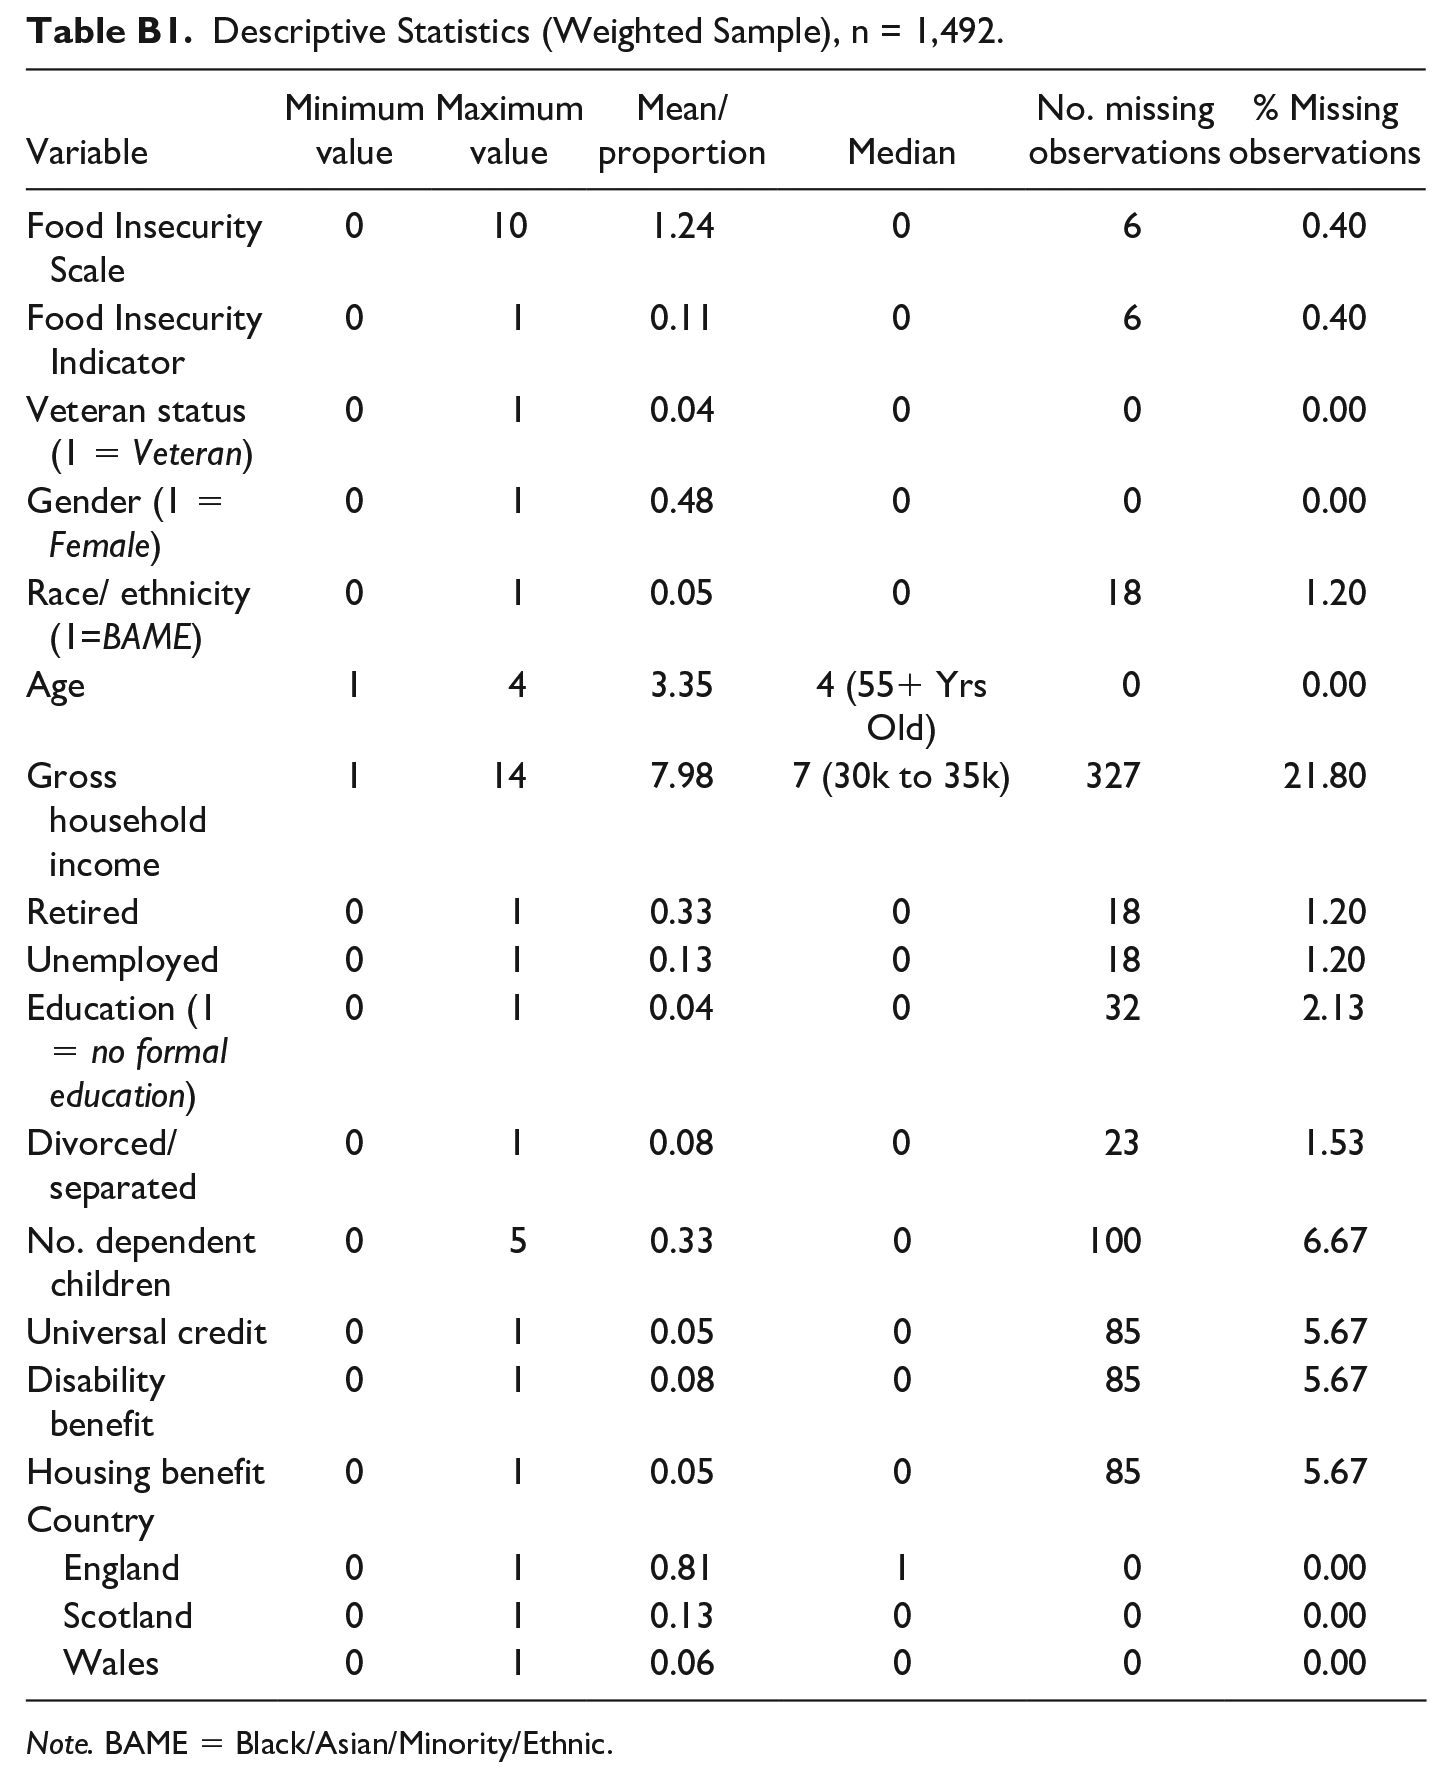
In addition to veteran status, basic demographic variables referenced in the veteran food security literature and believed to potentially impact food insecurity were obtained from YouGov. Gender, BAME (Black/Asian/Minority/Ethnic) status, age, education, relationship status, number of dependent children, annual income, employment status, receipt of benefits, and country of residence were all included in this analysis of food security. Gender indicates whether the participant is female (scored “1” for “yes” and “0” for “no”); Race/Ethnicity measures whether the participant is classified as BAME by the U.K. government and scored “1” for BAME and “0” for non-BAME. Education measures the participant’s education level at the U.K. General Certificate of Secondary Education (or equivalent in Scotland) or below (scored “1” for “yes” and “0” for “no”). Divorced/Separated is scored “1” for those who are divorced or separated and “0” for those who are not divorced/separated. Age is a four-category ordinal variable (“1” = 18 to 24; “2” = 25 to 39; “3” = 40 to 54; and “4” = 55+). Finally, No. Dependent Children is a count of the number of dependent children living in the participant’s household. Resource-related variables that might impact income also include Annual Gross Household Income which is an ordinal variable composed of 15 income categories ranging from “£0–£5,000” (scored “1”) to “£150,000 and Over” (scored “15”); Employment Status is a dummy variable that compares employed (full-time or part-time) participants (omitted category) to those who are classified as “Retired” (scored “1” if retired and “0” if not retired) or “Unemployed/Not Working” (scored “1” if unemployed/not working and “0” if not unemployed/working). Universal Credit, Disability Benefits, and Housing Benefits are all dichotomous variables and are scored “1” if the participant receives that benefit and “0” if the participant does not receive that benefit. As previously noted, disabilities may be an important predictor of veteran food insecurity (Wilmoth et al., 2015). Finally, County is a dummy variable where England (omitted category) is compared with Scotland (“1” if participant lives in Scotland and “0” if not) and Wales (scored “1” if participant lives in Wales and “0” if not). The minimum values, maximum values, means, proportions, medians, and number of missing values are included in Appendix B for all variables in this analysis.
Analytic Procedure
The aims of the present study were to (1) estimate and compare the prevalence of food insecurity among U.K. veterans and nonveterans; (2) determine if the veteran status is associated with food security while controlling for potential confounders; and (3) identify any unique risk factors associated with food insecurity in the veteran population. First, we estimated the prevalence of food insecurity among U.K. veterans for the Food Insecurity Scale and the Food Insecurity Indicator. We did this by computing the mean Food Insecurity Scale score for veterans and nonveterans (and compared them using t tests for independent samples) and the proportion of veterans and non-veterans who are identified as food insecure according to the Food Insecurity Indicator (and compared them using a z-test for proportions)
Second, we examine the relationship between veteran status and food insecurity using multivariate regression to control for other variables that may be correlated with food insecurity. We use Ordinary Least Squares Regression (OLSR) for the dependent variable Food Insecurity Scale and Logistic Regression (LR) for the dichotomous dependent variable Food Insecurity Indicator. As previously noted, veterans were oversampled so weights are used to account for the disproportionate number of veterans in the sample. Third, we identify any unique risk factors associated with food insecurity in the veteran population by using multivariate analyses to separately analyze food insecurity among the veteran and nonveteran groups. We then compared the results of those analyses to decide if predictors of food insecurity differed across the two groups. All analyses are carried out using STATA (v.15).
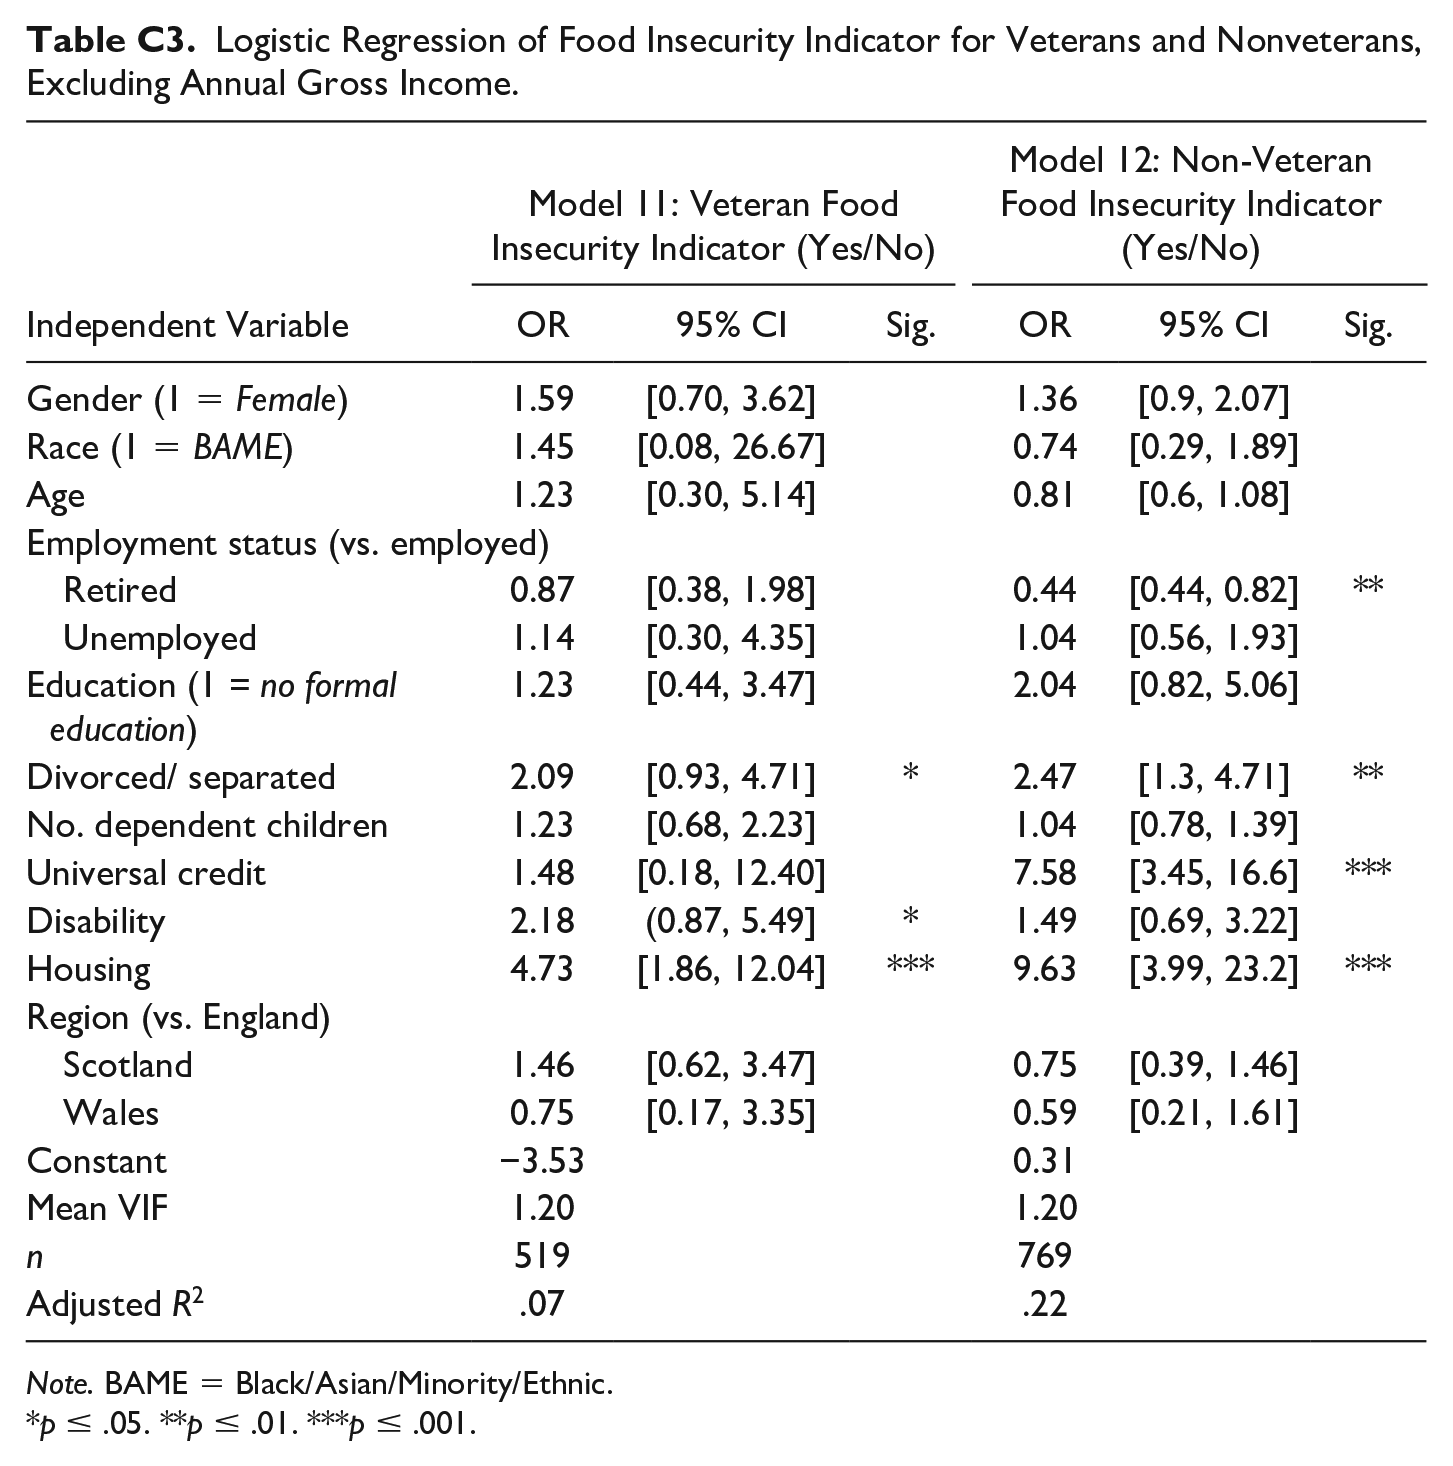
A total of n = 327 (i.e., 21.8%) participants were excluded from the analysis using listwise deletion because they are missing YouGov observations on Gross Household Income. There is a risk that participants who did not respond to the income question are different from those that did respond. These differences could therefore produce biased estimates. To investigate this issue in greater detail, Appendix C contains replicated models for all multivariate analyses, except that Gross Household Income is removed from the analysis to determine the impact it may have on other model coefficients when all the cases are analyzed. Removing income from the model decreases the percentage of missing participants to <10% in the veteran sample without substantively changing coefficients or confidence intervals (CIs) for variables remaining in the model. Thus, as indicated in Appendix C, missing data on income do not appear to substantively alter the correlations between food insecurity, veteran status, and/or other variables in the models. Moreover, when we estimated the missing observations for income by imputing them using the “Mi Impute” command in STATA, (not shown) the relationship between income and the remaining variables in the models also do not change. Thus, missing data are likely to be randomly missing and therefore are not likely to systematically bias the results.
Results
Prevalence of Food Insecurity by Veteran Status
Table 1 shows the distribution of food insecurity by veteran status. First, information in Table 1 supplies modest evidence that the U.K. veteran and nonveteran populations have a similar prevalence of food insecurity. For the variable Food Insecurity Indicator, 10.0% (95% CI, [7.6%, 12.5%]) of veterans answered in a way that suggests that they were living in food insecure households during the previous 30 days compared with 18.3% (95% CI, [15.9%, 20.9%]) of nonveterans. These results fall just short of statistical significance at α = 0.05 (i.e., p = .055). Results do, however, show that for the variable Food Insecurity Scale veterans answer affirmatively to fewer AFSSM items, on average, than nonveterans. Veterans answer affirmatively to an average of x¯ = 0.69 (95% CI, [0.54, 0.86]) questions (i.e., scoring an average of 0.69 on the Food Insecurity Scale), while nonveterans give an affirmative response to an average of x¯ = 1.26 (95% CI, [1.09, 1.42]) questions (i.e., scoring an average of 1.26 on the Food Insecurity Scale). These results concerning the Food Insecurity Scale are statistically significant. Taken together, then, Table 1 contains evidence that if the veteran and nonveteran populations have different magnitudes of food insecurity, it is veterans who have lower average Food Insecurity Scale scores.
Prevalence of Food Insecurity by Veteran Status (n = 1,486).
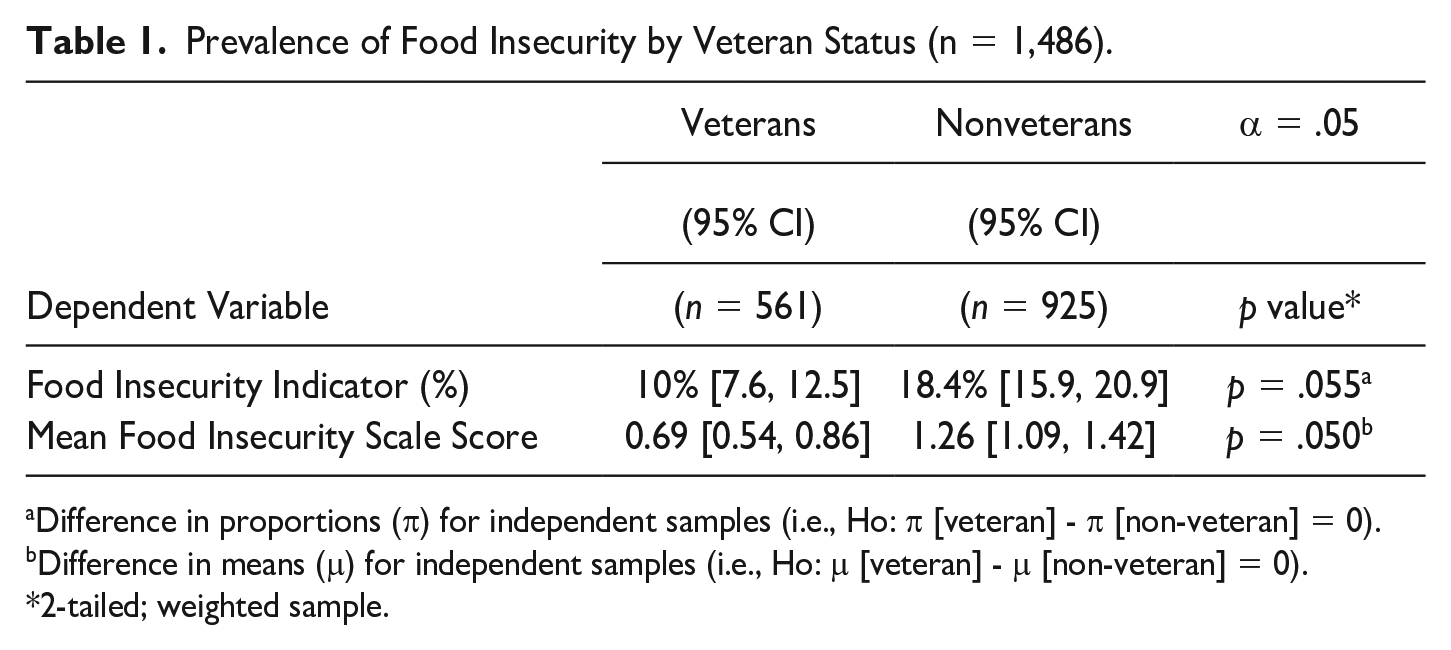
Difference in proportions (π) for independent samples (i.e., Ho: π [veteran] - π [non-veteran] = 0).
Difference in means (μ) for independent samples (i.e., Ho: μ [veteran] - μ [non-veteran] = 0).
2-tailed; weighted sample.
Overall, two important findings may be gleaned from Table 1. First, as a group, U.K. veterans appear to have lower than average food insecurity scores than nonveterans on the food insecurity scale. This finding is consistent with that produced by Sharp et al. (2021) using their one-item measure of food insecurity among veterans. Second, veterans have the same, if not lower, the prevalence of food insecurity as nonveterans. The findings for the variable Food Insecurity Indicator fall short of statistical significance, however that result does not contradict findings of previous literature on veteran status and food insecurity (Brostow et al., 2017; Miller et al., 2016). While Table 1 contains evidence that veterans and nonveterans are not that different when it comes to food insecurity, the bivariate analyses did not adjust for other factors that might influence the distribution of food security across the two groups. As previous literature indicates, controlling for other variables while examining the correlation between veteran status and food insecurity matters and can alter findings (Rabbitt & Smith, 2021). Therefore, the next step in the study explored whether veteran status is correlated with the Food Insecurity Scale and/ or the Food Insecurity Index while adjusting for other variables previously identified as important in the veteran food security literature.
Regression of Food Insecurity by Veteran Status
Multivariate regression results for Food Insecurity Scale, Food Insecurity Indicator, Veteran Status, and control variables are shown in Table 2. That table contains regression coefficients (“coef.”—for the OLSR), odds ratios (“OR”—for the LR), and 95% CIs. As expected, the set of predictor variables in Table 2 are consistent across Models 1 and 2 as they represent alternative measures of the concept food insecurity. Models 1 and 2 also explain a modest amount of variance in food insecurity, implying that both models are specified correctly. Model 1, for instance, explains 29% of the variance in the Food Insecurity Scale, while Model 2 explains 23% of the variance (i.e., Cox-Snell R2) in the Food Insecurity Indicator.
Regression of Food Insecurity by Veteran Status, 2022 (Weighted Sample).
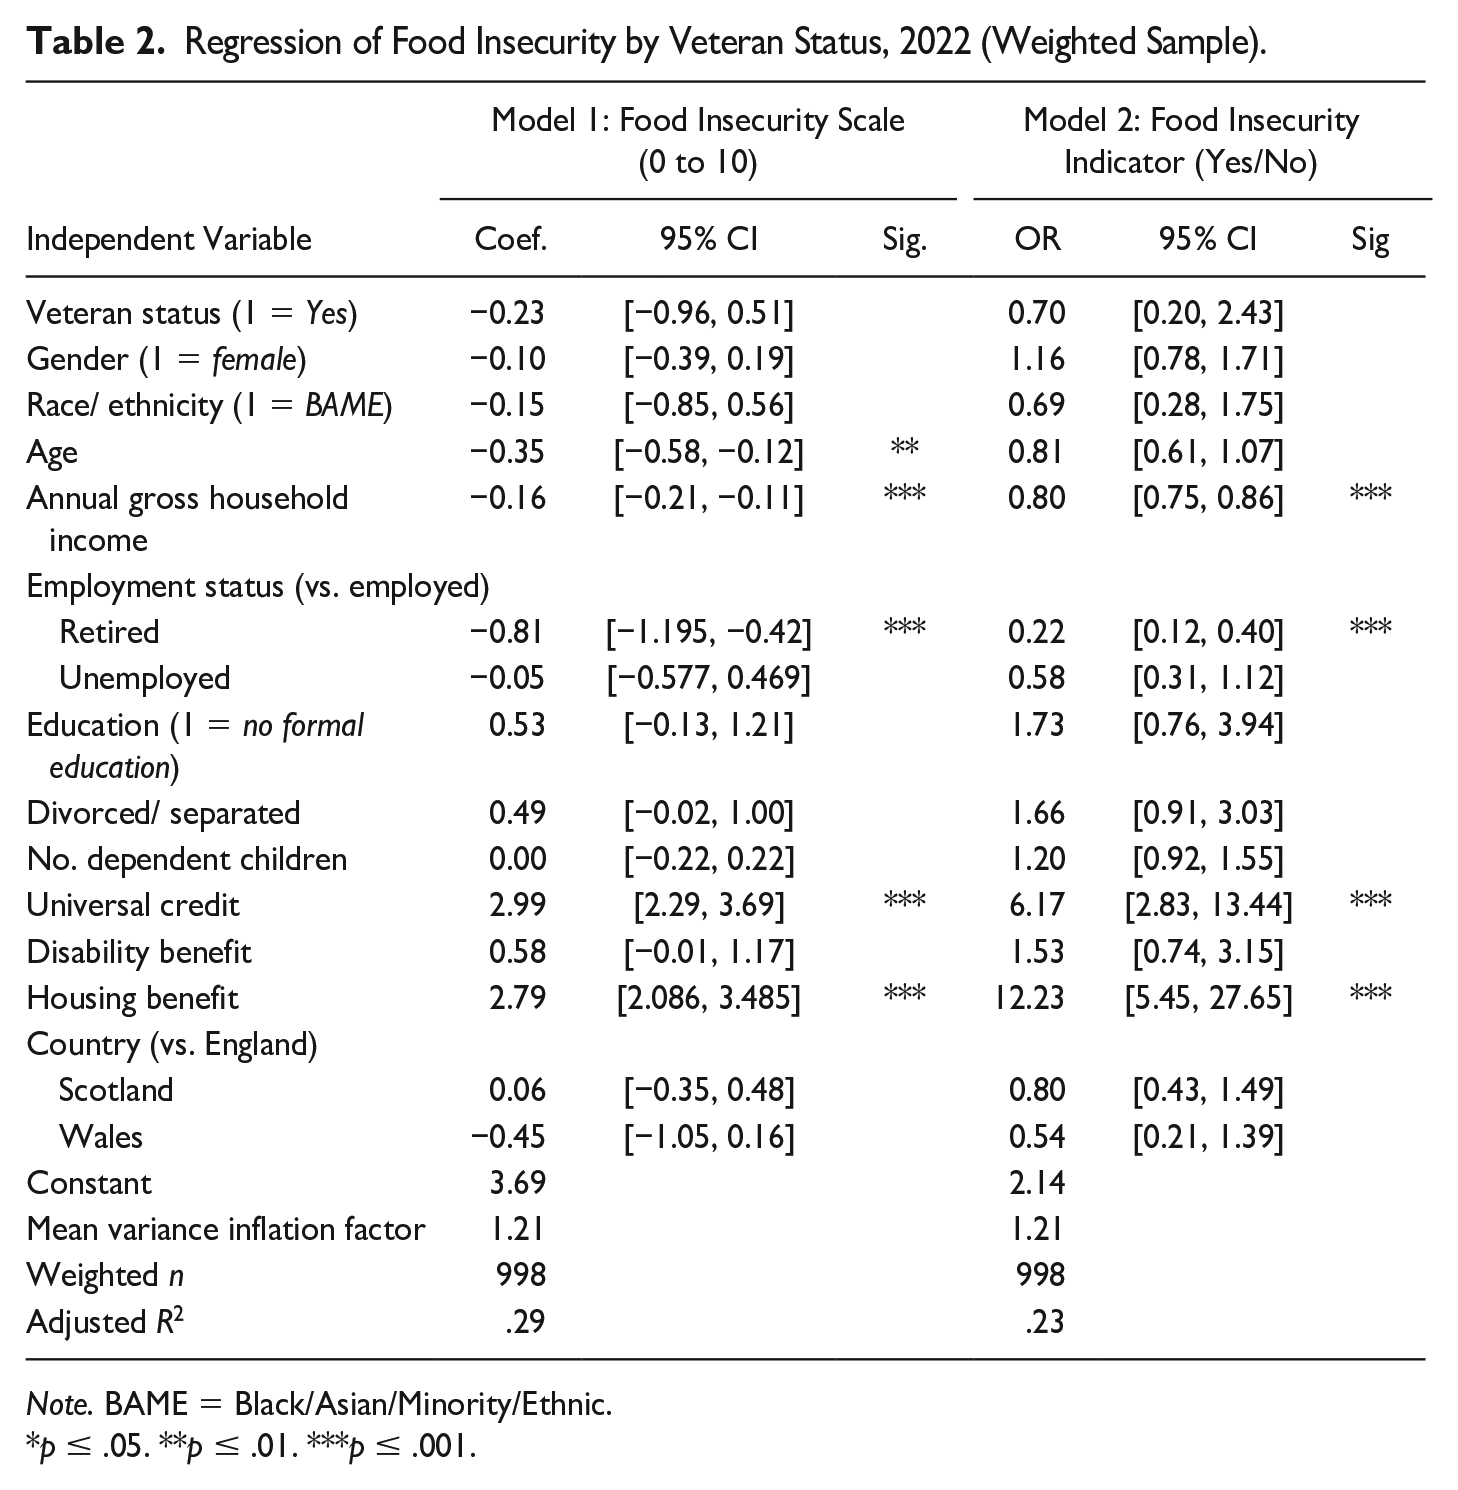
Note. BAME = Black/Asian/Minority/Ethnic.
p ≤ .05. **p ≤ .01. ***p ≤ .001.
Turning to Table 2 and the analyses of veteran status on food security while controlling for added predictors, we find little evidence that veteran and nonveteran populations are different. This is the case because (1) Veteran Status and the Food Insecurity Scale are not correlated (Model 1) and (2) Veterans Status and Food Insecurity Indicator are not correlated (Model 2). It does not appear that veterans are any more food insecure than nonveterans. These findings confirm previous findings in the United States by Kamdar, Lester, et al. (2021).
While veteran status is not correlated with food insecurity, other variables in Table 2 do stand out as potentially important. As Age increases across the sample, for instance, food insecurity decreases (Model 1). Retirement status (vs. employed full/ part-time) is also correlated with food insecurity. Being retired is associated with answering affirmative to between 0.42 and 1.19 fewer questions on the AFFSM when compared with being employed. Being retired is also associated with a decrease in the odds of living in a food-insecure household by a factor 0.21 (OR 95% CI, [0.12, 0.40]). Table 2 also contains evidence that income and food insecurity are correlated. As income increases across the sample, food insecurity decreases (b = −0.12, 95% CI, [−0.21, −0.11]). The most substantial predictors of food insecurity in Table 2 are the variables Universal Credit and Housing Benefit. Receipt of Universal Credit is associated with an increase in the Food Insecurity Scale by 2.99 points (95%CI, [2.29, 3.69]) across the sample while receipt of Housing Benefit is associated with an increase in Food Insecurity Scale by 2.60 points (95%CI, [2.79, 3.49]) across the sample. Both variables also are correlated with the Food Insecurity Indicator, increasing the odds of living in a food insecure household by a factor of 6.17 (95% CI, [2.83, 13.44]) for Universal Credit and a factor of 12.27 (95% CI, 5.45 to 27.65) for Housing Benefit. In sum, while veteran status does not appear to be correlated with food insecurity economic conditions are especially important in predicting the Food Insecurity Scale and the Food Security Indicator among the entire U.K. population.
Regression of Food Insecurity Across Veterans and Non-Veterans
We utilized multivariate regression to analyze veterans and nonveterans separately. Those results are shown in Table 3 (Models 3 and 4). Table 3 shows that the coefficients for the veteran and non-veteran samples are similar for Gross Household Income and Employment Status. The correlation between Housing Benefits and the Food Insecurity Scale is also analogous between the two groups in that receiving housing benefit (vs. not receiving a housing benefit) is associated with an increase of 1.27 points (95% CI, [0.51, 2.02]) on the Food Insecurity Scale among veterans and an increase of 2.88 points (95% CI, [1.97, 3.78]) in the Food Insecurity Scale across nonveterans.
Regression of Food Insecurity Scale Scores For Veterans and Non-Veterans, 2022.
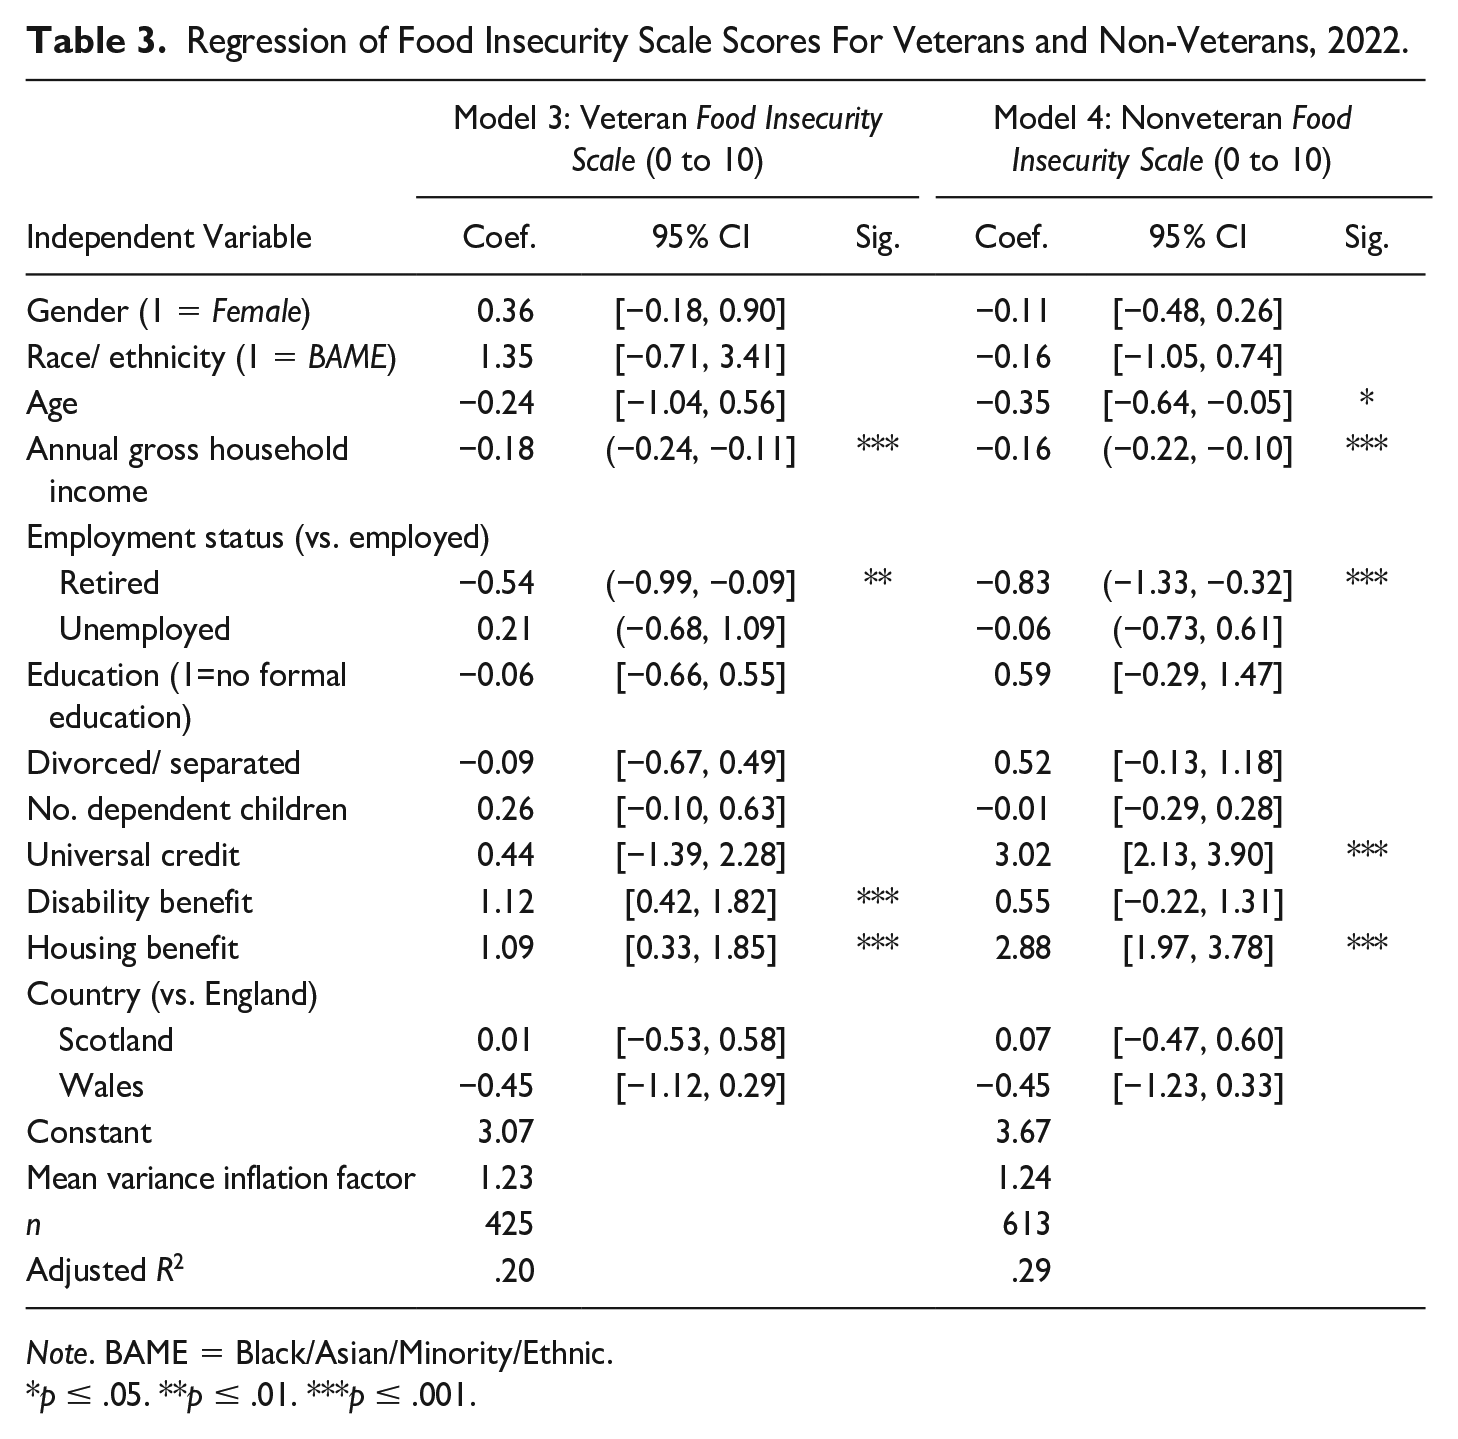
Note. BAME = Black/Asian/Minority/Ethnic.
p ≤ .05. **p ≤ .01. ***p ≤ .001.
There are, however, also differences between veterans and nonveterans. Model 4 shows that Age is negatively correlated with food insecurity among non-veterans. Thus, younger civilians are more likely to live in a food-insecure households than older civilians. Moreover, being in receipt of Universal Credit is significantly and positively correlated with the Food Insecurity Scale for nonveterans only (b = 3.02, CI 95% [2.13, 3.90]).
Another notable difference between the veterans and nonveterans is the variable Disability Benefits. In the case of veterans, Disability Benefits are positive and statistically significant. Veterans who receive disability benefits have higher levels of food insecurity on the Food Insecurity Scale than those who are not receiving such benefits (i.e., b = 1.12, CI 95% [0.42, 1.82]). Disability Benefits, however, are unrelated to food insecurity scores for non-veterans (i.e., b = 0.55, CI 95% [−0.22, 1.31]). This finding implies that in the United Kingdom, disabled veterans are a potentially unique population at risk of food insecurity. This correlation between disability benefits and food insecurity among U.K. veterans is notably comparable to findings in the United States by Wilmoth et al. (2015). Thus, the analysis of food insecurity among U.K. veterans shows there are some differences in risk factors among veterans and nonveterans.
Table 4 repeats the analysis in Table 3, except that the outcome variable is now Food Insecurity Indicator and modeled using LR. Table 4 correlations replicate the correlations in Table 3 in that similar predictor variables are statistically significant across veterans and nonveterans. For instance, increased income (Model 5: OR = 0.64, 95% CI [0.54, 0.77]; Model 6: OR = 0.8, 95% CI [0.74, 0.87]) and retirement (Model 5: OR = 0.34, 95% CI [0.12, 0.91]; Model 6: OR = 0.21, 95% CI [0.09, 0.45]) decrease the odds of experiencing food insecurity.
Logistic Regression of Food Insecurity Indicator For Veterans and Nonveterans, 2022.
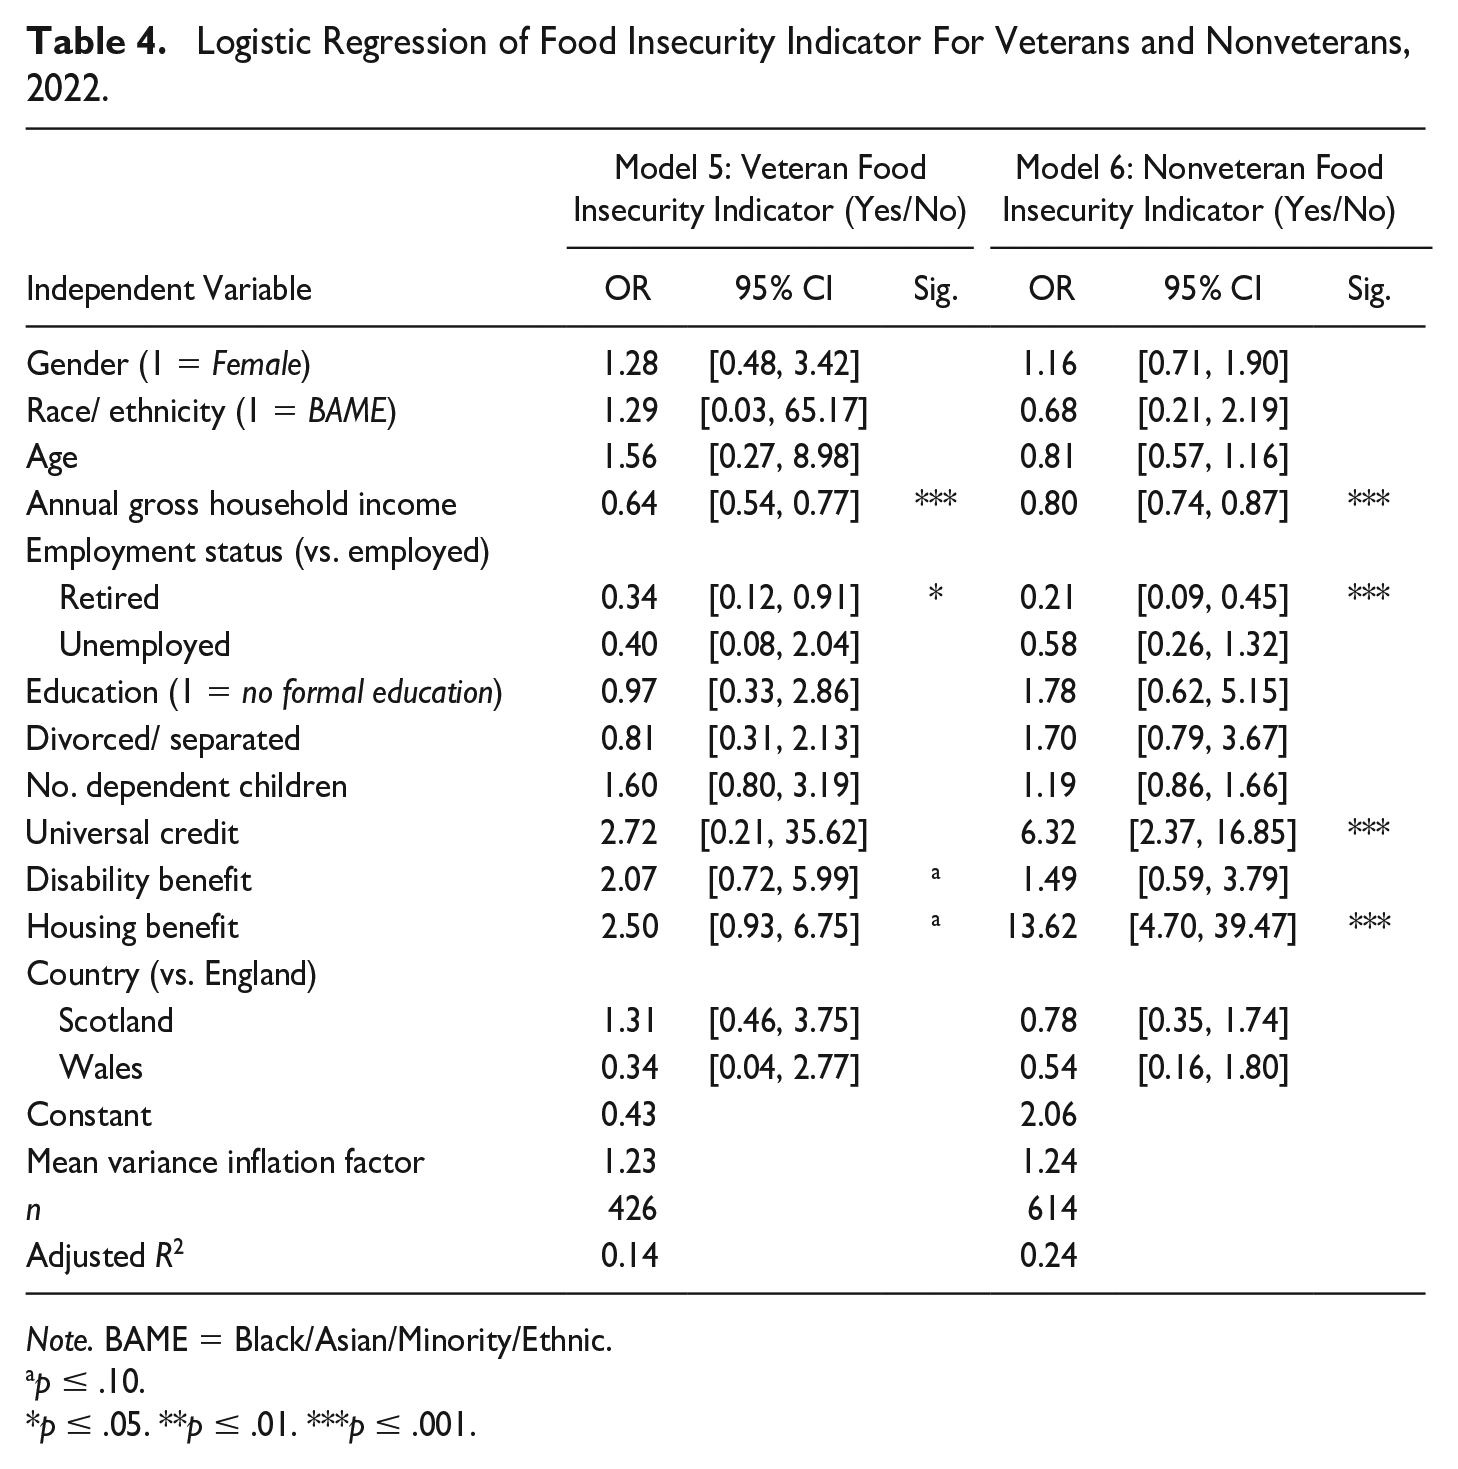
Note. BAME = Black/Asian/Minority/Ethnic.
p ≤ .10.
p ≤ .05. **p ≤ .01. ***p ≤ .001.
Table 4, like Table 3, also shows some differences between veterans and nonveterans. However, while disability benefits were a significant predictor of food insecurity in Table 3, it falls just short of statistical significance in Table 4. That is, veterans receiving disability benefits are more likely to be food insecure (OR = 2.07, p < .10, 95% CI [0.72, 5.99]) only when α = .10. These results are, nevertheless, similar to the findings in Table 3 that show disability benefits are correlated with an increase in the level of food insecurity across the sample (Model 3). In addition, Universal Credit is associated with an increase in the odds that nonveterans will experience food insecurity by a factor of 6.32 (95% CI [2.37-16.85]). However, Universal Credit is not associated with Food Insecurity Indicator in veterans. Finally, nonveterans receiving housing benefits are more likely to live in food-insecure households (Model 6: OR = 13.62, 95%CI [4.7, 39.4]). This same correlation only occurs in the veteran sample when α = .10 (i.e., Model 5: OR = 2.50). Thus, disabled veterans appear to be a unique population in that Tables 3 and 4 provide evidence that they are more likely to be food insecure than nonveterans who are more likely to be food insecure if they face conditions that are associated with universal credit. We focus on the implications of these findings in the next section.
Conclusion
In this study, we focus on the prevalence of food insecurity among veterans in the United Kingdom. We estimate that 1 in 10 U.K. veterans live in a food-insecure household. While bivariate associations show that veterans have lower levels of food insecurity than nonveterans, these differences do not hold up under multivariate analyses. Despite our finding that veteran status and food security are uncorrelated, one potential group of veterans—those who are receiving disability benefits—appear to be uniquely at risk of food insecurity That is, veterans who are in receipt of benefits for a mental and/or physical disability are more likely to live in a food insecure household. This finding is not replicated in the nonveteran population. The implication of this finding is that veteran status may moderate the association between disability benefits and food insecurity. One reason for this finding might be that disabilities among veterans tend to be, on average, more physically/mentally limiting than disabilities in non-veterans (see, for example, Saadat et al., 2010; Tsai & Cao, 2019). If this is the situation, when compared with the civilian population, accessing food may be much more difficult for disabled veterans than for disabled nonveterans. It might also be the case that disabled veterans seek lower levels of state aid than nonveterans who are disabled. Thus, the U.K. veteran population may have unmet needs not found in the civilian population. This interpretation of the data is compatible with observations by Gerber (2003:899) who points out that “disabled veterans are frequently wary of excessive dependence on the state as limiting the attainment of normalization.” Given the uniqueness of this difference between veterans and nonveterans, we recommend more research be carried out on disability status, service-related disability, and food insecurity among veterans.
Our investigation also discovered income and housing benefits are correlated with food insecurity in an analogous way for veterans and nonveterans. Both groups are more likely to live in food-insecure households if they are receiving housing benefits and/or have lower incomes. Retired veterans, just like retired nonveterans, have lower levels of food insecurity than veterans who are employed. This finding suggests that veterans face the same struggles with low-wage employment as nonveterans. In short, veterans and nonveterans appear to be alike when it comes to basic economic struggles such as employment, low income, and housing. Contradictory to earlier research, we did not find that veteran food insecurity is correlated with race/ ethnicity or gender.
Our findings suggest four policy recommendations. First, policymakers who wish to prioritize the matter of food insecurity among veteran households should consider increasing financial aid to charities such as the Armed Forces Covenant Fund Trust. This funding may be directed toward understanding veteran food insecurity through funding mechanisms like the Transformational Grants program that currently prioritizes veteran needs that have largely gone unnoticed (such as food insecurity). Moreover, while the U.K. government supplied £15 million to Armed Forces charities in 2021 (Office for Veterans’ Affairs, 2022, p. 2), this amount could also be increased to help provide more resources to those third-sector organizations. Our findings are clear in that organizations that support veterans with respect to disabilities, housing needs, and employment are particularly important when it comes to attenuating food insecurity (e.g., Walking with the Wounded). These findings suggest that funding streams may need to be directed to these priorities to better serve veterans who live in food-insecure households.
Second, a government agency such as Office for Veterans’ Affairs should ensure a strong network of collaboration to better examine the problem of food insecurity among U.K. veterans. Such a network could include the central government (i.e., Ministry of Defence), local authorities that are often coordinate social work practitioners. and local food aid efforts, academics studying food insecurity and veteran needs, and the large network of third-sector organizations that provide various types of food aid such as the Trussell Trust and Feeding Britain as well as veterans aid, especially Soldiers, Sailors, Airmen, and Families Association who interact with a relatively large number of U.K. veterans.
Third, given that third sector organizations can only work with those veterans who come to their attention, more screening efforts and incentives to seek help are needed. As is noted in the literature, veterans are sometimes reluctant to seek support for their problems (Hoge et al., 2006; Vaughn, 2019) and may resist what they perceive as too much support. Nevertheless, communication with veterans in need about these issues appears to be an important factor in help-seeking behaviors (Kulesza et al., 2015). As a result, another way policy makers could help attenuate veteran food insecurity is to expand the reach of veteran screening tools for those at risk of food insecurity so that they can be signposted to (and encouraged to contact) services where they can receive help (see Fortney et al., 2016). Such an approach is consistent with MacLean et al.’s (2014) recommendations for identifying problems veterans face when leaving military life (MacLean et al., 2014). This emphasis on screening could be easily implemented as training within the recently established NHS “Veteran Aware” initiative that has already helped educate 1,200 health professionals working in general practitioner (GPs) offices on veterans’ issues and could be linked to innovative medical training from NHS Health Education England North East on how to identify food insecurity (see e.g., https://www.youtube.com/watch?v=YuU6Jcsop1I). These combined resources would support health professionals to use their knowledge about veterans’ well-being and food insecurity to help identify food-insecure veterans and provide them with treatment and referrals to appropriate services.
Finally, we suggest that the government make better use of existing survey data sources by including a measure of veteran status in those surveys. For example, the Department of Work and Pensions could easily include an indicator of veteran status in their Family Resource Survey. Such information would allow researchers to gain a great deal of information about veterans’ food insecurity for little cost. This recommendation to include a veteran indicator in major population surveys is consistent with the call for better administrative data in the Veterans Strategy Action Plan for 2022-2024 (Office for Veterans’ Affairs, 2022).
While the current study is the first in the United Kingdom to compare rates of food insecurity among veteran and nonveteran households, there are a few limitations to this research. First, this is a cross-sectional study, and the findings cannot establish causality. Thus, is not possible to describe how food security may change over time or how disability status can be mitigated to reduce future food insecurity. Second, and importantly, while disability and housing benefits are correlated with food security, these are indirect measures of disability and housing challenges and only represent veterans who have been successful in obtaining these benefits. Third, this study excludes individuals who do not have access to the world wide web or are digitally illiterate and may not have been able to fill out an online questionnaire. As a result, our estimates of the prevalence of food insecurity may be higher than what we have found in this study.
In the end, addressing food insecurity is a national priority (Barker & Russell, 2020; Food Foundation, 2022; Garthwaite et al., 2015). As former Prime Minister Boris Johnson (Office for Veterans’ Affairs, 2022, p. 2) points out in the Veterans’ Strategy Action Plan, “we are determined [to make] the United Kingdom the best place in the world to be a veteran by 2028.” Part of that effort relies on finding and helping veteran populations at risk. We find low-income disabled veterans in receipt of housing benefits are at particular risk of food insecurity. We suggest that future studies replicate these findings and prioritize two more areas of research. First, there is a need for a greater understanding of how housing and disability aid could alter veteran food insecurity over time. As a result, future research might focus on longitudinal changes in levels of food insecurity, housing aid, and disability aid to decide if and how this type of help can mitigate food insecurity. Second, future studies of veteran food insecurity might also consider those factors that predict whether veterans engage in help-seeking behaviors regarding food insecurity. Finding those veterans who are more or less likely to seek help and better understand the impact of that help on food insecurity will be critical to attenuating food insecurity in this population. We hope that this research has not only supplied a justification for better screening among veterans but can also serve as a starting point for future research on veterans and food insecurity in the United Kingdom.
Supplemental Material
sj-xlsx-1-afs-10.1177_0095327X221151078 – Supplemental material for Food Insecurity Among U.K. Veterans
Supplemental material, sj-xlsx-1-afs-10.1177_0095327X221151078 for Food Insecurity Among U.K. Veterans by Paul B. Stretesky and Margaret Anne Defeyter in Armed Forces & Society
Footnotes
Appendix A
U.S. Adult Food Security Module.
| Item | Affirmative response | Percentage of Veterans with affirmative response (n) | Percentage of Nonveteran’s with affirmative response (n) |
|---|---|---|---|
| “(I/We) worried whether (my/our) food would run out before (I/we) got money to buy more.” | Sometimes true or often true | 11.8 (66) | 22.1 (205) |
| “The food that (I/we) bought just didn’t last, and (I/we) didn’t have money to get more.” | Sometimes true or often true | 9.3 (52) | 17.3 (160) |
| “(I/we) couldn’t afford to eat balanced meals.” | Sometimes true or often true | 13.0 (72) | 23.1 (212) |
| In the last 30 days, did (you/you or other adults in your household) ever cut the size of your meals or skip meals because there wasn’t enough money for food? | Yes | 7.4 (42) | 13.1 (119) |
| [IF YES ABOVE, ASK] In the last 30 days, how many days did this happen? | 3 days or more | 7.0 (40) | 13.0 (118) |
| In the 30 days, did you ever eat less than you felt you should because there wasn’t enough money for food? | Yes | 8.1 (45) | 14.8 (136) |
| In the last 30 days, were you every hungry but didn’t eat because there wasn’t enough money for food? | Yes | 4.9 (28) | 10.4 (96) |
| In the last30 days, did you lose weight because there wasn’t enough money for food? | Yes | 4.0 (23) | 6.9 (63) |
| In the last 30 days, did (you/you or other adults in your household) ever not eat for a whole day because there wasn’t enough money for food? | Yes | 2.0 (12) | 3.7 (34) |
| [IF YES ABOVE, ASK] In the last 30 days, how many days did this happen? | 3 days or more | 2.0 (12) | 4.0 (33) |
| Affirmative response to 1 question or more | 17.3 (97) | 28.4 (241) |
Appendix B
Descriptive Statistics (Weighted Sample), n = 1,492.
| Variable | Minimum value | Maximum value | Mean/proportion | Median | No. missing observations | % Missing observations |
|---|---|---|---|---|---|---|
| Food Insecurity Scale | 0 | 10 | 1.24 | 0 | 6 | 0.40 |
| Food Insecurity Indicator | 0 | 1 | 0.11 | 0 | 6 | 0.40 |
| Veteran status (1 = Veteran) | 0 | 1 | 0.04 | 0 | 0 | 0.00 |
| Gender (1 = Female) | 0 | 1 | 0.48 | 0 | 0 | 0.00 |
| Race/ ethnicity (1=BAME) | 0 | 1 | 0.05 | 0 | 18 | 1.20 |
| Age | 1 | 4 | 3.35 | 4 (55+ Yrs Old) | 0 | 0.00 |
| Gross household income | 1 | 14 | 7.98 | 7 (30k to 35k) | 327 | 21.80 |
| Retired | 0 | 1 | 0.33 | 0 | 18 | 1.20 |
| Unemployed | 0 | 1 | 0.13 | 0 | 18 | 1.20 |
| Education (1 = no formal education) | 0 | 1 | 0.04 | 0 | 32 | 2.13 |
| Divorced/ separated | 0 | 1 | 0.08 | 0 | 23 | 1.53 |
| No. dependent children | 0 | 5 | 0.33 | 0 | 100 | 6.67 |
| Universal credit | 0 | 1 | 0.05 | 0 | 85 | 5.67 |
| Disability benefit | 0 | 1 | 0.08 | 0 | 85 | 5.67 |
| Housing benefit | 0 | 1 | 0.05 | 0 | 85 | 5.67 |
| Country | ||||||
| England | 0 | 1 | 0.81 | 1 | 0 | 0.00 |
| Scotland | 0 | 1 | 0.13 | 0 | 0 | 0.00 |
| Wales | 0 | 1 | 0.06 | 0 | 0 | 0.00 |
Note. BAME = Black/Asian/Minority/Ethnic.
Appendix C
Logistic Regression of Food Insecurity Indicator for Veterans and Nonveterans, Excluding Annual Gross Income.
| Model 11: Veteran Food Insecurity Indicator (Yes/No) | Model 12: Non-Veteran Food Insecurity Indicator (Yes/No) | |||||
|---|---|---|---|---|---|---|
| Independent Variable | OR | 95% CI | Sig. | OR | 95% CI | Sig. |
| Gender (1 = Female) | 1.59 | [0.70, 3.62] | 1.36 | [0.9, 2.07] | ||
| Race (1 = BAME) | 1.45 | [0.08, 26.67] | 0.74 | [0.29, 1.89] | ||
| Age | 1.23 | [0.30, 5.14] | 0.81 | [0.6, 1.08] | ||
| Employment status (vs. employed) | ||||||
| Retired | 0.87 | [0.38, 1.98] | 0.44 | [0.44, 0.82] | ** | |
| Unemployed | 1.14 | [0.30, 4.35] | 1.04 | [0.56, 1.93] | ||
| Education (1 = no formal education) | 1.23 | [0.44, 3.47] | 2.04 | [0.82, 5.06] | ||
| Divorced/ separated | 2.09 | [0.93, 4.71] | * | 2.47 | [1.3, 4.71] | ** |
| No. dependent children | 1.23 | [0.68, 2.23] | 1.04 | [0.78, 1.39] | ||
| Universal credit | 1.48 | [0.18, 12.40] | 7.58 | [3.45, 16.6] | *** | |
| Disability | 2.18 | (0.87, 5.49] | * | 1.49 | [0.69, 3.22] | |
| Housing | 4.73 | [1.86, 12.04] | *** | 9.63 | [3.99, 23.2] | *** |
| Region (vs. England) | ||||||
| Scotland | 1.46 | [0.62, 3.47] | 0.75 | [0.39, 1.46] | ||
| Wales | 0.75 | [0.17, 3.35] | 0.59 | [0.21, 1.61] | ||
| Constant | −3.53 | 0.31 | ||||
| Mean VIF | 1.20 | 1.20 | ||||
| n | 519 | 769 | ||||
| Adjusted R2 | .07 | .22 | ||||
Note. BAME = Black/Asian/Minority/Ethnic.
p ≤ .05. **p ≤ .01. ***p ≤ .001.
Acknowledgements
We would like to thank Patricia M. Shields and the reviewers of Armed Forces and Society for their encouragement, insight and suggestions. We would also like to acknowledge Alastair Macmillan, Chloe Dunnett, and Merle Dias at YouGov (www.yougov.com) for helping us obtain the veteran sample. We are grateful to Tommy Watson from Walking with the Wounded (![]() ) for his insight into veteran needs and food insecurity. Finally, we would like to recognize Kenny Jacob from the Department of Work and Pensions for insight into data on veterans and food insecurity and Matt Kiernan for sharing his knowledge on disability and veterans’ charity. Any errors in the manuscript are exclusively the responsibility of the authors.
) for his insight into veteran needs and food insecurity. Finally, we would like to recognize Kenny Jacob from the Department of Work and Pensions for insight into data on veterans and food insecurity and Matt Kiernan for sharing his knowledge on disability and veterans’ charity. Any errors in the manuscript are exclusively the responsibility of the authors.
Declaration of Conflicting Interests
The authors declared no potential conflicts of interest with respect to the research, authorship, and/or publication of this article.
Funding
The authors disclosed receipt of the following financial support for the research, authorship, and/or publication of this article: We would like to thank the Departments of Social Sciences and Health and Life Sciences at Northumbria University for supplying the funding to pay for the YouGov sample.
Notes
Author Biographies
References
Supplementary Material
Please find the following supplemental material available below.
For Open Access articles published under a Creative Commons License, all supplemental material carries the same license as the article it is associated with.
For non-Open Access articles published, all supplemental material carries a non-exclusive license, and permission requests for re-use of supplemental material or any part of supplemental material shall be sent directly to the copyright owner as specified in the copyright notice associated with the article.