
Abstract
This study details the synthesis of poly(erythritol sebacate) (PES), a polyester synthesized via thermal/enzymatic polycondensation of erythritol and sebacic acid in a three-step process. In the first step, a 1:1 molar ratio erythritol and sebacic acid was used, at various temperatures until achieving a theoretical 40% degree of esterification. The second prepolymerization step utilized Candida antarctica lipase B under different conditions. This was followed by a curing step at 150°C for 24 hours. The results indicated that a temperature of 150°C yielded a more homogeneous prepolymer richer in linear ester oligomers, making it the selected condition for the first prepolymerization step. Afterwards, the second prepolymerization yielded prepolymers with varying degrees of esterification and molecular mass distributions, confirming the high selectivity of lipase B for primary hydroxyl groups. These differences in prepolymers influenced the mechanical properties of the resulting polymers after the curing process. Notably, the enzymatic synthesis at 90°C for 48 hours resulted in a prepolymer with a higher degree of esterification (68%) and longer linear chains, producing the polymer with the best mechanical performance. These findings suggest that enzymatic polymerization, under optimal conditions, can yield PES with properties suitable for a wide range of applications.
Introduction
Erythritol (meso-1,2,3,4-butanetetraol or meso-erythritol) is a C4 polyol used as sweetener or in cosmetics and in pharmaceutical applications.1–5 It is produced based on biotechnological fermentative processes of Moniliella pollinis, Moniliella megachiliensis, and Yarrowia lypolitica4,6 and its global production currently stands at around 60.000 tons per year, which represents a significant growth in production since 2011.4,7 Although it has been extensively studied and used in areas related to food and pharmaceutical products, its use in the synthesis of polymers remains largely unexplored. 8 However, a few studies on the use of erythritol for polymer synthesis can be found in the literature.9–12
In the synthesis of poly(erythritol-co-dicarboxylate) elastomers, different dicarboxylic acids with carbon chain lengths from 5 to 14 (sebacic acid included) were already used without the addition of catalysts or co-reagents. 9 All the prepolymers were synthesized at 145°C under stirring for 9 hours and then purified by precipitation with methanol. This was followed by a 3-day curing process using temperatures of 120°C and 140°C, resulting in poly (erythritol sebacate) (PES) with different mechanical properties. PES cured at 120°C is a soft and elastic material, while PES cured at 140°C is stiffer. Furthermore, PES synthesis was studied at higher temperatures without the use of catalysts in a two-steps approach. 12 A prepolymerization step was carried on at different temperatures (150°C, 160°C and 170°C) until 50% degree of polymerization was reached. The synthesis at 150°C produced a PES with superior mechanical performance and higher chemical resistance to solvents.
Despite of being mainly produced via chemical routes, PES can also be produced using enzymes. Due to its selectivity and high thermal stability, Candida antarctica lipase B (CALB) is commonly used in esterification, amidation, and hydrolysis reactions to synthesize surfactants, monomers, polymers, and biolubricants. 13 CALB, especially in its immobilized form as Novozyme 435 (N435) on acrylic resin, has selectivity for primary hydroxyls, preventing cross-linking and enabling the formation of high-molecular-weight polyesters, such as PGS. Izquierdo et al. 14 explored the enzymatic synthesis of furan-based oligoesters via transesterification of dimethyl 2,5-furandicarboxylate with linear α,ω-aliphatic diols (C2–C12), utilizing immobilized lipase B from Novozym 435) demonstrating that the chain length of the diols significantly influences the yield and type of oligoesters formed. High substrate conversion rates (90–95%) were achieved for C4–C12 diols, while shorter diols like ethylene glycol and 1,3-propanediol showed moderate conversion (∼75%). The resulting oligoesters, obtained under mild conditions, have potential applications as macromonomers in biobased materials. Todela et al. 15 investigated the enzymatic copolymerization of ε-caprolactone with hydroxy-fatty acids using various immobilized lipases, including those from Candida antarctica and Thermomyces lanuginosus. The research highlighted the ability to tailor the ratio of linear to cyclic oligomers by selecting appropriate biocatalysts and reaction conditions. The synthesized oligoesters exhibited promising thermal stability and are considered potential candidates for biomedical applications due to their biobased origin and functional properties. Villeneuve et al. 16 synthesized polyfunctional glycerol esters by investigating the lipase-catalyzed esterification of glycerol with dicarboxylic acids or their esters, aiming to obtain mono- and diesterified glycerol derivatives. The study explored various strategies to optimize reaction yields, including the use of protected glycerol and solvent-free conditions. The resulting esters were identified as valuable intermediates for the production of biodegradable polymers and surfactants.
In this study, the synthesis and characterization of PES is presented, through a three-step thermal/enzymatic polycondensation of erythritol and sebacic acid. The first step, prepolymerization, was conducted at varying temperatures to reach an estimated 40% degree of esterification. The second prepolymerization step involved the use of N435 at different durations (24 h and 48 h) and temperatures (70°C and 90°C). Finally, a curing step was performed at 150°C for 24 h to complete the process. Overall, this work was motivated by the goal of developing a synthesis method to produce PES with enhanced physical and chemical properties compared to those previously reported, thereby advancing the understanding and applications of PES synthesis.
Material and methods
Materials
Erythritol and sebacic acid were purchased from Sigma-Aldrich with 99% purity. Lipase acrylic resin (Novozym 435 “N435”) ≥5000 U.g−1, recombinant, expressed in Aspergillus niger, was purchased as well from Sigma-Aldrich.
Synthesis of prepolymers (1st step optimization)
The polycondensation reactions were performed using erythritol (E) and sebacic acid (S) in 1:1 molar ratio, at 125°C, 135°C, 150°C and 165°C. Reactions were carried out in batch mode using a PARR reactor with a 300 mL stainless-steel vessel and a PARR 4843 controller. Nitrogen atmosphere was used to avoid oxidation and to purge any formed condensation. The reactions were stopped when the degree of esterification reached approximately 40%, determined by the collected water. This degree of polymerization corresponds to the theorical water produced when 35% of carboxylic acid groups are converted to ester bonds.
Synthesis of prepolymers (2nd step - enzymatic)
Enzymatic reactions were carried out in batch mode using a rotary evaporator (Buchi) connected to ILMVAC 600 T vacuum pump. The reactions were carried out at 70°C or 90°C for 24 h or 48 h. The initial prepolymers (DE-35%) in waxy state were melted, after which the N435 was added and the vacuum pump programed to 100 mbar. At the end, N435 was removed from prepolymers using a 100 µm sieve.
Synthesis of final polymers (3rd step - curing)
The cure step of each polymer was carried out in a VT 6025 vacuum oven (Thermo Scientific) coupled with a ILMVAC MP 601 T vacuum pump (full capacity: ultimate exhaust < 1mbarr). Prepolymers were cured in dog-bone shaped geometry according to DIN EN ISO 527-2. First, degassing was performed to remove any dissolved gases in the prepolymers. Then, the prepolymers were heated up to 99°C to facilitate degassing, as this temperature maintains a low-viscosity liquid state, allowing the vacuum pump to operate at full capacity for 1 hour. After the degassing step, the prepolymers were transferred into pre-heated molds and heated at 99°C under vacuum overnight. Next, the temperature was gradually increased from 99°C to 150°C in a controlled ramp. The temperature was initially raised to 120°C and held for 1 hour, then to 130°C for 3 hours, and finally to 150°C for 24 hours. After 3 hours at 150°C, the vacuum pump was turned off, and the oven system was sealed to maintain the vacuum. Lastly, the materials were cooled down to room temperature, removed from the molds and weighed on a KERN ACJ 320-4M scale for quality control.
Characterization
Fourier-transform infrared spectroscopy (FTIR) spectra were collected on a Perkin Elmer FTIR System Spectrum BX Spectrometer equipped with a single horizontal Golden Gate ATR cell. The prepolymers and final polymers were analyzed at room temperature, and data were recorded in the range of 4000 to 400 cm−1 by accumulating 32 scans with a resolution of 4 cm−1.
Electrospray mass spectrometer is a linear ion trap mass spectrometer LXQ (ThermoFinnigan, San Jose, CA). Data acquisition and analysis were performed using the Xcalibur Data System (version 2.0, ThermoFinnigan, San Jose, CA). ESI conditions in electrospray linear ion trap mass spectrometer (ThermoFinnigan) were as follows: electrospray voltage was 4.7 kV in negative mode, and 5 kV in positive mode; capillary temperature was 275°C, and the sheath gas flow was 25 U. Full scan MS spectra were acquired with a 50 ms maximum ionization time. Mass signals were considered between m/z 200–2000 and defined in Relative Abundance (RA) which means the area of the mass peaks. Prepolymers were dissolved in methanol to obtain a concentration of 1 mg.mL−1.
After the enzymatic prepolymerization step, the pPES (1:1) were characterized by gel permeation chromatography (GPC) performed on a Malvern Panalytical’s OMNISEC instrument equipped with a 2 PGL Mix_D column kept at 50°C and using 0.1 M LiCl in dimethylsulfoxide solution as eluent at a flow rate of 1.0 mL.min−1. The detection was performed using a Malvern OMNISEC refractive index detector. The pPES(1:1) solutions in 0.1 M LiCl dimethylsulfoxide were prepared at a concentration of 5.0 mg.mL−1 and filtered in poly-(tetrafluoroethylene) filters (0.22 μm) before analysis. Polystyrene (PS) standards (PL-Polymer Laboratories) with the molecular weight ranging from 1700 to 170 600 g/mol were used to determine the relative molecular weight of the pPES(1:1) samples. The software OMNISEC v11.41 (Reveal, Malvern) was used for data collection.
13C NMR spectra were recorded on a Bruker 300 MHz (11.8 T), AscendTM, standard-bore using methyl sulfoxide-d6, containing 1% (v.v−1) TMS. 25 mg of prepolymers samples were dissolved in 0.6 mL of deuterated solvent and transferred to NMR tubes.
Differential scanning calorimetry (DSC) (Netzsch DSC 204F1 Phoenix) was performed between −80 and 200°C, at a heating scan of 10°C/min in pierced aluminum concave crucibles with N2 flux (40 mL.min−1– 60 mL.min−1).
Dynamic mechanical analysis (DMA) of the final polymers was carried out using Tritec 2000 equipment (Triton Technologies) in tension mode using a strain factor of 200. Samples with dimensions of 5 × 3.7 × 2 mm3 were analyzed over a temperature range from −80°C to 100°C, with a constant heating rate of 2°C/min, and a frequency of 1 Hz.
Thermogravimetric analysis (TGA) was carried out using a Themys one (Setaram) over a temperature range from 35°C to 800°C, with a heating rate of 10°C.min−1 under an N2 atmosphere.
Tensile tests of PES dog-bone specimens were conducted on a Hegewald & Peschke universal testing machine Inspekt solo, equipped with a 2.5 kN load cell, in accordance with DIN EN ISO 527. Tensile tests were performed at a speed of 10 mm.min−1 up to the breaking point, to determine the ultimate tensile strength (UTS), elongation at break and Young’s modulus.
The gel fraction and swelling experiments were conducted using three solvents—tetrahydrofuran (THF), ethanol, and water—using the ends of dog-bone samples (weighing between 160 and 220 mg) as test pieces. Each polymer was immersed in each solvent at room temperature (∼23°C) for 72 hours in screw-top vials. After immersion, the swollen samples were dried in a vacuum oven, first at room temperature for 48 hours, then at 90°C for the final 24 hours under vacuum. In the final 8 hours, all samples achieved a stable weight. The gel fraction (%) represents the percentage of the polymer’s insoluble mass relative to the initial sample mass, while the degree of swelling (DS) is calculated as the ratio of the solvent mass retained to the mass of the gel fraction, being respectively determined by:


Results and discussion
Synthesis and characterization of prepolymers
Synthesis of PES (1:1) was obtained by polycondensation of sebacic acid (S) with erythritol (E) through a 3-step process, as shown in Figure 1. Representation of the strategy used to produce PES.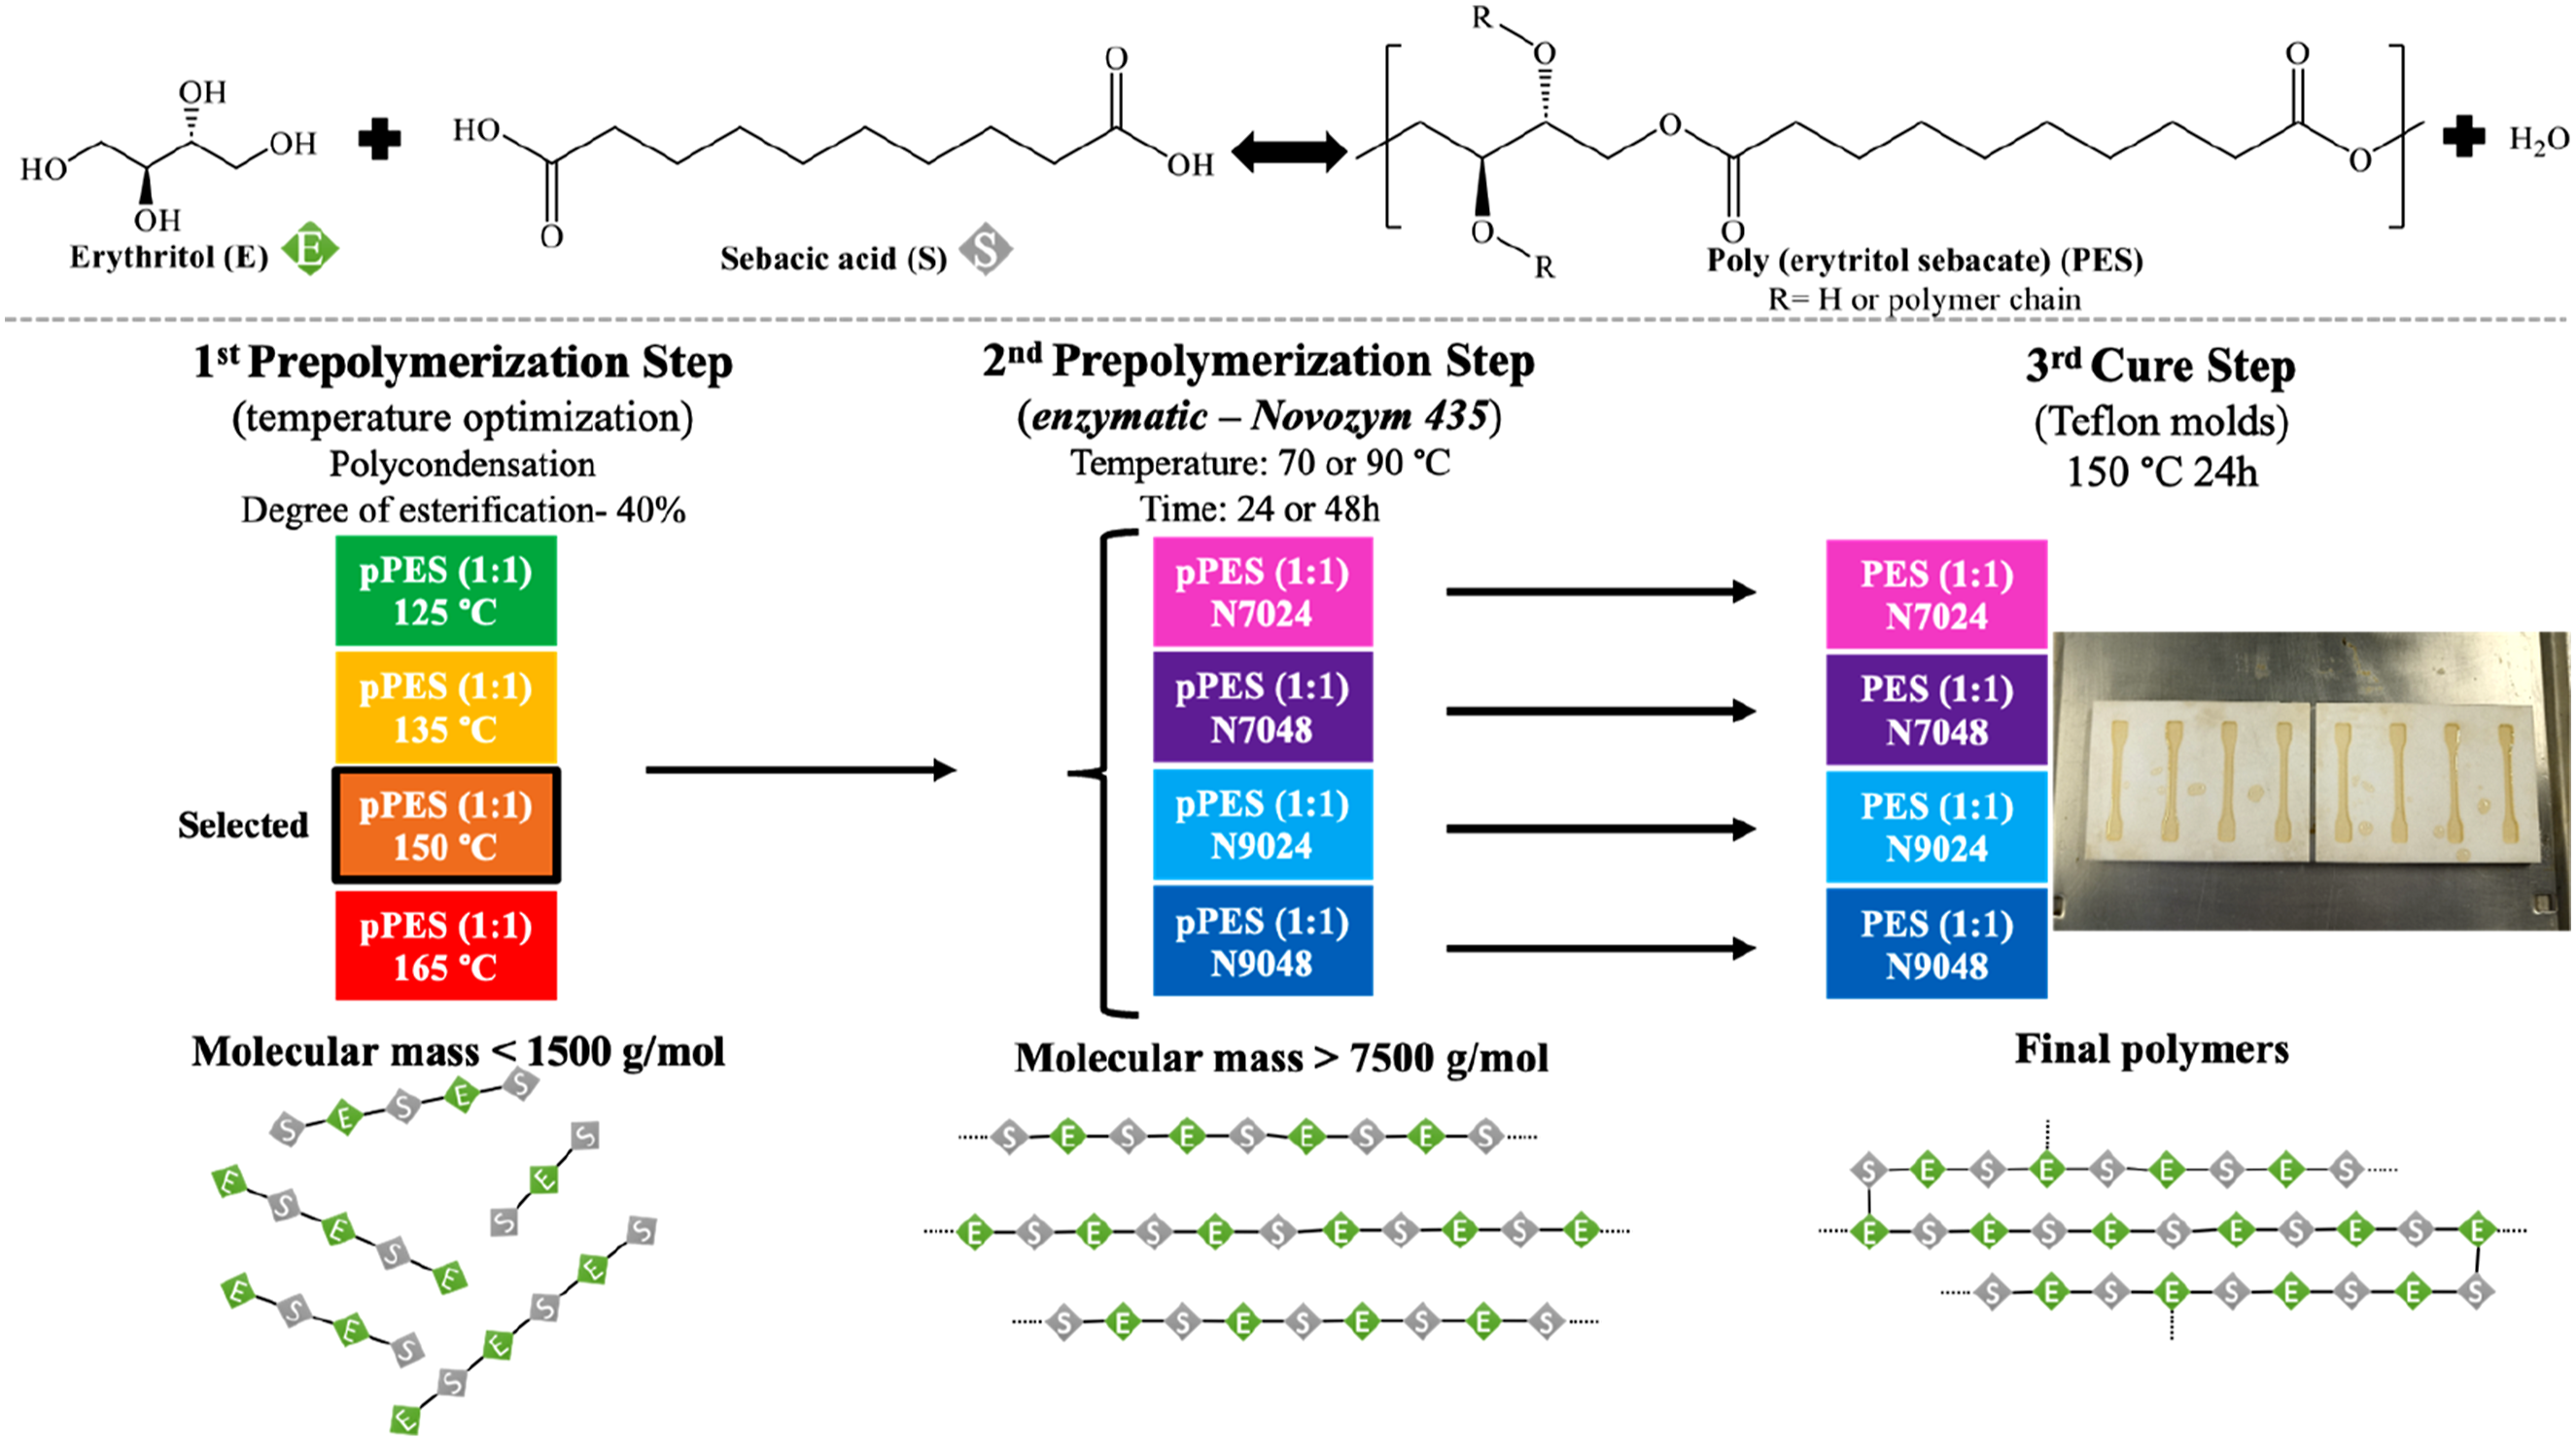
1st prepolymerization step
The melting of erythritol and sebacic acid occurs between 119 and 123°C
17
and 130°C–131°C,
18
respectively, hence at room temperature both reagents are solids, therefore the initial medium is heterogeneous. For this reason, starting the reaction with solid enzymes is impractical, hence, to avoid jeopardizing the enzyme support during the initial stirring, high-boiling organic solvent medium can be used, as reported by Linko et al.
19
Alternatively, the reaction medium can be in a liquid stat, hence, a prepolymerization up to 40% of the theoretical degree of esterification (DE) was carried out using different temperatures (125°C, 135°C, 150°C and 165°C), which resulted in low molecular weight pPES (1:1) with a melting point up to 70°C. As mentioned, the DE of 40% was determined based on the water collected from the reactor, and as observed from Figure 2, temperature has a strong influence on the reaction rate. A solid correlation (R2 = 0.999) between the temperature and the reaction time needed to reach a DE of 40% was observed. Higher temperatures reduce the reaction time significantly, but also influence the profile of formed oligomers. In fact, in addition to esterification reactions, secondary etherification reactions can also occur, which are catalyzed by the acidity of the reaction medium.12,20,21 Prepolymerization time required to achieve pPES (1:1) with a degree of esterification up to 40% for each tested temperature: pPES (1:1) 125°C (green), pPES (1:1) 135°C (yellow), pPES (1:1) 150°C (orange) and pPES (1:1) 165°C (red).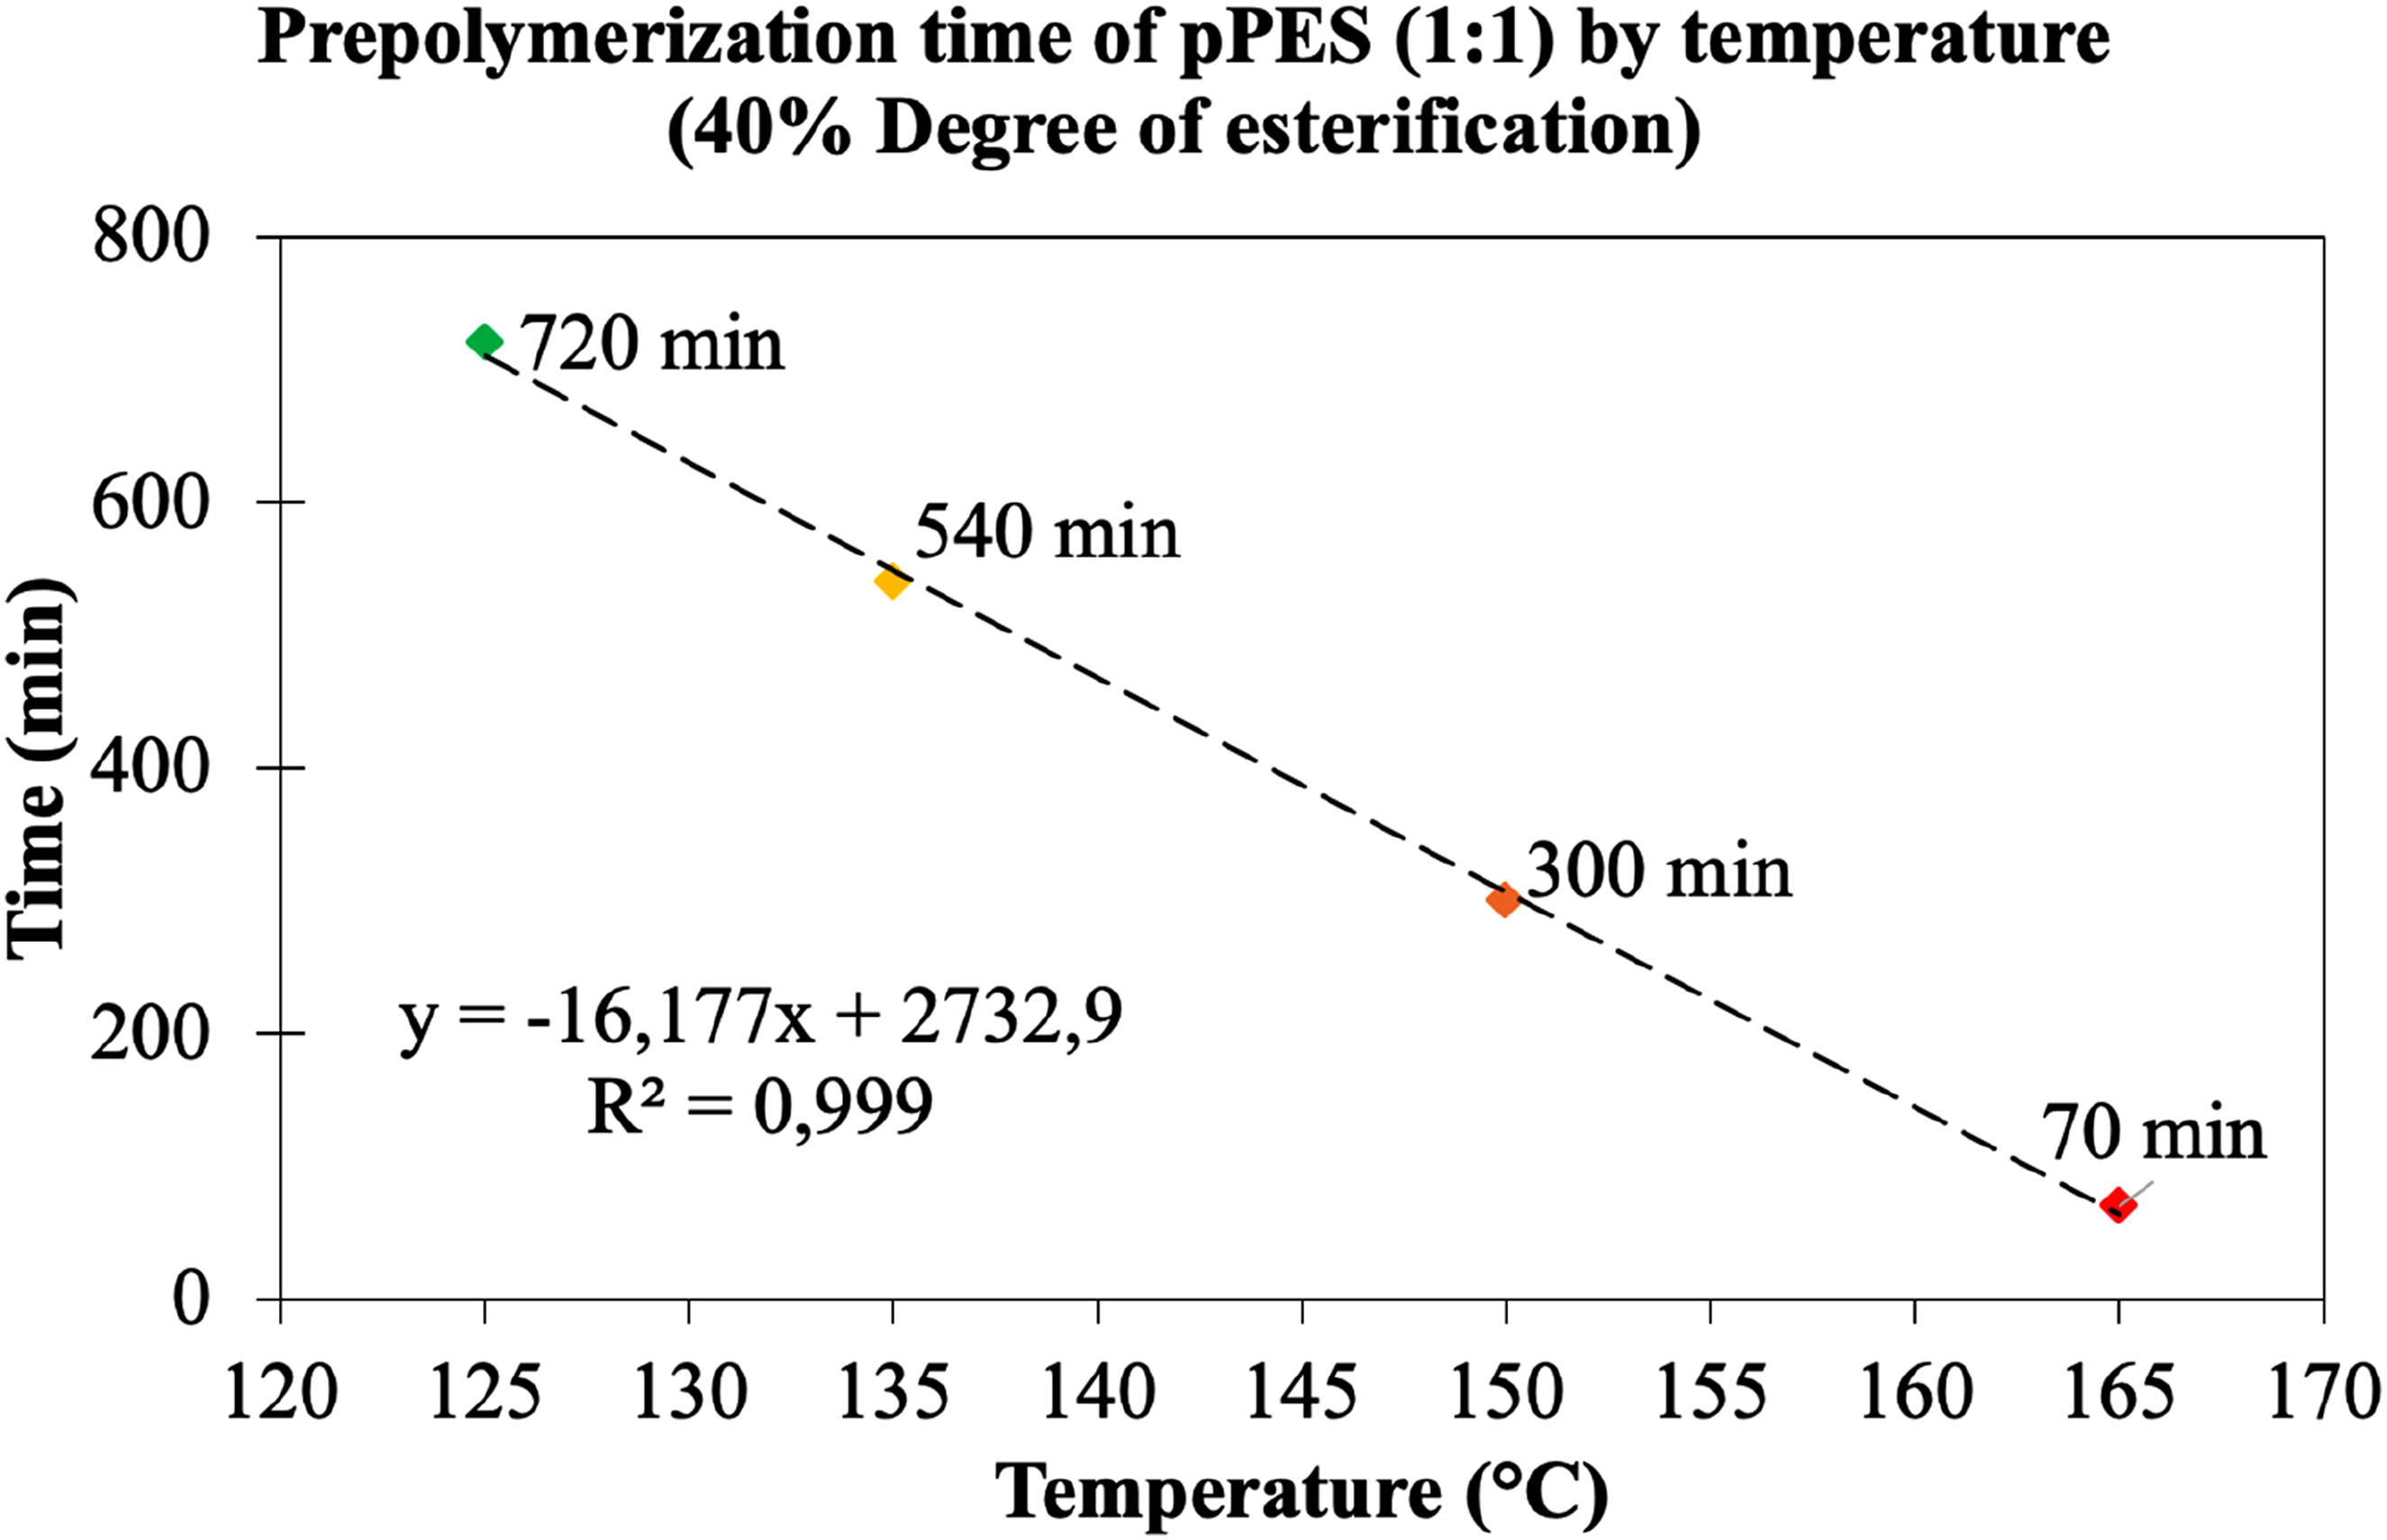
For the evaluation of the oligomer profile, the possibility of secondary reactions was considered, therefore, the mass distribution profile of each pPES (1:1) based on all peaks identified and the top 5 most abundant oligomers was determined (see Figure 3). Oligomers with a mass greater than 1500 g⋅mol−1 were not found and a major part of identifications occurred under 955 g⋅mol−1. The detailed identification of oligomers and the ESI-MS data are presented in the supporting information. (a) Mass distribution of 1st step prepolymers based on identified oligomers expressed in % - Relative Abundance (%-RA), obtained from ESI-MS data processing: pPES (1:1) 125°C (green), pPES (1:1) 135°C (yellow), pPES (1:1) 150°C (orange) and pPES (1:1) 165°C (red). Top 5 most abundant oligomers for each prepolymer. (b) FTIR spectra of each pPES (1:1) for carboxylic signals area (1800 – 1650 cm−1).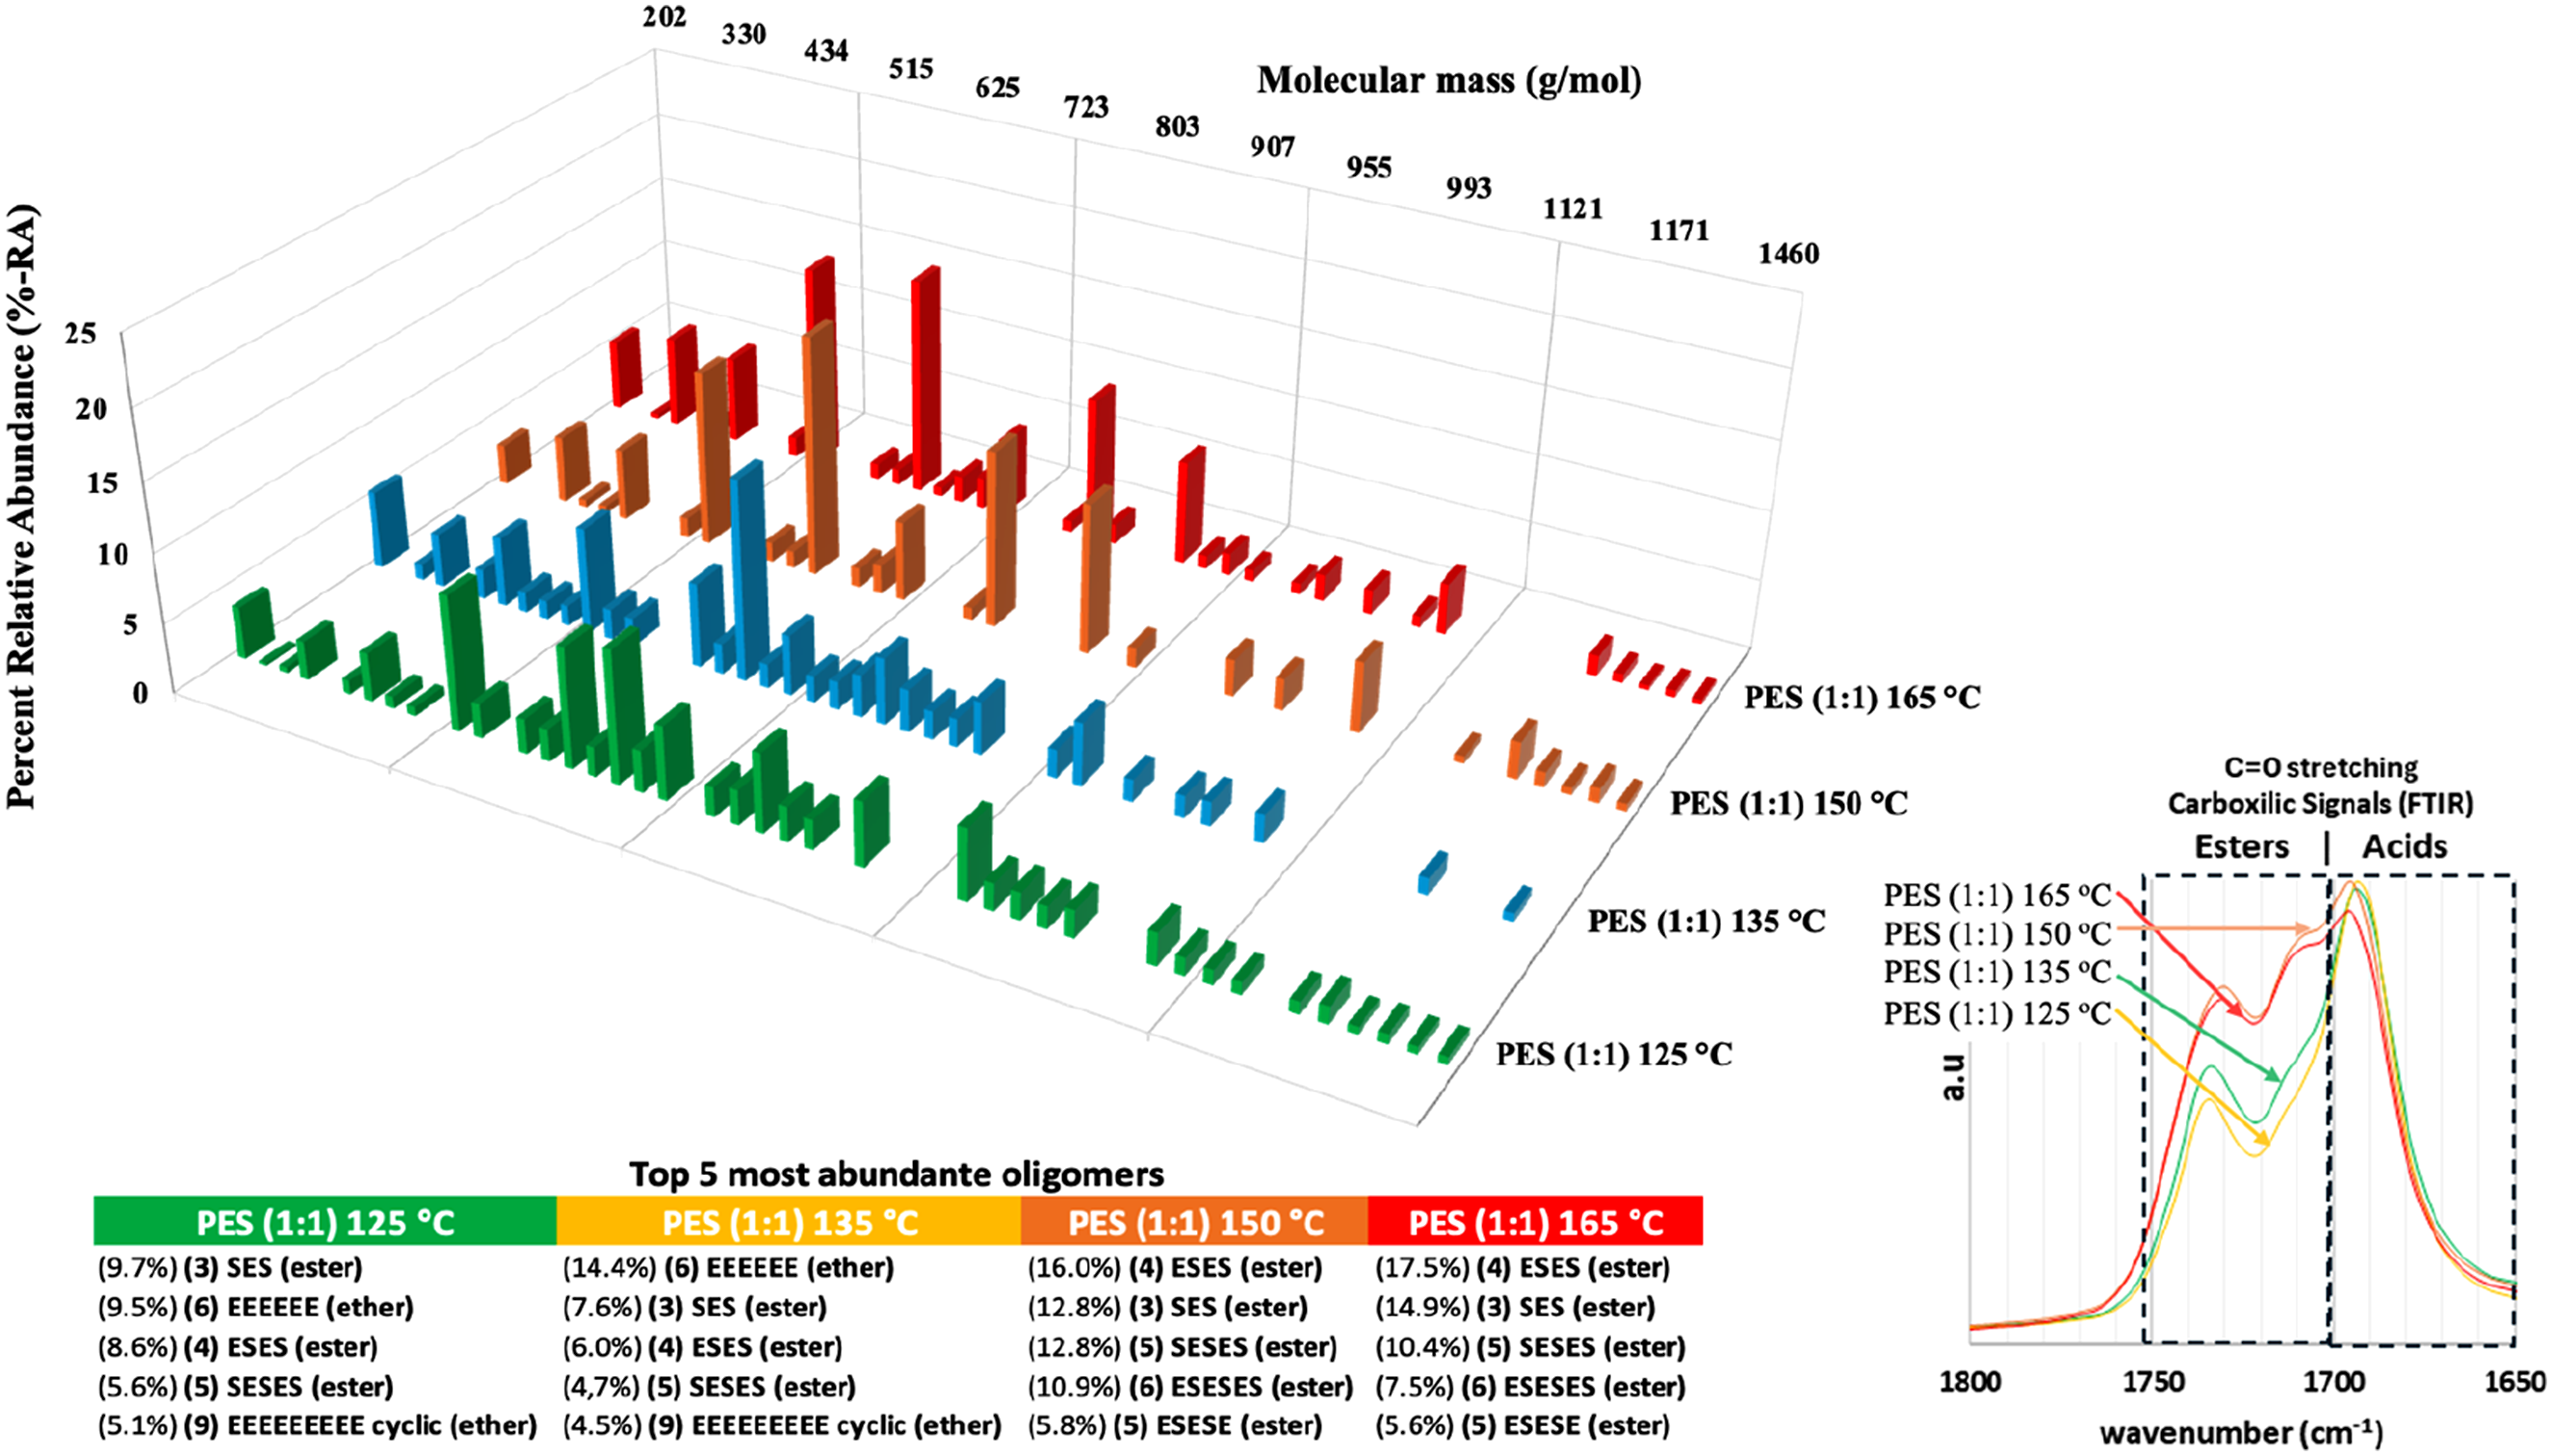
In addition, the type of oligomers was identified based on their chemical bonds and type of structures (see Figure 4) The results indicate that higher temperatures contribute to the formation of polyesters oligomers (<80%-RA ester oligomers), while lower temperatures contribute to the secondary reactions of etherification (<25%-RA ether oligomers). FTIR analysis (Figure 3(b)) and 13C NMR (Figure 5) supports this mass spectrometry results (in supporting information, 1H NMR (a) and 13C NMR (b) spectra, along with the corresponding theoretical structures of the moieties formed after the first polymerization step can be found). All reactions were stopped with the same amount of collected water, but the ester signals are more intense for pPES (1:1) 150°C and 165°C, so the source of a part of the water obtained using lower temperatures is attributed to ether bonds formation. Number and distribution of oligomers by type of chemical bonds (a) and by type of structures (b) that composed them for each temperature of 1st step pPES synthesis. 13C NMR spectrum of the pPES (1:1) 150°C selected from 1°step prepolymerization. The possible theorical chemical structures (R = undefined polymer chain) and their respective labeling for better comprehension of the data.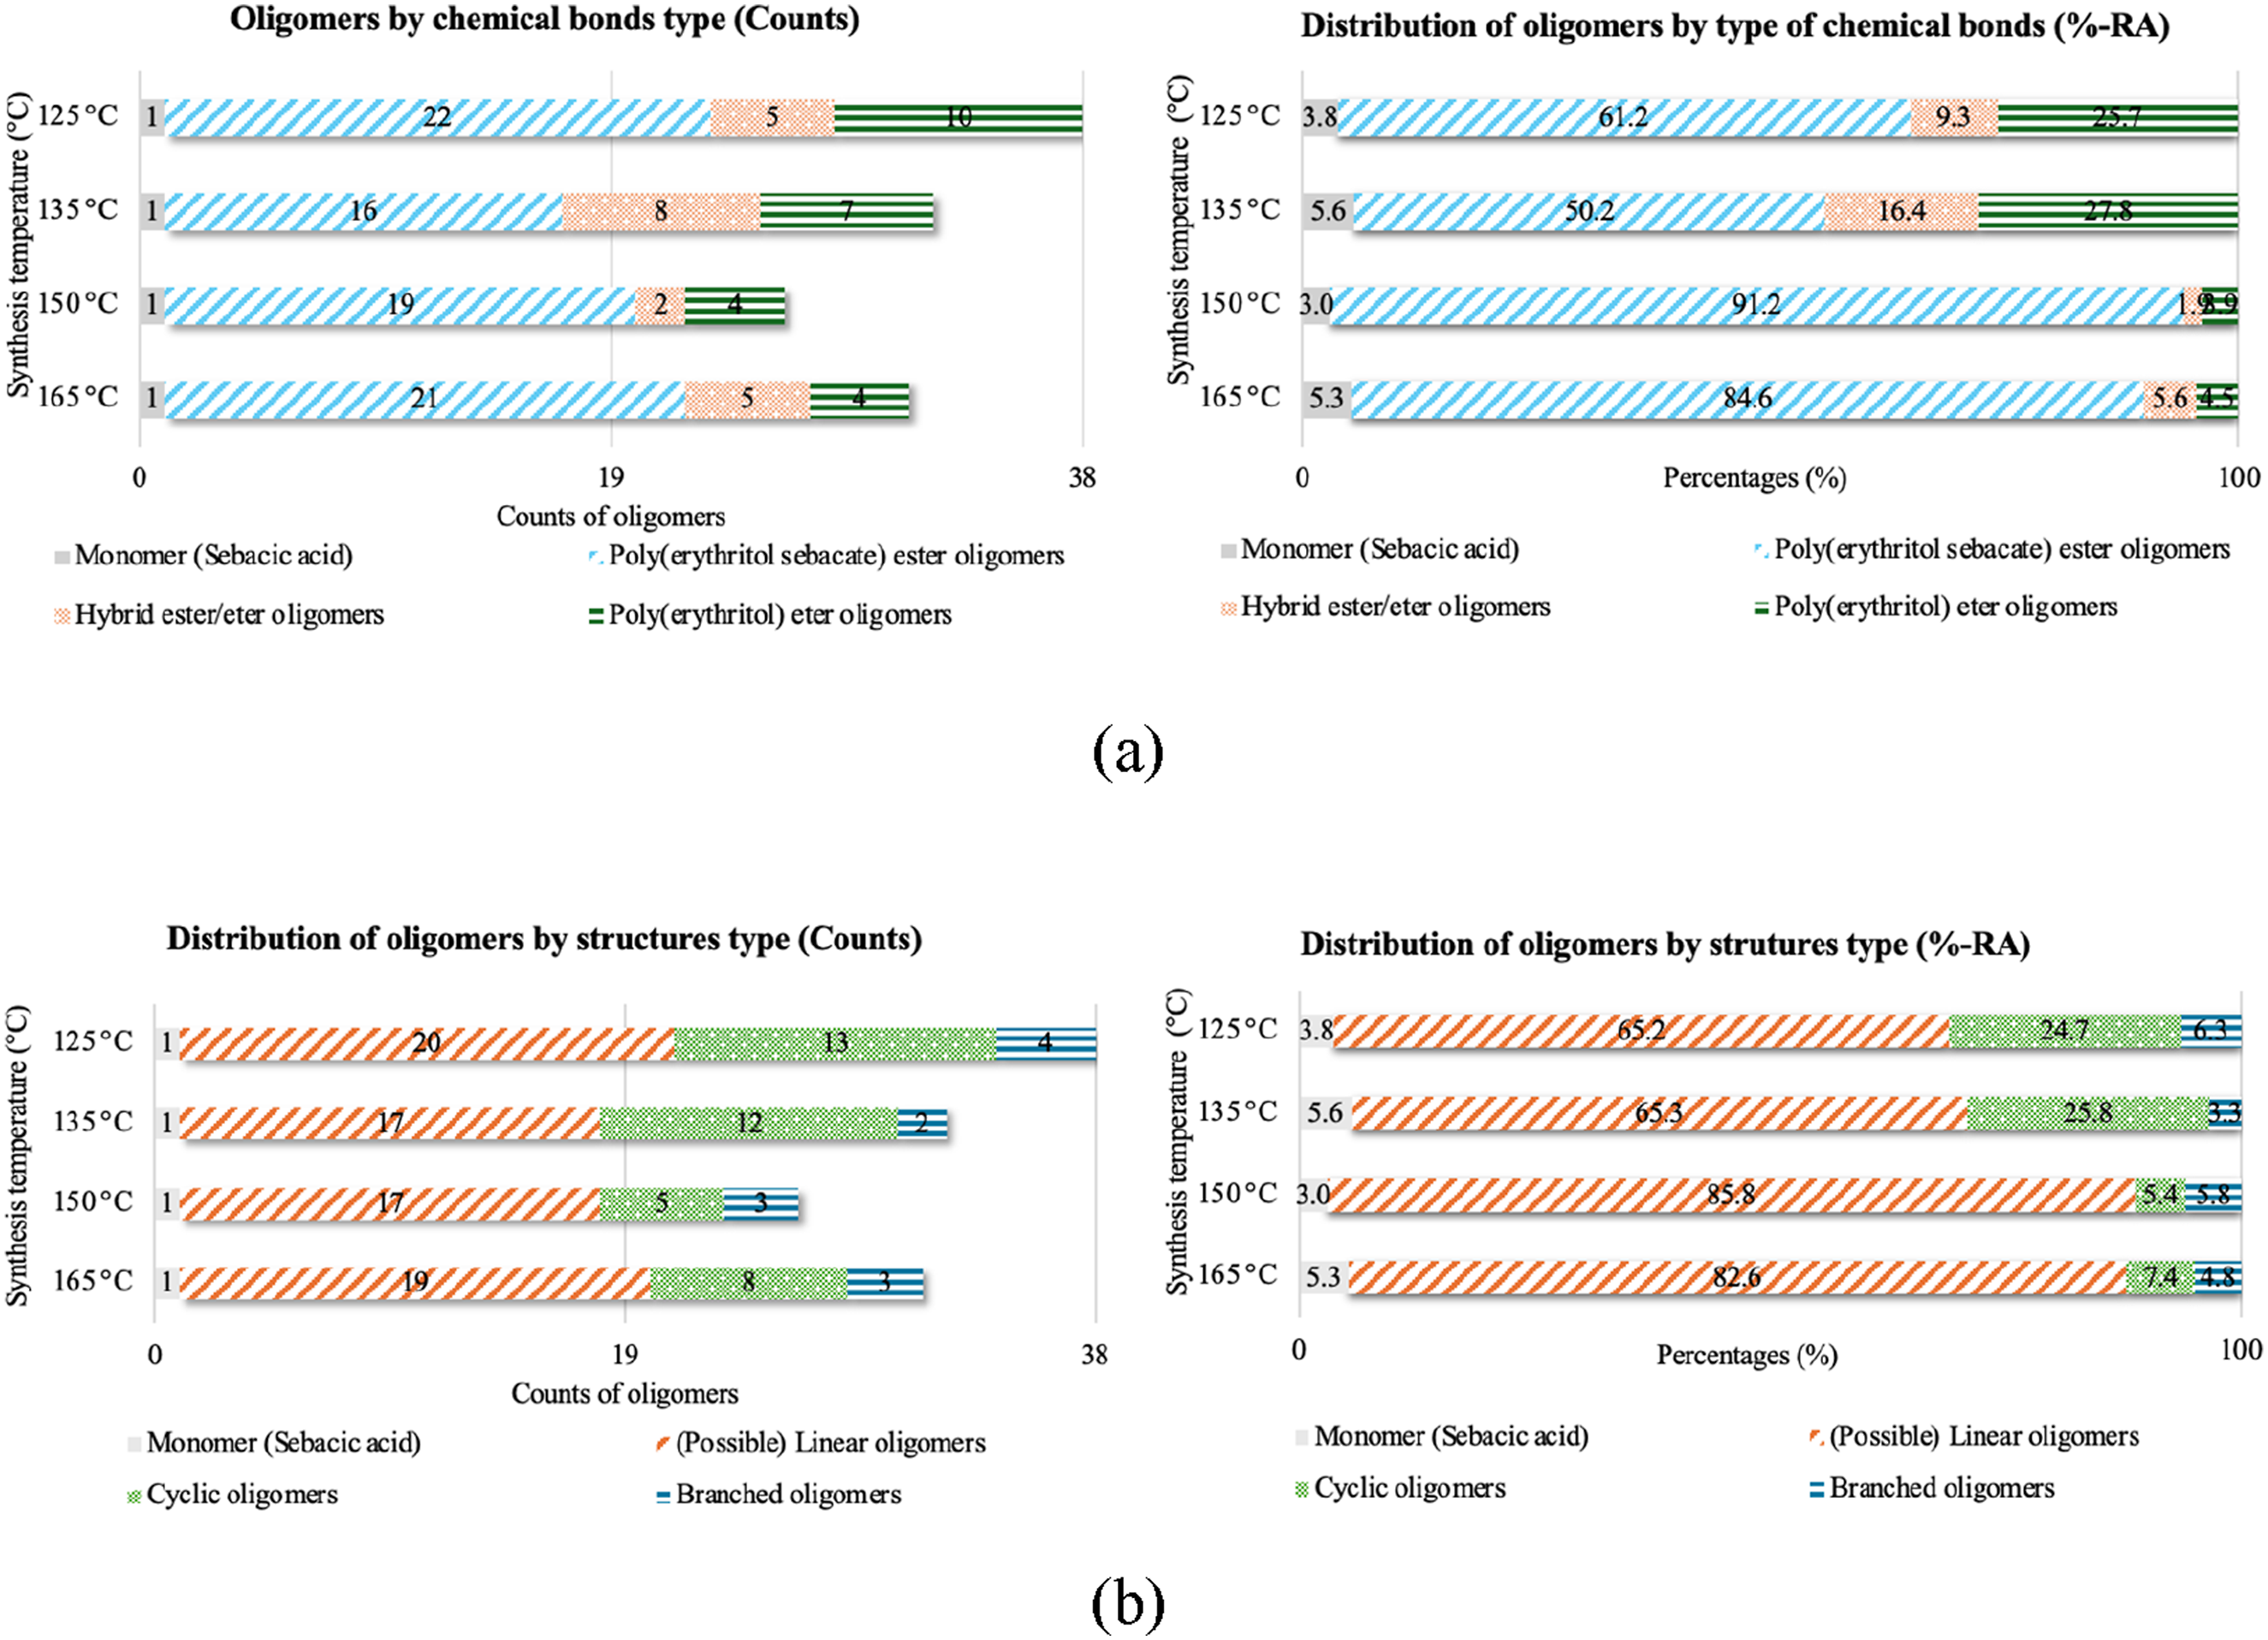
In addition to the chemical bonds, the synthesis temperature also influenced the structure of the formed oligomers. Figure 4(b)) shows a general distribution of the oligomers identified by their type of structure (a comprehensive identification of the oligomers is provided in the supporting information). The higher temperatures produced higher quantity of linear oligomers (>80%-RA), than the lower temperatures (≈65%-RA). Furthermore, lower temperatures contribute to the formation of higher amounts of cyclic structures (≈25%-RA), in contrast to higher temperatures (<8%-RA). However, no significant differences were found on the formation of branched structures.
pPES (1:1) synthesized at 150°C also exhibited narrower mass distribution, with higher %-RA values concentrated in a smaller group of ester oligomers. Additionally, linear structures constituted over 85%-RA of the composition of pPES (1:1) at this temperature. Furthermore, it was observed that at least one of the secondary hydroxyl groups in erythritol has higher reactivity with sebacic acid during thermochemical polycondensation, even at low temperatures, when compared to primary hydroxyl groups.
The key difference among the prepolymers obtained from the first prepolymerization step lies in the percentage of acid consumed and the formation of primary esters. The percentage of esters formed from the consumption of secondary hydroxyls is consistently close to 20% across all prepolymers, suggesting that at least one secondary hydroxyl is more reactive than the primary hydroxyls. Given these findings, 150°C was chosen as the temperature for the first prepolymerization step, as it yielded an oligomeric profile most closely resembling the theoretical profile expected if lipase B had been used from the outset. Thus, pPES (1:1) synthesized at 150°C served as the foundation for the lipase B-catalyzed reactions in the second prepolymerization step, with time and temperature as variable factors.
2nd prepolymerization step
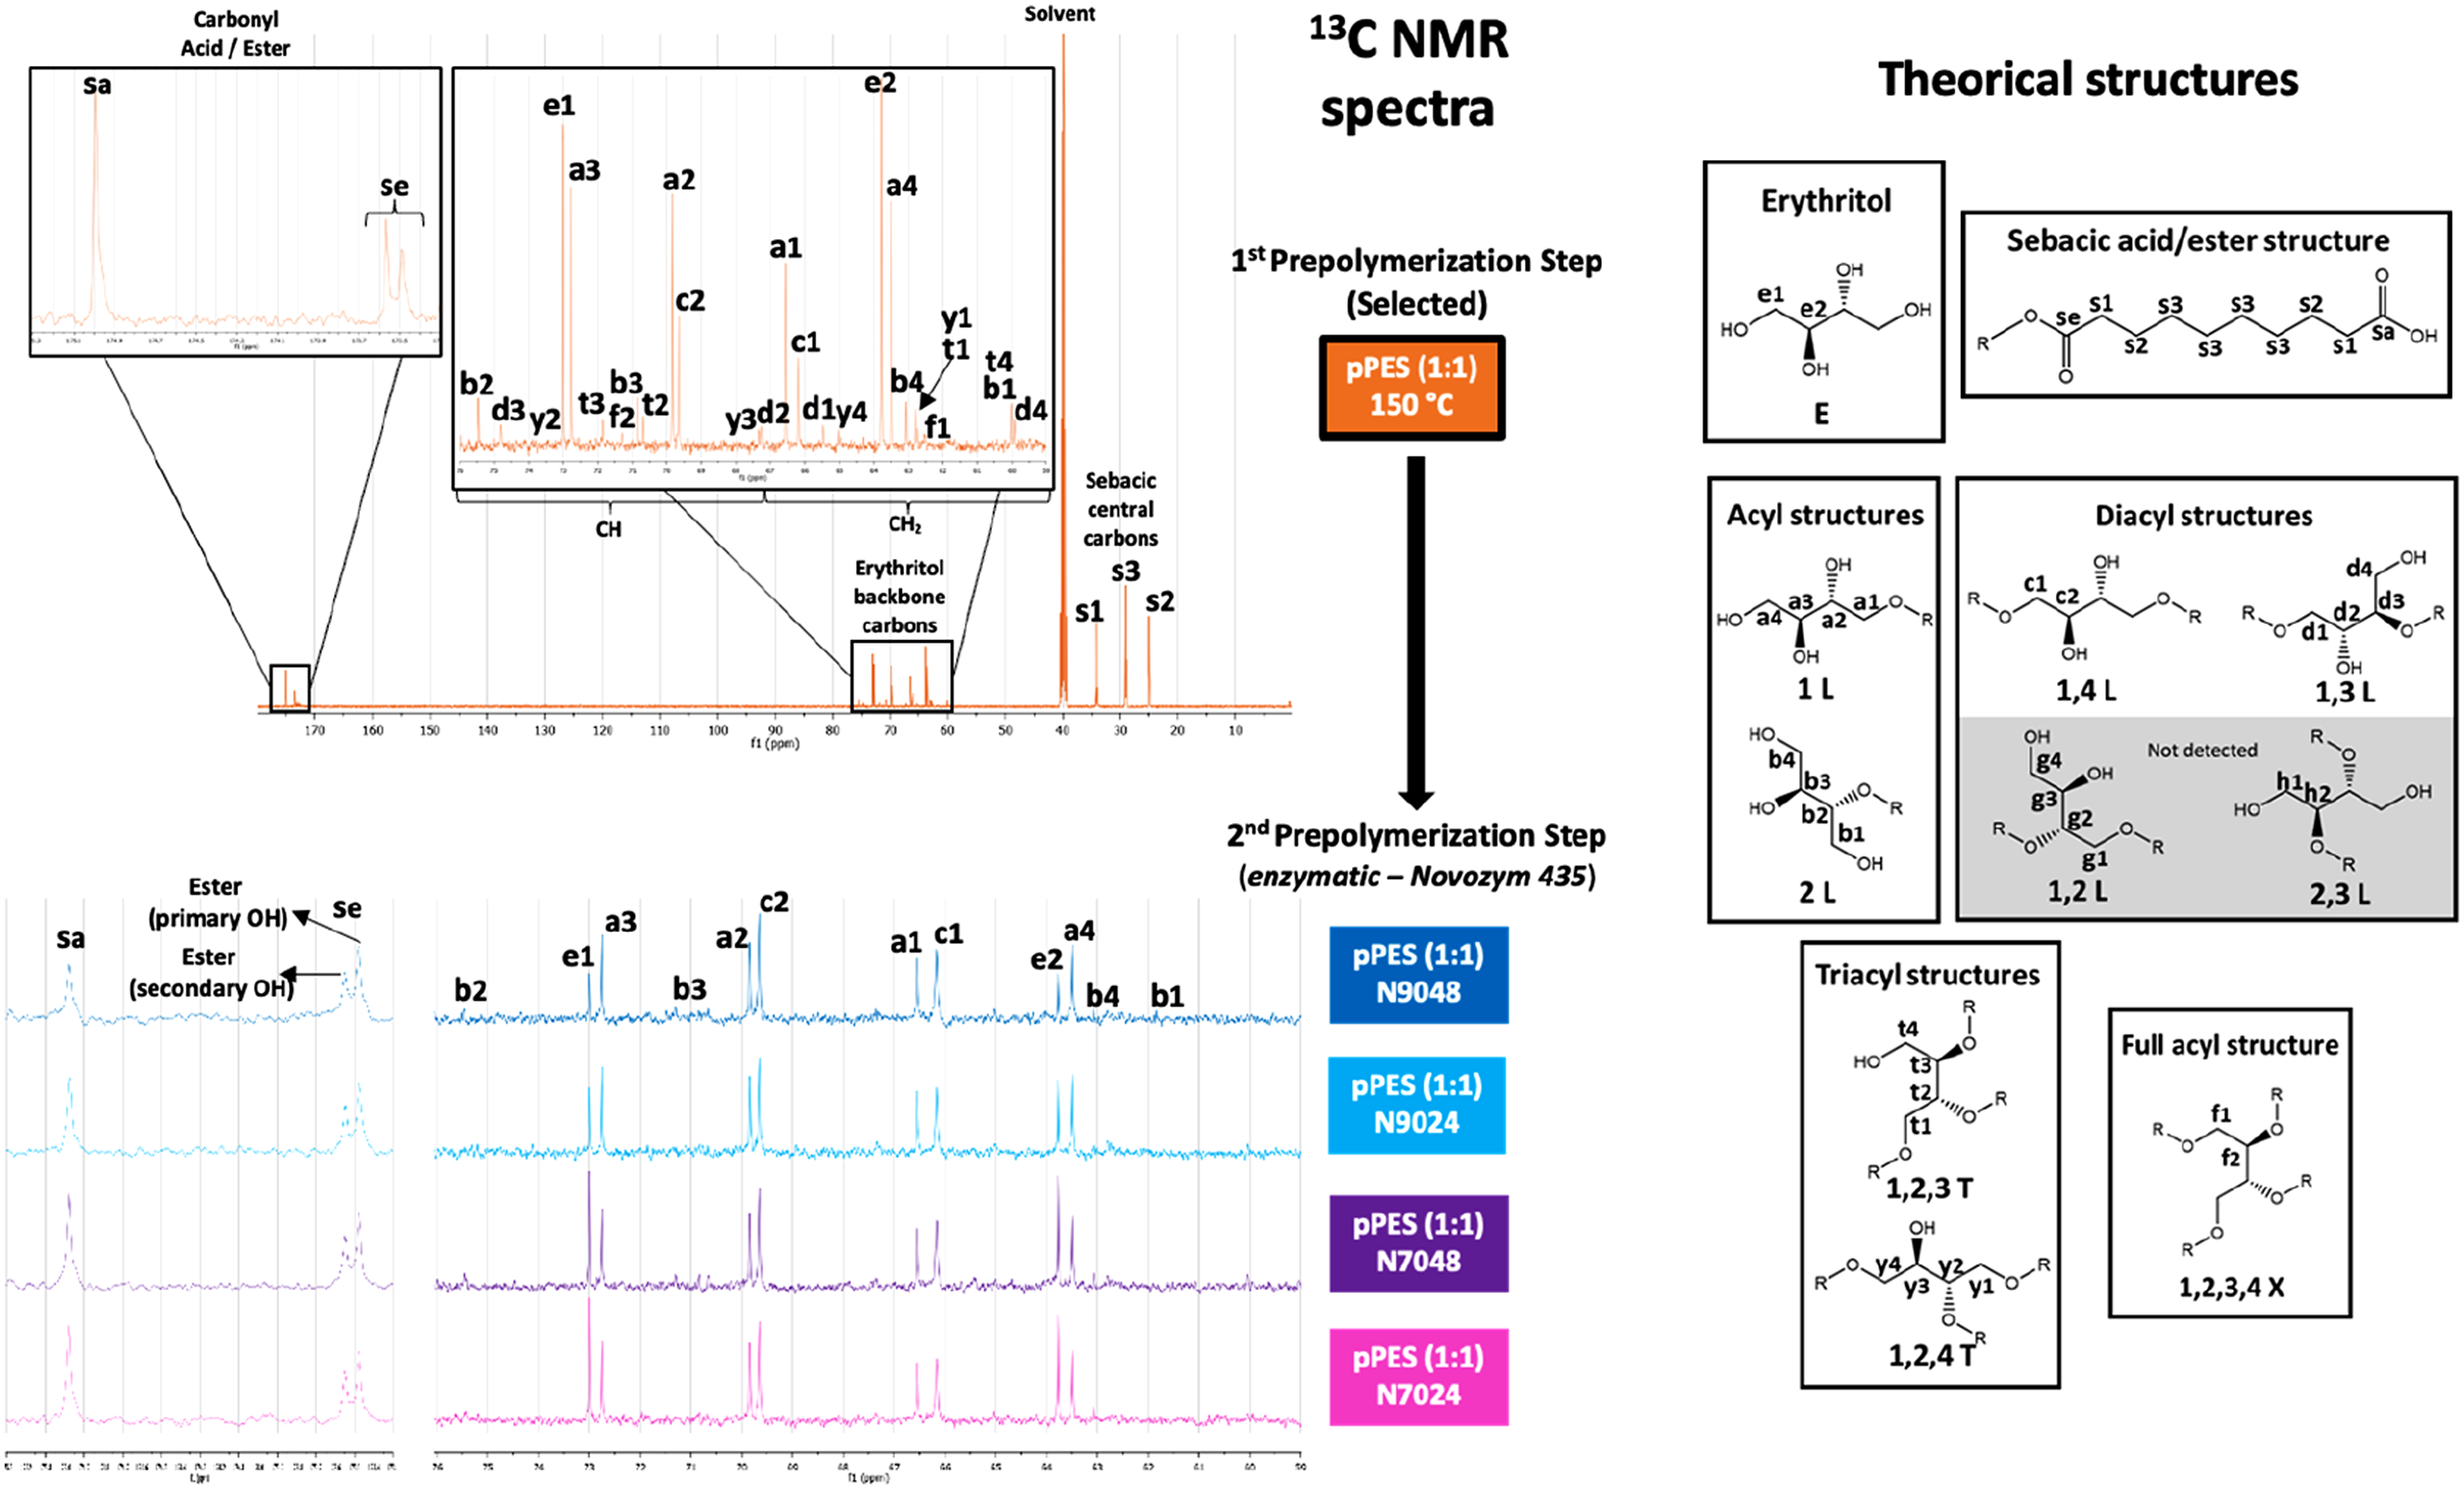
After the 1st prepolymerization step, prepolymers were produced using enzymes. Figure 5 presents the 13C NMR spectrum of pPES (1:1) synthesized at 150°C, along with the spectra areas of interest (amplified in full for pPES (1:1) at 150°C) for the four prepolymers obtained in the 2nd prepolymerization, including the identification of their respective signals. The 13C NMR profiles allow a clear distinction between the prepolymers, as the signal patterns in the spectra are notably different.
Erythritol (E), 1-acyl linear structure (1L), 2-acyl linear structure (2L), 1,4-diacyl linear structure (1,4 L), 1,3-diacyl linear structure (1,3L), 1,2,3-triacyl branched structure (1,2,3T), 1,2,4-triacyl branched structure (1,2,4T), full-acyl branched structure (1,2,3,4X), and sebacic acid/ester structure signals were detected in pPES (1:1) 150°C, while the 1,2-diacyl (1,2 L) and 2,3-diacyl (2,3L) structures were not detected. The carbons in the backbone of sebacic acid (S) are the most intense signals in the spectra. After the erythritol (E) signals, 1L are the most intense signals followed by 1,4L. Next, 1,4L, the acyl 2L is the structure with more intense signals, followed by 1,3L structure. The triacyl structures 1,2,4T and 1,2,3T and full acyl structure 1,2,3,4X were detected, but the signals have very low intensity. The 13C NMR shows that the linear structures have the most intense signals, and the branched structures signals are much less intense, which confirms the ESI-MS results obtained for the pPES (1:1) 150°C. Furthermore, the prepolymers obtained after enzymatic reactions presented a slightly higher percentage of esters, as it can be observed form Figure 5.
Additionally, in the second prepolymerization step, the ensuing prepolymer displays significant changes compared to the initial pPES (1:1). The signals for the 1,4-L structure are more intense than those for the 1L structure in all spectra after the second prepolymerization, indicating a considerable increase in polymer chain length. While signals corresponding to the 2L structure remain identifiable, those for branched structures are undetectable. Furthermore, each pPES variant from the second prepolymerization can be distinguished by 13C NMR due to differences in their degree of esterification, as indicated by the erythritol and carbonyl signals. The pPES (1:1) N7024 and N7048 samples synthesized at 70°C exhibit higher levels of remaining acid, with erythritol signals being more intense than those for the 1L and 1,4L structures. Conversely, the pPES (1:1) N9024 and N9048 samples synthesized at 90°C show weaker erythritol signals, indicating greater consumption of acid groups.
The prepolymers can be arranged in order of increasing degree of esterification (DE) based on the carbonyl peak area signals. Figure 6 illustrates that temperature has a more significant impact on acid consumption than time, although extending the reaction time at the same temperature leads to a slight increase in acid consumption. Relative quantities (%) of carboxylic acid, secondary ester and primary ester in each prepolymer produced based on respective 13C NMR peaks areas.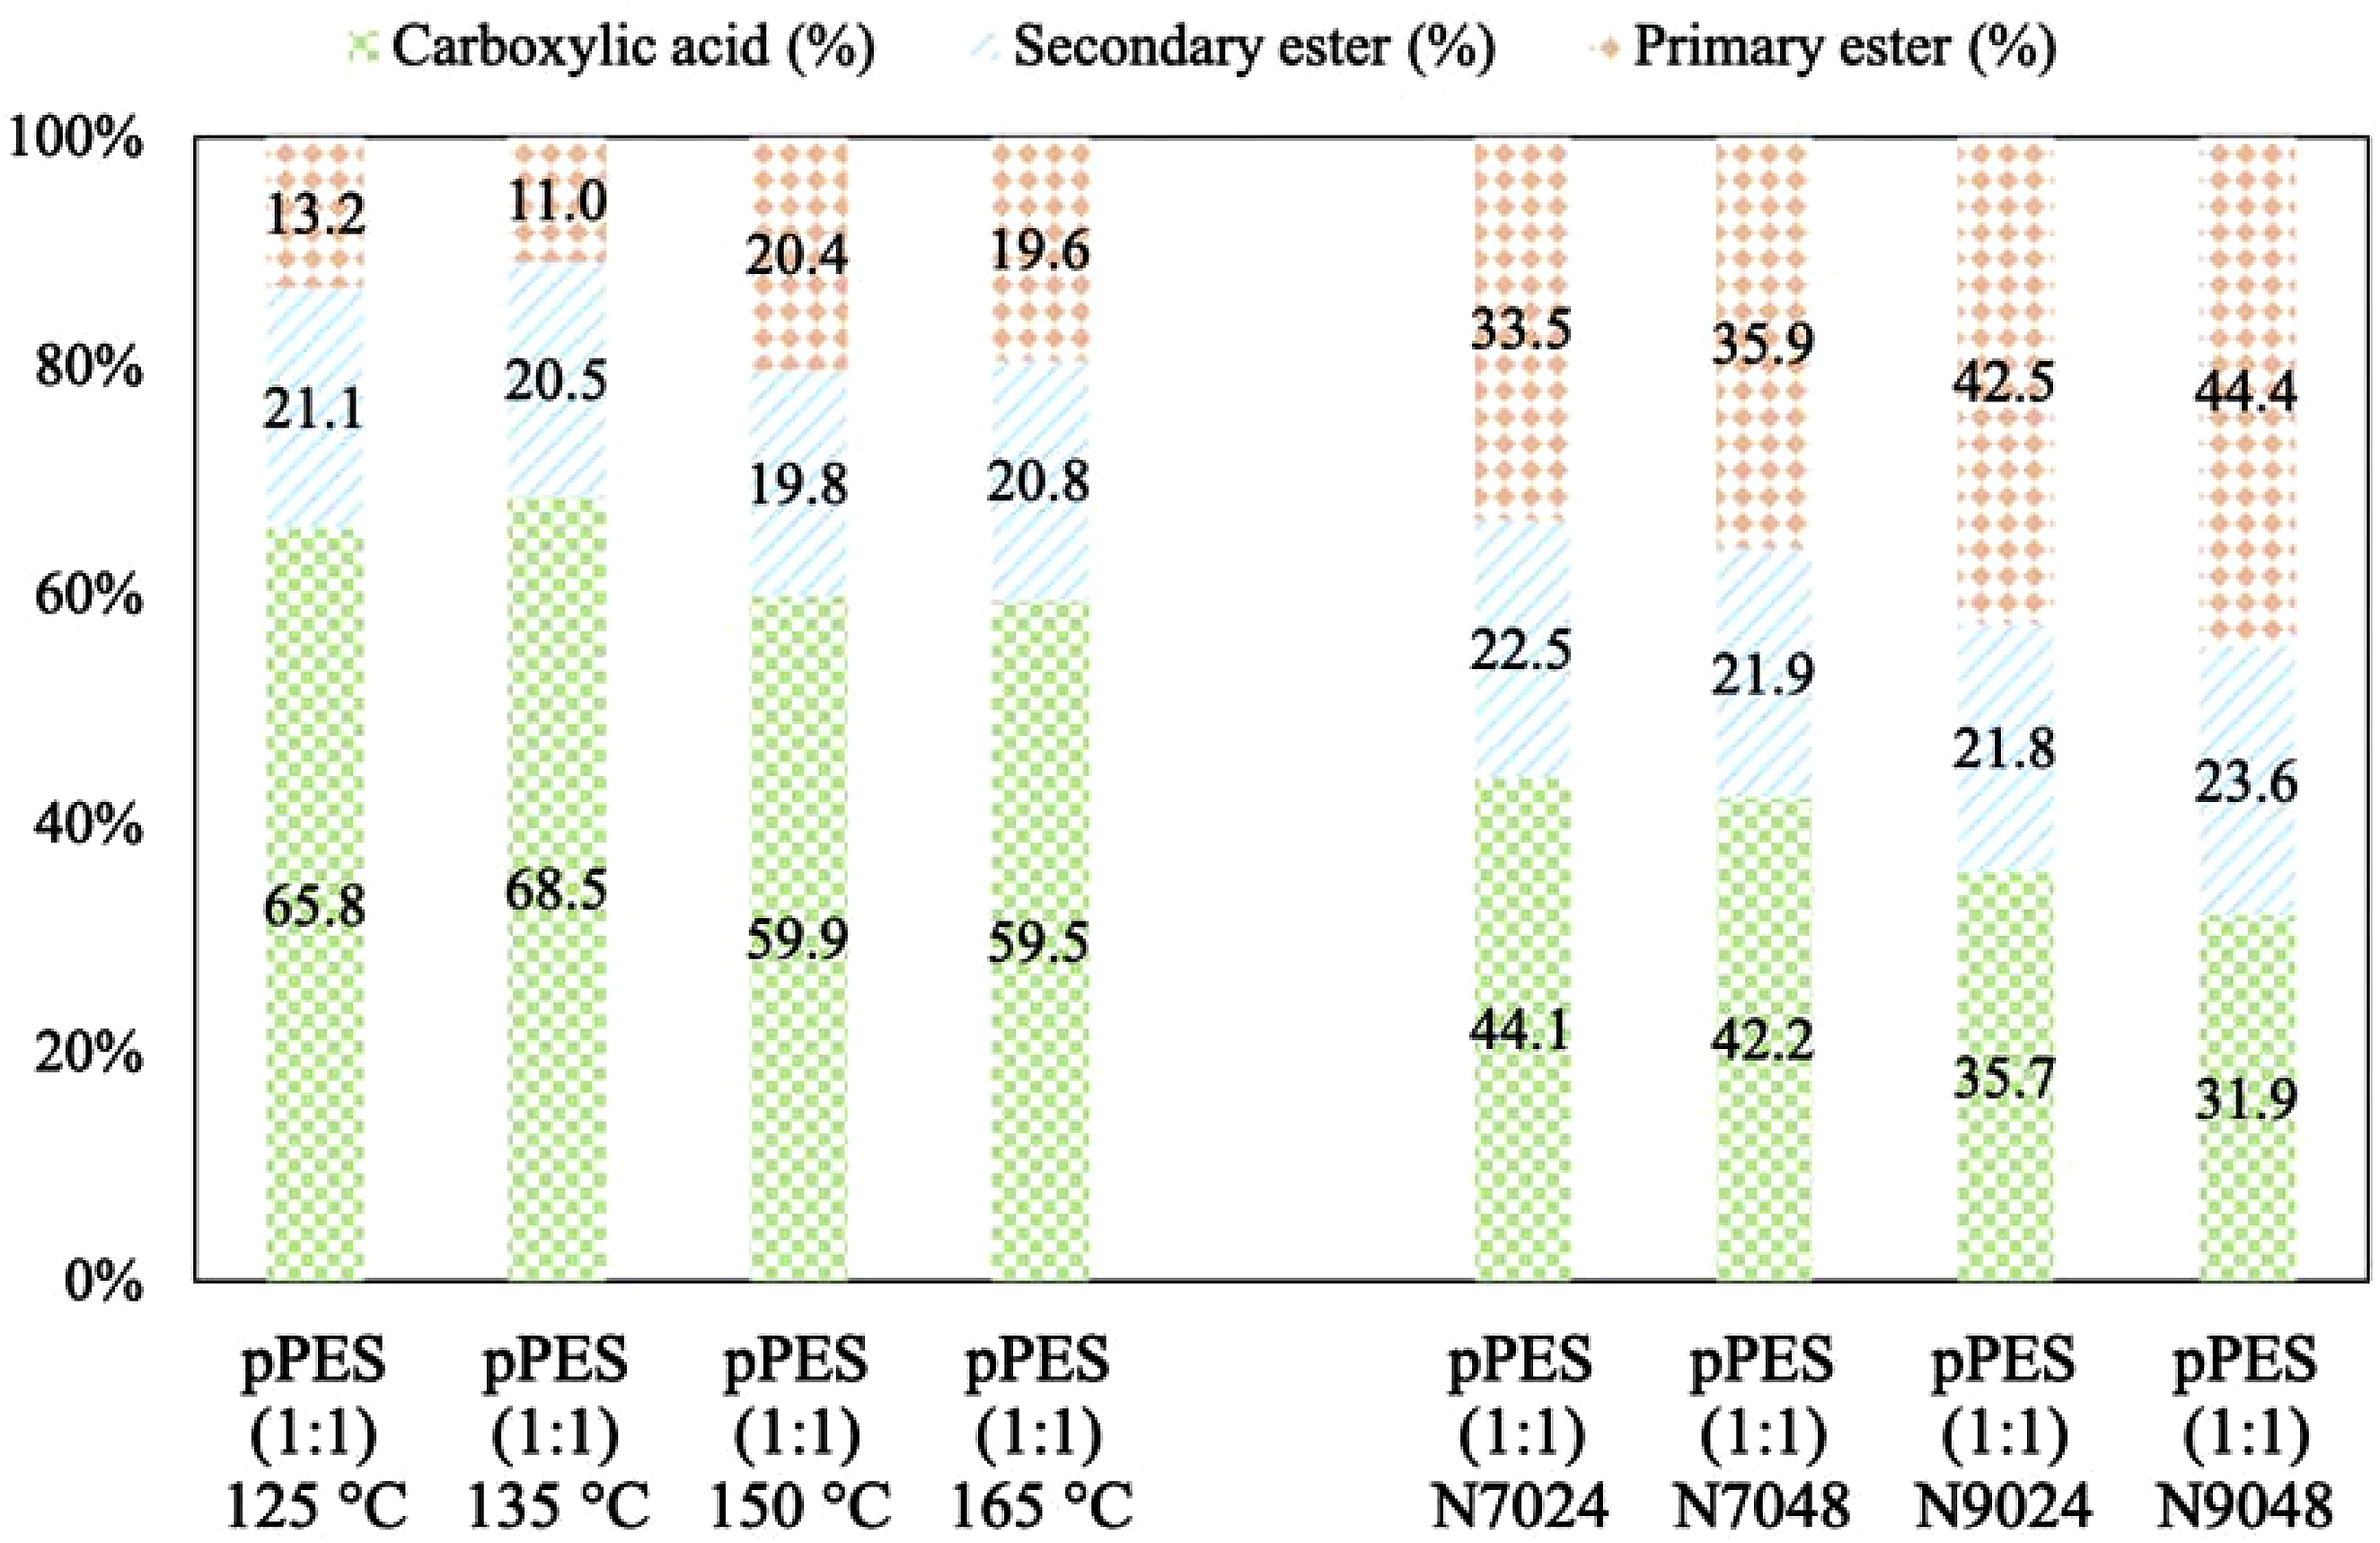
The pPES samples can be organized in ascending order of DE as follows: pPES (1:1) 150°C (40%) < N7024 (55%) < N7048 (58%) < N9024 (64%) < N9048 (68%). It is also noted that this increase in DE is attributed to the formation of more primary esters, while the percentage of secondary esters remains close to 20%, consistent with the initial pPES (1:1) synthesized at 150°C. These findings confirm the high selectivity of lipase B for primary hydroxyl group consumption, thereby preventing the formation of branched structures during esterification.
Finally, the pPES samples from the 2nd prepolymerization step were analyzed by GPC to assess the increase in prepolymer chain length. Figure 7, derived from GPC data treatment, illustrates the relative abundance of the samples as a function of molecular mass. Molecular mass distribution of the four pPES after 2nd prepolymerization step.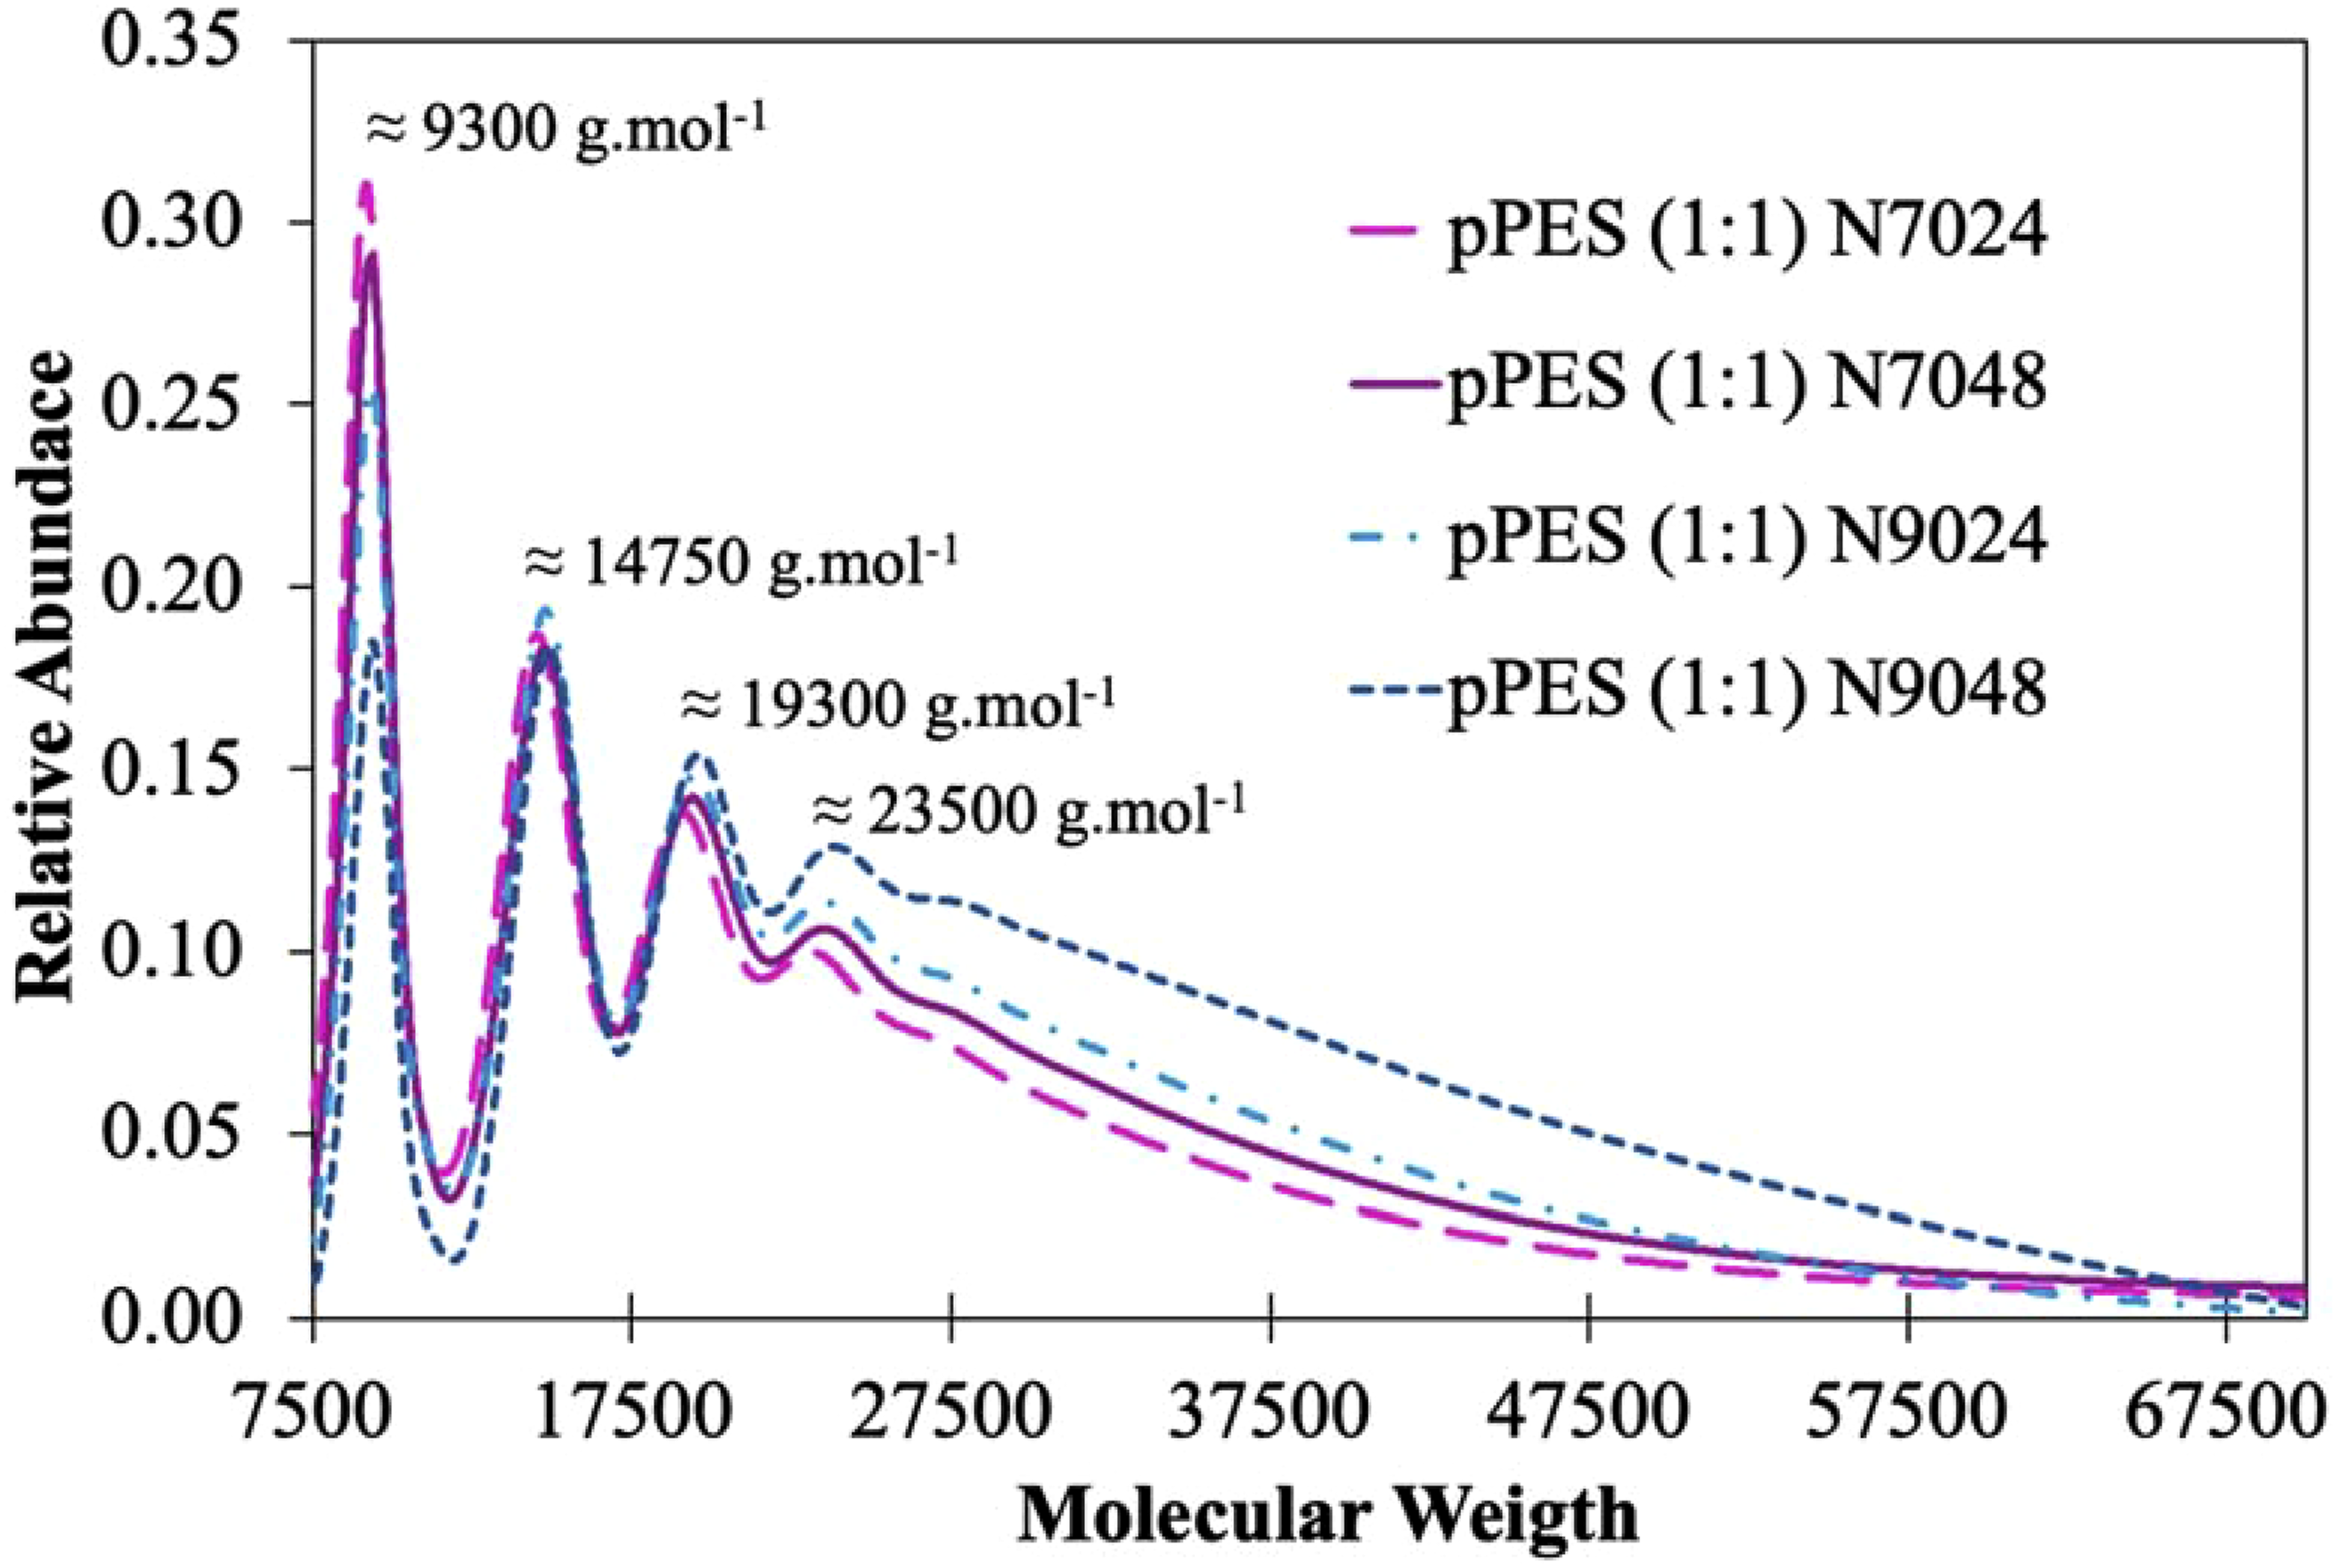
From Figure 7, four distinct mass peaks are clearly identified, with their relative abundances varying based on the enzymatic reaction conditions. The peak at 9300 g.mol−1, shows lower abundance, and no signals were detected below 7500 g.mol−1. The pPES (1:1) N9048 sample exhibits the lowest relative abundance for the smallest peak detected but the highest abundance for the larger peaks at 19300 g.mol−1 and 23500 g.mol−1. In contrast, the pPES (1:1) N7024 sample shows the opposite trend, with a higher relative abundance for the smaller peak (9300 g.mol−1) and a lower abundance for the larger mass peaks. Notably, the arrangement of the prepolymers reflects the same order as the degree of esterification calculated based on 13C NMR data. Thus, a higher degree of esterification corresponds to a greater abundance of higher molecular masses.
Synthesis and characterization of polymers
After the 2nd prepolymerization step, the four prepolymers were subjected to a curing process at 150°C. Figure 8 shows FTIR spectra of prepolymers (dashed lines) and final polymers samples (full lines) for better perception of the esterification process. Two regions of interest are signed in the spectra to an easy comprehension of the data. FTIR spectra of the 2° step pPES synthesized and 1° step prepolymer (pPES (1:1) 150°C) (dashed lines) and final polymers (PES) obtained from respective prepolymers, after cure step (full lines). Amplification of the area corresponding to the wavenumber of the signals of carboxylic acids and ester bonds (1800 – 1650 cm−1).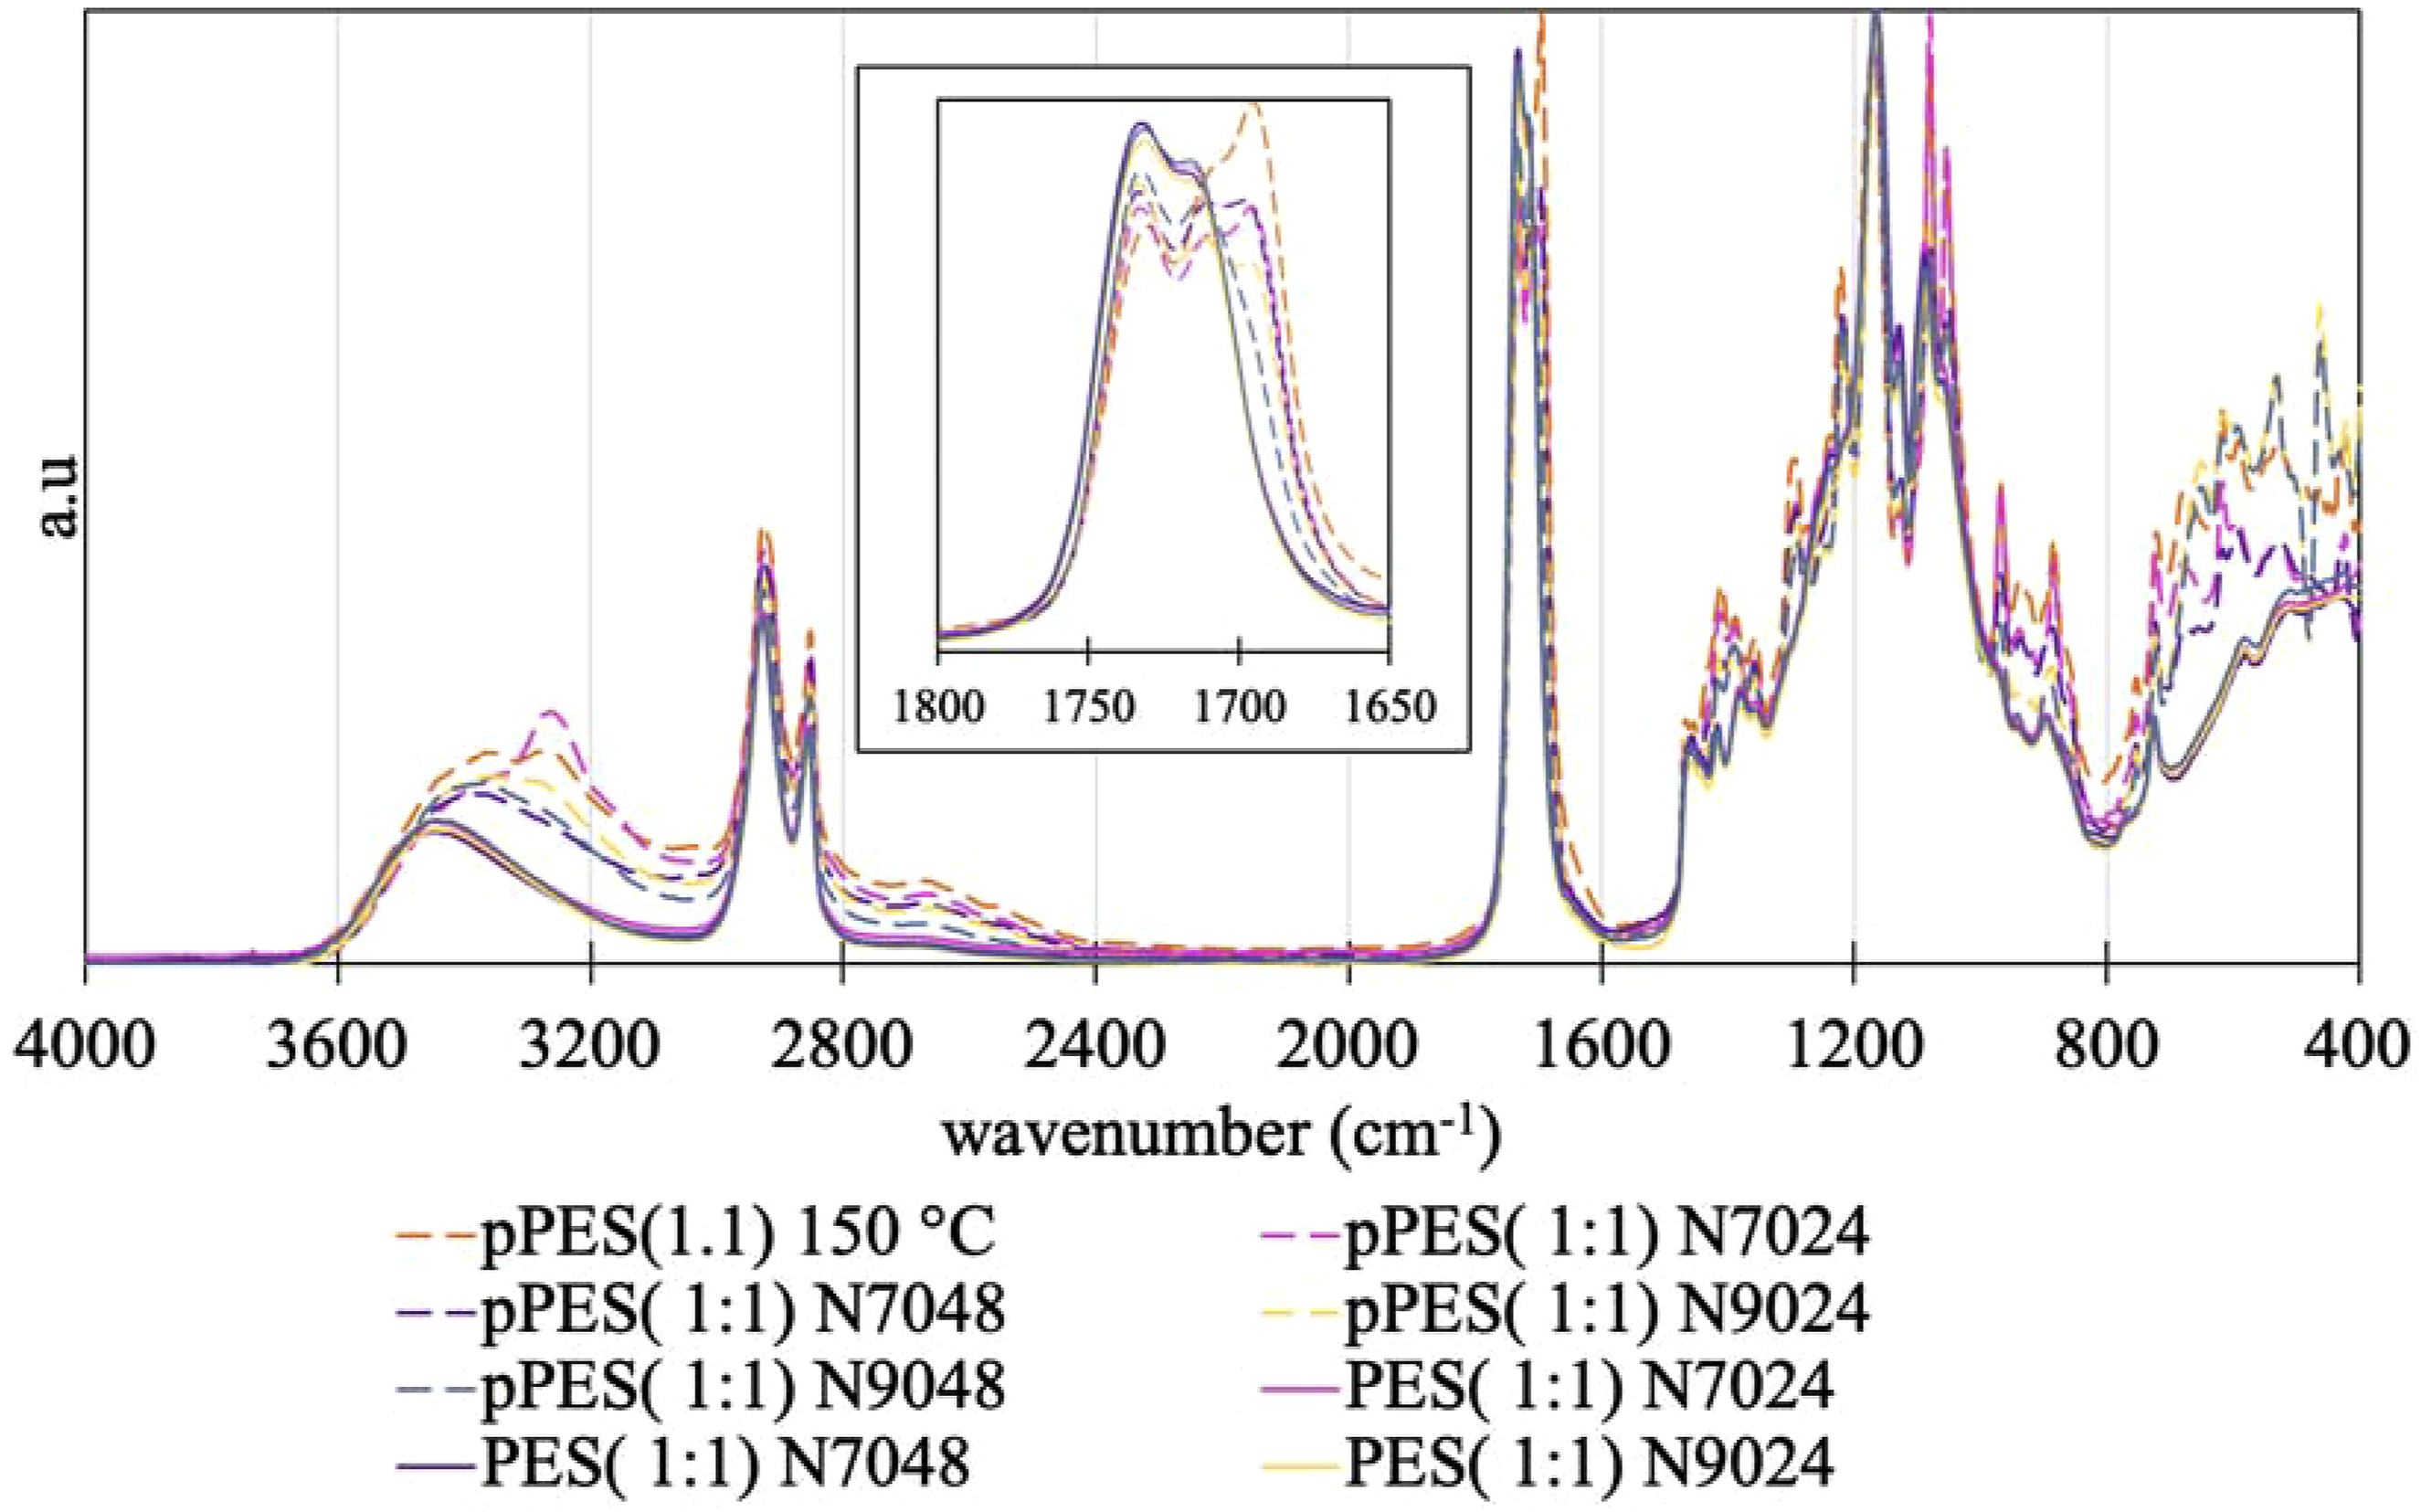
After the curing process, all the PES (1:1) presented the same profile with a strong signal between 1700 and 1750 cm−1 that ends with 2 united peaks. These represent ester bonds corresponding to the consumption of the primary and secondary hydroxyl groups of erythritol. The acid peak disappeared completely, indicating that the DE is similar after the curing process for all polymers. In fact, at 1730 cm−1, it can be seen that the peaks are organized according to the DE of the prepolymers obtained by NMR, with pPES (1:1) N9048 having the highest peak and pPES (1:1) 150°C the lowest. The reduction of intensity of the signal between 3200 and 3600 cm−1, assigned to undefined alcohol O-H stretching, also indicates the consumption of alcohols groups to produce ester bonds.
Furthermore, the thermal properties of PES (1:1) N7024, N7048, N9024 and N9048 were analyzed by TGA, DMA and DSC (see Figure 9). The TGA thermograms are similar for the four PES (1:1) produced, all polymers having good thermal stability up to 300°C, maintaining more than 95% of the initial mass. Up to 400°C, a significant loss of mass occurs, with only 80% of the initial mass remaining. After 400°C, the loss of mass is critical, and the entire polymers are burnt until 500°C. DSC shows usual thermograms of amorphous polymers without any crystallization temperature. The glass transition temperature (T
g
) between -20 – 0°C is observed for all polymers, with central value near −10°C. The DMA results confirm this values for Tg, inclusively the small shift in Tg that exists for PES (1:1) N7024. Based on tan δ values, the damping capacity of the four polymers is slightly different but increases in the same order registered for the degree of esterification of pPES (1:1) at the end of 2nd prepolymerization step. This indicates that the polymer network of PES (1:1) N9048 is more effective at dissipating the mechanical energy applied, which could make it a better impact-resistance material. (a) TGA thermograms, (b) DSC thermograms corresponding to the second heat cycle and (c) DMA thermograms for the final polymers PES (1:1) N7024, N7048, N9024 and N9048.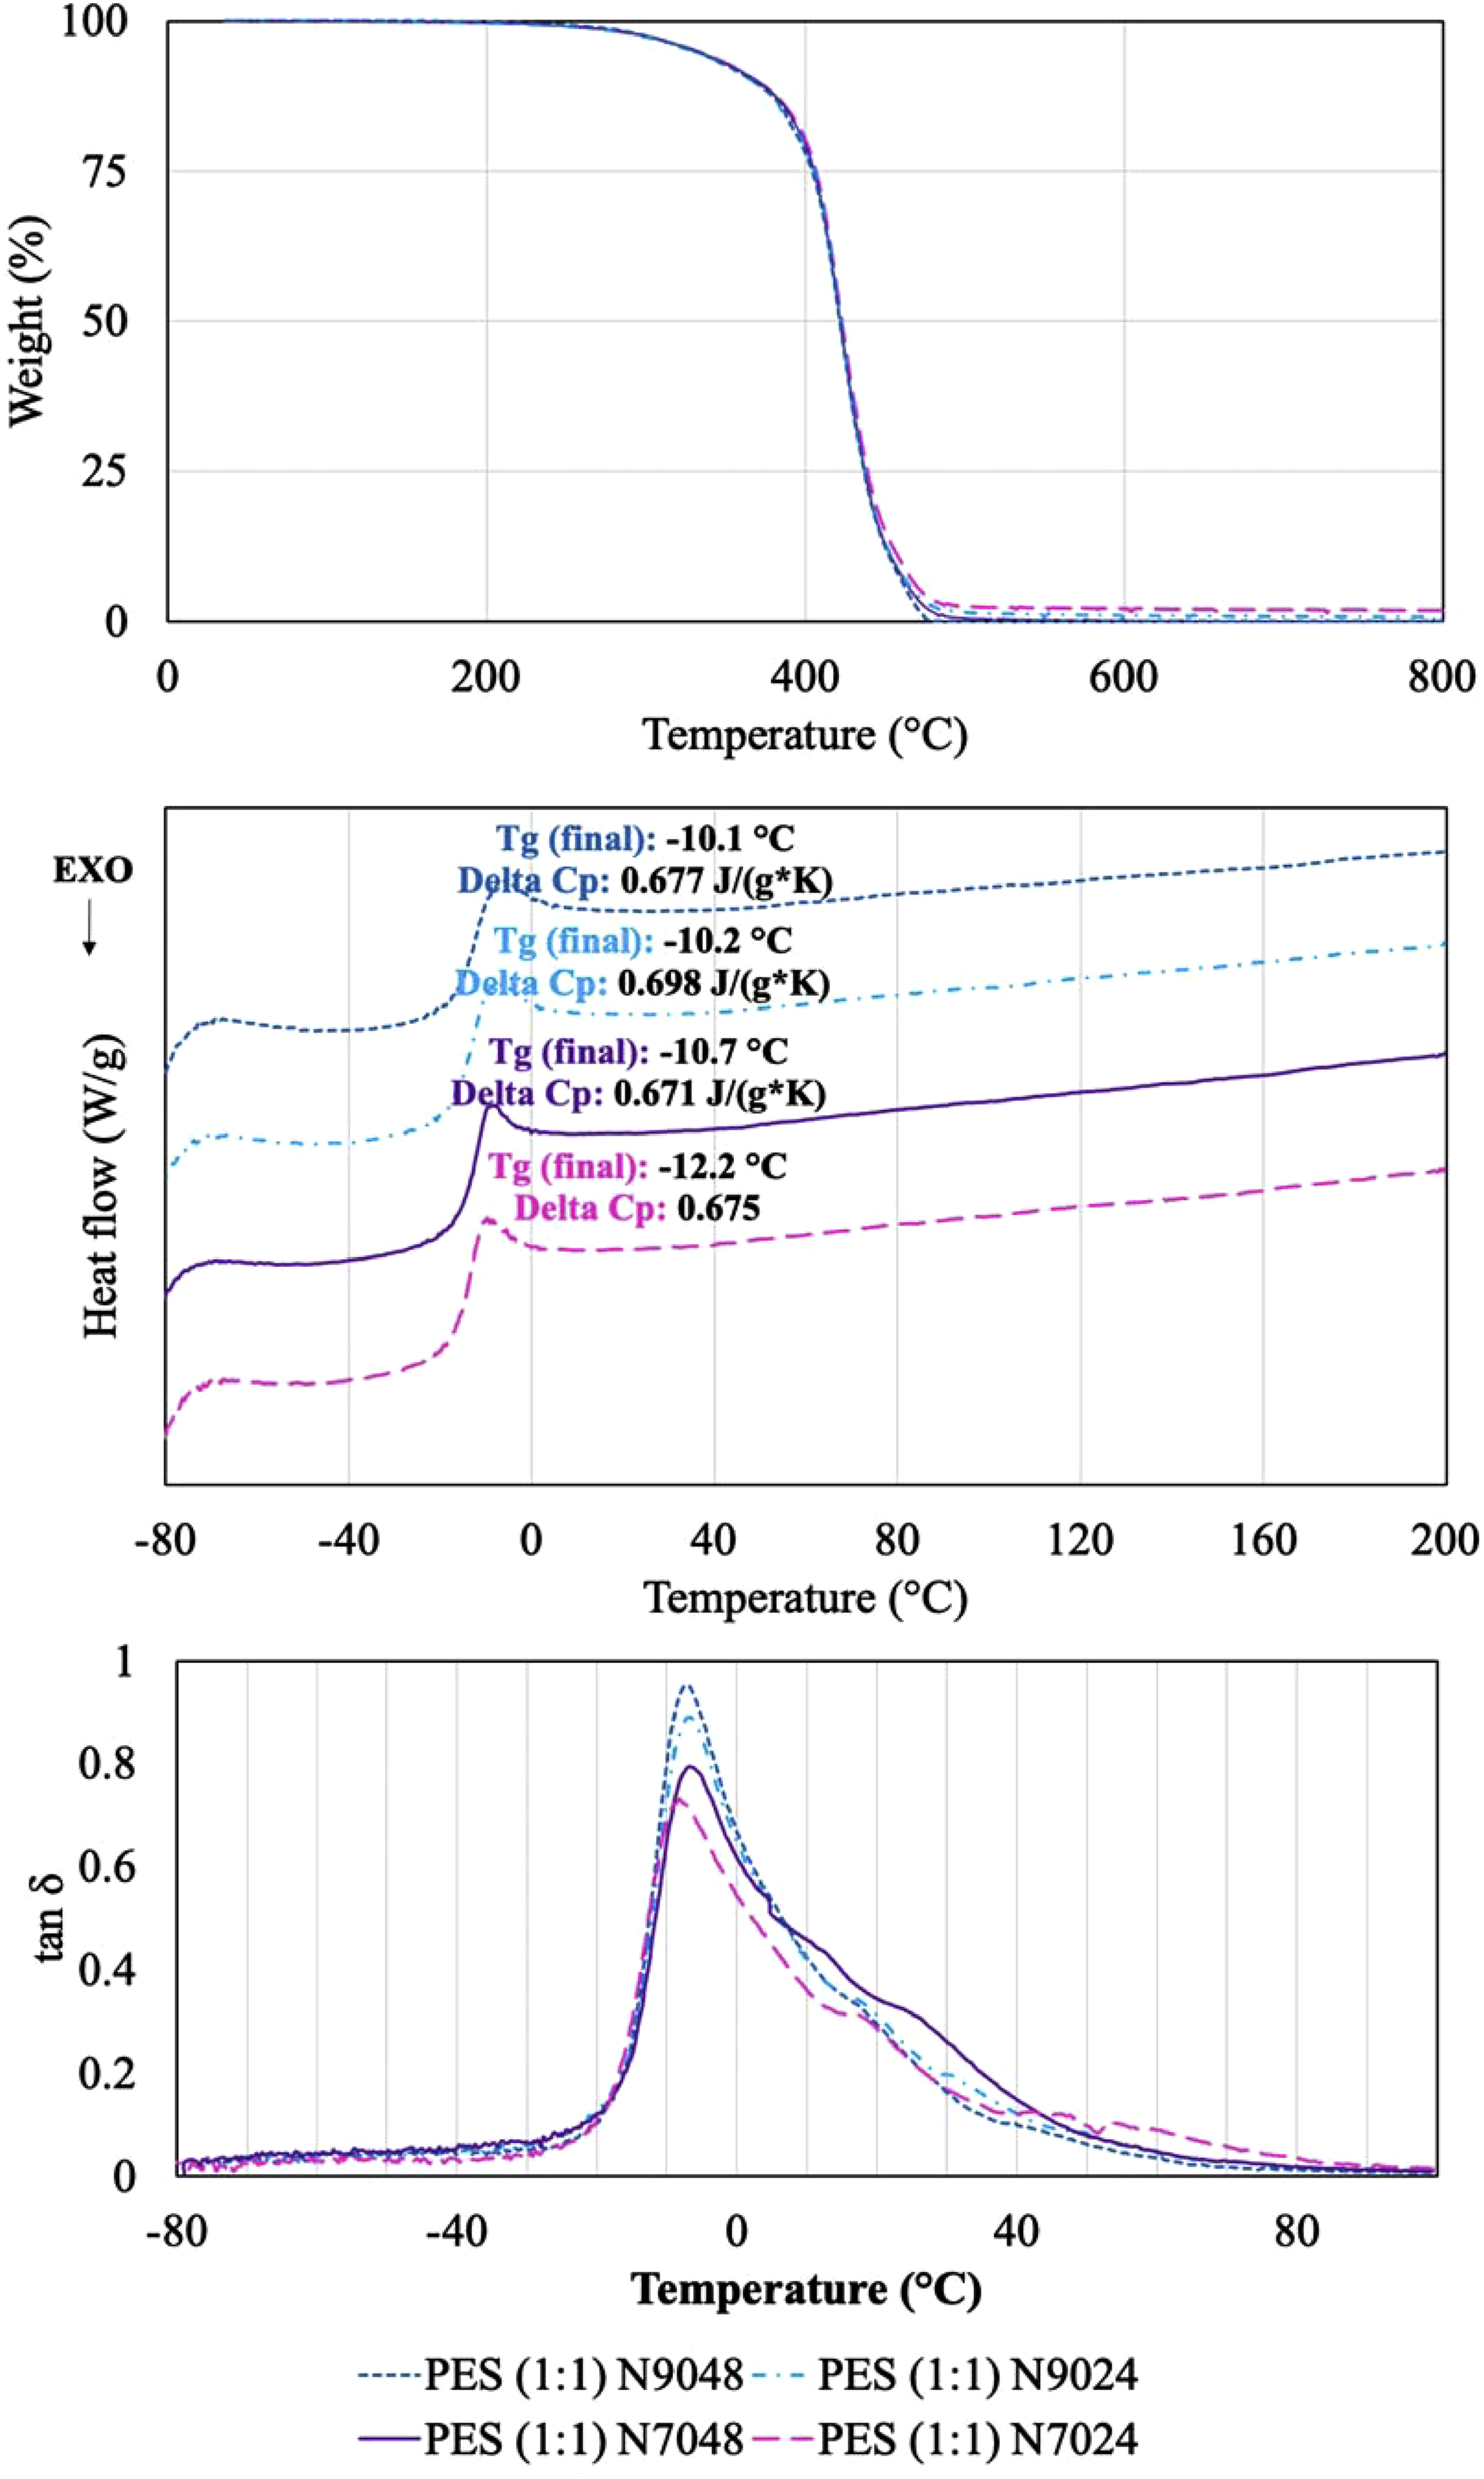
In a similar manner, the mechanical performance of the polymers was determined, the ensuing properties being represented in Figure 10. (a) Ultimate tensile strength (MPa), (b) Young´s Modulus (MPa), (c) Elongation at break (%) of the tested PES (1:1) polymers. The error bars corresponding to the standard deviation of five replicas. *PES(1:1) Conv 150°C (black color) corresponds to the polymer with best mechanical properties previously reported by us using a two-step synthesis without catalyst with similar cure process at 150°C.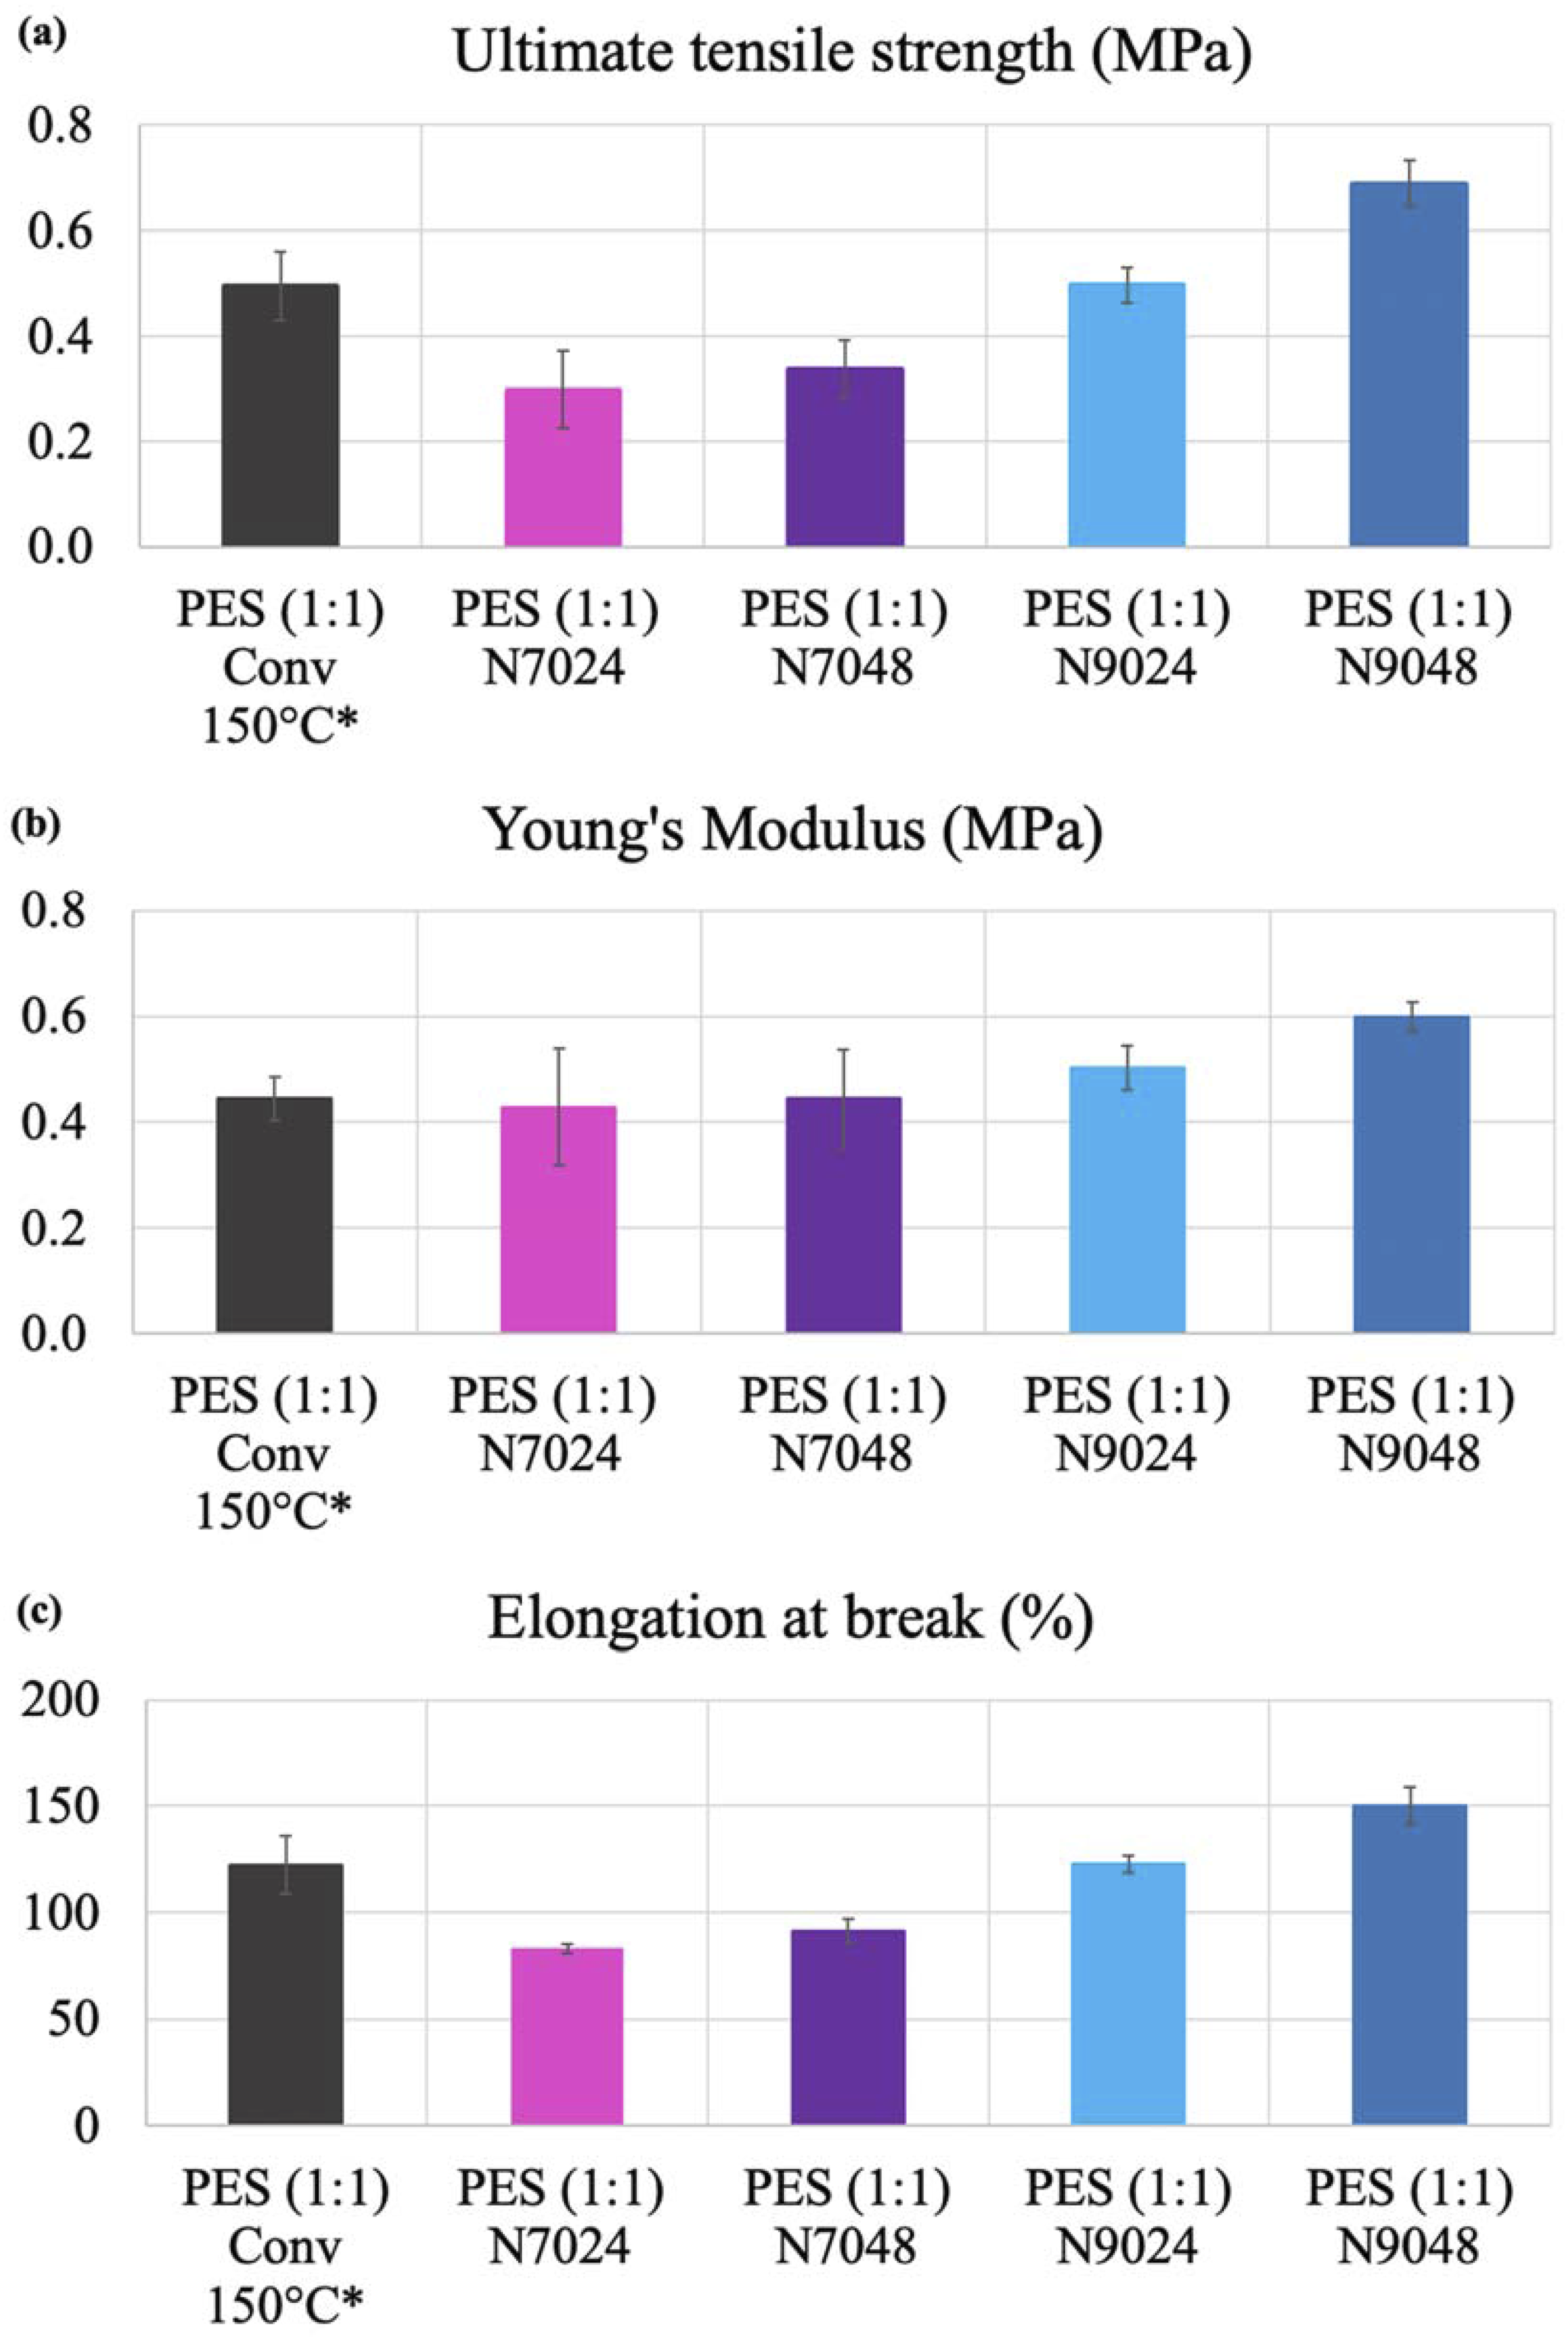
The tensile tests indicate that prepolymerization significantly affected the final properties of PES (1:1). Notably, PES (1:1) N9048 demonstrated the best mechanical performance, achieving a higher ultimate tensile strength (UTS) of 0.7 MPa and greater elasticity of 150%. In contrast, PES (1:1) N7024 exhibited lower mechanical properties, with a nearly 50% decrease compared to PES (1:1) N9048, except for Young’s modulus. Once again, the PES samples are arranged in ascending order of mechanical capacity, mirroring the trend observed in the DE of pPES (1:1) after the 2nd prepolymerization step. The mechanical test results correlate directly with the properties of the prepolymers that formed the final polymers. Specifically, prepolymer pPES (1:1) N9048 had the highest DE and, consequently, the highest molecular mass. Structurally, this prepolymer is more homogeneous and organized, with longer linear chains, resulting in a more robust polymeric network after the curing process. Compared to PES synthesized solely through a chemical approach, 12 the use of enzymes ensures more homogeneous chemical and structural units, leading to final polymers with enhanced mechanical performance. Remarkably, only PES (1:1) N9048 surpassed the best polymer synthesized earlier using a two-step methodology at 150°C without a catalyst. This highlights that employing an intermediate step with enzyme catalysis does not guarantee improved mechanical properties and can result in significantly weaker polymers if the conditions are not optimized.
Finally, the resistance and robustness of the polymer network was tested by interaction with solvents. The gel fraction and the degree of swelling (DS) were acquired based on techniques previously carried out for other elastomers,9,12,20,22–26 and using water, ethanol and THF, independently, the results being presented in Figure 11. (a) Gel fraction (%), (b) Degree of swelling (%) and (c) the appearance of the respective replicas initially and after drying process, aiming to remove the solvents for each produced PES (1:1).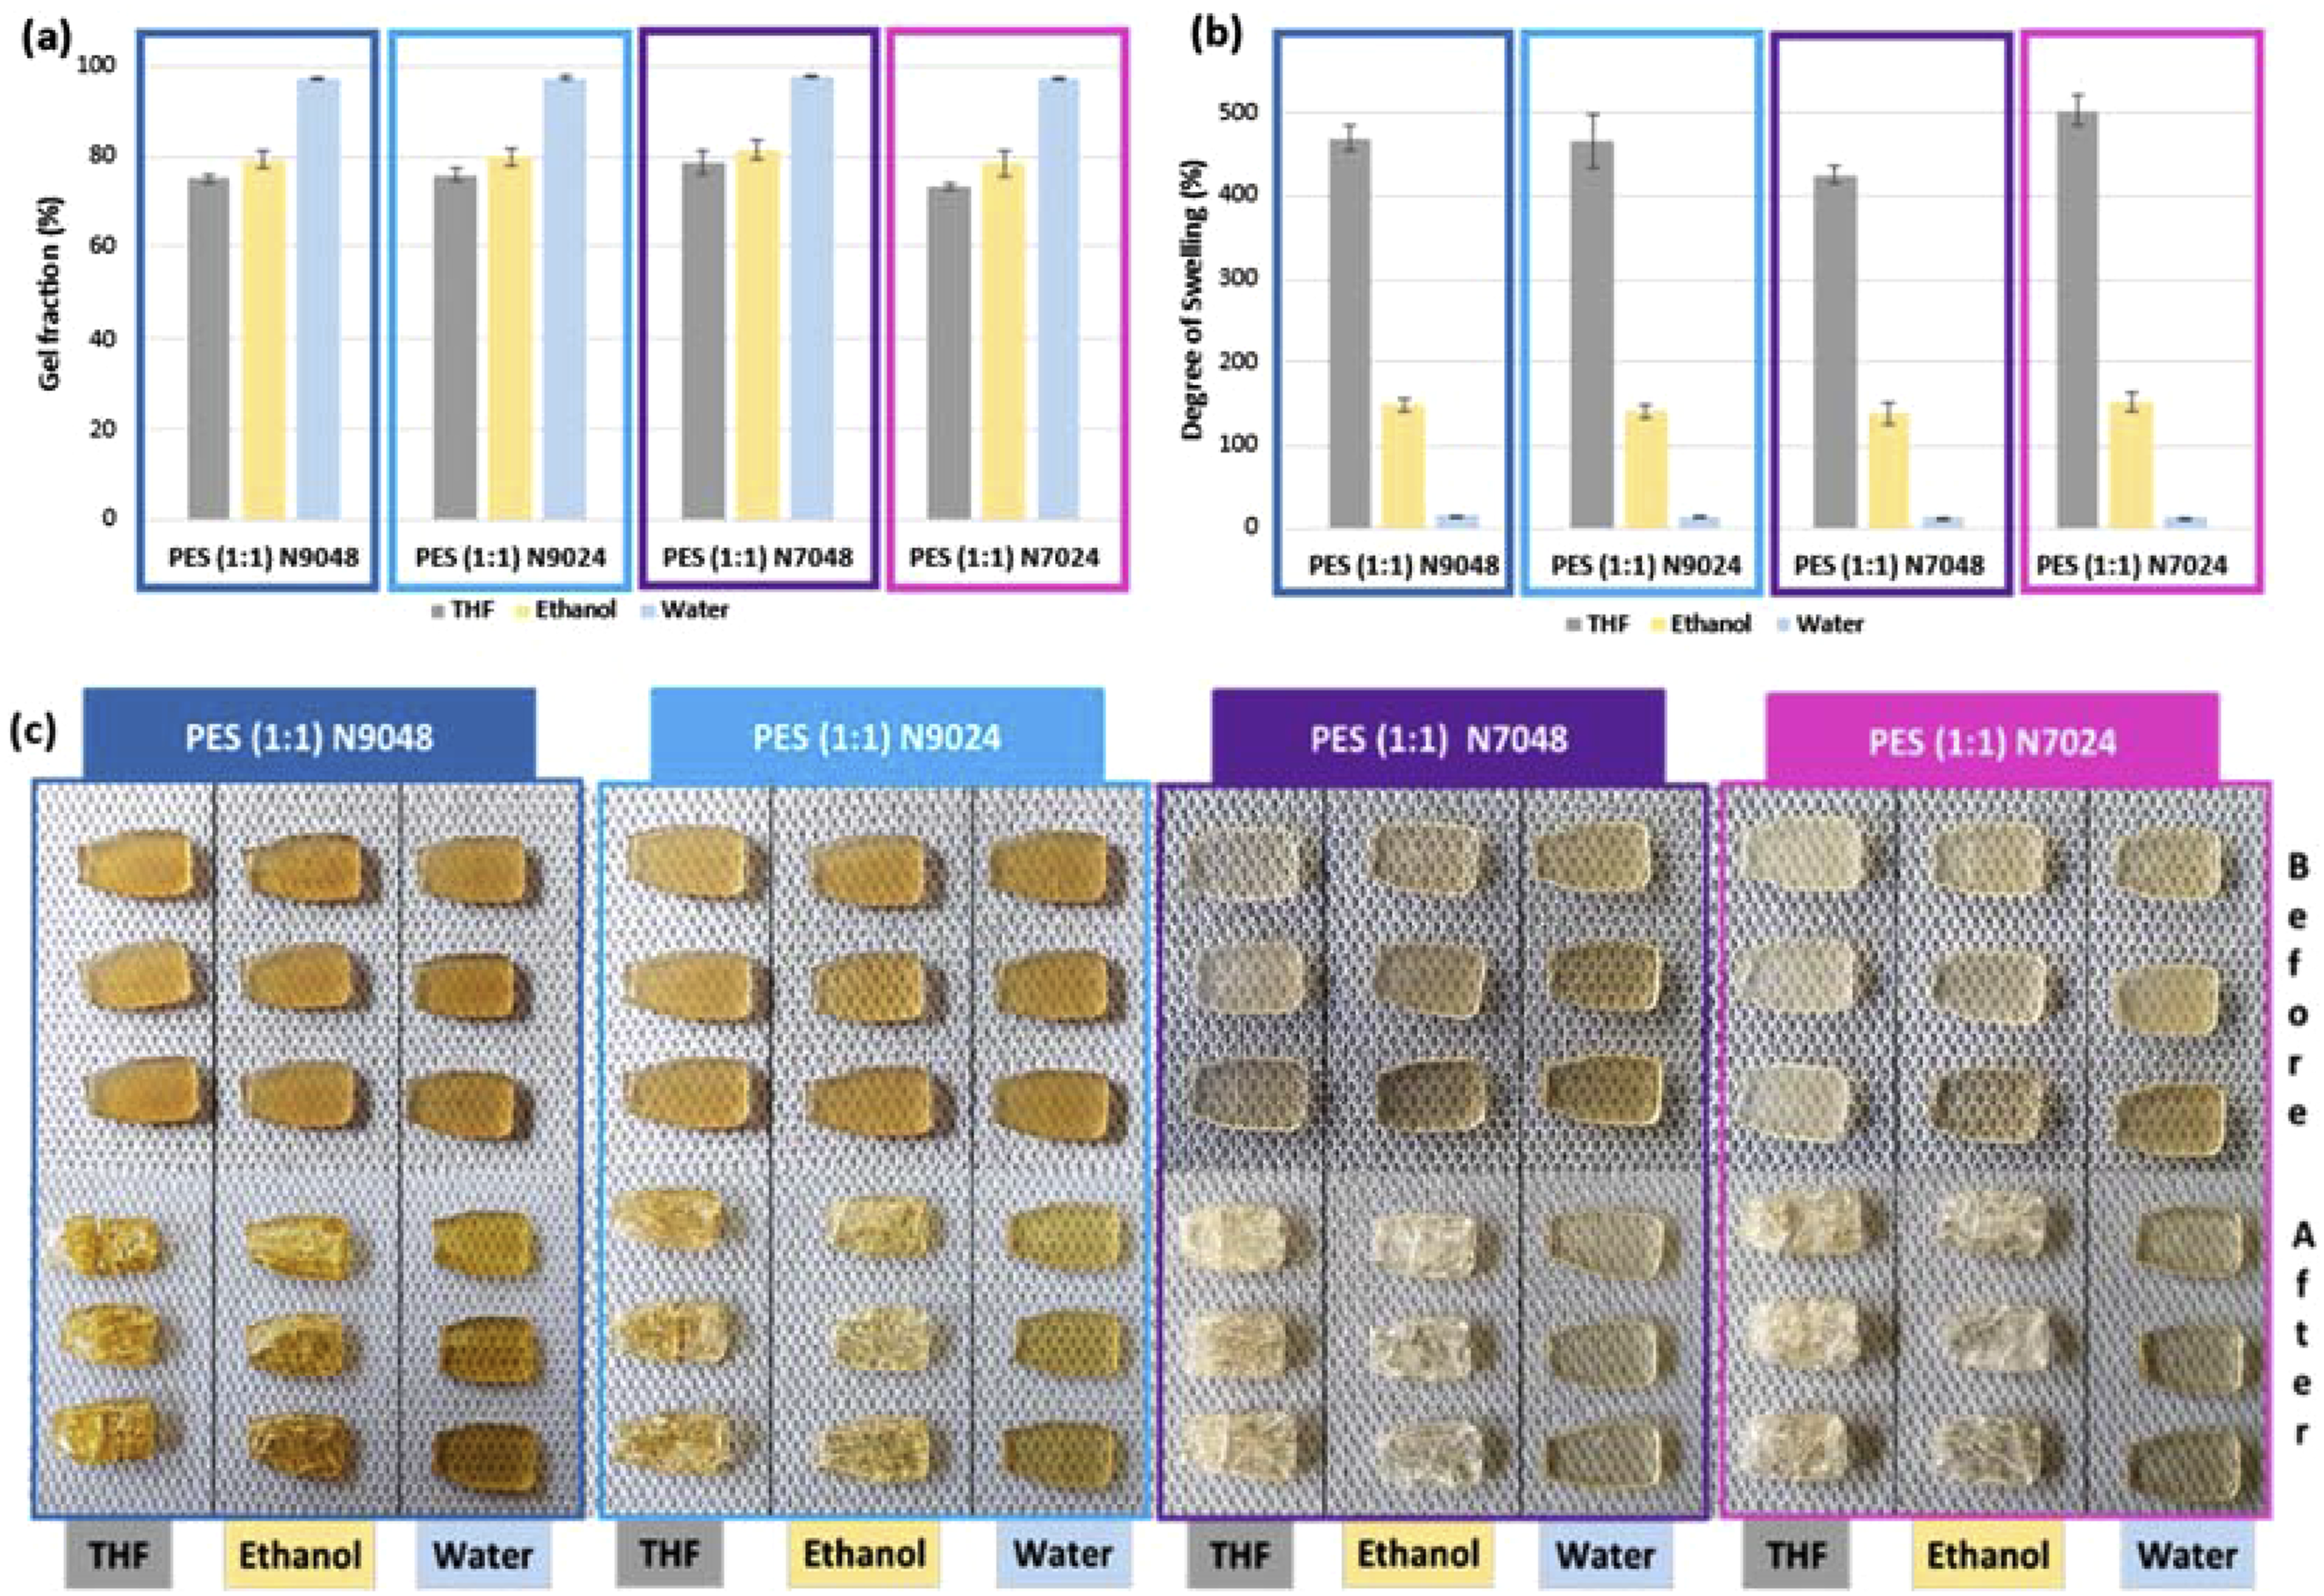
Figure 11 presents the results for DS, gel fraction, and visual appearance of the polymers at both the beginning and end of the process. Overall, the analysis shows that PES exhibits varying resistance and permeability to the tested solvents; however, the prepolymerization process did not result in significant differences among the final polymers, making it challenging to distinguish between them based on these tests. Water exposure did not affect the PES, which maintained its integrity, indicating good resistance. The DS with water remained below 16% for all polymers, as well as the gel fraction, which was consistent across samples, ranging from 97% to 98%. Ethanol, on the other hand, impacted the structural integrity of PES. The DS for ethanol was between 140% and 150% for all polymers, with no significant differences in gel fraction, which was approximately 80%. Post-drying, considerable damage was observed on the test pieces. Similarly, THF compromised the physical integrity of PES. The DS with THF ranged from 400% to 500% for all polymers, again showing no significant differences in gel fraction (75%-80%), and extensive damage was noted after drying. Unlike previous reports on the thermochemical synthesis of PES at varying temperatures, the polymers produced in this study did not establish a correlation between solvent resistance (for ethanol and THF) and mechanical properties. Furthermore, there was no improvement in PES’s resistance to solvents, particularly regarding its capacity to absorb and release ethanol without substantial physical damage.
Conclusions
In this work, a three-step process for synthesizing PES was developed. The optimization of the first prepolymerization step demonstrated that increasing the temperature significantly reduced the time required to achieve a 40% degree of polymerization. However, it impacts the composition of the prepolymers. Hence, a temperature of 150°C was selected for the first prepolymerization step since it yielded a more homogeneous prepolymer with approximately 91% ester oligomers and 85% linear structures. Additionally, the results suggested that one of the secondary hydroxyl groups in erythritol has greater reactivity than the primary hydroxyl groups, leading at least up to 20% esterification. The second prepolymerization step, catalyzed by N435, successfully increased the degree of esterification and molecular mass of the prepolymers, with variations depending on temperature and reaction time. The high selectivity of lipase B for primary hydroxyls was also confirmed. These variations were reflected in the mechanical properties of the final PES products. In fact, in comparison to PES synthesized exclusively by chemical methods, the use of enzymes results in more uniform chemical and structural units, which contributes to improved mechanical performance of the final polymers. Among the samples, PES (1:1) N9048, synthesized at higher temperature (90°C) and extended time (48 hours), exhibited superior mechanical properties. All PES samples displayed a Tg near −10°C, a density of 1.08 g.cm−3, and good stability up to approximately 300°C. There were also no notable differences in solvent resistance, nor were any improvements observed in PES’s previously reported ability to absorb and release ethanol without substantial physical damage.
Supplemental Material
Supplemental Material - Enzymatic synthesis of poly(erythritol sebacate)
Supplemental Material for Enzymatic synthesis of poly(erythritol sebacate) by Diana Smarandache, Bruno Godinho, Cătălina Ionescu, Nicoleta Cioateră, Artur Ferreira and Nuno Gama in Journal of Elastomers & Plastics.
Footnotes
Declaration of conflicting interests
The author(s) declared no potential conflicts of interest with respect to the research, authorship, and/or publication of this article.
Funding
The author(s) disclosed receipt of the following financial support for the research, authorship, and/or publication of this article: This work was funded in the scope of the project CICECO – Aveiro Institute of Materials, UIDB/50011/2020 & UIDP/50011/2020 & LA/P/0006/2020, financed by national funds through the FCT/MEC (PIDDAC). The NMR spectrometers are part of the National NMR Network (PTNMR) and are partially supported by Infrastructure Project Nº 022161 (co-financed by FEDER through COMPETE 2020, POCI and PORL and FCT through PIDDAC).
Supplemental Material
Supplemental material for this article is available online.
References
Supplementary Material
Please find the following supplemental material available below.
For Open Access articles published under a Creative Commons License, all supplemental material carries the same license as the article it is associated with.
For non-Open Access articles published, all supplemental material carries a non-exclusive license, and permission requests for re-use of supplemental material or any part of supplemental material shall be sent directly to the copyright owner as specified in the copyright notice associated with the article.