
Abstract
This study investigated longitudinal networks of risk and protective factors and treatment motivation among forensic psychiatric patients (FPPs) with and without substance use disorder (SUD) at admission (T1) and unconditional release (T2). The sample consisted of 468 FPP (Mage = 53.97, SDage = 9.99, 86.5% male, 34.6% SUD), and networks were estimated using the Gaussian Graphical Model. The most central network factors were impulsivity, treatment motivation, and treatment violation. For the protective factors, the strongest correlations emerged between problem insight and treatment motivation at T1, and between social and coping skills at T2. For risk factors this was between hostility and treatment violation at T1, and antisocial behavior and treatment violation at T2. While larger sample sizes and stability issues should be considered in future studies, the networks approach provides important implications for tailored inpatient forensic treatment.
Keywords
There is a growing interest in longitudinal research focused on dynamic changes in risk and protective factors within the treatment of forensic psychiatric patients (FPPs) (Bogaerts et al., 2020; Jankovic et al., 2021). The main aim of estimating changes in risk and protective factors is to aid risk assessment, as changes in these factors directly correspond to changes in future violent behavior (Bogaerts et al., 2020). Generally, risk factors are defined as individual characteristics, like hostility, that are associated with an increased likelihood of reoffending (Douglas et al., 2005). Protective factors are factors that decrease exposure to risk factors strongly linked with (re)offending (Loeber et al., 2007; Starfelt Sutton et al., 2021).
Two frequently used theoretical frameworks emphasize the impact of risk and protective factors on recidivism. The Risk Need Responsivity Model (RNR; Andrews & Bonta, 2006, 2010) denotes the influence of criminogenic needs (e.g., risk factors) on recidivism likelihood. The RNR model provides a holistic explanation for criminal conduct, focusing on the interaction between biological (e.g., temperament), psychological (e.g., dispositions), and social (e.g., social network) factors (Bonta & Andrews, 2017). In addition, the RNR model identifies eight central factors that can be directly linked to an increased risk of future offending, being: history of antisocial behavior, antisocial personality pattern, antisocial associations, antisocial cognitions, lack of leisure activities, work and school problems, substance abuse, and dysfunctional family situation (Andrews & Bonta, 2010).
Another model, known as the Good Lives Model (GLM; Ward et al., 2007), emphasizes strength factors, which are factors that can potentially mitigate the influence of risk factors (Scott & Brown, 2018), typically positive or prosocial (Jones et al., 2015). These strength factors are often described as protective or promotive factors (Scott & Brown, 2018). Protective factors were first introduced as factors that explain why individuals who are exposed to high-risk factors do not become violent (Rutter, 1979). Similarly, promotive factors are directly negatively correlated with recidivism, meaning that when these factors increase, the risk of violent offending decreases (de Ruiter & Nicholls, 2011; Loeber et al., 2007). The main characteristic of a protective factor is its interaction with risk factors, where it reduces the effect of a risk factor (Jones et al., 2015). The GLM emphasizes this positive role of protective factors, such as self-reliance or problem insight, in FPP’s rehabilitation.
Given that risk and protective factors are linked to (violent) recidivism (Bogaerts et al., 2018), they play a crucial role in identifying treatment goals (Ward et al., 2007) and legal decision making, such as determining leave modalities or unconditional release (Douglas et al., 2005). To assess these factors, risk assessment tools such as the PCL-R (Hare, 1991) and the HKT-R (Spreen et al., 2014), are widely used. However, a significant limitation of these tools is their reliance on linearly dependent contributions of risk and protective factors when estimating recidivism risk (Bogaerts et al., 2020). This dependence potentially leads to attenuation of important dynamic information (Beggs, 2010). Considering that risk and protective factors, alongside diagnostic comorbidities (e.g., Substance Use Disorder [SUD]), demonstrate changes over time (Jankovic et al., 2021), it becomes imperative to understand the dynamics of these factors (Bogaerts et al., 2020). This study aims to address this limited information about the (bi)directional associations and changes over time by investigating risk and protective factors and intrinsic treatment motivation of FPP with and without SUD.
Intrinsic Treatment Motivation and Risk and Protective Factors
Intrinsic motivation to engage in treatment, or treatment alliance, is described as a central factor in both the RNR and the GLM models (Bonta & Andrews, 2017; Ward & Brown, 2004). Within the RNR model, treatment motivation is part of the general and responsivity factors and underscores the importance of motivating an individual within a forensic setting to modify dynamic risk factors (Andrews et al., 2011). In the GLM, treatment motivation can be seen as a protective factor that plays an important role in reducing criminal recidivism (Van der Helm et al., 2018). Generally, intrinsic treatment motivation is described as a “readiness or eagerness” to seek guidance and work on problem-solving (Miller & Rollnick, 2013), which emerges from the individual’s desire to engage in treatment (Cornelius et al., 2017). A lack of this “readiness” can lead to several negative consequences like decreased treatment outcomes and patient satisfaction (King, 2014). In a forensic setting, lack of treatment motivation is particularly concerning as individuals who do not complete treatment may engage in high-risk behaviors that threaten public safety (McMurran & Theodosi, 2007). Given the high attrition rates in forensic treatment (Olver et al., 2011), understanding, measuring, and examining the motivation of FPP becomes particularly important (King, 2014).
Several studies have investigated the impact of treatment motivation on risk behavior in FPP, however, findings are mixed. Gale et al. (2018) found that intrinsic motivation can serve as a protective factor among a sample of male patients in a forensic setting in their qualitative study. This is corroborated by Anstiss et al. (2011), who found that increased motivation to change after motivational interviewing predicted a subsequent reduction in recidivism, with a significant effect size (eta squared of .27). However, this was not found in a sample of individuals that committed a sexual offense in which treatment motivation had no effect on changing cognitive distortions related to offending (Terry & Mitchell, 2001). More studies with forensic samples have shown that actual participation in treatment, and the resultant transformation of risk factors into strengths, was expected to reduce recidivism (Andrews & Bonta, 2010, p. 291; Anstiss et al., 2011). These findings suggest that intrinsic treatment motivation can be both a risk and protective factor. However, it is primarily a process variable that enhances treatment engagement, thereby indirectly influencing recidivism (King, 2014).
Intrinsic Treatment Motivation and SUD
Motivation is thus a crucial element of behavioral change (Flannery, 2017), and is particularly important in patients with SUD, as treatment motivation predicts abstinence and reduced substance abuse (for review, see DiClemente et al., 2017). Other reviews by Miller and Moyers (2015) and Copeland et al. (2015) consistently linked readiness to change with increased treatment adherence, treatment completion, and positive SUD treatment outcomes. Focus on SUD specifically is important because this mental disorder is highly prevalent among FPP compared to general populations (Marquant et al., 2021). In addition, SUD is associated with adverse long-term health outcomes (Moss et al., 2014) and has been identified as a significant risk factor for violent recidivism (Elbogen & Johnson, 2009).
In the context of SUD, a complex interaction emerges between substance abuse and motivation. Substances often serve as maladaptive coping mechanisms to alleviate emotional distress (Hides et al., 2008; Jamatia, 2023). This reliance on substances as a way of coping can become self-reinforcing, leading to a detrimental cycle. That is, a cycle in which individuals become trapped in a feedback loop where substances temporarily alleviate symptoms, but ultimately worsen underlying mental health (Jamatia, 2023). The substance that initially provides relief ends up escalating problems by altering brain chemistry, ultimately resulting in addiction. These neurobiological effects of substances can then compromise cognitive functions related to motivation even further (Edwards & Koob, 2010).
Several studies have shown that motivation to change positively predicts reduced substance abuse, specifically in four components of motivation; internal, external interpersonal help-seeking and trust in treatment (Bulut & Bozkurt, 2019; Cahill et al., 2003). This positive correlation is evident even within samples of patients with SUD and their caregivers (Cornelius et al., 2017). However, the bidirectional associations between SUD, intrinsic treatment motivation, and risk and protective factors remain unclear. Investigating these dynamic interconnections over time is essential and could provide a deeper understanding of the centrality of these factors, subsequently helping inform the establishment of treatment goals differentiated by specific patient groups, such as those with or without SUD. In addition, previous studies have shown that external motivation alone (common in forensic settings) is not enough to facilitate long-term results in patients with SUD (Marquant et al., 2021); hence, specific focus on intrinsic treatment motivation is warranted.
The Current Study
This study aims to investigate the configuration, centrality, and stability indices of networks comprising risk and protective factors, as well as intrinsic treatment motivation among FPP with and without SUD during their transition from admission to a forensic facility (T1) to unconditional release (T2). By employing this network approach, we can reveal potentially significant bidirectional associations between a set of factors and demonstrate which have the greatest impact on each other (Borsboom & Cramer, 2013). If a factor has many edges within the network, it is assumed to influence the evolution of other factors and is considered central (Borsboom & Cramer, 2013). Investigating these models longitudinally allows the study of evolving associations and identifies consistently central factors (Bogaerts et al., 2020). This approach provides insights into the connectedness of clinical factors and the subsequent risk of reoffending, as networks with stronger associations between risk factors are more susceptible to inpatient aggression and/or recidivism (Fried et al., 2017). To summarize, examining mutual associations within networks provides insights into the relations between factors, the strength of these relations, the centrality of factors (i.e., which factor has the most influence within the network), and longitudinal change.
Based on previous research (Bogaerts et al., 2020), we expected that at T1, risk factors would occupy a more central position within the network compared to T2 (H1). Also, we hypothesized that protective factors would have a more central position at T2 compared to T1 due to the presumed reinforcing effect of treatment on these protective factors (H2). These hypotheses align with the theoretical frameworks of the GLM (Ward et al., 2007) and RNR (Andrews & Bonta, 2006). During admission, FPP often presents criminogenic needs (e.g., cognitive distortions, deficient interpersonal skills), which can manifest as risk factors, contributing to the individual’s criminal behavior (Andrews & Bonta, 2006). Protective factors often take longer to identify as they are linked to treatment, which may not have started upon admission. Therefore, the early stages of admission may predominantly emphasize risk factors due to the urgency of managing immediate threats and ensuring safety. As treatment progresses, efforts shift to identifying and strengthening protective factors (e.g., social and coping skills), crucial for reducing recidivism (Ward et al., 2007).
For treatment motivation, we expected that FPP with SUD would have a less central position of motivation at T1 and T2 compared to patients without SUD (H3a). Subsequently, FPP with SUD was expected to display a more central position of risk factors at both T1 and T2 compared to patients without SUD (H3b). Furthermore, we anticipated that FPP without SUD would hold a more central position of treatment motivation at both T1 and T2 compared to patients with SUD (H4a). In addition, patients without SUD were expected to have a more central position of protective factors at both T1 and T2 compared to patients with SUD (H4b).
Method
Participants
The study sample consisted of 468 FPP from all 12 forensic psychiatric centers (FPCs) in the Netherlands who received a TBS order (in Dutch: “terbeschikkingstelling”) under the Dutch Entrustment act, leading to involuntary admission to an FPC (Van Marle, 2002). All FPP were admitted for a crime with a sentence of at least 4 years, for which they were deemed not fully responsible because of the presence of a psychiatric disorder. Data collection took place between 2009 and 2014 and included all patients who were unconditionally released within this period. No exclusion criteria were applied, as our aim was to include all patients unconditionally released between 2009 and 2014. For the current study, all 468 participants were thus included (Mage = 53.97, SDage = 9.99, range = 25–90).
Of the participants, 405 were male (Mage = 53.89, SDage = 9.95, range = 26 – 90) and 63 were female (Mage = 54.49, SDage = 10.33, range = 25 – 76). All FPP received an average court-imposed treatment of approximately 10 years (M = 10.68, SD = 4.18). Psychiatric diagnoses included schizophrenia (n = 22, 4.7%), SUDs (n = 162, 34.6%), pedophilia (n = 7, 1.5%), personality disorder not otherwise specified (n = 77, 16.4%), personality disorder cluster A (n = 23, 4.9%), cluster B (n = 131, 28%), and cluster C (n = 20, 4.3%). Note the percentages do not sum up to 100% due to high comorbidity.
Procedure
All demographic, criminal and clinical data for this study were retrospectively collected from electronic patient files. This study was approved by the Dutch Ministry of Security and Justice and the Ethical Review board of Tilburg University (also see Bogaerts et al., 2018; Spreen et al., 2014) and adhered to the guidelines of the Helsinki Convention. To ensure privacy, all data were anonymized. Central constructs were measured at two measurement occasions: admission to the FPC (T1) and unconditional release (T2).
Measures
Historisch Klinische Toekomst—Revised (HKT-R; Bogaerts et al., 2018)
To measure clinical risk and protective factors the Historical, Clinical and Future-Revised (HKT-R; Historisch Klinisch Toekomst-Revised; In Dutch, Bogaerts et al., 2018; Spreen et al., 2014) was used. The HKT-R consists of Historical (12 items), Clinical (14 items) and Future (seven items) domains that describe factors related to future violent recidivism. Only clinical items were included, as historical factors are considered unchangeable, and future factors pertain to the period following release, which fall outside the scope of this study. Within the clinical domain seven items measured risk factors (e.g., impulsivity, antisocial behavior, and hostility) and seven protective factors (e.g., coping skills, willingness to engage in treatment; see Table 1). Each item was scored on a 5-point scale, ranging from 0 (“no risk”) to 4 (“high level of risk”). Protective factors were recoded so that a score of zero represented no protection, while a score of four indicated high protection. Scores on the clinical items were derived from the behavior exhibited by the patient during the admission phase or within the last 12 months before they left the FPC for unconditional release. Previous studies showed that the HKT-R has good predictive validity (Bogaerts et al., 2018; Spreen et al., 2014). Cronbach’s alpha for protective and risk factors in this study can be considered adequate (αT1risk = .71; αT2risk = .75; αT1protective = .73; αT2 protective = .80). Inter-rater reliability was assessed with the single measure intraclass correlation coefficient (ICC), which was excellent .89 (.48–.95) for the clinical factors, except for impulsivity (.20) and social skills (.27). The ICC of the total scale was .80.
Comparison of Mean Differences HKT-R Clinical Factors and Intrinsic Treatment Motivation (N = 467)
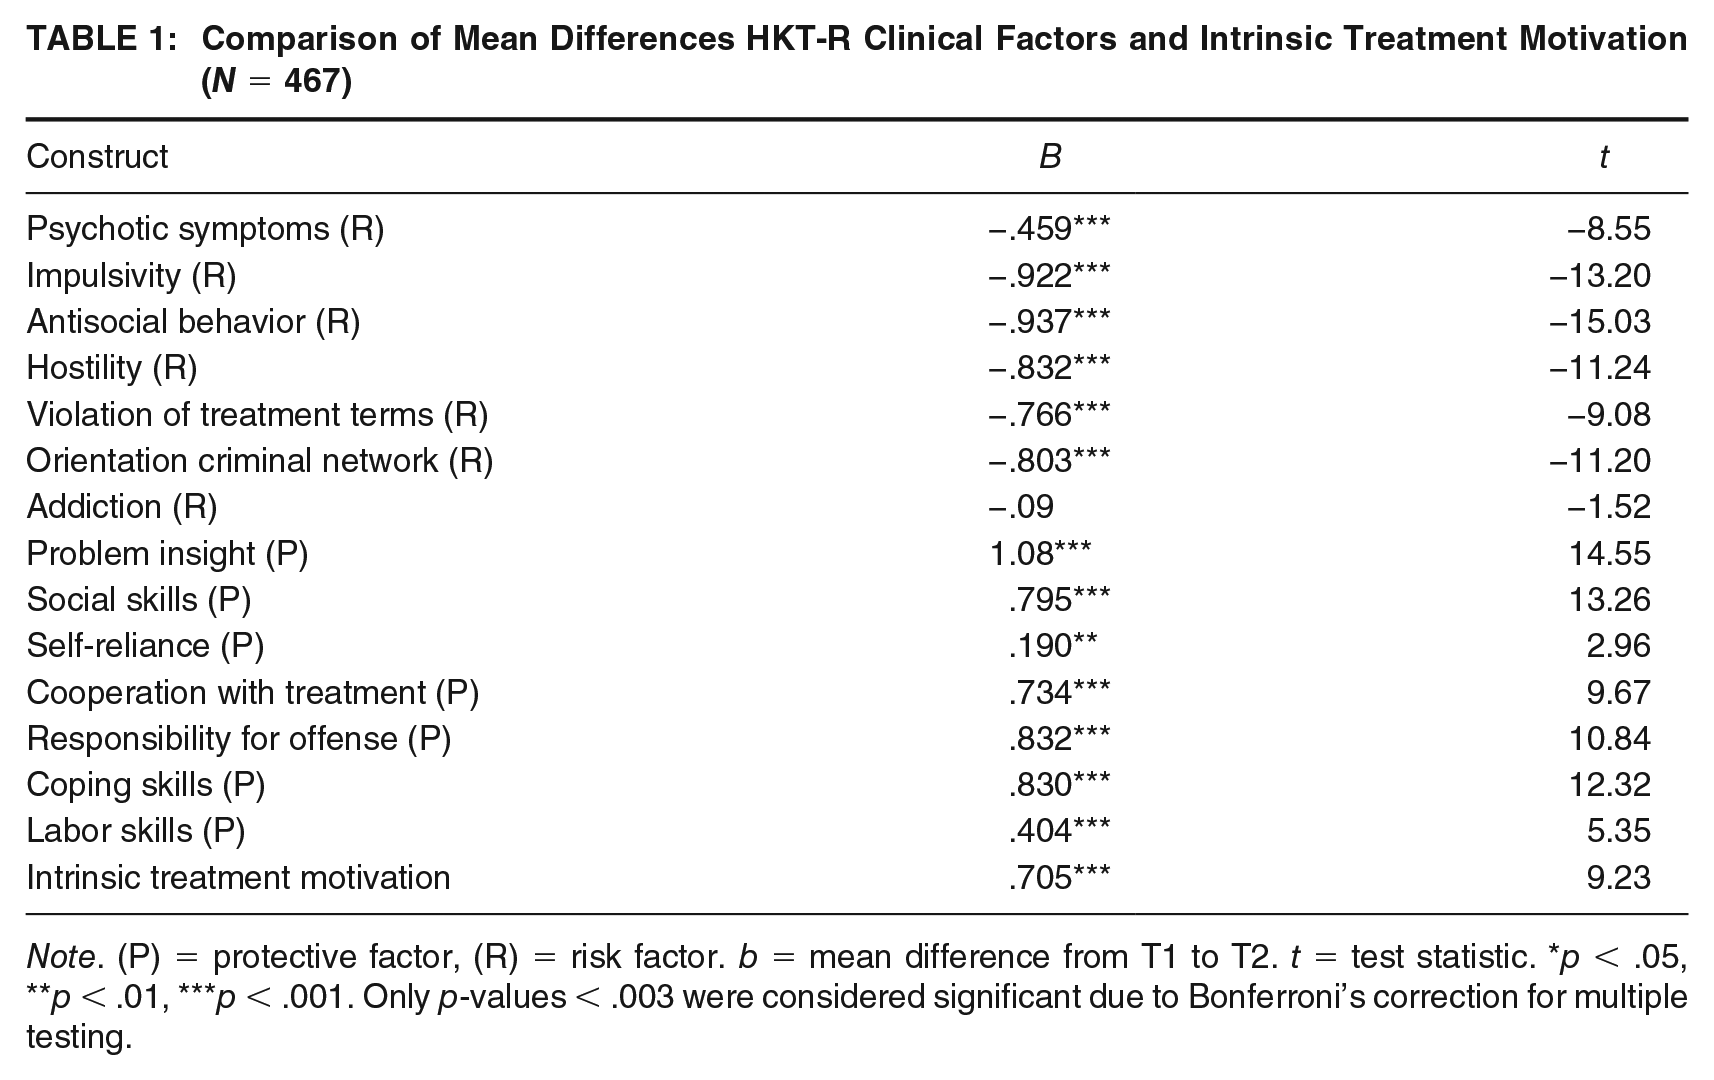
Note. (P) = protective factor, (R) = risk factor. b = mean difference from T1 to T2. t = test statistic. *p < .05, **p < .01, ***p < .001. Only p-values < .003 were considered significant due to Bonferroni’s correction for multiple testing.
Intrinsic Treatment Motivation
Intrinsic treatment motivation was assessed using a single-item: “Estimate to what extent the patient is intrinsically motivated for his or her TBS-treatment.” This item was scored on a 5-point scale ranging from 1 (“low motivation”) to 5 (“high motivation”). Scores in this study ranged from 1 to 5 (MT1 = 2.65, SDT1 = 1.26; MT2 = 3.27, SDT2 = 1.28). These scores were indicated by a one person, hence inter-rater reliability could not be obtained.
SUD (Diagnostic and Statistical Manual of Mental Disorders [4th ed., text rev.; DSM-IV-TR; American Psychiatric Association, 2000]
The presence of SUD (alcohol, soft drugs, hard drugs and other substances) was assessed by trained clinical psychologists/psychiatrists upon patients’ admission to the FPC, following the criteria outlined in the DSM-IV-TR (American Psychiatric Association, 2000) as the Diagnostic and Statistical Manual of Mental Disorders (5th ed.; DSM-5; American Psychiatric Association, 2013) had not yet been implemented in the Netherlands at the time of data collection. SUD was operationalized dichotomously; 0 (“No SUD”) and 1 (“Yes SUD”).
Statistical Data-Analyses
Data-Preparation and Missings
Data were analyzed using IBM SPSS version 25, R Version 4.1.2, R-Studio and based on recommendations of Bogaerts et al. (2020). Missing data was analyzed using Little’s (1988) MCAR’s test. If needed, missing values were imputed using the Multivariate Imputation by Chained Equations (MICE) package in R (Van Buuren et al., 2015).
Network Model Estimation
Networks were estimated using the Gaussian Graphical Model (GGM; Costantini et al., 2015) adopting the age qgraph R-Package (Epskamp et al., 2012). A multivariate normal distribution is prerequisite for GGM models, which was tested using the Multivariate Normality Test package in R (Korkmaz et al., 2014). If normality was violated, items were transformed using the Henze Zirkler’s test (Henze & Zirkler, 1990). The Least Absolute Shrinkage and Selection Operator (LASSO; Tibshirani, 1996) and Extended Bayesian Information Criterion (EBIC; Chen & Chen, 2008) were employed for model selection to address possible false positive edges due to multiple testing. The networks were visualized using Fruchterman and Reingold’s (1991) algorithm, which positions strongly connected network nodes closer to each other, where the nodes represented the variables and edges represented the partial correlations between the constructs while controlling for other variables (Costantini et al., 2015). Thicker edges indicated stronger relations between the nodes, where blue edges denoted positive associations and red edges negative associations.
Network Centrality and Stability
Centrality analyses were performed using the R-package “bootnet” (Epskamp & Fried, 2017), to estimate the most important network nodes and edges based on the networks’ connectivity. The strength of each node was estimated using z-scores, where a higher z-score signifies a more central position. Centrality was measured as the sum of all associations between a particular node and all other nodes in the network (Costantini et al., 2015). Network configurations were based on recommendations by Epskamp and Fried (2018). To assess the stability of the networks, we conducted bootstrapping, using the “bootnet” R-package. We applied a 95% confidence interval, indicating that in 95% of cases, the true parameter value was included. In addition, we employed sub setting to determine the stability of the centrality measure, estimating the minimum number of cases required to yield stable results. To interpret the significance of the edges’ weights and centrality measures, we applied the bootstrapped centrality difference test. This test involved using 1000 bootstrapped samples and a p-value of .05. Finally, the correlation stability coefficient was computed to assess the minimum number of cases required to maintain a correlation of > .70 between the original centrality and the centrality of the network derived from a subset of cases. A correlation stability coefficient of > .25 was considered sufficient, while a coefficient exceeding .50 indicated a good stable measure of centrality (Epskamp & Fried, 2018).
Results
Preliminary Analyses
No missing data were observed for intrinsic treatment motivation or SUD. However, missing data were present for the clinical HKT-R items (T1 = 40%; T2 = 1%). Missing values during admission are not uncommon, as certain information may still be unknown during the assessment phase, and treatment may not have commenced yet. At T2, missing data was rare, and Little’s (1988) MCAR test indicated that the missing data occurred randomly χ2(538, N = 468) = 590.193, p = .059. The MICE package was used to impute the missing values by adopting information from all HKT-R factors at each time point to estimate the missing values (Van Buuren & Groothuis-Oudshoorn, 2011). The original dataset and the imputed data showed high comparability in terms of estimated means and standard deviations (see Table 1 Supplemental Material, available in the online version of this article), hence all analyses were based on the imputed dataset.
Network Structure Clinical Factors and Intrinsic Motivation at T1 and T2
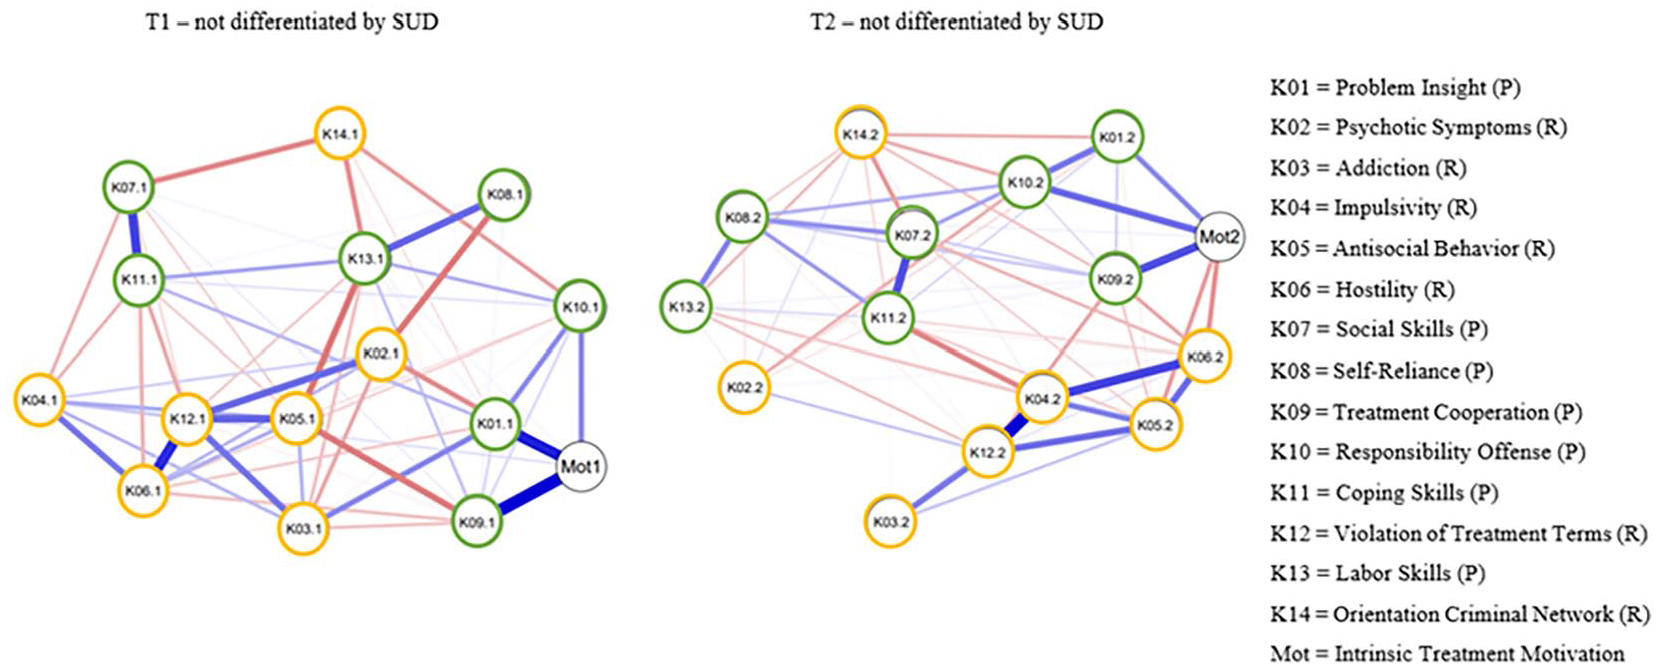
The first network estimated clinical factors at T1 without discerning SUD (see Figure 1 and Supplemental Material Figures 1A–E, available in the online version of this article). The bootstrap confidence intervals revealed no significant deviations. The strongest positive partial correlations for protective factors were found between treatment cooperation and problem insight with intrinsic treatment motivation, followed by social with coping skills. Considering risk factors, the strongest associations emerged between treatment violation with hostility, antisocial behavior, and psychotic symptoms. The most central nodes at T1 were treatment violation, labor skills, and intrinsic treatment motivation, respectively. Treatment violation terms had the highest standardized centrality strength (1.20), and differed significantly from most other nodes at T1, followed by antisocial behavior and labor skills. The centrality was considered stable (.59).
Network Structure of Clinical Factors and Intrinsic Treatment Motivation at T1 and T2
The second network estimated clinical factors at T2, again without differentiation by SUD (see Figure 1 and Supplemental Figures 2A–E, available in the online version of this article). No significant differences emerged within the bootstrap confidence intervals. For the protective factors, the most robust positive partial correlations were found between treatment cooperation and intrinsic treatment motivation, social and coping skills, and problem insight and responsibility offense. Within the risk factors, strong partial positive associations emerged between impulsivity and treatment violation, impulsivity and hostility, and antisocial behavior and hostility. The centrality indices showed that impulsivity, treatment violation and treatment cooperation were the most central network nodes. Impulsivity had the highest centrality (1.00), displaying a significant deviation from the other network nodes. This was followed by treatment violation and hostility. Centrality for this network appeared stable (.59).
Dependent Samples T-Test Clinical Factors and Intrinsic Motivation at T1 and T2
Additional dependent t-tests were performed to provide further insight into the positioning of clinical factors. To account for multiple testing, a Bonferroni correction was applied, leading to an adjusted p-value of < .003 (.05/14 = .003; Abdi, 2007). The risk factors with the highest means at both time points were orientation to criminal network, impulsivity, and antisocial behavior. Summing all risk factors together, FPP scored significantly higher at T1 compared to T2 b = −.677, t(3275) = −26.24, p < .001. Considering each risk factor separately (see Table 1), significant decreases from T1 to T2 in psychotic symptoms, impulsivity, antisocial behavior, hostility, violation in treatment terms, and orientation to criminal network were found. Only addiction did decrease significantly from T1 to T2. Overall, the largest decrease in the risk of future recidivism was observed for antisocial behavior. Protective factors with the highest means at both time points were self-reliance, labor skills, and treatment cooperation. Considering all clinical protective factors, scores were higher at T2 compared to T1 b = .643, t(6379.4) = 22.3, p < .001. Significant increases from T1 to T2 were found for almost all protective factors, except for self-reliance. Overall, the most substantial and significant increase in protection against future recidivism was observed for problem insight. For intrinsic motivation, another dependent samples t-test was performed, showing a significant increase from T1 to T2.
Network Structure at T1 no SUD
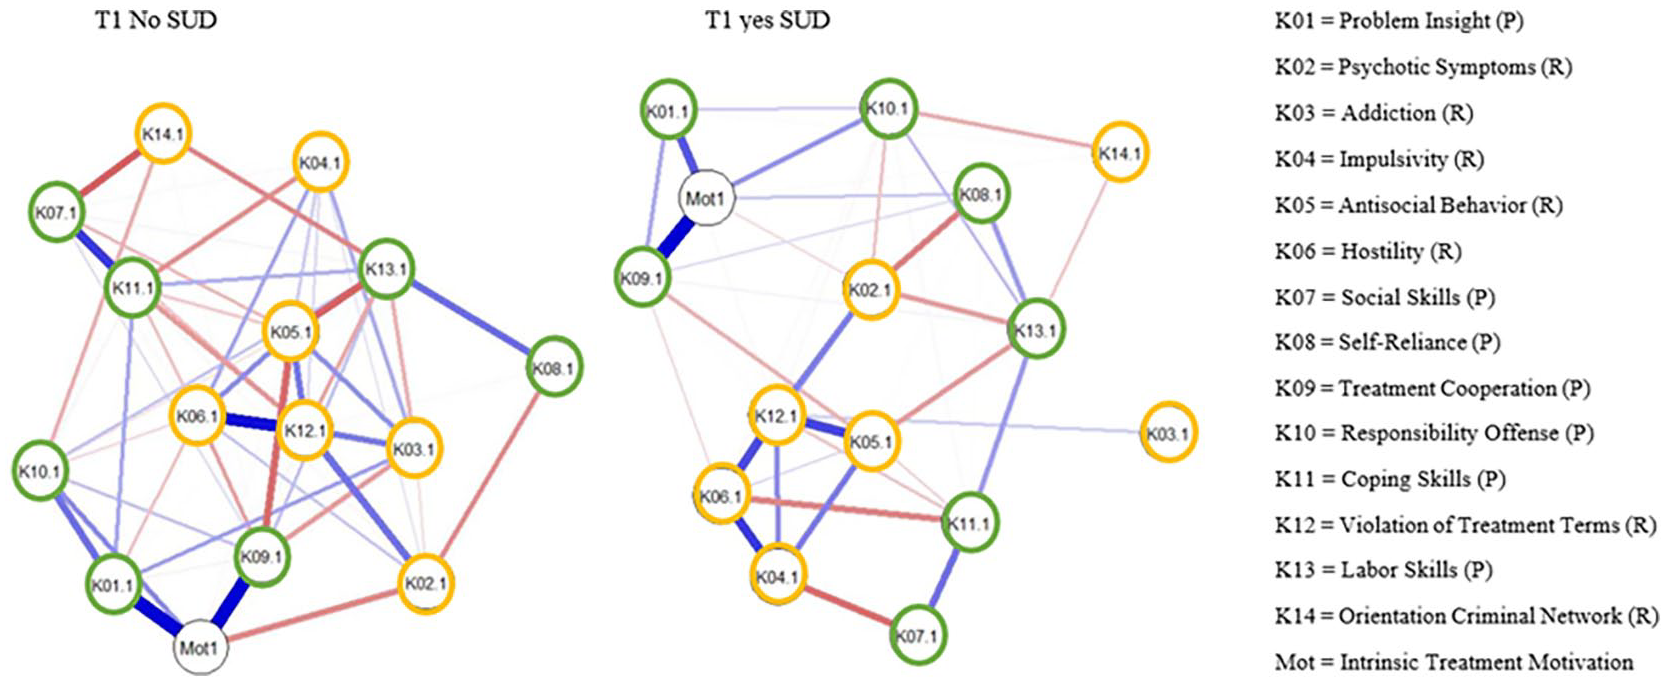
The third network estimated clinical factors at T1 for individuals without SUD (see Figure 2 and Supplemental Figures 3A–E, available in the online version of this article). The bootstrap tests showed no significant discrepancies. For the protective factors, the strongest positive partial correlations were found between problem insight and treatment cooperation, with intrinsic treatment motivation and social and coping skills. For risk factors, the strongest positive correlations emerged between treatment violation with hostility, antisocial behavior, and psychotic symptoms. Between clusters, the strongest negative edges were found between social skills and orientation criminal network, antisocial behavior and labor skills, and antisocial behavior and treatment cooperation. At T1, treatment violation had the highest centrality, followed by antisocial behavior, treatment cooperation, and treatment motivation. Treatment violation had the highest standardized centrality strength (1.10) and significantly differed from most other nodes. Antisocial behavior and labor skills also showed a high centrality strength. Centrality indices were considered relatively stable (.43).
Network Structure of Clinical Factors and Intrinsic Treatment motivation at T1 Differentiated by SUD
Network Structure at T1 With SUD
The fourth network estimation focused on the associations between clinical factors at T1 for individuals with SUD (see Figure 2 and Supplemental Figures 4A–E, available in the online version of this article). The bootstrap confidence intervals showed no significant variations. Strongest associations between protective factors were found between treatment cooperation and intrinsic treatment motivation, followed by problem insight and intrinsic treatment motivation, and social with coping skills. For risk factors, the strongest associations were found between impulsivity and hostility, antisocial behavior and treatment violation, and hostility and treatment violation. The strongest negative associations between clusters were found between impulsivity and social skills, psychotic symptoms and self-reliance, and hostility and coping skills. The most central nodes were treatment violation, followed by hostility, intrinsic treatment motivation, and impulsivity. Treatment violation had the highest standardized centrality strength (.90), followed by hostility and impulsivity. The network’s centrality was considered unstable (.13).
Network Structure at T2 No SUD
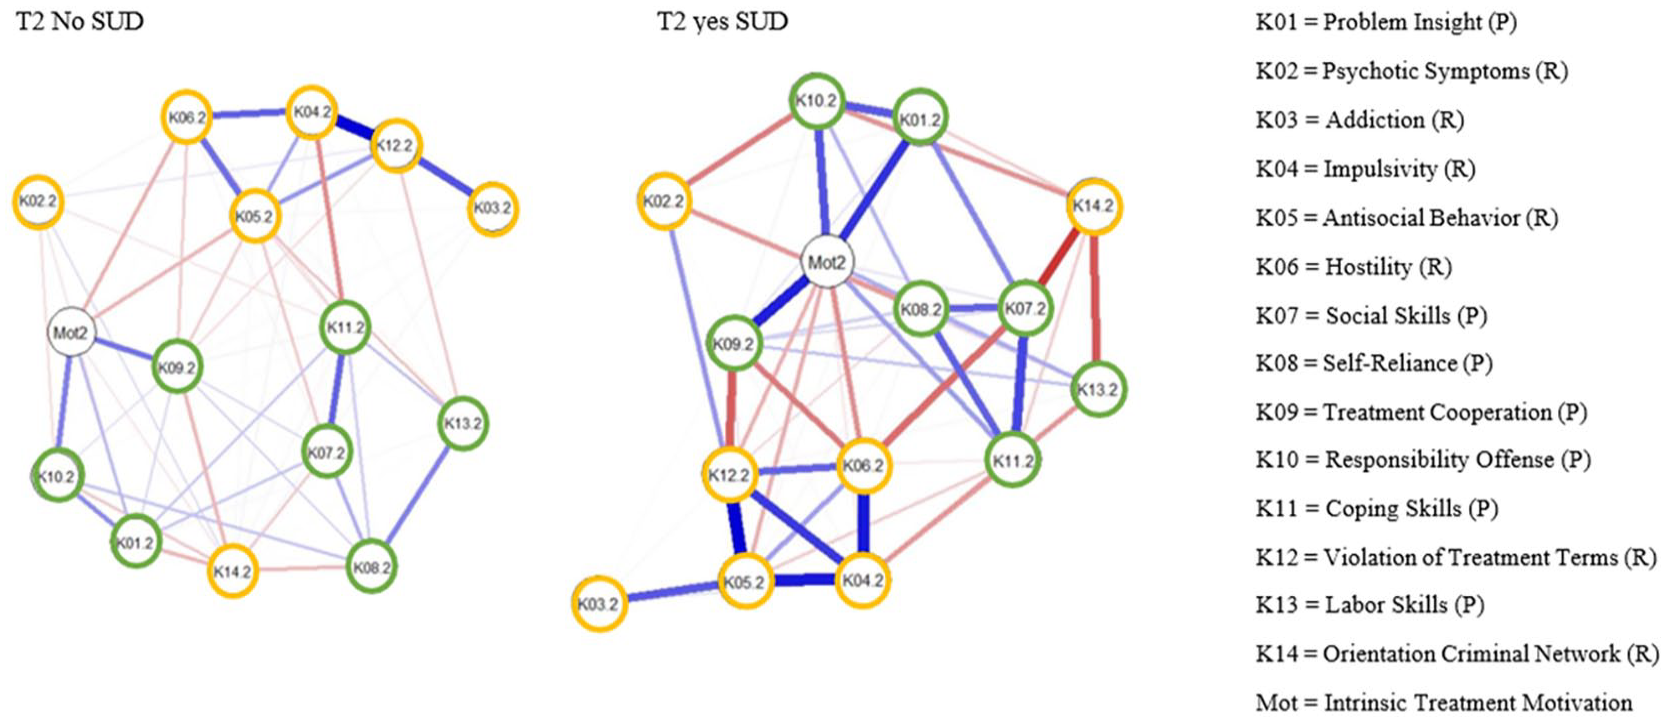
The fifth network was estimated for FPP without SUD at unconditional release (see Figure 3 and Supplemental Figures 5A–E, available in the online version of this article). The bootstrap confidence intervals were consistent. For the protective factors, the strongest positive correlations emerged between social and coping skills, treatment cooperation and intrinsic treatment motivation, and self-reliance and labor skills. Concerning risk factors, positive associations were observed between impulsivity and treatment violation, addiction and treatment violation, and impulsivity and hostility. The strongest negative edges were observed between impulsivity and coping skills, problem insight and orientation to criminal network, and treatment cooperation and orientation criminal to network. The most central nodes were impulsivity, violations of treatment terms, and antisocial behavior, followed by coping skills. Impulsivity had the highest standardized centrality strength (1.10), followed by antisocial behavior and treatment violation. The correlation stability coefficient was unstable (.28).
Network Structure of Clinical Factors and Intrinsic Treatment motivation at T2 Differentiated by SUD
Network Structure at T2 With SUD
The sixth and final network was estimated for FPP diagnosed with SUD at unconditional release (see Figure 3 and Supplemental Figures 6A–E, available in the online version of this article). No large deviations were observed for the bootstrap confidence intervals. The strongest edges for the protective factors were observed between treatment cooperation and intrinsic treatment motivation, social and coping skills, and problem insight and intrinsic treatment motivation. For the risk factors, strongest positive associations emerged between antisocial behavior and treatment violation, and impulsivity with hostility and antisocial behavior. The strongest negative edges were between social skills and orientation to criminal network, followed by labor skills and orientation to criminal network and treatment cooperation and treatment violation. Intrinsic treatment motivation was the most central node, followed by treatment violation, antisocial behavior, and impulsivity. Treatment violation and intrinsic treatment motivation had the highest standardized centrality strength (1.10), followed by antisocial behavior and impulsivity. The networks’ centrality was relatively unstable (.28).
Discussion
This study aimed to investigate the network structure and longitudinal changes in risk and protective factors, with a specific focus on the impact of SUD and intrinsic treatment motivation for FPP at admission and upon unconditional release. This study was conducted to better understand the dynamic nature of these facets in inpatient forensic treatment.
Network Configuration Clinical Factors and Intrinsic Motivation at T1 and T2
We first conducted a network model and dependent samples t-test investigating the influence of and associations between clinical factors and intrinsic treatment motivation for FPP at both admission and unconditional release. In line with the RNR model (Andrews & Bonta, 2006), risk factors were more influential at admission compared to unconditional release, based on the dependent samples t-test. However, this finding was not consistent; at admission, treatment motivation (protective factor) and at unconditional release, treatment violation (risk factor) emerged as one of the most central nodes, illustrating that protective factors at admission and risk factors at release were also among the most influential factors within the network. At admission, there were more significant and stronger connections among risk factors compared to unconditional release, while more protective associations were significant at unconditional release. Although these findings partially support H1 and H2, in line with previous research (Andrews & Bonta, 2006, 2010; Bogaerts et al., 2020; Ward et al., 2007), not all risk factors were most influential at admission, and not all protective factors were most central at unconditional release.
A more in-depth inspection of the network configurations revealed interesting associations between and within risk and protective factors. First, negative associations between risk and protective factors were found for antisocial behavior with labor skills and treatment cooperation, and psychotic symptoms and self-reliance. These findings corroborate recent studies showing negative associations between antisocial behavior and treatment cooperation (Verschueren et al., 2022). The persistent nature of antisocial behavior (American Psychiatric Association, 2000; Bresin, 2019) could potentially explain these difficulties in adhering to rules and authority (Andrews & Bonta, 2006). The negative association between psychotic symptoms and self-reliance align with Bogaerts et al. (2020), suggesting that FPP with psychotic episode(s) may have a reduced ability to perform daily tasks independently, thus reducing their self-reliance (Dalhuisen et al., 2015). This underlines the significance of enhancing self-reliance as a treatment goal for FPP.
Second, at both timepoints, treatment violation consistently emerged as the most influential factor, meaning that this factor had the strongest associations with the other clinical factors within the network. This shows that breaching treatment conditions, such as absconding (Watson & Choo, 2020), or substance abuse (Sonnweber et al., 2022), are factors FPP struggle with frequently. Treatment violation was primarily positively associated with impulsivity, hostility, and antisocial behavior at both timepoints, partially replicating Bogaerts et al. (2020), and earlier notions of persistency in antisocial behavior (Bresin, 2019). This interaction between impulsivity, hostility, and antisociality can be seen as the “antisocial triangle,” which is associated with an elevated risk of engagement in criminal behavior (Booth-Kewley et al., 2009). These findings underscore the importance of addressing treatment violations in FPP, as it not only endangers the safety of patients and staff but also undermines treatment effectiveness and successful reintegration (Sonnweber et al., 2022).
Third, a clear distinction was observed between risk and protective factors over time; the most influential protective factors were strongly and positively related to other protective factors, whereas the most influential risk factors were most strongly connected to other risk factors. These findings strongly advocate for treating clinical factors as distinct categories rather than as a uniform group (Klepfisz et al., 2016). This notion is further supported by our partial correlation findings, showing all positive associations within clusters of either risk and protective factors and negative associations between the clinical factor groups. This illustrates that clinical factors in each cluster reinforce those factors within that specific cluster (i.e., either risk or protective) using positive feedback loops (Borsboom & Cramer, 2013).
Network Configuration Clinical Factors at T1 and T2—Differentiated by SUD
Within the second network analyses, we investigated the influence and associations between risk and protective factors within two patient groups: FPP with and without SUD. For patients without SUD, the most influential clinical factors at admission treatment violation and antisocial behavior (risk factors), and treatment cooperation (protective factor). Conversely, for patients with SUD, the most important factors within the network at admission were treatment violation, hostility, and impulsivity (risk factors). At unconditional release, the most central factors for patients without and without SUD were similar, being impulsivity, treatment violation, and antisocial behavior (risk factors). Similarly, FPP with SUD had more significant and stronger associations among risk factors at admission compared to FPP without SUD, although this difference was small. At unconditional release, the strongest relationships between clinical factors were different for each patient group, showing stronger positive associations between both antisocial behavior and treatment violation with impulsivity for FPP with SUD, and between impulsivity and addiction with treatment violation for patients without SUD. Both patient groups displayed similar positive associations between protective factors, including social and coping skills, self-reliance and labor skills, and social skills and self-reliance. To conclude, these findings suggest that protective factors’ associations remained consistent at unconditional release regardless of SUD. Visually, risk factors do appear more influential at T1 compared to T2, consistent with the first network model estimations, as well as previous findings (Bogaerts et al., 2020). However, this difference does not vary between FPP with or without SUD (see Table 2, Supplemental Material, available in the online version of this article); therefore, hypotheses 3b and 4b are only partially supported.
Other interesting findings also emerged from the network configurations; for patients with SUD, impulsivity emerges as an important risk factor at both timepoints, reaffirming the established link between substance abuse and heightened impulsivity (Fielenbach et al., 2017; Loree et al., 2015). This association can be partially attributed to deficient inhibitory control perpetuating substance abuse (Verdejo-García et al., 2007). Given the difficulty of treating SUD, our results stress customization of interventions that target the risk factors identified within the networks. Another interesting finding was the strong association between psychotic symptoms and treatment violation for patients without SUD, aligning with the finding of Bogaerts et al. (2020) and previous observations regarding the difficulties in daily functioning experienced by patients with psychosis (Dalhuisen et al., 2015). These findings collectively contribute to our understanding of clinical factors’ centrality and relevance in different patient populations, thereby offering valuable insights for the development of targeted interventions.
Network Configuration Intrinsic Motivation at T1 and T2—Differentiated by SUD
The last network investigated the importance of intrinsic treatment motivation, again differentiated by FPP with and without SUD. Network estimations showed that at admission, intrinsic treatment motivation was the third most influential factor for both FPP with and without SUD. However, at unconditional release, for FPP without SUD, intrinsic treatment motivation was no longer among the most important factors within the network. In contrast, for FPP with SUD, intrinsic treatment motivation was the most influential factor and had the most and strongest connections with other factors within the network. Contrary to our expectations, intrinsic treatment motivation increased from T1 to T2 for FPP with SUD, while it decreased for FPP without SUD.
Current study results suggest that intrinsic treatment motivation is an important factor for FPP with SUD, contrary to our hypotheses 3a and 4a. Nevertheless, previous research has consistently demonstrated the critical role of intrinsic motivation in substance abuse treatment across several studies (Bulut & Bozkurt, 2019; Cahill et al., 2003). For patients with SUD, abstaining from drug use may inherently enhance their intrinsic motivation, given that this is often a central treatment goal, as drug abuse commonly leads to relapse and unfavorable treatment outcomes in FPCs (Gideon & Sung, 2010). Consequently, intrinsic treatment motivation appears to play a more pivotal role at unconditional release for FPP with SUD, compared to those without.
Despite the lack of support for hypotheses 3a and 4a, the results emphasized the importance of intrinsic treatment motivation in forensic inpatient treatment upon admission (Bulut & Bozkurt, 2019; Cornelius et al., 2017). Hence it is crucial to consider the influence of intrinsic motivation on treatment outcomes and assessment (Drieschner & Boomsma, 2008), including its role in reducing recidivism (de Vries Robbé & Willis, 2017) and substance abuse (Bulut & Bozkurt, 2019). Our study also extends Spinath’s and Steinmayr’s (2008) findings, showing that motivation is a dynamic construct that changes over time. Considering intrinsic treatment motivation separately, aligns with the responsivity aspect of the RNR Model (Andrews & Bonta, 2006).
Clinical Implications, Limitations, and Future Research
The network approach used in this study complements traditional treatment methods that rely on the mere presence or absence of disorders and offers a more comprehensive diagnostic profile by identifying most influential risk and protective factors and their associations (Bogaerts et al., 2020). These findings also implicate that trajectories of change in clinical factors may vary across FPP, suggesting that personalized tailored treatment could be helpful, especially in high secured FPCs where violence rates decline substantially with the implementation of individualized patient care (Urheim et al., 2020). However, current findings should be interpreted considering some limitations. First, the sample sizes per group were not sufficient (Epskamp & Fried, 2018), and current results should therefore be interpreted with caution and seen as exploratory. Related to this, the stability of some of the estimated networks fell below satisfactory thresholds (<.50), meaning that we cannot conclusively determine whether the order of the most influential factors will remain the same after re-estimation (Epskamp & Fried, 2018). Second, the excessive levels of comorbidity among FPP may influence the distinction between patient groups solely based on SUD. Third, we only captured dynamic changes over two timepoints, which limits our understanding of the trajectories of change between these periods (Widiger & Trull, 2007). Fourth, inter-rater reliability of intrinsic treatment motivation was limited (Gwet, 2014) and not all ICC of the HKT-R met satisfactory thresholds (e.g., impulsivity, social skills).
Considering these limitations, future research should address larger sample sizes and more measurement points to obtain accurate information regarding the dynamic changes in clinical factors and intrinsic treatment motivation among FPP over time. We suggest the integration of network models with latent growth models to allow exploration of dynamic longitudinal changes within a network, while simultaneously capturing the growth trajectories of each clinical factor. Such an approach can provide a nuanced understanding of treatment targets, accommodating the unique needs of the patient (Jankovic et al., 2021).
Conclusions
This study provides important understanding of the interconnections and reciprocal influences among clinical factors and intrinsic treatment motivation over time for FPP with and without SUD. The findings extend existing research, furnishing evidence for somewhat distinct relationships among clinical factors, including intrinsic treatment motivation, within different patient groups. However potential restrictions (e.g., sample size, comorbidity, and stability issues) must be acknowledged. Overall, the use of network models holds the potential to yield important implications for more individualized treatment programs, providing insights into the developmental trajectories of clinical factors and could inform policy-making endeavors aimed at reducing criminal behavior.
Supplemental Material
sj-docx-1-cjb-10.1177_00938548241296491 – Supplemental material for Network Dynamics of Risk and Protective Factors in Forensic Psychiatric Patients: Exploring Substance Use Disorder and Treatment Motivation
Supplemental material, sj-docx-1-cjb-10.1177_00938548241296491 for Network Dynamics of Risk and Protective Factors in Forensic Psychiatric Patients: Exploring Substance Use Disorder and Treatment Motivation by Lotte Bant and Stefan Bogaerts in Criminal Justice and Behavior
Footnotes
Authors’ Note:
The authors declare no conflicts of interest related to this unfunded research. The data presented in this study is available for replication and verification of the findings. To request access, please submit a written inquiry to the first author.
Supplemental Material
References
Supplementary Material
Please find the following supplemental material available below.
For Open Access articles published under a Creative Commons License, all supplemental material carries the same license as the article it is associated with.
For non-Open Access articles published, all supplemental material carries a non-exclusive license, and permission requests for re-use of supplemental material or any part of supplemental material shall be sent directly to the copyright owner as specified in the copyright notice associated with the article.