
Abstract
The State of Oregon has operated an early prison release program called Short-Term Transitional Leave (STTL) since 1989. The program was designed to improve prison releasee reentry planning and reintegration in the community. In the last 10 years, Oregon expanded STTL several times, with individuals now being released up to 120 days early. We assessed whether differences in recidivism existed between STTL and those completing their planned sentence and if the length of their leave is associated with differential recidivism. We used propensity-score matching (PSM) to create quasi-experimental models. The results indicate no appreciable observed associations between STTL and rearrest, reconviction, or reincarceration. However, there were higher rates of technical violations among STTL participants, especially for those with the longest release time.
Shifting public sentiment and the fiscal challenges of maintaining the world’s highest incarceration rate are leading many U.S. states to explore new strategies for decarcerating. To be successful, these efforts must reduce the number of people being sent to prison and/or limit how long they stay there (Clear & Austin, 2009). Strategies addressing the former include prison diversion programs, revisions to mandatory sentencing laws, decriminalization or defelonization of drug offenses, and alternative responses to technical revocations among probationers. Clear (2021) argues that these “front-end” initiatives can be effective in the short term. Still, they yield diminishing returns over time as most people diverted from prison have relatively short sentences. Those with longer sentences, including people convicted of serious violent crimes, are rarely eligible for these initiatives. Hence, the potential value of concurrent efforts targeting the second factor: sentence length. Average and median sentences in the United States are longer than those found in most European nations (Kazemian, 2022), and there is limited evidence that we benefit from lower crime rates as a result (Pfaff, 2017). Nor have studies demonstrated a clear advantage of longer sentences when adults in custody (AICs) are eventually released to the community (Leymon et al., 2022; Loughran et al., 2009; Rhodes et al., 2018; Snodgrass et al., 2011; Weisburd et al., 2017). This has led some jurisdictions to investigate “back-end” policies for granting individuals early release from prison (Clear, 2021). The current study evaluates one such policy in the state of Oregon.
As part of the state’s Justice Reinvestment Initiative in 2013 (JRI, HB 3194), legislators significantly expanded Short-term Transitional Leave (STTL). This program allows eligible AICs to leave prison up to 90 days early to establish housing, employment, and social connections in the community. It is estimated that the STTL program saved Oregon 544,167 prison bed days from January 2014 through August 2019 (Criminal Justice Commission, 2020), amounting to a potential savings of more than 50 million dollars. The central question for the present research is whether these benefits come at a cost in the form of increased recidivism measured through rearrest, reconviction, reincarceration, and technical violations within 3 years of prison release. It should be noted that the Oregon Legislature increased the maximum STTL to 120 days in August 2017 via HB 3078. The AICs in the current study were ineligible for this extension, so the current focus is on the policy established in 2013.
Allowing individuals to leave prison early could reduce the deterrent value of prison, leading to higher rates of rearrest, reconviction, and reincarceration. Alternatively, extended periods of incarceration may have a harmful effect via severed family relations, disrupted housing, reduced employment opportunities, exposure to traumatic events, and increased association with deviant peers. Releasing individuals early might mitigate these harms and lead to lower recidivism rates. Finally, relatively small reductions in prison stays may have no bearing on recidivism. This study investigated these potential outcomes by comparing a large sample of persons granted STTL with a matched sample that did not participate in the program.
Early Release Programs
Compared with research on many other topics in corrections, we know relatively little about the impact of leaving prison early. The so-called “good-time” credits have been used for decades to incentivize positive behavior in prison, but rigorous research on these policies is lacking. A small number of studies have looked at the effect of leave in the context of establishing employment (i.e., work release) or reconnecting with family (i.e., home release). Cheliotis (2008) systematically reviewed the early literature in this field and concluded that these programs lead to small reductions in recidivism. Several methodological limitations qualify this assertion. First, most of these studies failed to account for other factors connected to program participation that might impact outcomes. In other words, individuals granted work or home release might have been at lower risk from the outset. Second, the available studies vary greatly with regard to the length of leave granted and the follow-up period for assessing recidivism. Third, some studies combined transitional leave with additional programming requirements (e.g., vocational training and drug treatment), raising questions about the independent effect of early release. Fourth, a few studies included temporary leave programs, where releasees must return to custody each night or on weekends. Finally, many of the studies reviewed (see Joo et al., 1995; Sims & O’Connell, 1985; K. A. Wright & Rosky, 2011) are comparatively old, reflecting criminal justice practices and community characteristics that may no longer apply.
Several more recent studies have addressed some but not all of these limitations. Weisburd and colleagues (2017) studied a program for low-risk individuals in Israel that combined work release with therapeutic interventions. They used propensity score modeling (PSM), a statistical procedure capable of balancing groups on numerous potentially confounding factors, to match 547 comparison subjects with 547 granted work release. Releasees in the latter group were significantly less likely to be rearrested over a 12-month follow-up. Of course, the results from a study of Israeli imprisonment should be viewed within their context that differs from the U.S.’s., with the most pronounced difference being the substantially shorter sentences in Israel.
Duwe (2015) used PSM to study a work release program for low-risk individuals in Minnesota. Participants were transferred to a local control facility (e.g., county jail, residential facility) and allowed to work or seek vocational training in the community. Additional supervision measures included random drug testing, and some participants were required to participate in counseling. The treatment group consisted of 1,785 persons granted work release and an equal number who served their planned sentence. Work release was associated with small reductions in rearrest, reconviction, and reincarceration. The opposite association was seen with technical violations: individuals granted a work release were significantly more likely to violate their release conditions.
Bales and colleagues (2016) similarly evaluated Florida’s work-release program. Participating AICs were housed in a release facility and allowed to work in the community. The researchers compared 27,463 individuals granted work release with 15,911 individuals who were eligible for the program but did not participate. People granted work release were less likely to be rearrested after 12 months and less likely to be reconvicted. Additional analyses showed that these differences persisted even after including statistical controls to account for preexisting differences between the two groups. No meaningful difference was observed in the 1-year reincarceration rate.
Forced Releases
A related area of research concerns early release from prison to address overcrowding. Sims and O’Connell (1985) studied 1,674 individuals released roughly six months early from prisons in Washington State in response to a court order. Compared with persons having a traditional release, those released early had nearly identical reincarceration rates after 1 year. Joo and colleagues (1995) conducted a similar study in Texas, where a federal court mandated early parole in response to prison overcrowding. Individuals released early were more likely to be reincarcerated after 12 months than a baseline cohort. J. Austin (1986) studied an early-release program in Illinois that sought to relieve overcrowding. The study involved a random sample of 752 individuals granted early leave and 338 individuals released prior to the implementation of the leave program (i.e., comparison group). A slightly smaller percentage of the former group was rearrested over the 12-month follow-up period.
In addition to generating inconsistent findings, all three of these forced-release studies have methodological problems that decrease our confidence in the findings. Specifically, these studies failed to adequately control for preexisting differences between those granted early release and those serving their planned sentence. Under ideal circumstances, the AICs would be randomly assigned to different groups to rule out competing explanations for the observed findings. An alternative strategy involves statistically controlling for possible differences between the treatment (i.e., early release) and comparison groups (i.e., normal release).
K. A. Wright and Rosky (2011) did the latter when they used PSM to control for possible differences between 434 low-risk individuals subject to a forced release in Montana and 434 serving their planned sentence. On average, the former group had 22 months shaved off their sentence. Recidivism was measured in two ways: (a) reincarceration for a new offense and (b) reincarceration for a new offense or technical violation. The early release and comparison groups were nearly identical on the first metric but differed significantly on the second. The authors attributed this finding to a backlash by probation officers overwhelmed by the sudden increase in their caseload.
Length of Stay Research
A third body of research that indirectly addresses the potential impact of early prison releases concerns the relationship between time served in prison (i.e., length of stay [LOS]) and recidivism following discharge. An early review of studies in this area found no convincing evidence for a relationship between LOS and recidivism (Nagin et al., 2009). Most of these studies failed to adequately control for selection bias, raising concerns about the validity of the findings. More recent studies use PSM, regression discontinuity, or natural experiments to compare reoffending rates across samples of prison releasees who served shorter or longer sentences. Most of these studies find that LOS has no consistent relationship with the likelihood of recidivating after accounting for criminal history, crime severity, and relevant demographics (Al Weswasi et al., 2022; Leymon et al., 2022; Loughran et al., 2009; Rhodes et al., 2018; Snodgrass et al., 2011; Wermink et al., 2018). Other studies suggest a more nuanced relationship between LOS and reoffending. For example, Mears and colleagues (2016) found a curvilinear relationship with sentences less than 2 years (i.e., increasing and decreasing recidivism) and no impact of LOS for sentences between 25 and 60 months. Meade and colleagues (2013) also found a curvilinear relationship in their study, with recidivism rising slightly as sentences increased from 1–12 months to 13–24 months and then decreasing incrementally with longer prison stays. Statistical testing revealed that the only significant difference in recidivism was for individuals serving more than 5 years. Finally, Rydberg and Clark (2016) found that longer periods of incarceration were associated with a higher likelihood of parole revocations and a lower likelihood of reincarceration for a new crime.
In summary, the currently available research suggests that an “early” release from prison, whether via a planned release to support reintegration, a forced release due to overcrowding, or a shorter initial sentence, probably has a negligible impact on reoffending. That said, the number of studies available to support this conclusion and the scope of this research remains limited. Policymakers considering early release as a strategy for decarcerating could benefit from additional scientific evidence. Of particular importance is the impact, if any, of small reductions in LOS across a broad range of persons. Similarly, studies are needed to assess the effect of shortened prison stays independent of mandatory participation in concurrent programming (e.g., temporary housing, vocational training, drug treatment, and counseling). Oregon’s STTL program provides an excellent opportunity to address these research needs.
Short-Term Transitional Leave in Oregon
STTL has existed in Oregon since 1989. The program was designed to improve reentry planning and reintegration in the community following an individual’s release from prison. Under the original policy, AICs were responsible for requesting leave and developing a release plan. If approved, they were released up to 30 days early and supervised by the county’s community corrections agency. Violation of release conditions could result in a range of sanctions, including a return to prison for the duration of the original sentence. Whether by design, a lack of interest, or limited awareness of the program, relatively few individuals participated under this version of STTL. Between 2011 and 2013, only 15.6 persons were released early per month. This amounted to only 4.1% of all releases.
With the passage of HB 3194 in 2013, the amount of STTL available increased from 30 days to 90 days. The state legislature also mandated a change in the administration of the policy. The Department of Corrections (DOC) is required to actively identify those eligible for the program and assist them in preparing a transition plan that addresses housing, employment, and re-establishing family connections. 1 The receiving county’s community corrections agency must approve the release plan and coordinate implementation efforts with the DOC. The number of persons released under the revised STTL policy increased substantially, from 97.3 per month in 2014 (23.8% of all releases) to 113.7 per month in 2017 (28.6%).
Another consideration is that some are ineligible for STTL due to statutory restrictions or DOC administrative rules. Regarding the former, the policy stipulates that an individual must serve at least 6 months in prison before being eligible for STTL. Moreover, certain index convictions are excluded from consideration (e.g., Murder I or II, Manslaughter I, Assault I, Kidnapping I, Rape I, Burglary I, Robbery I, and Arson I). 2 With regard to the DOC’s rules, as of 2017, individuals can only participate if they are classified as minimum custody, they had not failed a transitional leave during their current or preceding custody, they had no serious institutional misconducts in the prior 15 months, they committed no new crimes during their current incarceration, they had some form of housing available in their release county, and their sentencing judgment did not disallow an early release.
Current Study
Our first objective was to assess whether there are differences in recidivism between individuals receiving STTL and those completing their original sentence (RQ1). More specifically, we use PSM and marginal means weighting to compare recidivism outcomes for individuals (n = 4,898) granted STTL in Oregon between 2011 and 2017 versus a matched sample (n = 4,898) that did not participate in the program (non-STTL). Based on the extant literature, we hypothesize that being released early will have no appreciable connection to recidivism as measured through re-arrest, re-conviction, and re-incarceration for a new crime. We expect slightly higher rates for the STTL group regarding technical violations. This hypothesis results from prior research suggesting that community corrections officers subject early releasees to additional scrutiny and/or apply a different threshold when issuing violations (e.g., Duwe, 2015; K. A. Wright & Rosky, 2011). Our second research question (RQ2) is exploratory and concerns the relationship between the length of STTL granted and release outcomes. Individuals granted roughly 30 days of early release are compared to those granted approximately 90 days to determine whether there is a relationship between the “dose” of STTL and recidivism.
Method
Sample
The initial sample (N = 32,825) represents all people released from an Oregon prison between January 1, 2011, and December 31, 2017. 3 From this initial pool, we removed 292 (.9%) cases where the persons died before completing a 3-year follow-up in the community. Another 448 cases (1.4%) were removed due to significant missing data. A larger number of cases were removed if the individual was statutorily ineligible for STTL, including 3,006 cases (9.2%) of participants in the early-release drug program, 3,983 (12.1%) cases serving time on a mandatory minimum sentence, 641 (2.0%) with recent institutional violence or non-compliance, and 534 cases (1.6%) because the current security level was above the minimum threshold. Thus, our final sample included 23,921, 72.9% of the original pool, released to the community during the study period. The majority of the sample were men (87.0%), and White (75.5%), Latinx (11.0%), and Black/African-Americans (9.2%) accounted for the largest racial-ethnic groups. The average age at the time of release was 36.5 (SD = 11.2) and ranged from 16 to 87 years old.
A total of 5,347 cases from this subsample (22.4%) were released early under the STTL policy. The average number of transitional leave days granted was 68.2 (SD = 31.9), an average sentence reduction of 16.1%. Given the legislative and administrative changes made to the STTL policy over time and the potential for these changes to impact case outcomes, we opted to group the releasees into five temporal cohorts (see Schmidt et al., 2020). As indicated earlier, the proportion of prison releasees granted STTL increased significantly over time. Cohort #1 (C1), between Jan 2011; to Nov 2013 represents the first iteration of STTL in Oregon. Cohort #2 (C2), December 2013 to October 2014, represents the implementation of Oregon’s Justice Reinvestment Program. The three remaining temporal cohorts (C2 = Nov 2014; to Oct 2015 C4 = Nov 2015; to Oct 2016 and C5 = Nov 2016; to Dec 2017) represent the yearly alterations of the program as part of an annual review.
Measures
Treatment Variables
The primary independent variable for research question one is whether the individual was released early (i.e., STTL) or not (i.e., non-STTL). For Research Question 2, the association of STTL length and recidivism, we created groups based on the number of STTL days granted. The actual amount of leave awarded varies from the stated policy of 30 or 90 days depending on how much time the AIC has remaining on their sentence, the receiving county’s readiness to provide post-prison supervision, the completion of other treatment plans, and other smaller considerations. This includes less than 20 days (n = 121; 2.3%), 20 to 40 days (n = 1,644; 30.7%), 41 to 79 days (n = 411, 7.7%), 80 to 100 days (n = 3,069; 57.4%), and 101 or more days (n = 102; 1.9%). Given the uneven distribution of cases, we restricted our analysis to just the two largest groups: 20 to 40 days (M = 29.3 days; SD = 2.2) and 80 to 100 (M = 89.1; SD = 1.8). These two groups were compared to one another and the non-STTL cases.
Outcome Measures
Law enforcement records were used to document whether the releasees were re-arrested in Oregon for a new crime within 3 years of their release from prison (yes/no). Similarly, the state’s Circuit Court data system and DOC records were used to code whether the individuals were convicted of a new crime (yes/no) or reincarcerated in a state facility for a felony offense (yes/no) within 3 years of their index prison release. Finally, we used DOC records to create a dichotomous variable indicating whether they experienced any technical violations for the current custody cycle over the 3-year follow-up period.
Matching and Control Variables
We used 117 distinct variables in the PSM procedures detailed below to create equivalent groups for our two research questions. Some of these items were also used as post-matching control variables in a double-robust procedure (Stuart, 2010). Given the many factors involved, the description of the measures used is limited to a brief summary. Full details (supplemental Material, available in the online version of this article) are available from the first author upon request.
Several demographic characteristics were coded for case in the sample, including their age at release (in years), sex (male = 1, female = 0), race/ethnicity (White = 0, Black = 1, and Hispanic = 2, Other = 3), and region of the state where the individual was released (Central Eastern, Metro, Northwest Coastal, and Southwest). In addition to documenting each releasee’s most serious index offense (e.g., type, the severity on the state’s sentencing grid), we created offense categories (e.g., assault, drug possession, robbery, and weapon offenses). We also captured a count of concurrent convictions in each group, rolled up to accompany the most serious index offense.
Several aspects of the current incarceration were recorded, including the number of months spent in prison (i.e., length of stay), the number of disciplinary reports issued (e.g., major nonviolent, major violent, and minor), and time spent in segregation units. The number of distinct visitors the AIC had was also counted, along with the number of visits received per month across quartiles of their sentence. Next, we recorded whether the individual had been on community release and revoked immediately prior to their index incarceration. We counted their prior revocations and how many prior prison admissions they had.
Several aspects of criminal history were measured, including their age at first arrest in Oregon (in years), the number of arrests per year (e.g., 1 year ago, 2 years ago, etc.), and the count of arrests per crime category. The latter was used to create a criminal diversity score, ranging from 0 to 15, representing the categories with at least one prior arrest in Oregon. Court records were used to document how many prior misdemeanor and felony convictions the individual had in Oregon and the number per crime category. Most offense category scores for arrests and convictions were collapsed (e.g., 0, 1, and 2 or more), with zero as the referent group in analyses. It is important to note that the DOC uses a validated actuarial risk tool, the Public Safety Checklist (PSC), to assess the risk of reoffending. The checklist uses demographic (e.g., current age, sex) and static factors (e.g., number of person arrests, number of property arrests, and ever violated probation/parole) obtained from the DOC databases and state arrest records. We accounted for the PSC and its importance in deciphering supervision contacts using each PSC factor in the matching procedures detailed below.
The Level of Service Case Management Inventory (LS/CMI) measured the criminogenic needs. The measure is scored by probation officers or reentry counselors prior to or shortly after release and yields scores across eight domains (e.g., antisocial attitudes, alcohol/drug problems, education/employment; Andrews et al., 2004; Dyck et al., 2018). Oregon DOC protocol dictates that low and low-moderate static risk level cases on the PSC are not given the LS/CMI to save time and ensure those with the highest risk and needs receive the most focused case plans. Consequently, 12.1% of our sample was missing LS/CMI scores. 4 Due to Oregon DOC’s focus on high and very high scores, the variation in the scores was limited, and thus, we measured LS/CMI through their severity rankings. In addition, the classifications dictate how individuals are treated on supervision per the RNR model.
Propensity Score Modeling
Although a randomized controlled trial (RCT) is considered the “gold standard” in evaluation research, it is not feasible in many criminal justice settings due to ethical, legal, or practical considerations. Accordingly, we rely on the increasingly popular technique of propensity score modeling (PSM) to reduce bias between the primary treatment (STTL) and comparison (no-STTL) groups and between the 20 to 40 and 80 to 100 day STTL subgroups. Studies in criminal justice settings find that PSM reliably replicates the results generated in RCTs (see C. M. Campbell & Labrecque, 2022). The current study used two related but different PSM applications to address the two main research questions.
Research Question 1
As might be expected, we found notable differences between the STTL and non-STTL groups before applying PSM (see Pre-PSM columns in Table 1). For example, the STTL group was disproportionately female, White, and older. Likewise, the STTL group had a lower proportion of individuals who committed a person crime as their most serious index (i.e., current) offense. They were significantly less likely to have evidenced behavioral problems during their incarceration. Finally, on average, the STTL group spent about 7 months less in prison.
Differences Between STTL and Non-STTL Cases Pre and Post-Statistical Matching
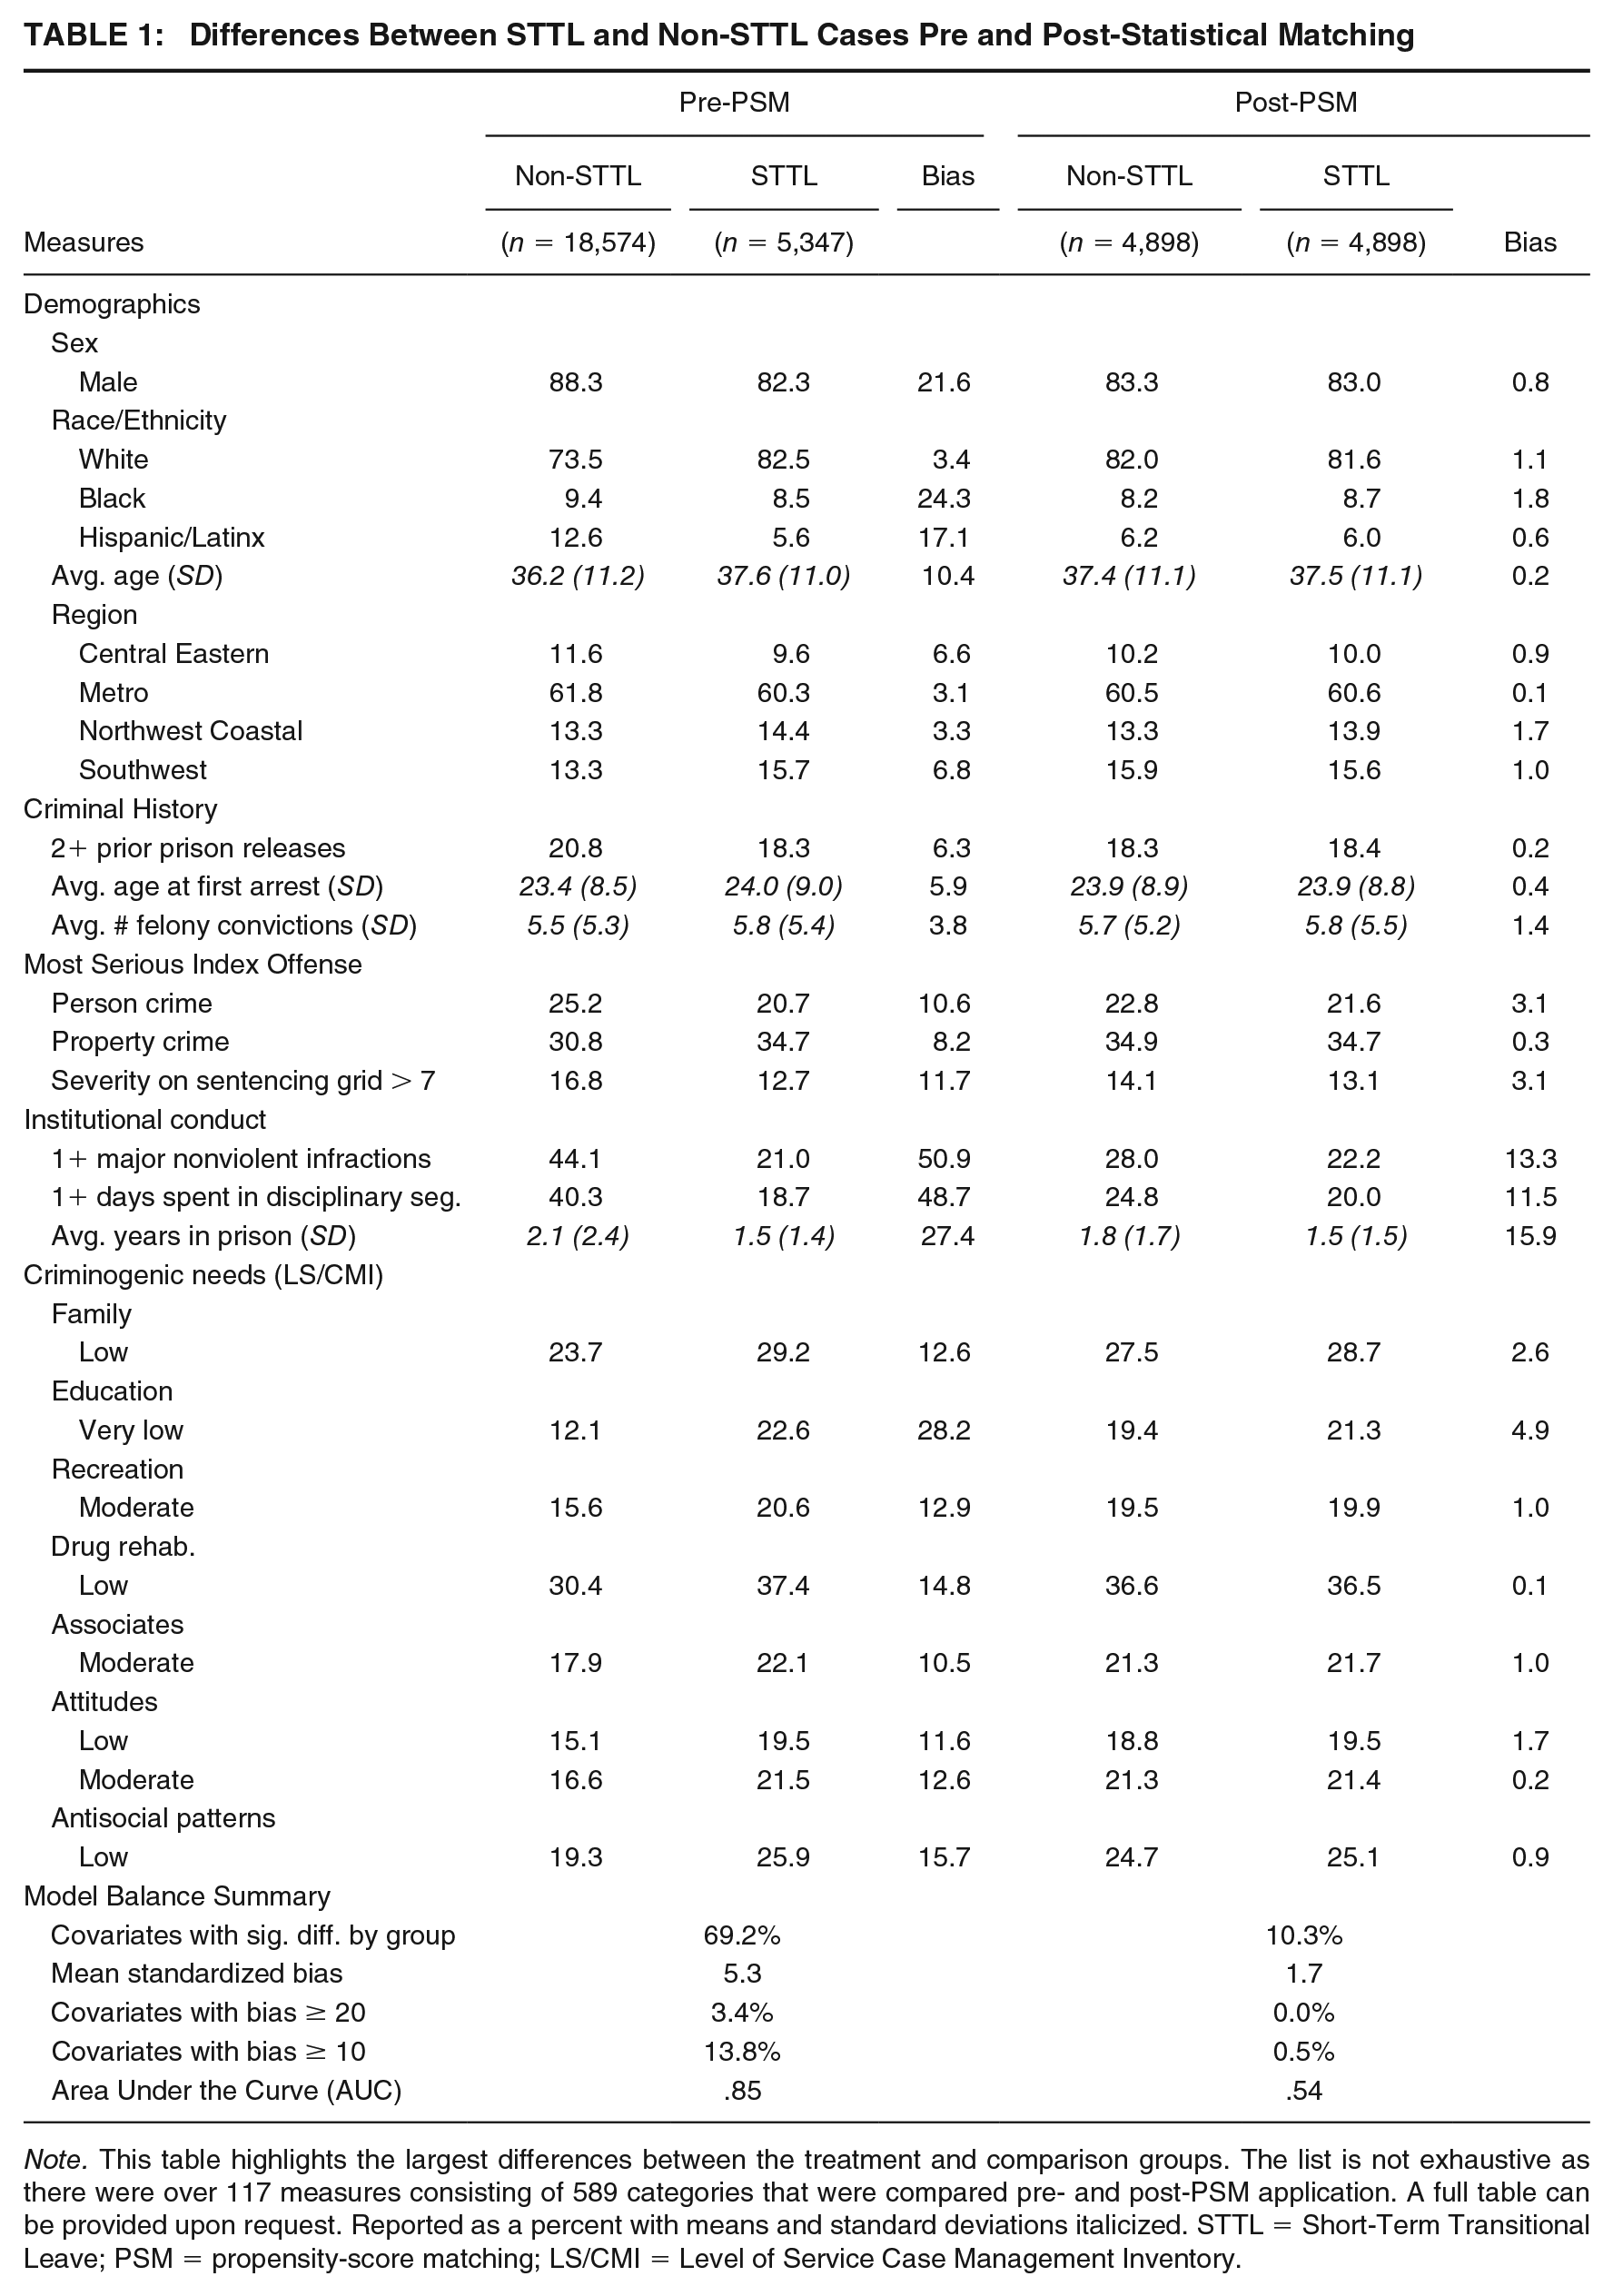
Note. This table highlights the largest differences between the treatment and comparison groups. The list is not exhaustive as there were over 117 measures consisting of 589 categories that were compared pre- and post-PSM application. A full table can be provided upon request. Reported as a percent with means and standard deviations italicized. STTL = Short-Term Transitional Leave; PSM = propensity-score matching; LS/CMI = Level of Service Case Management Inventory.
To address these differences between the STTL and non-STTL groups, we employed a one-to-one greedy match with a caliper 5 within each of the five temporal release cohorts. These temporal cohorts attempt to capture the changes and usage of Oregon’s STTL program over time. The propensity score was conditioned using a binary logistic regression, including 117 measures and 588 subcategories based on the individual’s demographics, criminal history, index offense, institutional behavior, and LS/CMI need domains.
The rightmost columns in Table 1 document the outcomes of this matching procedure. First, it is important to note the difference in sample size between pre and post-PSM samples. In one-to-one matching, cases on either side that do not have a match are dropped from the analysis. This resulted in a reduction of 449 cases (8.4%) from the STTL group and 13,676 cases (73.6%) from the non-STTL group, leaving us with 4,898 cases in each group. 6
Table 1 also provides the balance metrics used to assess the overall performance of the match. 7 When assessing the performance of a PSM technique to remove the selection bias between groups, it is important to ensure that multiple balance metrics are checked while recognizing that no single metric provides an omnibus performance test. We follow metrics offered and used in prior literature (P. C. Austin, 2009; C. M. Campbell & Labrecque, 2022; Hamilton et al., 2016) which include 1) significance testing, 2) standardized percent bias, and 3) the Area Under the Curve statistic (AUC). 8 Considering the totality of the evidence across all the metrics examined, it suggests a successful match overall. Each of the three metrics listed is discussed below in more detail.
Although statistical significance testing (a) is generally a poor way of assessing a model’s performance as it depends on sample size, it is a common practice in PSM spanning multiple disciplines. With the general aim of PSM to simulate an RCT, the focus for this metric is to reduce the percentage of covariates statistically significant to the level observed in an RCT, which is 5% or less. Although our PSM technique did not achieve this, it was remarkably close, especially considering the biased (pre-PSM) sample possessed significant differences across 69% of the 117 covariates.
One of the most important metrics in gauging the performance of a propensity score method is the standardized percent bias (b) which shows the degree to which the two groups differed on a given measure and/or category (Campbell et al., 2009; Rosenbaum & Rubin, 1985). Generally, the higher the percent bias, the greater difference exists between the groups on an observed measure. If the percentage bias is more than 20%, the groups are expected to harbor too much bias to be compared directly (i.e., without statistical adjustment). The closer to zero the percent bias is, the more similar the groups are. If PSM is successful, it should reduce the percent bias for every measure and category examined to below 20% at the very least and ideally below 10% (for more on the formulas for these metrics, see P. C. Austin, 2009, 2011; C. M. Campbell & Labrecque, 2022). We examined the standardized bias in multiple ways: The overall mean standardized bias, the percent of covariates with bias greater than or equal to 20, and the percentage of covariates with bias greater than or equal to 10. Across the standardized percent bias metrics, particularly the mean, are below 10%, suggesting a remarkable similarity between the groups following the application of PSM.
Finally, the (c) AUC metric is one used to capture the sensitivity and specificity of the scale used to predict a binary outcome. Ideally, before PSM is applied, the propensity score should strongly predict the treatment (i.e., greater than .71, see Rice & Harris, 2005). After PSM is applied, the propensity score should not be able to distinguish the treatment from comparison groups (i.e., an AUC value near .50). We achieved this as shown in Table 1, with the propensity score yielding an AUC of .845 before PSM and .536 after.
Research Question 2
We employed a PSM approach known as marginal means weighting through stratification (MMW-S; Hong, 2010, 2012) to assess the association between the “dosage” or length of STTL received and recidivism. This approach has advantages over other PSM approaches. It is designed to assess ordinal treatment categories. It devises a statistical weight to all cases, removing most, if not all, differences across the doses of how early adults in custody were released from their initial planned release date. As noted earlier, we compared outcomes for two STTL groups, 20 to 40 days and 80 to 100 days, with outcomes for the non-STTL group.
When assessing the performance of the PSM technique for ordinal treatments, there are not as many balance metric tools available as there are for binary treatments. Table 2 provides a breakdown of the available balancing metrics used to determine how well our MMW-S approach reduced the bias and balance of the dosage categories. The metrics included a one-way analysis of variance to examine the propensity score distribution across the dosage categories. Ideally, post-PSM, the F-statistic should be close to or less than 1.0 and not significant, and the percent of covariates significantly predicting the dosage category in an unweighted versus weighted ordinal logistic regression should be near or less than 5%. The AUC should be near .50. The totality of the metrics suggests a successful balance in this analysis, which allows us to draw cautious conclusions about the unbiased effects of dosage categories.
Balance Metrics of Pre- and Post-PSM
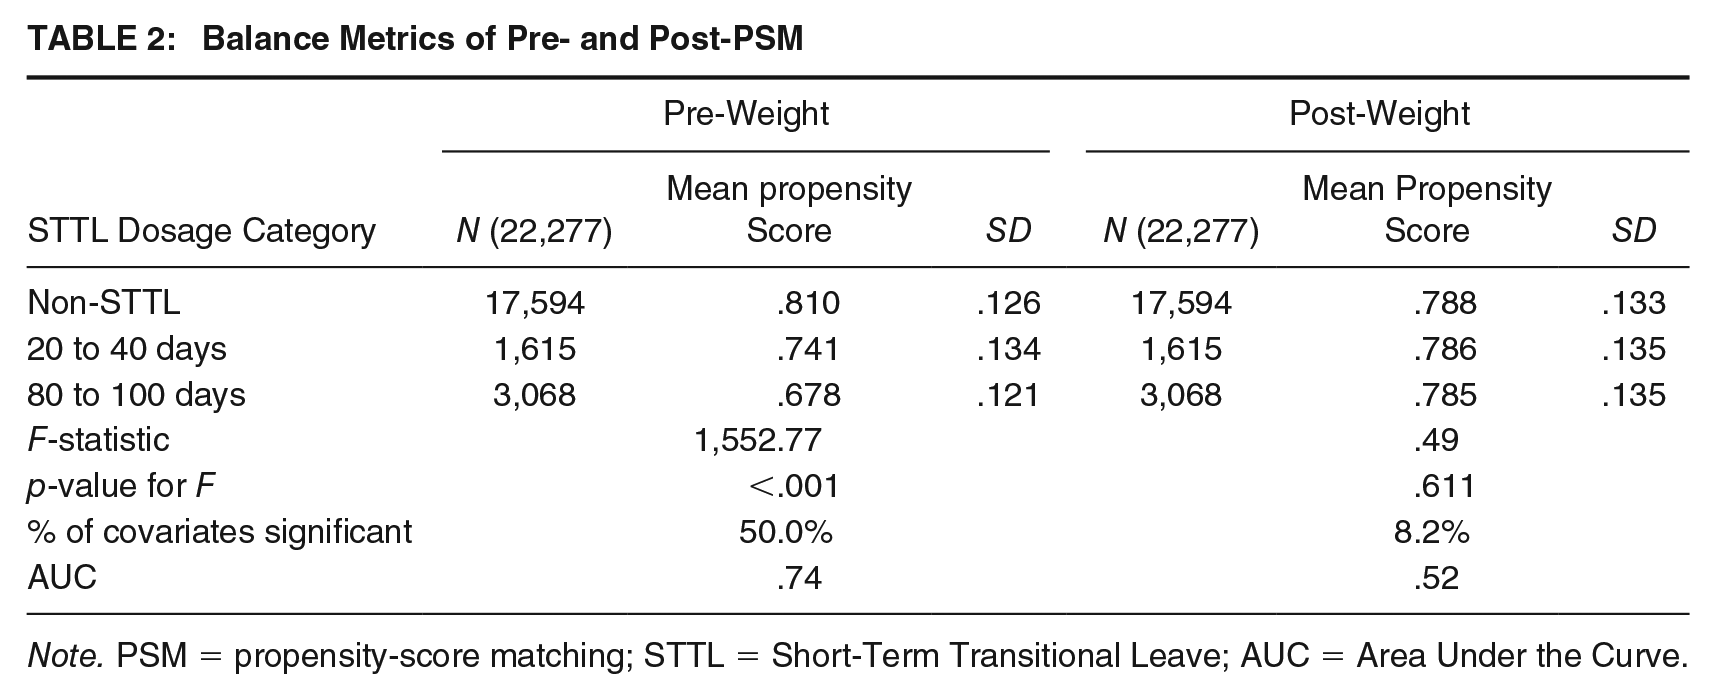
Note. PSM = propensity-score matching; STTL = Short-Term Transitional Leave; AUC = Area Under the Curve.
Analytical Approach
After applying the PSM techniques discussed earlier, we compare the recidivism outcomes of those who received STTL, and different dosages of STTL, with those who did not. Although considerably more accurate than naive, unbalanced testing, analyzing outcomes via bivariate tests can also be problematic with PSM due to hidden confounds. Recent research has identified the importance of controlling for additional confounding effects after the treatment is applied in what is known as a double-robust approach (Stuart, 2010). Research Question 1 involved post-PSM binary logistic regressions to obtain the predicted probability of STTL on recidivism. Research Question 2 involved a post-PSM weighted logistic regression where the marginal means weight is applied as a sampling weight.
We also conducted a sensitivity analysis to test the fragility of the findings to hidden bias for Research Question 1. It assesses the ability of an unmeasured factor to change the results by predicting if the treatment assignment is better than a propensity score conditioning model (Rosenbaum, 2002, 2005). For the second research question, we reported point estimates (i.e., dosages) for no STTL, 20 to 40 days, and 80 to 100 days via Stata’s margins command with all control variables set to their mean that represent the predicted recidivism rate for each of the STTL dosages. We then generated 95% confidence intervals (represented by the whiskers) around no STTL that served as a baseline. We also generated 95% confidence intervals for both STTL dosages. A model was determined to have a significant effect (either increased or decreased recidivism) if STTL “dosages” intervals were not overlapping the baseline.
Results
To What Degree Does STTL Influence the Odds of Recidivism?
Table 3 presents the key results of the double robust assessing RQ1, binary logistic regressions predicting recidivism events using the matched groups generated with PSM. 9 First, we should note that outcomes for the STTL and non-STTL groups were nearly identical across three of the four recidivism metrics, with rearrest at 50.6% vs. 49.0 (χ2 [1, n = 9,796] = 2.61, p = .11), reconviction at 40.7% vs. 40.0% (χ2 [1, n = 9,796] = .49, p = .48), and reincarceration at 20.8% vs. 20.1% (χ2 [1, n = 9,796] = .86, p = .35). By contrast, the difference in post-release supervision violations was statistically significant at 27.5% vs. 22.7% (χ2 [1, n = 9,796] = 29.76, p < .001), a relative difference that is 21.1% higher (27.5%/22.7%) for the STTL group.
Double Robust Regressions Predicting Recidivism Events Within Three Years of Release
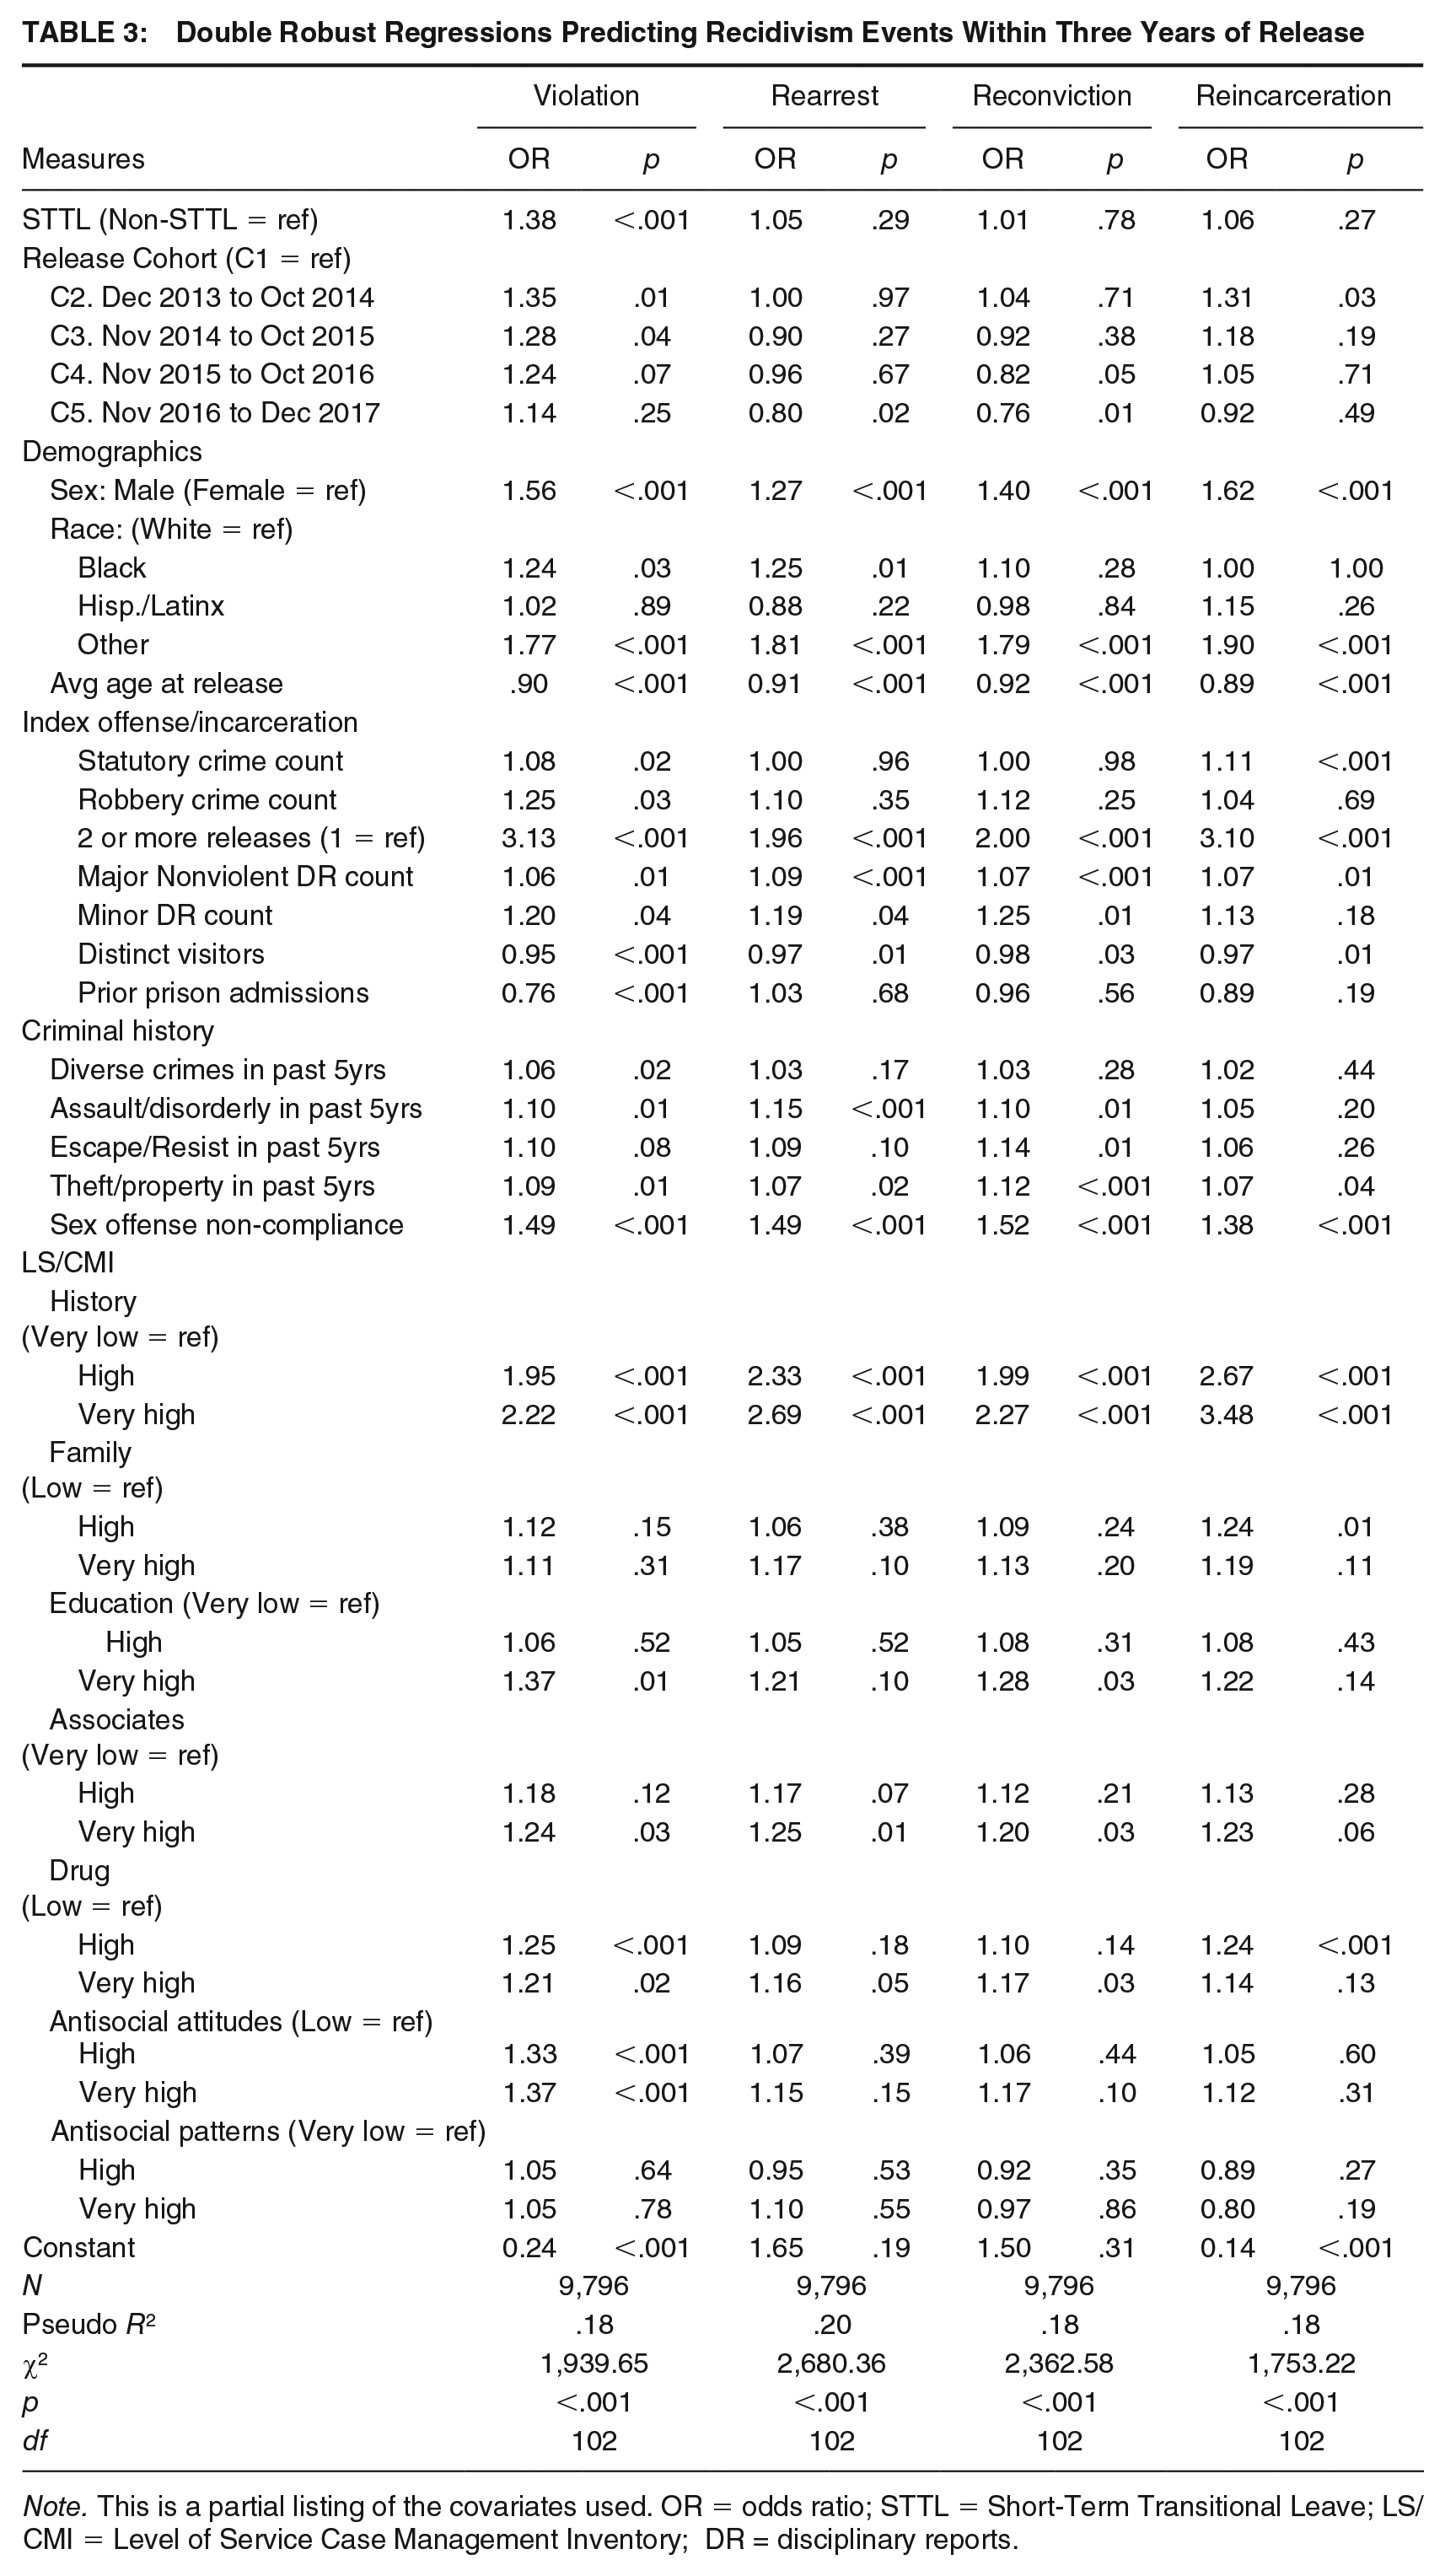
Note. This is a partial listing of the covariates used. OR = odds ratio; STTL = Short-Term Transitional Leave; LS/CMI = Level of Service Case Management Inventory; DR = disciplinary reports.
The regressions suggest that early prison release is unlikely to impact recidivism as measured through rearrest, reconviction, and reincarceration. 10 Conversely, in the model predicting technical violations, STTL was a factor. After controlling for other measures, we find that an otherwise average case that experienced STTL still has 38% greater odds of violating the conditions of their supervision than those in the non-STTL group.
Sensitivity analyses suggest that these findings are relatively robust for technical violations and rearrest but less for reconviction and reincarceration. Specifically, an unobserved measure would need to improve the prediction of treatment assignment by 20% for violations (Γ=1.20) and 15% for rearrest (Γ=1.15) to change the result. In contrast, an unobserved measure would need to improve reconviction by just 5% (Γ=1.05) and 4% for reincarceration (Γ=1.04). This suggests that the reconviction and reincarceration models should be interpreted with a greater degree of caution.
Finally, given that we found differences in recidivism across some temporal release cohorts (see Table 3), we explored the possibility of interactions across cohorts and recidivism outcomes. No interactions were detected except for technical violations. Figure 1 provides the probability of violations for the average person on STTL and non-STTL in each temporal cohort with 95% confidence intervals. While technical violations were higher in the STTL group across all five temporal cohorts, the differences in violations over the first three time periods were not significant. Only for Cohorts 4 and 5 did the STTL group have a significantly higher probability of a technical violation.
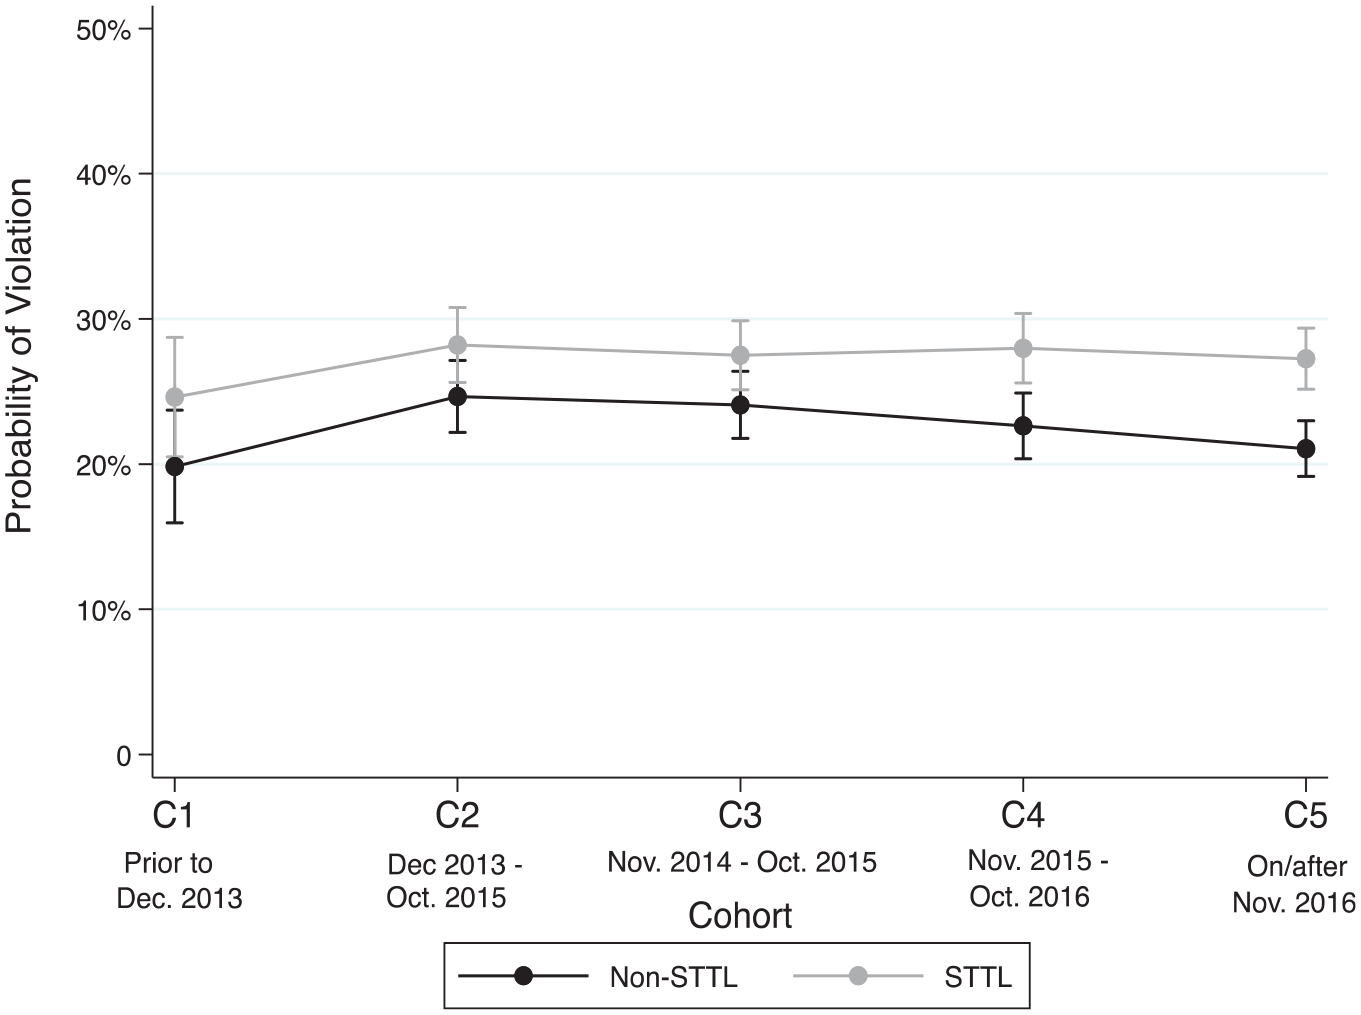
Predicted Probability of a Technical Violation Event by STTL Status and Cohort
Does the Length of Transitional Leave Granted Affect Recidivism?
Figure 2 provides the marginal probabilities for each recidivism outcome generated from the binary logistic regressions weighted by the marginal means procedure. Each bar represents the average probability of recidivism at each STTL dosage (i.e., 0 vs. 20-40 vs. 80-100). Reference lines are provided at the lower and upper confidence interval of the “No STTL” category as the baseline of each outcome. STTL “dosages” are deemed to be significantly different from this baseline if the confidence intervals no longer overlap with the reference lines.
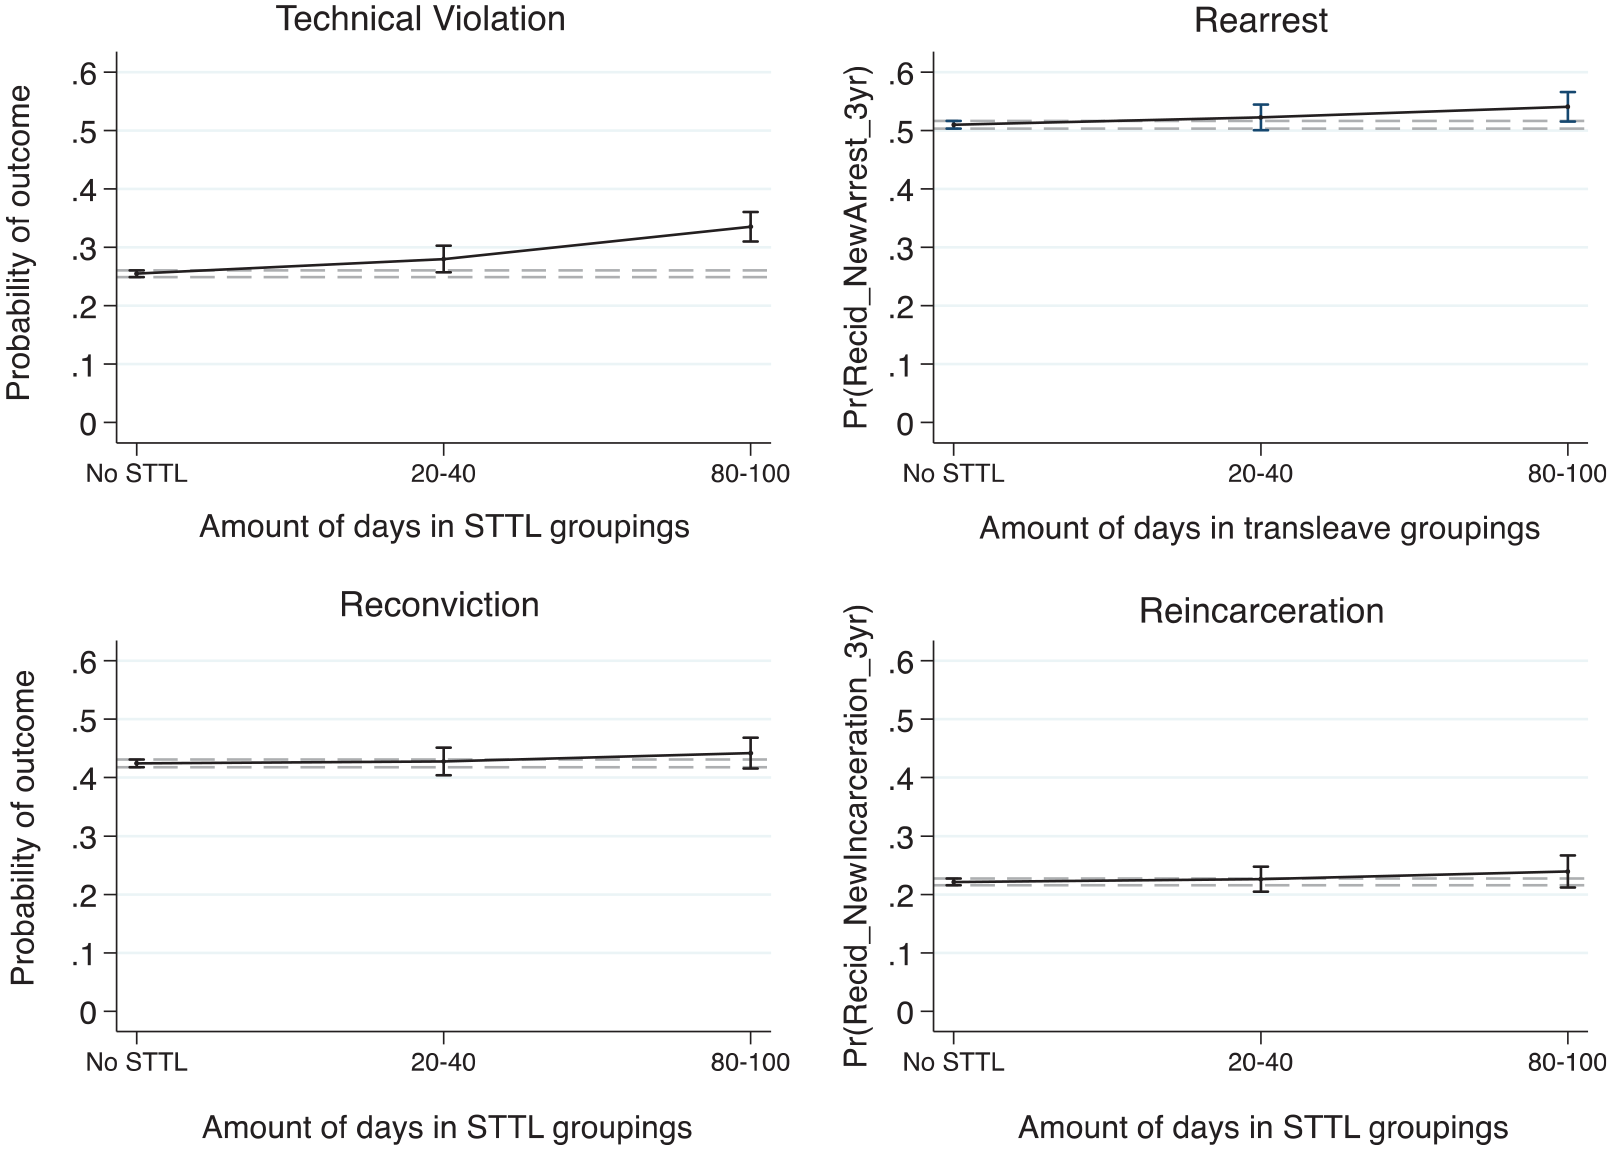
Probability of Each Outcome by STTL-Dosage Group
The only significant effect of our dosage variable was seen with technical violations. The violation graph shows that the non-STTL group (e.g., the baseline) has a 25.5% average chance of committing a technical violation while on supervision. Although the probability of a technical violation increases to 27.9% when someone is released 20 to 40 days early, it is not significantly different from the baseline. It is not until people are released up to and beyond 80 to 100 days early that there is a significant increase (33.4%). Considering the differential rates noted earlier, it is important to interpret the four measures of recidivism together, as it provides a more complete picture of post-prison supervision for someone released on STTL. The fact that the probability of violations increases, unlike that of rearrest, reconviction, and reincarceration, suggests that people are violating the terms of their supervision and are not necessarily committing new crimes.
Discussion
Oregon statutes explicitly define public safety through three of the four measures in our study—rearrest, reconviction, and reincarceration. While not an official state measure of public safety, we also included a measure of technical violations. As the findings note, the STTL program in Oregon does not appreciably increase recidivism for rearrest, reconviction, and reincarceration and thus does not appreciably reduce reoffending. While STTL does not have a higher rate of failure compared to similar non-STTL cases, half (51.2% of STTL and 51.7% of non-STTL) were rearrested, and nearly half of both groups (41.4% of STTL and 43.2% of non-STTL cases) were reconvicted within 3 years of release, indicating high recidivism rates among all adults leaving prison, regardless of whether they participated in STTL. Thus, the results indicate that STTL does not reduce public safety as measured through Oregon’s official measures of recidivism; it does not improve it either, as rearrest and reincarceration remain high. Of course, the concept of public safety is not completely captured by this study’s four outcome measures; they represent vital criminal justice measures. Further research might want to consider how other measures of justice outcome, such as quality-of-life measures or victim satisfaction, and other conceptualizations of public safety might be affected by STTL.
STTL and Technical Violations
With Oregon’s continued use of STTL, which included increasing the maximum to 120 days in August 2017 via HB 3078, there are important considerations. The analysis indicates that technical violation rates increased as the STTL time got longer. This finding should be viewed with some important considerations. First, both reconviction and reincarceration are not increasing, suggesting increased violations are more of a function of lower level offenses or status-related (i.e., noncriminal technical violations only) reasons. Even when someone commits a new crime, it does not result in prison time at any higher rate than non-STTL individuals.
Second, we should carefully consider the potential for “backdoor sentencing,” which occurs when someone commits a new crime while on probation or parole. Instead of being adjudicated, the state uses a “must obey all laws” violation standard with a lower burden of proof to send them back to prison (Lin et al., 2010; Tonry & Lynch, 1996). Unfortunately, we were not able to examine this potential effect. Future research should focus on the potential of backdoor sentencing.
Third, Oregon’s expansion of STTL in 2013 placed the program within a JRI framework. For example, one of JRI’s goals included “spending resources more effectively with the goals of reducing recidivism, decreasing prison use, protecting the public, and holding offenders accountable (Oregon Criminal Justice Commission, 2019).” What is clear here is that STTL does indeed reduce costs by shortening prison stays by as much as 120 days under the most recent 2017 expansion. The DOC estimates it costs them $116 a day per adult in custody. Thus, a 120-day STTL release saves as much as $13,920 (actual savings in practice would be due to certain fixed costs that would not decrease). With reincarceration not being higher among STTL participants, the savings are fully realized because they are not offset by future higher imprisonment. 11 Increased violations may result in individuals being sent back to prison, and therefore total savings are reduced, but it is likely not enough to offset substantial savings from STTL (Tonry & Lynch, 1996).
Fourth, there are several other possible reasons why the STTL group has a higher rate of technical violations. It is not uncommon to find those placed on STTL subject to more intense forms of supervision (e.g., intensive supervision programs) requiring more check-ins and home visits. Such supervision has long been shown to yield more technical violations (Bouchard & Wong, 2018; Clear & Latessa, 1993; Grattet & Lin, 2016; Lowenkamp et al., 2010; Morash et al., 2019; Petersilia, 1999), largely due to “supervision effects,” which suggests that noncriminal behavior exists for all populations but is found under more scrutinized conditions (Clear & Latessa, 1993). Moreover, it is noteworthy that the rise in technical violations coincided with the expansion of STTL in cohorts 4 and 5 following the first full year of implementing JRI funds. Many counties used JRI funds to increase post-prison supervision capacity, specifically to account for more STTL releases. With more officers assigned to post-prison supervision generally and STTL cases specifically with intensive supervision, there is a higher likelihood of detecting violating behavior and the potential for scrutiny of STTL participants to increase (Matsuda et al., 2022). The overall impact of violation rates is difficult to disentangle (Bosker & Witteman, 2016) and remains an area for future research. It is also important to note that, regardless of supervision effects, increased technical violations have little to no relationship with recidivism. They are predominately noncriminal events and are often erroneously assumed to be proxies for new criminal activity when research suggests that it is most likely not (C. M. Campbell, 2016, 2017).
Fifth, our analysis indicates that recidivism remains high among both STTL and non-STTL individuals. The program’s purpose is not to reduce recidivism per se. While STTL does not appreciably worsen reoffending by increasing recidivism, it also does not improve it. To do so would require a more robust effort targeting causes and correlates of crime (e.g., more targeted programming in the community focused on reducing criminogenic needs). Without a notable increase in recidivism, our findings contrast other studies that found potential for a “punishment effect” (B. R. E. Wright et al., 2004; K. A. Wright & Rosky, 2011). That is, the release came too early for some who needed more time in prison to avoid future offending. However, considering that prior studies included technical violations in their measure of reincarceration (e.g., K. A. Wright & Rosky, 2011), it is possible that our findings may be quite similar.
STTL and Criminogenic Needs
The STTL group had a larger proportion of low- and moderate-needs individuals according to the criminogenic needs assessed by the LS/CMI risk tool. Criminogenic needs domains (e.g., family, antisocial associates, or drug use) are considered dynamic risk factors and can be reduced, along with the probability of recidivism, using the appropriate intervention. According to research on risk and needs, if gone unaddressed by targeted treatment efforts, those with higher needs will often struggle more with reentry than those with lower needs (e.g., Andrews et al., 2006; Bonta & Andrews, 2016; Bosker & Witteman, 2016). Our findings show that those released on STTL with lower risk and lower needs recidivated at the same rate as the higher risk and higher need non-STTL group. It appears that very few criminogenic needs for either group are being met. It raises a concern that effective rehabilitative program coverage does not meet the needs of both populations. Future Oregon research should involve a gap analysis to examine the degree to which programming can best address existing criminogenic needs.
Missing Information and Limitations
While our analysis includes a robust model of dynamic risk factors, criminogenic needs, and criminal history, our models are missing any measures of crimes committed during a person’s youth. In addition, the 448 cases removed from the initial sample were found not to be missing completely at random, albeit with no discernable pattern we could identify. This missing criminal history and had the omitted cases been complete and included would likely be informative and improve our models’ overall fit and accuracy. That said, we do not expect that either of these issues would substantially change the central findings of our study. In our effort to investigate the 448 cases with substantial missing data, we find that if we assume that all of these cases would have made it into the matched set (i.e., fell within common support of the propensity scores), these would have added another 29 cases that had some metric of recidivism for the 4,898 matched cases and 47 cases without a recidivism event; unlikely to impact the study’s findings. Another important limitation is that Oregon’s most recent expansion of STTL to 120 days could not be captured in our analysis as the law was not on the books long enough, and we had too few individuals afforded a 120-day release.
In addition, there are factors that we could not account for that may play a role in how STTL can influence recidivism, on which there was limited or no data. One factor is on the expansion of STTL that came just before the onset of the COVID-19 global pandemic, which greatly impacted all aspects of the criminal justice system. At the time of this analysis, it is difficult to account for the pandemic’s impact and how it might influence research findings. Therefore, while Oregon officially expanded STTL to 120, we could not assess if these longer releases have appreciable differences and how those differences intersect with changes resulting from COVID-19. Another factor is rehabilitative programming and transition planning information. Rehabilitation programming has been a perpetually problematic area of data collection for the DOC, largely because the programming tasks are contracted out to third parties, which keep performance and completion data beyond written case planning notes. Similarly, transition planning information is not kept in a way that is available for quantitative analysis. Despite this data being unavailable, the analysis provided here still provides meaningful comparisons thanks largely to the sample size and the degree of balance achieved in the matched and weighted groups. These strengths increase the likelihood that programming heterogeneity would be largely similar between the treatment and comparison groups.
Conclusion and Policy Recommendations
The analysis indicates that releasing adults from incarceration sooner than their prescribed sentence has generally been successful in Oregon. Despite the state’s expansion of early release over time, effectively reducing the prison population, STTL appears to have a low overall impact on recidivism, neither increasing nor decreasing it, and no appreciable impact on rearrest, reconviction, or reincarceration. Even recognizing that technical violations do rise with longer STTL durations, the results suggest that STTL’s continued use is warranted to reduce the prison population. The results suggest several considerations and policy recommendations.
Although we observed a higher rate of technical violations for STTL participants, the differences exist only during their first year post-release. This further reinforces the notion that “supervision effects” among STTL participants may exist, and the scrutiny is more likely to occur close to release than further out. Further investigation is warranted to assess whether the higher rates of violations among STTL participants reflect actual differential behavior or an unintended result of increased scrutiny. Policymakers may want to look more closely at the reasons for violations and if appropriate sanctions are being applied. A partnership with community corrections and parole officials to lessen potentially increased scrutiny of STTL participants may, to the extent that it exists, help to improve reintegration and success.
In addition, policymakers could look to couple STTL with targeted rehabilitative and reintegration efforts. Rehabilitative and reintegration efforts are likely to be the most effective when coupled with effective tools for assessing needs (e.g., LS/CMI) and available programs that address those specific needs. Thus, one way to improve STTL is by increasing incentives for those eligible, like the accumulation of time off for good behavior or “good time.” For example, the more STTL-eligible persons participate in rehabilitation programs (when available) or vocational training, the earlier one’s release. Another way to improve outcomes is to strengthen the continuity of care between services provided in the institutional settings and those offered in the community. Assuming that releasees are failing supervision because their criminogenic needs are going unmet. The state can emphasize that JRI funds be spent on programs that target such needs rather than viewing intensive supervision as an “evidence-based practice.”
Similarly, if criminogenic needs are unmet, recidivism may remain high due to crucial differences among some specific demographic groups. For instance, differences between men and women may be due to poor access to health care and child care. Poor access to either can reduce the probability of obtaining and sustaining gainful employment. One could make the same argument related to criminogenic needs issues concerning recidivism differences among crime types between STTL and non-STTL participants. Research suggests that parolees benefit from supportive, community-based treatment options (e.g., drug treatment, housing vouchers, and job placement) that are culturally specific (Gideon & Sung, 2011). The state may want to add additional programming or age-appropriate post-prison support to take those at the highest probability of recidivism.
The combination of more early releases granted and for more extended periods has resulted in significant savings in correctional costs. To date, 8,468 Oregonians have been released on STTL with an average of 75.07 days of leave. With it costing Oregon roughly $116 a day per inmate, STTL potentially saves the state as much as $74 million. While the actual savings were lower because some fixed costs were not be reduced, the savings still substantial. As noted, a 120-day STTL release could save the state as much as $13,920 per release. The analysis suggests that an even greater expansion of STTL would increase savings even more while likely not leading to appreciable increases in crime and recidivism beyond increases in technical violations. If effective reentry programming is further integrated into STTL, the cost savings could be coupled with reduced recidivism.
Supplemental Material
sj-docx-1-cjb-10.1177_00938548231208192 – Supplemental material for Oregon’s Transitional Leave Program and Recidivism
Supplemental material, sj-docx-1-cjb-10.1177_00938548231208192 for Oregon’s Transitional Leave Program and Recidivism by Mark G. Leymon, Christopher M. Campbell and Kris Henning in Criminal Justice and Behavior
Footnotes
AUTHORS’ NOTE:
The Oregon Criminal Justice Commission funded this project under Grant No. PSU-20-3.
Notes
References
Supplementary Material
Please find the following supplemental material available below.
For Open Access articles published under a Creative Commons License, all supplemental material carries the same license as the article it is associated with.
For non-Open Access articles published, all supplemental material carries a non-exclusive license, and permission requests for re-use of supplemental material or any part of supplemental material shall be sent directly to the copyright owner as specified in the copyright notice associated with the article.