
Abstract
The purpose of these studies was to develop a novel measurement, the Sentencing Goals Inventory (SGI), for understanding the underlying people’s motivations for punishing justice-involved individuals. Prior scales have focused on punishment motives such as utilitarianism (incapacitation or deterrence) and retribution (“just deserts”) but have not assessed a rehabilitation motive (punishment with the goal of addressing the cause of criminality) in tandem. Building on the previous unpublished work by Perelman and colleagues (2010), we conducted four new studies on the SGI. A slightly modified version of the scale emerged as a well-fitting model for sentencing goals. It displayed good reliability across samples, internal structure validity, and discriminant and convergent validity with other measures. This work provides a strong basis of evidence for the SGI as a measure of current social attitudes toward criminal justice sanctions and punishment that can be used in future research and to inform public policy.
Understanding and measuring sentencing goal beliefs, the latent motivation behind why people want to punish justice-involved individuals, can be a vital source of information in crafting policy in line with evolving societal views on the justice system. The attitudes and ideology of society have long had an impact on the tenets and functioning of the legal system (Wolfgang, 1988); however, measuring sentencing goals is a more recent endeavor. As such, few measures exist to accomplish this aim. Those that do (e.g., Carroll et al., 1987; Yamamoto & Maeder, 2019) are limited in the goals they measure. Although these measures are useful, they leave a gap in our ability to measure sentencing goals in a comprehensive fashion that could be relevant to policy contexts.
Thus, the aim of the present work is to validate a measure, the Sentencing Goals Inventory (SGI) that captures the full range of sentencing goals. The information provided by the measure will be beneficial in informing criminal justice policy, correctional interventions, and sentencing severity such that it reflects the general orientation of a community. Better understanding sentencing goals can inform policy change that reflects society’s values if they shift over time and could be useful in other contexts as well where understanding an individual person’s preferences is important (e.g., jury selection, political campaigning).
Why Societies Punish Justice-Involved Individuals?
Punishment holds an important role in society. The usage and purpose of punishment, or goals of sentencing, have varied across time and place (Miethe & Lu, 2005). Philosophers have identified five major sentencing goals that characterize punishment ideologies present in western, Judeo-Christian, liberal societies like the United States: rehabilitation, retribution, general deterrence, individual deterrence, and incapacitation (Ezorsky, 2015). These do not encompass all punishment philosophies in the world but largely describe those present in the history of the United States and other western, liberal societies.
In the early to mid-1900s, the United States saw a largely rehabilitative approach to punishment characterized by the idea that “crime is a public health concern susceptible to diagnosis and cure” (Alschuler, 2003, p. 6). This idea has been thoroughly elaborated by Cullen (2013), who discussed the so-called “rehabilitative ideal,” the concept that seeking to rehabilitate justice-involved individuals, or trying to fix the reason for offending, serves the broad social purpose of signaling a belief in redemption. Thus, rehabilitation, as a sentencing goal means that we punish with the goal of addressing the reasons for criminal offending to benefit the individual as well as society. The U.S. justice system transitioned away from this approach in the 1970s toward a focus on retributive and utilitarian goals for punishment (Cullen, 2013). This was after Martinson (1974) characterized rehabilitative efforts not showing a significant impact on recidivism rates, which would be later interpreted, famously, as the notion that “nothing works” in terms of changing criminal behavior.
The retributive motive is characterized by a desire for justice-involved people to get what they deserve, a concept embedded in the Judeo-Christian tradition characterized by the old adage “an eye for an eye” (Ezorsky, 2015; Miethe & Lu, 2005). The approach, in its current form, punishes a justice-involved person so that they receive their “just deserts,” or what they are perceived to deserve (Miethe & Lu, 2005). An example of retribution in the United States is mandatory sentencing policies that place minimum sentencing requirements for certain crimes. Although the impact of this policy shift is still felt, an eventual focus on utilitarian motivations of punishment became more present in the U.S. justice system.
The utilitarian goal of punishment has been described by Weiner and colleagues (1997, p. 432) as “. . .consider[ing] the costs and the benefits of punishment; the focus is on the future, with aims reached through a reduction in the likelihood of the misdeed by the perpetrator and/or by others in society.” This definition is operationalized in the context of the SGI as a sentencing goal that relates to punishing for a perceived benefit to society. From this definition, we can see the rehabilitative motive would be subsumed by the utilitarian goal; however, we conceptualize it as distinct due to its altruistic component. In addition, from the utilitarian goal, two other philosophical perspectives for punishment have arisen that fall under its broad umbrella: incapacitation and deterrence.
Incapacitation reflects the idea that holding someone in carceral custody can delay the resumption of criminal activity in the community and eliminate the potential for an individual to commit a crime (Feeley & Simon, 1992; Miethe & Lu, 2005). The use of incapacitation has a long history and, in recent decades, has been focused on selectively incapacitating the most high-risk justice-involved individuals while having shorter or alternative forms of incapacitation for lower-risk individuals to act as deterrents for reoffending (Miethe & Lu, 2005). The classical utilitarian deterrence motive is the idea that punishment can vicariously, through its implied threat, deter other potential law-breakers (general) or directly deter a specific person (individual) from reoffending (Bentham, 1907; Feeley & Simon, 1992; Mill, 1895). Both forms of deterrence are influenced by a perceptual component (objective or perceptual; Paternoster, 2010). The objective component of deterrence is characterized by the actual actions or sanctions placed on a justice-involved person while the perceptual component is the individual’s imagined sanctions for a crime. In the context of the SGI, incapacitation and deterrence are combined into a single utilitarian goal.
The Need for a Comprehensive Measure of Sentencing Goal Orientation
Understanding people’s sentencing goals is an important line of inquiry if we desire policymakers to form initiatives that reflect their constituents’ views. Evidence suggests that people vary in their valuation of different sentencing goals and that these differences in value translate into differences in policy preferences, such as with regard to sentencing severity (e.g., Graham et al., 1997) and support for the death penalty (Warr & Stafford, 1984). Understanding people’s sentencing goals may also give insight into other related concepts such as the attributions people make to why people commit crimes, which also has policy implications. For instance, Carroll and colleagues (1987) found that those who attribute criminal offending to things outside of the person’s control (e.g., social or economic circumstances) were more likely to endorse rehabilitation-oriented policies, and those who believed the cause of the crime was something within the individual’s control endorsed retributive and utilitarian approaches.
These results show there is a clear differentiation in policy-related issues and preferences that can be at least partially explained by sentencing goal orientation. We also know that societally, shifts in sentencing goals have occurred over time. Being able to quantify and measure these preferences at the individual level and differences across people and time at the aggregate level can provide important information to policymakers. A few measures have attempted to do this; however, they have been limited in the different goals they assess. The two most notable measures, the Punishment Orientation Questionnaire (POQ; Yamamoto & Maeder, 2019) and Carroll and colleagues’ (1987) Sentencing Goals scale, either do not include rehabilitative motives alongside other goals or have not parsed out the differences between utilitarian and retributive motives. Doing so would allow for a more holistic view on sentencing goal orientation. With this prior research informing our own, we sought to develop a comprehensive SGI to disentangle multi-faceted punishment beliefs, including both rehabilitative and other more traditional punishment-oriented goals.
Background, Rationale, and Overview of the Current SGI Research Program
To address the need for a measure of sentencing goal orientation, the third, fourth, and fifth authors of this article began constructing a new measurement the SGI, in the 1990s and 2000s that would take and improve upon the work of Carroll and colleagues (1987). Some of this work was reported in a conference presentation by Perelman and colleagues (2010); however, the scale and the initial studies were never published. Much of the data from these first studies were lost to time as the authors transitioned to different roles. Ten years later, as the first and second authors resumed validation with support of the original authors, the data from these early studies could not be located beyond responses to the SGI. The details of these early studies that are still available are on the Open Science Framework (OSF; see Perelman et al., 2010 available there).
Those early records show that the development of the SGI began by collecting 200 questions related to sentencing goals from experts in the field of criminal justice (see Perelman et al., 2010). This pool of items was then reduced to 90 by first deleting redundant items submitted by the experts and then asking a separate panel eight “expert judges” (faculty and graduate student with interests in psychology and law at a U.S. university), to assign the item to its best-fitting sentencing goal. If the item did not fit a single goal, it was eliminated for a total of 80 items to be pilot tested.
A sample of 138 college students completed the 80-question assessment and a principal component analysis found a three-factor model to be ideal. Subsequently, through exploratory factor analysis (EFA), the measure was reduced to 30 items by only retaining items that loaded at .4 on one factor and did not cross-load at .3 or more on two or more factors. The EFA also showed that the factors captured by the model were retribution, rehabilitation, and a general utilitarian goal that contained a mix of deterrence and incapacitation-related items.
After its initial construction, a series of studies were conducted and reported by Perelman and colleagues (2010), providing evidence for the convergent and discriminant validity of the SGI. Overall, results indicated strong support for the 3-factor model while beginning the process of providing evidence for the validity of the scale. For the purpose of the current inquiry, we took the initial scale construction as a starting point and built on that with further evidence to confirm the SGI’s model and demonstrate its psychometric properties in new samples.
Although the initial scale development offers a starting point, a thorough process of validation for any measurement is vital for its scores to be accurate and for it to remain reliable across samples. The Standards for Educational Assessment (American Educational Research Association et al., 2014), a well-regarded source to follow in the construction of new measures, outlines several sources of evidence that provide support for the construct validity of a test. Construct validity is the focal concern of test validation and indicates the degree to which the construct of interest is actually being measured. There are many ways to assess construct validity. One important consideration in forming an argument for the validity of a new test is examining its relationship to other variables that can provide support for the underlying construct of the test. This type of evidence is often garnered from examining the correlation of a test’s scale scores with other test scores. Two types of validity evidence that can be examined in this context are convergent and discriminant validity.
Convergent validity provides evidence that a test is related positively to other tests that measure similar constructs. For instance, in Studies I-III, we assess the convergent validity of the SGI by comparing scales such as the POQ’s utilitarian scales with the SGI utilitarian scale. As they have the same underlying sentencing goal (e.g., punishment for the benefit of society), we expect the scales to correlate moderately in strength and positively in direction. This hypothesis extends to several other convergent validity-relevant scales discussed in the following studies.
Discriminant validity evidence shows a scale is different from measures that do not measure concepts like its own. This evidence may come from low correlations to measurements that assess different constructs. For example, in Studies II and III, we included the Carroll Attribution Scale (CAS; Carroll et al., 1987), which measures the attributions people make about why crime occurs. Although the measure is relevant to criminal justice-related contexts, the construct measured is the locus of control and is distinct from sentencing goals. As such, we expect the correlation between this measure, and the SGI will be lower than a scale more similar to it like the POQ. In addition to discriminant and convergent validity, evidence for the internal structure of the SGI was examined. Internal structure is concerned with how items on the scale relate with each other. Support for this type of validity can be examined via internal consistency of the scale from study to study.
To examine the SGI’s validity in several areas, we conducted four studies. In Study I, we build a foundation of convergent, discriminant, and internal structure validity of the SGI using a convenience sample of unplanned student data from a college course. In Study II, we assess the same types of validity with more measures included to compare the SGI against. Study III replicates and extends these studies to a general population sample that closely resembles the U.S. census demographics. Finally, in Study VI, we examine the internal structure validity of the SGI by conducting confirmatory factor analysis (CFA) and measurement invariance testing (see supplemental materials for a table summarizing the four studies). The goal of each study is to examine the validity of the SGI and increase confidence in it being a well-constructed tool that can be used to assess societal attitudes toward sentencing and inform policy. For each of the studies that follow, we sought and secured approval from the Internal Review Board (IRB) at Arizona State University to conduct this work.
Study I
We sought to assess the discriminant and convergent validity of the SGI by comparing it to an existing scale called the Criminal Attribution Scale (Clements & Schumacher, 1988). Data were collected from undergraduate and graduate psychology students in correctional psychology courses taught at Arizona State University from 2019 to 2020. The inclusion of these scales in the course was initially for educational purposes, and students were not required to complete both scales. Due to the nature of the scale being originally included in the course for educational purposes, no demographics were gathered for this sample. The decision to validate the scale came after the data had been collected.
Study I Methods
Participants
A total of 569 students responded to the Criminal Attribution Scale and 459 responded to the SGI. The students responded to the scale as part of correctional psychology courses. There were no incentives provided for participation and responding to one or both of the scales was a voluntary, non-credit, activity in the courses. We excluded any participants who did not respond to both scales in their entirety for a total sample size of 371. This large exclusion of participants was due to some students only answering one scale and not the other. Students were free to answer one, both, or neither of the scales in the courses. For the purposes of examining convergent and discriminant validity of the scale, however, we needed to be able to correlate the SGI with other scales. This led to the decision to only include participants who responded to both scales.
Measures
The full 30-item version of the SGI was used in this study. All three scales were included: retribution, utilitarian, and rehabilitation. There are 10 items on each scale. Retribution items target sentencing goal motivations relating to a justice-involved person receiving their “just deserts.” The Utilitarian subscale measures the degree to which a person believes we should sentence justice-involved individuals for the good of society or to keep it safe. Finally, the Rehabilitative subscale has items pertaining to and measuring the degree to which a person believes the goal of punishment is to better the justice-involved person for reintroduction into society. The full measure and items on each subscale are in appendix.
The Criminal Attribution Scale was also used to examine two factors assessing the degree to which people make internal and external attributions about the causes of criminal offending (Clements & Schumacher, 1988). The internal attribution scale focuses on person-centered factors endemic to the individual and emphasizes personal responsibility (e.g., there is something wrong with them as a person causing them to commit a crime). The external attribution scale includes items that recognize the role of the environmental, situation-centered context of criminal offending (e.g., committing a crime due to circumstances not totally in their control such as socioeconomic status). This scale was selected primarily due to the data being readily available from the student data to compare with the SGI. However, its content as a scale that measures attitudes toward justice-involved individuals makes it worthwhile as a test of discriminant and convergent validity despite it not being a commonly used scale in the field.
All measures and their items in this study and subsequent studies are included as supplemental materials on this article’s OSF page (Plantz et al., 2022).
Procedures
Participants completed the two measures and then were debriefed and given materials to calculate their scores with instructions about how to interpret them. These values the students calculated were only used for their own educational purposes. Their self-report total scores were not used or included in the dataset: We used the raw responses to calculate their actual scores. As the questionnaires were initially used for teaching purposes, we sought and received post hoc permission from the university’s IRB to use these data.
Hypotheses Related to Discriminant Validity
We hypothesized positive correlations between the SGI rehabilitation scale and Criminal Attribution—External scale. We also expected the SGI rehabilitation scale to negatively correlate with the Criminal Attribution—Internal scale. We anticipated the inverse of these relationships for the SGI Utilitarian and Retributive scales with both scales negatively correlating with the Criminal Attribution—External scale and positively correlating with the Criminal Attribution—Internal scale. The data and R code for these planned analyses and all following analyses are available on the OSF (Plantz et al., 2022).
Study I Results
Internal Consistency
Reliability in this and subsequent studies was measured using omega total (ωT), omega hierarchical (ωH), and the total inter-item correlation coefficient. Omega is an alternative to coefficient alpha that is not constrained by the specific assumption of tau-equivalency necessary for Cronbach’s alpha (Dunn et al., 2014). Although omega and alpha estimates end up similar in their conclusion about the reliability of an instrument, we chose to use omega as it does not imply that the specific assumptions of alpha are met (i.e., a unidimensional model and tau-equivalency). We also report omega hierarchical (ωH), which measures the reliability of the items on a general construct (Zinbarg et al., 2016). The scales (0–1) of ωT and ωH statistics correspond to coefficient alpha in that statistics closer to 1 indicate better reliability. To test homogeneity, we used the R package coefficient alpha (Zhang & Yuan, 2014). To analyze ωT and ωH, we used the R package MBESS (Kelley, 2017). With MBESS, we also generated 95% confidence intervals using 10,000 bootstrapped samples for each ωT and ωH. Standard errors are also reported (see supplemental materials). Reliability for all measures was above 0.7. These values suggest that the scales are acceptable for the research and development stage of the measurement (Nunnally, 1978). Along with the two omega values, we calculated the average inter-item correlation coefficient, which is an average of all the correlations in the correlation matrix and is not dependent on the number of items. Recommended values for average inter-item correlations are between .15 and .5 (Clark & Watson, 2016). Each of the SGI scales fell well within this range (.21–.34).
Bivariate Correlations
We performed a simple bivariate correlation analysis on the sum totals of each scale using Pearson’s r (see Table 1) and interpreted the results in the context of the effect size guidelines proposed by Cohen (1992); (small = .1, moderate = .3, large = .5) for this and subsequent studies. We found moderate positive relationships between the SGI Utilitarian and Retributive scales. We also found small negative correlations between the SGI Rehabilitative and Retributive scales as well as the Utilitarian scale. This is consistent with past findings (see Carroll et al., 1987) and further demonstrates the differences between the punishment-oriented goals and rehabilitation. In addition, there were small to moderate positive correlations between the Criminal Attribution Scale—Internal and SGI Utilitarian scale as well as the SGI Retributive scale. Finally, the SGI Rehabilitative scale negatively correlated with the Criminal Attribution Scale—Internal but had a small positive relationship with the External scale.
Study I Correlation Matrix
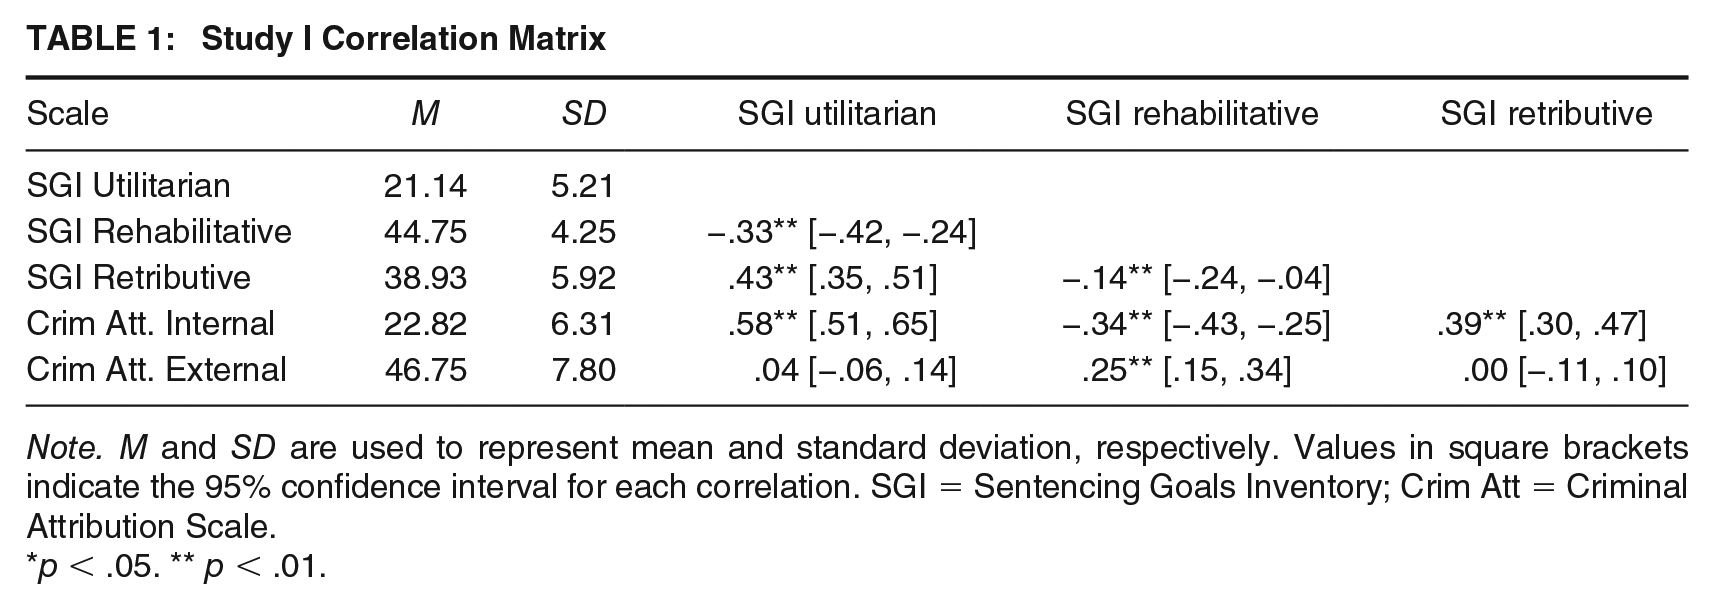
Note. M and SD are used to represent mean and standard deviation, respectively. Values in square brackets indicate the 95% confidence interval for each correlation. SGI = Sentencing Goals Inventory; Crim Att = Criminal Attribution Scale.
p < .05. ** p < .01.
Study I Discussion
The internal consistency of the SGI scales is within an acceptable range for research purposes in this sample. We showed with these data the relationships between the SGI and attributions people make about the principal factors associated with criminal behavior. The positive relationship between the Utilitarian and Retributive SGI scales with the Internal Criminal Attribution Scale is to be expected: Crime attributed to individual responsibility is consistent with a “just deserts,” ‘proportionality’ (Retributive) model. Likewise, the aims of deterrence and incapacitation (Utilitarian) focus on steps believed to reduce future offending via punishment. Conversely, scores on the Criminal Attribution External scale positively correlated with SGI Rehabilitation and negatively with the Criminal Attribution Internal scales. The positive correlations may be due to a belief that Rehabilitation efforts are more likely to succeed as they address environmental and related causal circumstances, such as education and drug treatments. To further build the scale, we conducted subsequent studies in new samples.
Study II
The purpose of this study was to provide further evidence for the construct validity of the SGI by examining the discriminant, convergent, and internal structure validity. This study is meant to provide further validity evidence that began to be collected in Study I through a new pre-planned study. Among our measures to test convergent validity were two related to sentencing goal orientation: Carroll Sentencing Goals scale (CSG; Carroll et al., 1987) and the POQ (Yamamoto & Maeder, 2019). Among our discriminant measures were attributions people make for crime occurring (CAS; Carroll et al., 1987), and a measure for the Belief in Redeemability (BiR) of a justice-involved person (O’Sullivan et al., 2017).
Study II Methods
Participants
Participants were recruited from an undergraduate student population (N = 162) at Arizona State University. Participants who were missing >5% of their data were excluded (n = 3) for a total sample size of 159 that responded to all items. A majority of our participants were female (81%) and had a mean age of 26.57. The sample was primarily White (63.5%) with other participants being African American (5.7%), Asian (5.7%), American Indian (1.9%), or mixed race/other (23.3%). Participants were Democrats (37.1%), Independent (28.3%), Republican (15.7%), and other/non-preference (20.8%). Finally, most participants reported they, nor any family members, had been convicted of a crime (73.6%).
Measures
The full SGI was used to measure sentencing goal orientation. Additional measures of sentencing goals were included to assess convergent validity. The CSG assesses two sentencing goals over 11 items (Carroll et al., 1987). The first scale measures a general punishment motive and the second measures rehabilitative motivations for punishment. Internal consistency for the measure’s scales was not initially reported. A final measure of sentencing goals, the POQ, was also used (Yamamoto & Maeder, 2019). The POQ is a 17-item scale used to measure people’s attitudes toward punishment. It includes questions relating to Retributive and Utilitarian motives for punishment, which are divided into two subcategories of permissive or prohibitive forms of each goal. The scales have shown good internal consistency with the alphas being greater than or equal to .79.
Two measures were included for the purposes of analyzing discriminant evidence. This included the CAS, which is a 12-item measure designed to understand how people explain why crime occurs (Carroll et al., 1987). The measure consists of three scales: social causation, economic causation, and individual causation. Internal consistency has not been adequate for this scale, but it has undergone factor analysis and been shown to have a well-fitting model; thus, we used it as one external validation criterion. This scale shares many similarities with the Criminal Attribution Scale from Study I. However, we decided to switch to this scale as some validation and examination of the reliability of its scores had been published. We also used the BiR, which is a 10-item measure meant to assess perceptions of the redeemability of a criminal justice-involved person (O’Sullivan et al., 2017). The scale scores have been shown to have adequate internal consistency (α = .77).
Procedure
We recruited participants using the university’s SONA system, which allows undergraduate psychology students to participate in research for course credit. Students were also recruited from an online social psychology class and an online Careers in Psychology course. Participants were directed to an online survey through Qualtrics where they viewed an informed consent document. They then completed all measures including a demographic questionnaire. Participants recruited through SONA were given one research credit. Those recruited from online courses were given 0.5 extra credit points.
Hypotheses Related to Convergent and Discriminant Validity
Regarding convergent validity, we hypothesized the Utilitarian and Retributive SGI scales would be positively correlated with the General Punishment Scale of the CSG. We also anticipated the Rehabilitation scales from the SGI and CSG would be positively related. The POQ has four scales: permissive retribution, permissive utilitarian, prohibitive utilitarian, prohibitive retribution. We expected the Utilitarian and Retribution scales from the SGI would correlate with the respective POQ scales, but due to the permissive and prohibitive meaning to reflect opposite constructs, we anticipated that the SGI scales would only be positively correlated with one of each scale. The items from the SGI and permissive POQ scales are similar in content, and we expected to find moderate positive correlations between the SGI Retributive and Utilitarian scales. We expected prohibitive scales on the POQ would negatively correlate with the SGI scales based on content. Finally, we expected the Retributive and Utilitarian scales from the CSG and POQ would negatively correlate with the SGI Rehabilitation scale.
We sought to examine the discriminant validity of the SGI through bivariate correlation analysis with the CAS and BiR scales. The CAS and BiR possess similar but different constructs relating to attitudes justice-involved individuals. We expected to find positive correlations between the BiR and SGI Rehabilitation scale and negative correlations between the BiR and SGI Utilitarian as well as Retributive scales.
Study II Results
Internal Consistency
Internal consistency was measured using the method from the prior study (see supplemental materials for estimates). Omega hierarchical (ωH) values for the SGI Rehabilitation, Utilitarian Punishment, and Retribution scales were .85, .78, and .86, respectively. All inter-item correlation coefficients fell within an acceptable range (.27–.43). These statistics provide further evidence for the internal consistency reliability of the SGI.
Bivariate Correlation Analysis
We performed a simple bivariate correlation analysis using Pearson’s r and found that our hypotheses were supported (see Table 2 for estimates). There were strong positive correlations between the SGI Utilitarian and SGI retributive, CAS individual, POQ Permissive Ut., POQ Permissive Rt, and CSG general scales. The SGI Utilitarian scale displayed moderate negative correlations to the SGI Rehabilitative, CSG Rehabilitative, BiR and POQ Prohibitive Rt. scales. The CAS economic scale also had a small negative correlation to the SGI Utilitarian scale. The SGI Retributive scale displayed strong positive correlations with the POQ Permissive Rt. and CSG General scales, as well as moderate positive relationships to the POQ Permissive Ut. and CAS Individual scales. In addition, there were small approaching moderate negative correlations between the SGI Retributive scale and the CAS Economic, POQ Prohibitive Ut. and Rt., CSG Rehabilitative, and SGI Rehabilitative scale. Finally, the SGI Rehabilitative scale had strong positive correlations to the BiR and CSG Rehabilitative scales. It also displayed moderate positive relationships to the CAS economic and POQ Prohibitive scales and moderate negative relationships to the CAS Individual, POQ Permissive Ut. and Rt., and CSG general scales. The remaining correlations not mentioned were smaller than .1.
Study II Correlation Matrix
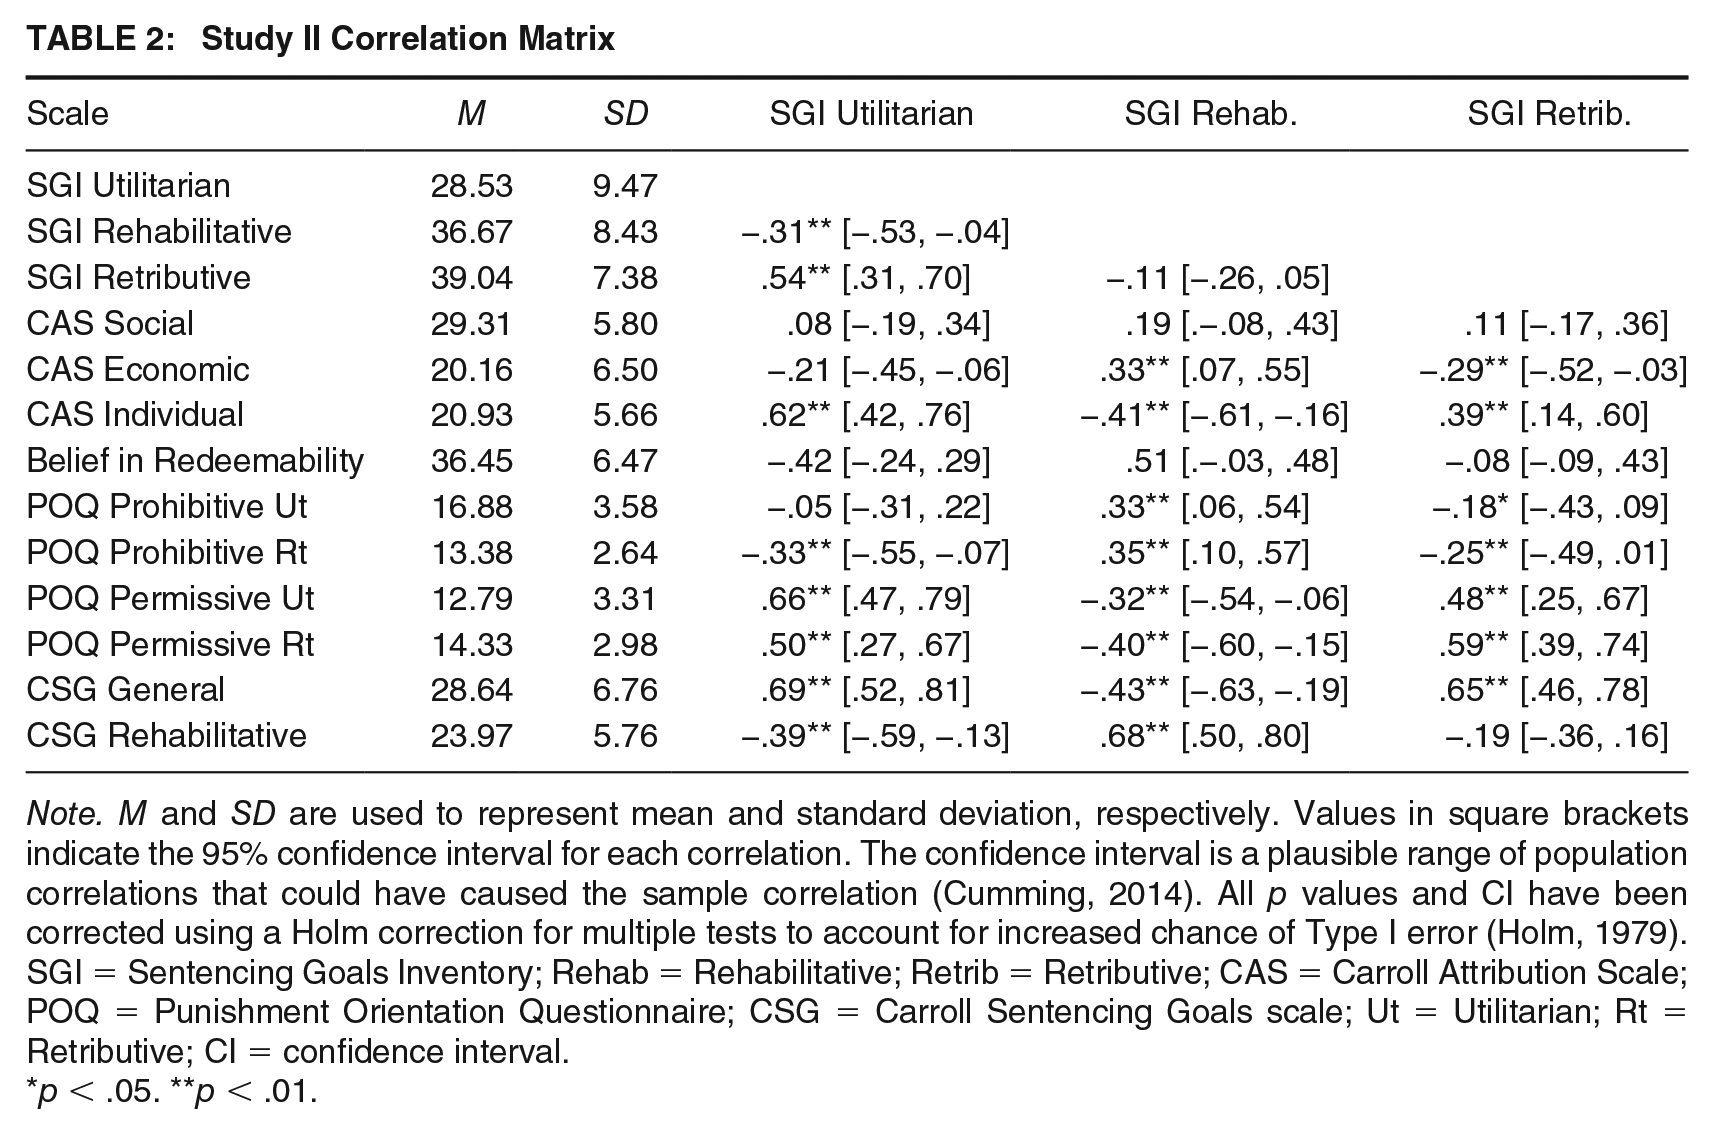
Note. M and SD are used to represent mean and standard deviation, respectively. Values in square brackets indicate the 95% confidence interval for each correlation. The confidence interval is a plausible range of population correlations that could have caused the sample correlation (Cumming, 2014). All p values and CI have been corrected using a Holm correction for multiple tests to account for increased chance of Type I error (Holm, 1979). SGI = Sentencing Goals Inventory; Rehab = Rehabilitative; Retrib = Retributive; CAS = Carroll Attribution Scale; POQ = Punishment Orientation Questionnaire; CSG = Carroll Sentencing Goals scale; Ut = Utilitarian; Rt = Retributive; CI = confidence interval.
p < .05. **p < .01.
Discussion
In this new sample, the SGI showed adequate levels of internal consistency and generally expected patterns of convergent and discriminant validity with other scales. However, the reliability of the BiR scale did not meet the threshold for use in research contexts (ωH = .61), and the validity evidence provided by examining its correlation to the SGI scales should be interpreted with caution in this sample. Along with support for the convergent validity of the SGI with the bivariate correlations of other sentencing goal scales, we found support for discriminant validity between it and measures of similar but different constructs through its associations with the CAS and BiR. Overall, this study provides further support for the construct validity of the SGI and its scales.
Of note, the POQ prohibitive utilitarian and retributive scales negatively correlated with the SGI utilitarian and retributive scales. This suggests that the SGI is in line with the permissive dimension of the POQ, which focuses on the doling out of punishment rather than on restricting punishment as characterized by the prohibitive dimension of the scale (Yamamoto & Maeder, 2019). These findings indicate that someone looking for a scale that focuses on attitudes toward “doling out punishment” could safely use the SGI. However, if there is need for a further breakdown of the retributive and utilitarian motives, the POQ might be a better measure to use.
Study III
This study sought to expand on Studies I and II by gathering a more representative sample of the population of the United States. The goals, measures, procedures, and hypotheses remained the same as Study II. We sought to examine the convergent, discriminant, and criterion related evidence of the SGI with other scales.
Study III Methods
Participants
We recruited participants from Qualtrics using their panel recruitment option. We requested a sample that roughly fit the 2018 U.S. census percentages for race (U.S. Census Bureau, 2018). We also asked that the political affiliations of respondents match the most recent Gallup, Inc. poll (April 14, 2020, conducted shortly before we collected data). There was a total of 416 responses, of which 82 were screened out for failing at least 1 of the attention checks for a total sample of n = 334. A majority of our participants were female (51%) and had a mean age of 47 with 30% in the 18 to 34 age group, 32% in the 35 to 54 group, and 38% were 55+. The sample was primarily White (59.9%) with other participants being African American (11.3%), Hispanic (12%), Asian (7.5%), or mixed race/other (9.3%). Income level ranged from <US$39,000 dollars a year (37.4%) to over US$100,000 (18%) with a majority of participants stating they were employed (51%). Participants were primarily politically independent (40%) with others indicating they were Democrat (31.1%), Republican (26.9%), or other (3%). Finally, most participants reported they nor any family members had been convicted of a crime (79%).
Measures
All measures from Study II were included in this study. To measure sentencing goals, the SGI, CSG, and PoQ were used. Our measures being used to assess discriminant validity from the previous study, the BiR and CAS were also taken by participants.
Procedures
After initial recruitment participants were directed to a Qualtrics survey where they were shown an informed consent and asked demographic questions. Participants then continued to complete the survey measures (mean completion time of 7 min). Participants were then thanked and received payment (US$2) for their time.
Study III Results
Internal Consistency
The method from the prior study was retained here with the same three estimates (see supplemental materials). Omega hierarchical (ωH) values for the SGI Rehabilitation, Utilitarian Punishment, and Retribution scales were .91, .89, and .88, respectively. All inter-item correlation coefficients fell within an acceptable range (.42–.52) for the SGI. Overall, the values of omega hierarchical and the average inter-item correlation coefficients in this sample support the internal consistency reliability of the SGI.
Bivariate Correlations
We expected the trend from Study II would continue here with all of our previous correlational hypotheses being retained; this was largely found (see Table 3). The correlations between retributive and utilitarian with rehabilitative scales were inconsistent with prior findings. In particular, the SGI Retributive scale displayed moderate positive correlations with the SGI Rehabilitative scale. The SGI Utilitarian scale also moderately negatively correlated with the BiR. Beyond these discrepancies, the SGI Retributive scale had strong positive correlations to the POQ Permissive Retribution and CSG General Punishment scales, moderate positive correlations to the CAS Individual and POQ Permissive Utilitarian scales. The SGI Utilitarian scale followed the trend of replicating results from Study II with strong positive correlations to the CAS Individual, POQ Permissive Utilitarian, POQ Permissive Retribution, and CSG General punishment scale, and a moderate positive correlation to the SGI Retributive scale. Finally, the SGI Rehabilitation scale was moderately positively correlated with the CAS Economic and Social scales and also had a strong positive correlation with the BiR scale. Remaining scale correlations were small or near 0.
Study III Correlation Matrix
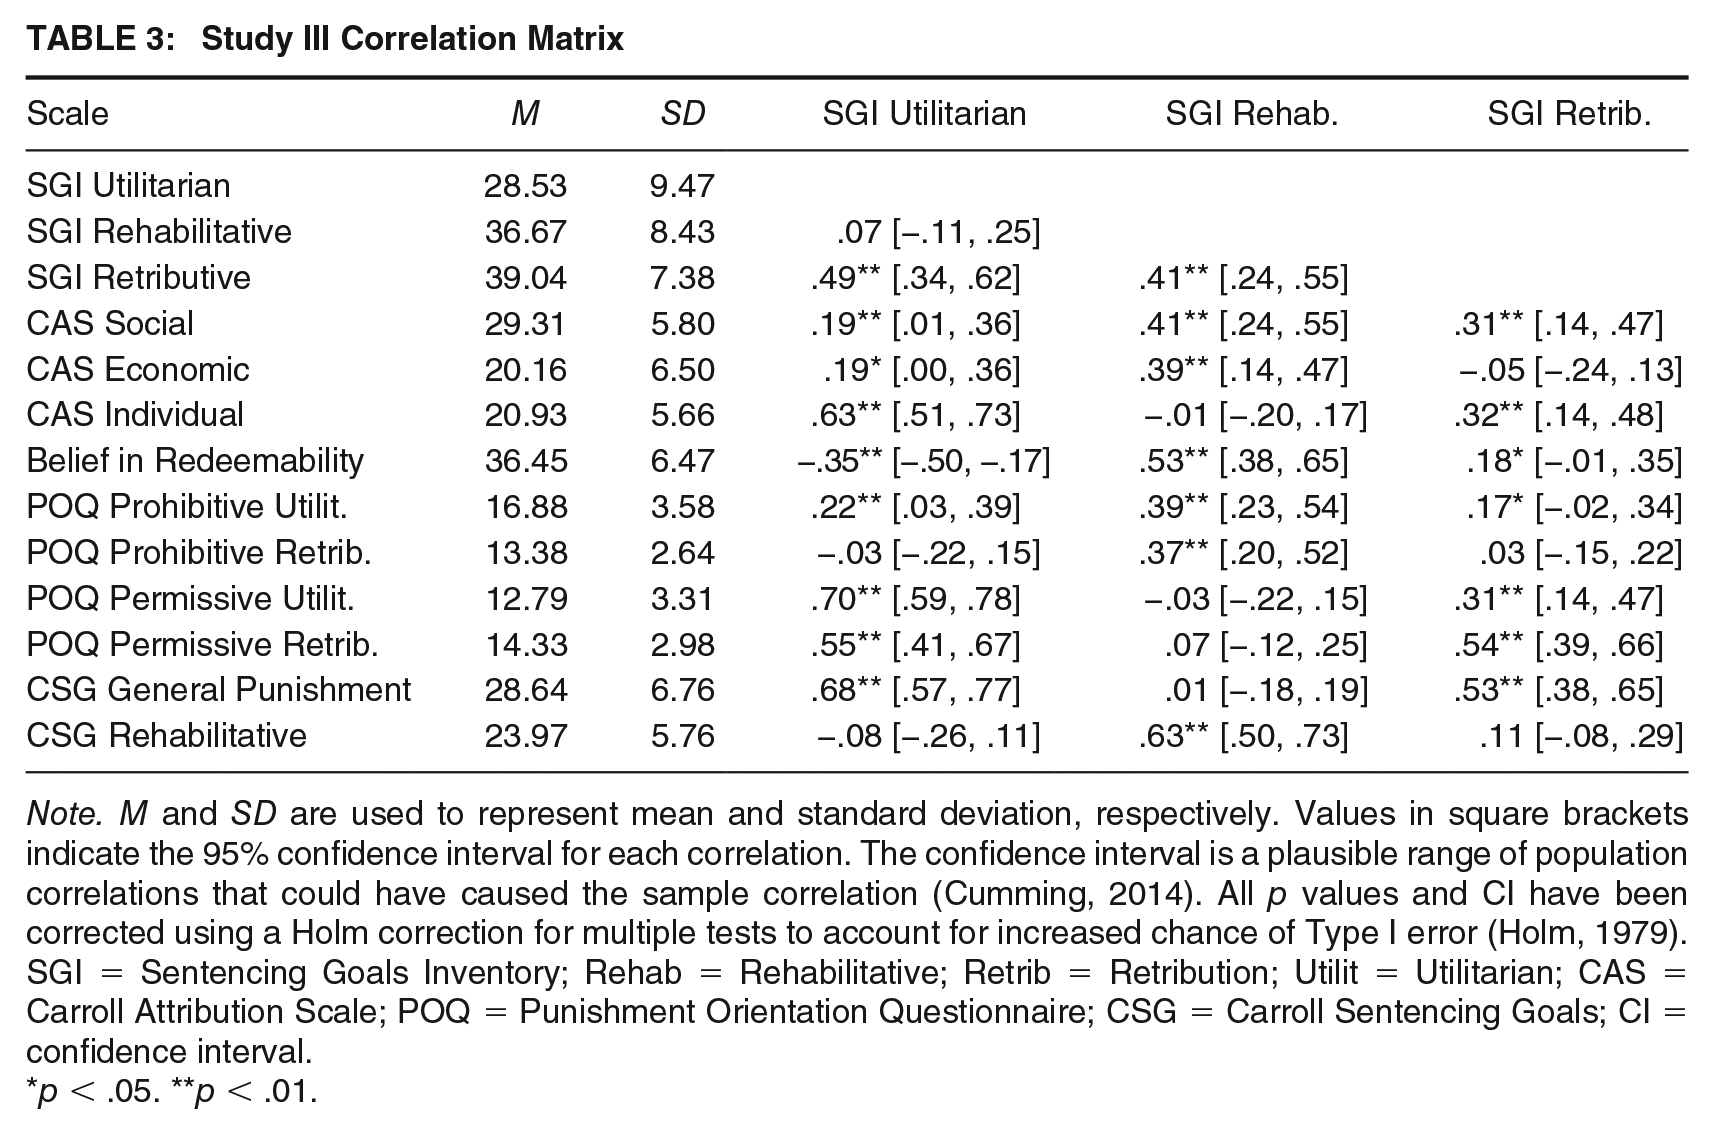
Note. M and SD are used to represent mean and standard deviation, respectively. Values in square brackets indicate the 95% confidence interval for each correlation. The confidence interval is a plausible range of population correlations that could have caused the sample correlation (Cumming, 2014). All p values and CI have been corrected using a Holm correction for multiple tests to account for increased chance of Type I error (Holm, 1979). SGI = Sentencing Goals Inventory; Rehab = Rehabilitative; Retrib = Retribution; Utilit = Utilitarian; CAS = Carroll Attribution Scale; POQ = Punishment Orientation Questionnaire; CSG = Carroll Sentencing Goals; CI = confidence interval.
p < .05. **p < .01.
Study III Discussion
In this study, we further demonstrated the internal consistency reliability and the construct validity of the SGI in a more representative U.S. sample. We also displayed further support for the construct validity of the SGI scales with their counterparts. However, in the first occurrence, the SGI retribution and rehabilitation scales positively correlated with one another. This may suggest the SGI scales may not always be mutually exclusive. For example, perhaps we should punish someone because they deserve it but also so they can receive treatment and not commit another crime.
Respondents were a diverse group of people, and while we expected rehabilitation and retribution to typically diverge, it may be the case that there is a shift toward a more moderate view that lies somewhere in between. In addition, the reliability of the PoQ Prohibitive Retribution scale was far from the threshold of being acceptable for use and its correlations should be interpreted with caution or disregarded. Finally, it should be noted that the average interitem correlation for the SGI rehabilitation scale and CSG scales were slightly higher than the recommended value of .5 at .51–.52. They are only slightly outside the range, but this may suggest the items are too narrow in their item content.
Study IV
Our final step in the development of the SGI within this article was to examine the model fit and invariance of the measure across groups. The goal for this final section was to verify the SGI’s factor structure and determine if any model modifications were necessary. In addition, we sought to examine if the SGI’s model remained equivalent across groups. This work was done to provide evidence for the internal structure validity of the SGI.
Study IV Methods
Participants
For this analysis, we combined the data from Studies II and III into a single dataset, as well as an additional sample of data collected from the administration of the SGI in a student’s thesis work at Arizona State University. The student’s work related to rape myth acceptance, but the SGI was the first measure included on the survey. Although some analyses (tests of item reliability and construct validity) were performed on each of these datasets, CFA was never conducted on the individual datasets. We chose to wait and collect our data into one larger dataset for the CFA. We wanted to meet minimum recommended criteria of 10 observations per parameter (n = 300); (Bentler & Chou, 1987; see also Wolf et al., 2013). A total of 705 participants were included in this dataset. We excluded participants (n = 35) who did not report their gender and did not complete the SGI in full. In addition, as we did not gather enough participants who indicated they identified as a gender other than male or female for analysis, anyone who indicated their gender as “other” was excluded (n = 5). The final sample included 665 participants (male = 36%, female = 64%).
Procedures
We first randomly split the dataset into two sub-datasets, S1 (n = 332) and S2 (n = 333). One to analyze and modify the model if necessary, and the other for cross-validating the final model. This sample size coincides with an 11:1 ratio of observations to observed variables in each subset, which exceeds the generally recommended ratio for CFA with our number of indicators (Bentler & Chou, 1987). We also retained the full dataset with the gender variable included to test measurement invariance. We conducted a CFA on the hypothesized model and two alternative models (details follow), before qualitatively changing the SGI by removing three items (details follow). We cross-validated the modified model using the second subset of data. We then proceeded to test the measurement’s invariance across gender.
Study IV Results
Assumption Testing
Descriptive statistics and multivariate normality testing were performed using the R package “MVN” (Korkmaz et al., 2014). Descriptive statistics for the SGI items are in the supplemental materials. Some of the items were not normally distributed at the univariate level, contributing to the assumption of normality being violated at the multivariate level. Mardia’s multivariate test for skewness (p < .001) and kurtosis (p < .001) were significant (indicating violation of the multivariate normality assumption). The violation of multivariate normality is not unexpected or uncommon with Likert-type-scale data but needs to be accounted for (Lubke & Muthén, 2004). Items within each scale were all correlated with each other: Rehabilitation, r ≤ .29; Utilitarian Punishment, r ≤ .30; Retribution, r ≤ .26 with exception to SGI 16, which was consistently lowly correlated with all other retribution items (see appendix for correlation matrix).
Model Fit
To test model fit, we conducted CFA on our hypothesized three-factor model (see supplemental materials for diagram). Before conducting the CFA, we performed an EFA on the entire dataset (n = 665) to determine which item best represented each factor of the SGI, based on the highest factor loading, and fixed that parameter equal to 1 to act as the reference variable in the CFA. We then conducted a CFA on S1 using Rosseel’s (2012) lavaan package for R. As at least some of our data were not distributed normally, we used a robust maximum likelihood estimation variant (MLR) that produces goodness of fit estimates with a correction for non-normally distributed data. A recent simulation study suggested MLR would produce less biased estimates of goodness of fit and parameters than other methods at our sample size (Li, 2015).
The supplemental materials contain unstandardized and standardized estimates of the SGI factor loadings and intercorrelations of the factors. All SGI items loaded highly (<0.6) and significantly (p < .001) onto their specified factors with exception to SGI 16, which loaded lower than all other items, although still significantly. All factors had significant, but small, intercorrelations with each other as well (see supplemental materials). The internal consistency reliability of each scale was also high as indicated by the omega values: Utilitarian = .89, Retribution = .83, Rehabilitation = .89. The scales’ overall reliability was also high ωT = .84.
Model Modification and Cross-Validation
We calculated three robust model fit indices (Brosseau-Liard et al., 2012; Brosseau-Liard & Savalei, 2014): chi-square, the root mean square error of approximation (RMSEA), and the comparative fit index (CFI). We also calculated the standardized root mean squared error (SRMR) and the Akaike information criterion (AIC). The overall model fit for our three-factor hypothesized model had an acceptable fit, but we wanted to try to improve it. The Robust CFI approached acceptable fit (.87), the Robust RMSEA indicated a moderate fit (.06), and the SRMR neared good fit (.10) based on recommended values from Hu and Bentler (1999); (CFI = >.95, RMSEA ≥05, SRMR ≥.08) and Browne and Cudeck (1993; see Table 4). As chi-square is highly sensitive to sample size, it has little interpretability beyond comparing models.
Model Fit Indices
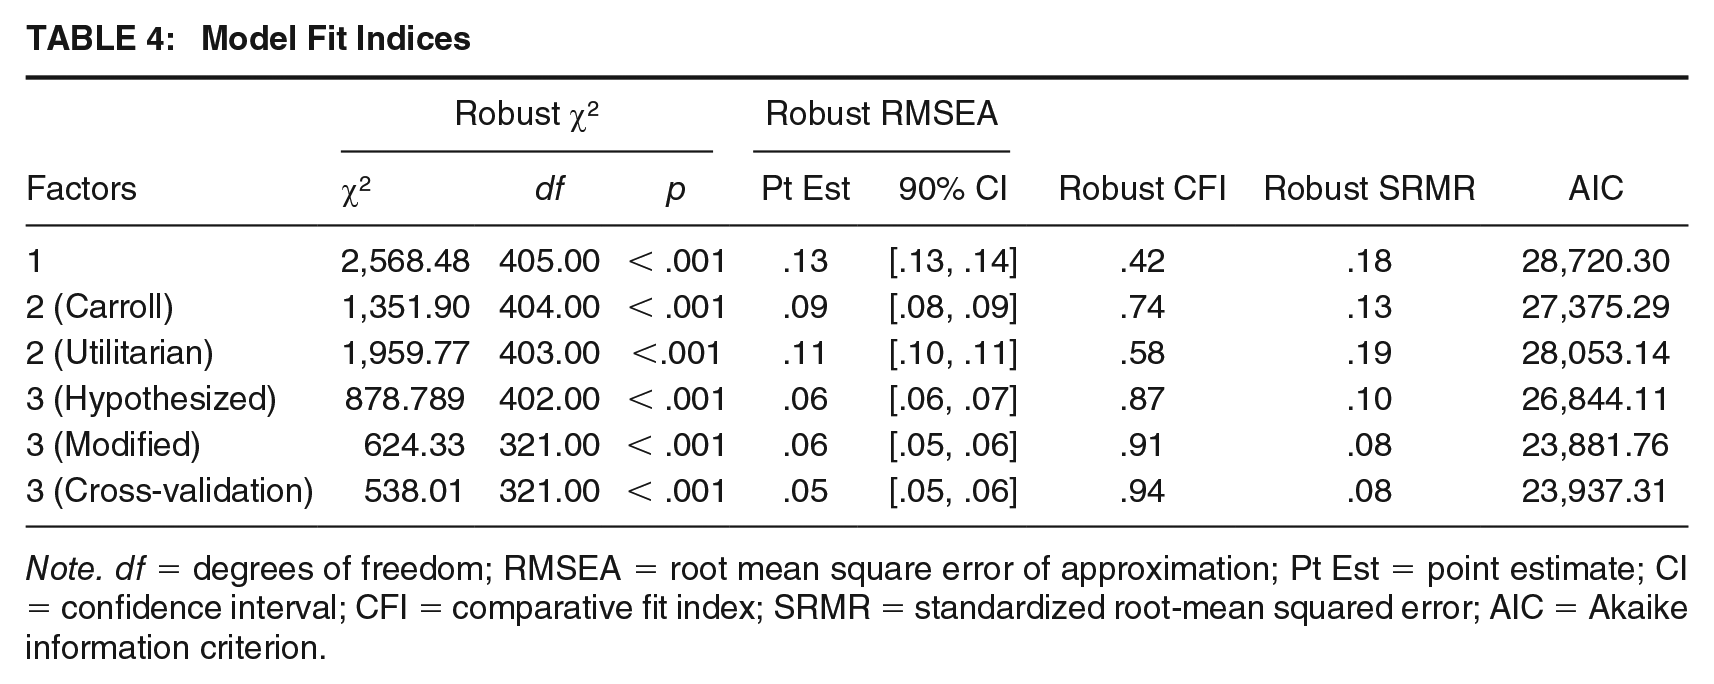
Note. df = degrees of freedom; RMSEA = root mean square error of approximation; Pt Est = point estimate; CI = confidence interval; CFI = comparative fit index; SRMR = standardized root-mean squared error; AIC = Akaike information criterion.
Although the recommended values provide some context for interpreting the model, understanding the quality of any model is a multifaceted issue and strict adherence to any rules of thumb is ill-advised (Marsh et al., 2004). Overall, higher values for the robust CFI are best, with 1 indicating perfect fit, and lower values for RMSEA and SRMR are desirable. Although the results of this analysis taken together suggest adequate fit and a good model for sentencing goal orientation, we wanted to test alternative models and determine if there were problem items that could be removed to make the model more parsimonious.
We tested the model against a one-factor (overall sentencing goals) and a two-factor model (general punishment and rehabilitation modeled after Carroll et al., 1987) to determine if a different number of latent factors would produce a better solution. In addition, we tested a model with the rehabilitative motive included in the utilitarian goal to determine if it was a distinct factor. All three models were significantly worse fitting than our hypothesized model as confirmed by the decreased fit in each model. The comparison of model fit, in this case, is helpful in determining that our hypothesized model is the best fit for the data.
As the model respecifications did not increase the overall fit over and above our hypothesized model, we examined the Lagrange modification indices to determine if pathways could be added. Adding pathways between Retribution—SGI 16 and the Rehabilitation and Utilitarian factors would provide a substantial decrease in our chi-square statistic. That item also captured far less variance (R2 = .09) than the remaining items. As our Retribution scale contains nine further indicators for its characterization, we decided to drop SGI 16 rather than add further pathways. In addition, we dropped SGI 3 from the Utilitarian scale and SGI 4 from the Rehabilitation scale—the items contributing the least amount of variance to the model on the other two scales—to maintain consistency in the total number of items on each scale.
We observed a reduction in the AIC statistic from the 30-item initial model to the 27-item modified model (see Table 4). The reduction in AIC indicates our 27-item model is a better fitting model. In the modified model the Robust CFI continued to approach an acceptable range (CFI = .91), while the Robust RMSEA (.06) and SRMR (.08) indicated a good fit. The reliability of the data within the context of the measure remained good as well with omega values for each scale being high: Utilitarian = 0.88, Retribution = 0.84, Rehabilitation = 0.89, overall scale = 0.84. With the SGI reaching an acceptable level of fit, we cross-validated the modified model on our second random sample to ensure we did not overfit the model. All fit indices remained comparable or improved in the secondary dataset (see Table 4). The full and modified measures are available in appendix.
Measurement Invariance
Measurement invariance constitutes a major issue in the development and construct validation of any measure. It entails analyzing how well the latent construct of a measure remains stable across groups (e.g., gender, culture, education; Schmitt & Ali, 2015). Gender has been noted as a potential area for differences to occur in sentencing severity and we sought to test if the SGI remained stable across this variable (Miller et al., 1986). To test measurement invariance, we used the full dataset of 665 participants and our modified three-factor model. We tested if two groups, males (n = 240) and females (n = 425), differed in the context of the measurement model. We followed the steps outlined by Vandenberg and Lance (2000), then further refined in Putnick and Bornstein (2016), and began by testing the configural model for invariance using the same robust estimation method as in our CFA. The model remained well fitting (robust CFI = .93, robust RMSEA = .05, SRMR = .08) as a multigroup configural model (see “M1,” Table 5) indicating the model structure is supported in both groups.
Measurement Invariance Model Statistics
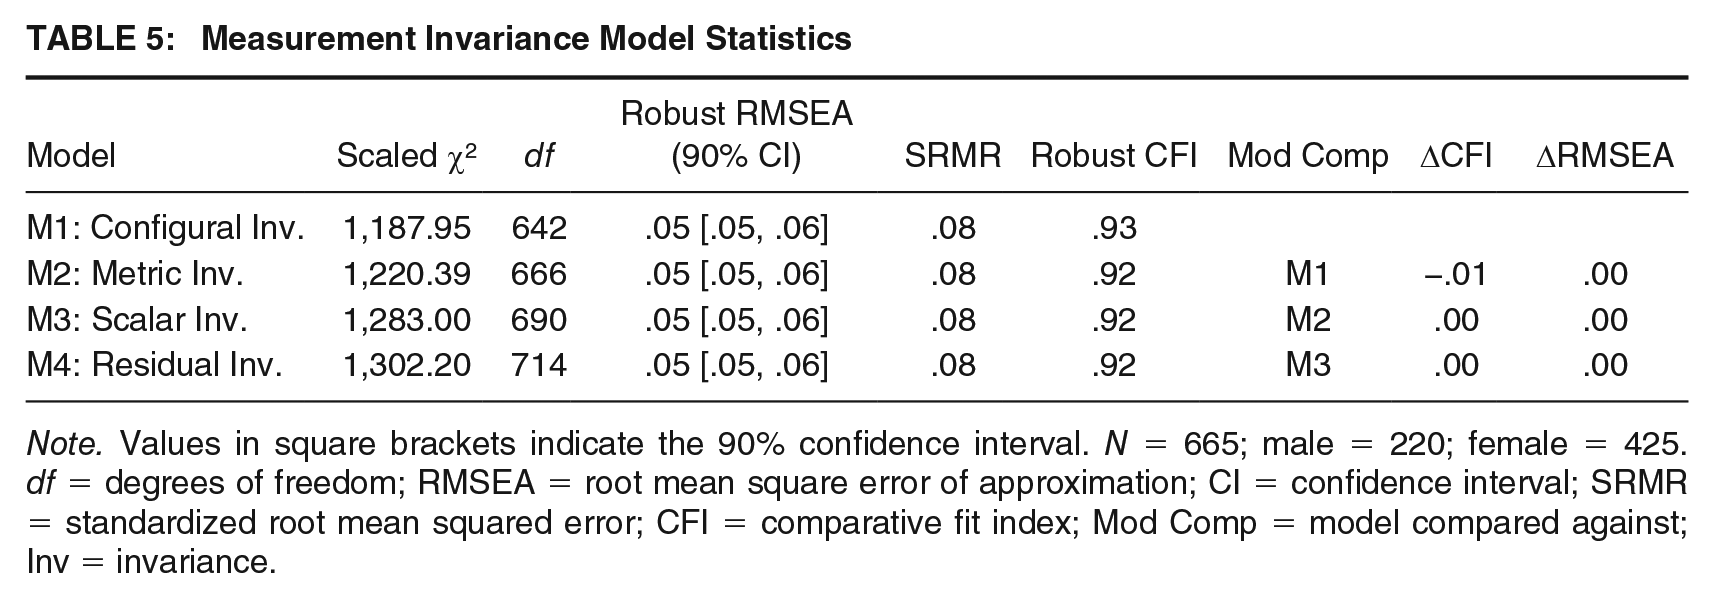
Note. Values in square brackets indicate the 90% confidence interval. N = 665; male = 220; female = 425. df = degrees of freedom; RMSEA = root mean square error of approximation; CI = confidence interval; SRMR = standardized root mean squared error; CFI = comparative fit index; Mod Comp = model compared against; Inv = invariance.
We then constrained the factor loadings of each group to be equal and tested a metric invariance model. As summarized by Putnick and Bornstein (2016), RMSEA and CFI difference tests can be used to compare nested models and check for equality. Following these guidelines (i.e., difference of −.01 for CFI and .01 for RMSEA) the metric and configural models can be considered equivalent (see Table 5). Metric invariance indicates that each item in the model contributes equivalently across both groups. Next, we constrained the intercepts, in addition to the factor loadings, of both groups to be equal and ran another multi-group CFA to test for scalar invariance.
The RMSEA and CFI difference tests indicate there is equivalence for the two models. This suggests that the mean differences between men and women on the latent factor of sentencing goal orientation are fully captured by the shared variance in the items (Putnick & Bornstein, 2016). Finally, we tested for residual invariance by constraining the item error terms to be equivalent in the two groups. We found support for the equivalence of the two groups based on the RMSEA and CFI difference test, suggesting the error variance for items is equivalent across groups. Furthermore, this finding provides support for the SGI displaying full factorial invariance across gender. This means that the SGI can provide statistically unbiased estimates across male and female test-takers and operate across both groups.
Study IV Discussion
The goal of this analysis was to verify the SGI’s factor structure and determine if it displayed measurement invariance using a composite set of data from our studies. We compared our hypothesized three-factor model of sentencing goal orientation—retribution, utilitarian punishment, rehabilitation—to a series of nested models (a one-factor and two-factor model) but found the hypothesized model to be the best fitting. Due to the hypothesized model underperforming on two of the three fit indices we calculated, we removed three items from the SGI. The modified model produced a better fit as indicated by the AIC, and the remainder of the fit indices fell into an acceptable range with exception to the CFI, which did not meet the suggested cutoff value of .95 (Hu & Bentler, 1999). The reliability of the final measurement remained high.
We then conducted measurement invariance testing and found support for full factorial invariance among males and females, indicating the measure can operate equivalently across these two genders. The overall results of this analysis indicate that the SGI and its revised three-factor model is an acceptable conceptualization of sentencing goals. This echoes the findings of Perelman and colleagues (2010), who also found the three-factor model to produce an acceptable fit after removing three items from the retribution scale.
General Discussion
The purpose of these studies was to further validate a measure of sentencing goal orientation that could be used to show how a range of sentencing goals relate to each other. In prior work by Perelman and colleagues (2010), the SGI was constructed and began the process of validation using a three-factor model consisting of retribution, rehabilitation, and utilitarian motives which were a combination of both types of deterrence motives and incapacitation.
The present inquiry examined the reliability as well as the discriminant and convergent validity of the SGI with other measures. The three scales on the SGI showed high reliability throughout each study. Support for the discriminant and convergent validity of the measure was also found. The conclusions throughout each study remained consistent with exception to the SGI’s retributive and rehabilitative scale correlating positively in the general population sample (Study III). Although it is possible that this indicates a lack of ability for the SGI to display distinct constructs, we believe the more likely case is that when presented to a general sample there is a more moderate view than those in a college sample. Finally, a CFA was conducted to provide further evidence for the construct validity of the SGI. The hypothesized three-factor model produced the best fit compared with other models using a robust maximum likelihood approach; however, the CFI fell below an acceptable range. Three items were dropped from the measure, and this produced an overall better-fitting model. In addition, through measurement invariance testing, we found support for the partial scalar invariance of the SGI with males and females.
The SGI began development in a time when there were few measures for sentencing goal orientation. Since then, a similar measure with good psychometric properties was developed. However, that measure, the POQ (Yamamoto & Maeder, 2019) focuses only on retributive and utilitarian aspects of punishment and does not include rehabilitation as a third dimension as the SGI does. This is an important addition, as a long line of philosophical and empirical scholarship has shown that retribution and rehabilitation are negatively correlated yet both are important dimensions of punishment. Thus, the SGI offers a uniquely relevant measure for understanding how a person thinks about the purposes and motivations for punishing justice-involved individuals within a three-factor framework which is in line with common punishment philosophies. We have demonstrated through this work that the SGI has the power to make the distinction between retributive and rehabilitative motives for punishment in a valid and reliable manner. Although the SGI has a more generalized focus on measuring the three commonly cited sentencing goals that improve upon past work and should supersede the scale proposed by Carroll and Colleagues (1987), there is a time when the Punishment Orientation Scale should be used instead. Chiefly, the Punishment Orientation Scale may be best used when further extrapolation of the utilitarian and retributive scales is needed but rehabilitation is less relevant.
The SGI provides a novel way of more holistically assessing sentencing goal orientation. The primary aim of this work was to provide a wealth of information on the validity of the instrument and show its reliability across various samples such that researchers and policymakers could use it and data derived from it with confidence. Endorsement of different sentencing goals is related to support for different types of sentencing policies (see Graham et al., 1997; Warr & Stafford, 1984). Understanding sentencing goals can provide policymakers with vital information on how to shape and form initiatives that are in line with society’s view. As our introduction on the history of sentencing goals in the United States indicated, sentencing goal orientation in the broader social environment is ever shifting, and tracking these changes will be useful in understanding how to make congruent policy changes.
Although the focus of this article has been on using the SGI for policy-related contexts, it also would be useful for research contexts where sentencing goal orientation may be of interest. For example, understanding why laypeople may support certain sanctions over others, or work examining sentencing severity or jury decision-making might make use of a measure like this. The relatively short form nature of the SGI allows it to be incorporated in online surveys or in person administrations with little logistical cost, and it is feasible that sentencing goal orientation may account for variance in outcomes related to hypotheses in these areas.
Limitations
There are a few important limitations of this work. First, while the model fit was overall good for the final version of the SGI and the other fit indices did indicate a good fit, the CFI did not reach the highest recommended cutoff value. In addition, there are limitations within the characteristics of our data. All surveys were conducted cross-sectionally and a majority were gathered using college student samples. Although the second issue was partially addressed by gathering a more representative national sample in Study III, future work with the SGI may endeavor to gather data from more diverse samples to provide further evidence for the SGI’s model and psychometric properties and examine measurement invariance along dimensions other than just gender. In particular, it may be worthwhile to examine how the SGI operates in a criminal justice practitioner sample where they have a unique perspective on the justice system. Furthermore, and noted by Yamamoto and Maeder (2019), sentencing goal orientation as we have characterized it may be most applicable in the context of the United States. The factor structure of the SGI may fit differently for other cultures.
One other notable consideration recently addressed by McNeish and Wolf (2020) involves our scoring method. All of our measures were totaled and interpreted as a sum score of each scale. However, sum-scoring may be inaccurate if the restrictive parameters for a sum-score model (the parallel forms model) are not met.
Finally, in Study III, we found a correlation between rehabilitation and retribution. Although this may just be a unique feature of the dataset, it is worth noting. This correlation may suggest that the SGI may not have a robust ability to make distinctions between the two scales. There are other reasons this correlation may have been found as well though, such as the results being spurious or the coronavirus disease 2019 pandemic influencing the results.
Future Directions
The present work primarily focused on establishing the validity and reliability of the SGI. Although we provided evidence for the reliability and validity of the measure, there is still much work to be done in determining how well the SGI predicts scores on other scales and how it functions in other cultures. On the topic of validity, it will also be important to provide evidence for the predictive validity and additional construct validity of the measure. For example, can this measure be usefully applied in courtroom settings during voir dire to measure a prospective juror’s propensity to decide a case in a particular way? Along with validity, it may be interesting to examine sentencing goals longitudinally and determine if sentencing goals shift over time with age, cultural shifts, and historical changes, or if they are fairly resistant to change. Finally, it may be worthwhile to examine the SGI as a screening instrument or indicator of training needs with frontline personnel tasked with the care of criminal justice populations (e.g., correctional officers, police officers) where there may be a benefit to promote or endorse rehabilitative attitudes.
Supplemental Material
sj-pdf-1-cjb-10.1177_00938548221131954 – Supplemental material for Assessing Motivations for Punishment: The Sentencing Goals Inventory
Supplemental material, sj-pdf-1-cjb-10.1177_00938548221131954 for Assessing Motivations for Punishment: The Sentencing Goals Inventory by Jake W. Plantz, Tess M. S. Neal, Carl B. Clements, Abigayl M. Perelman and Sarah L. Miller in Criminal Justice and Behavior
Footnotes
Appendix
Sentencing Goals Inventory Items by Scale
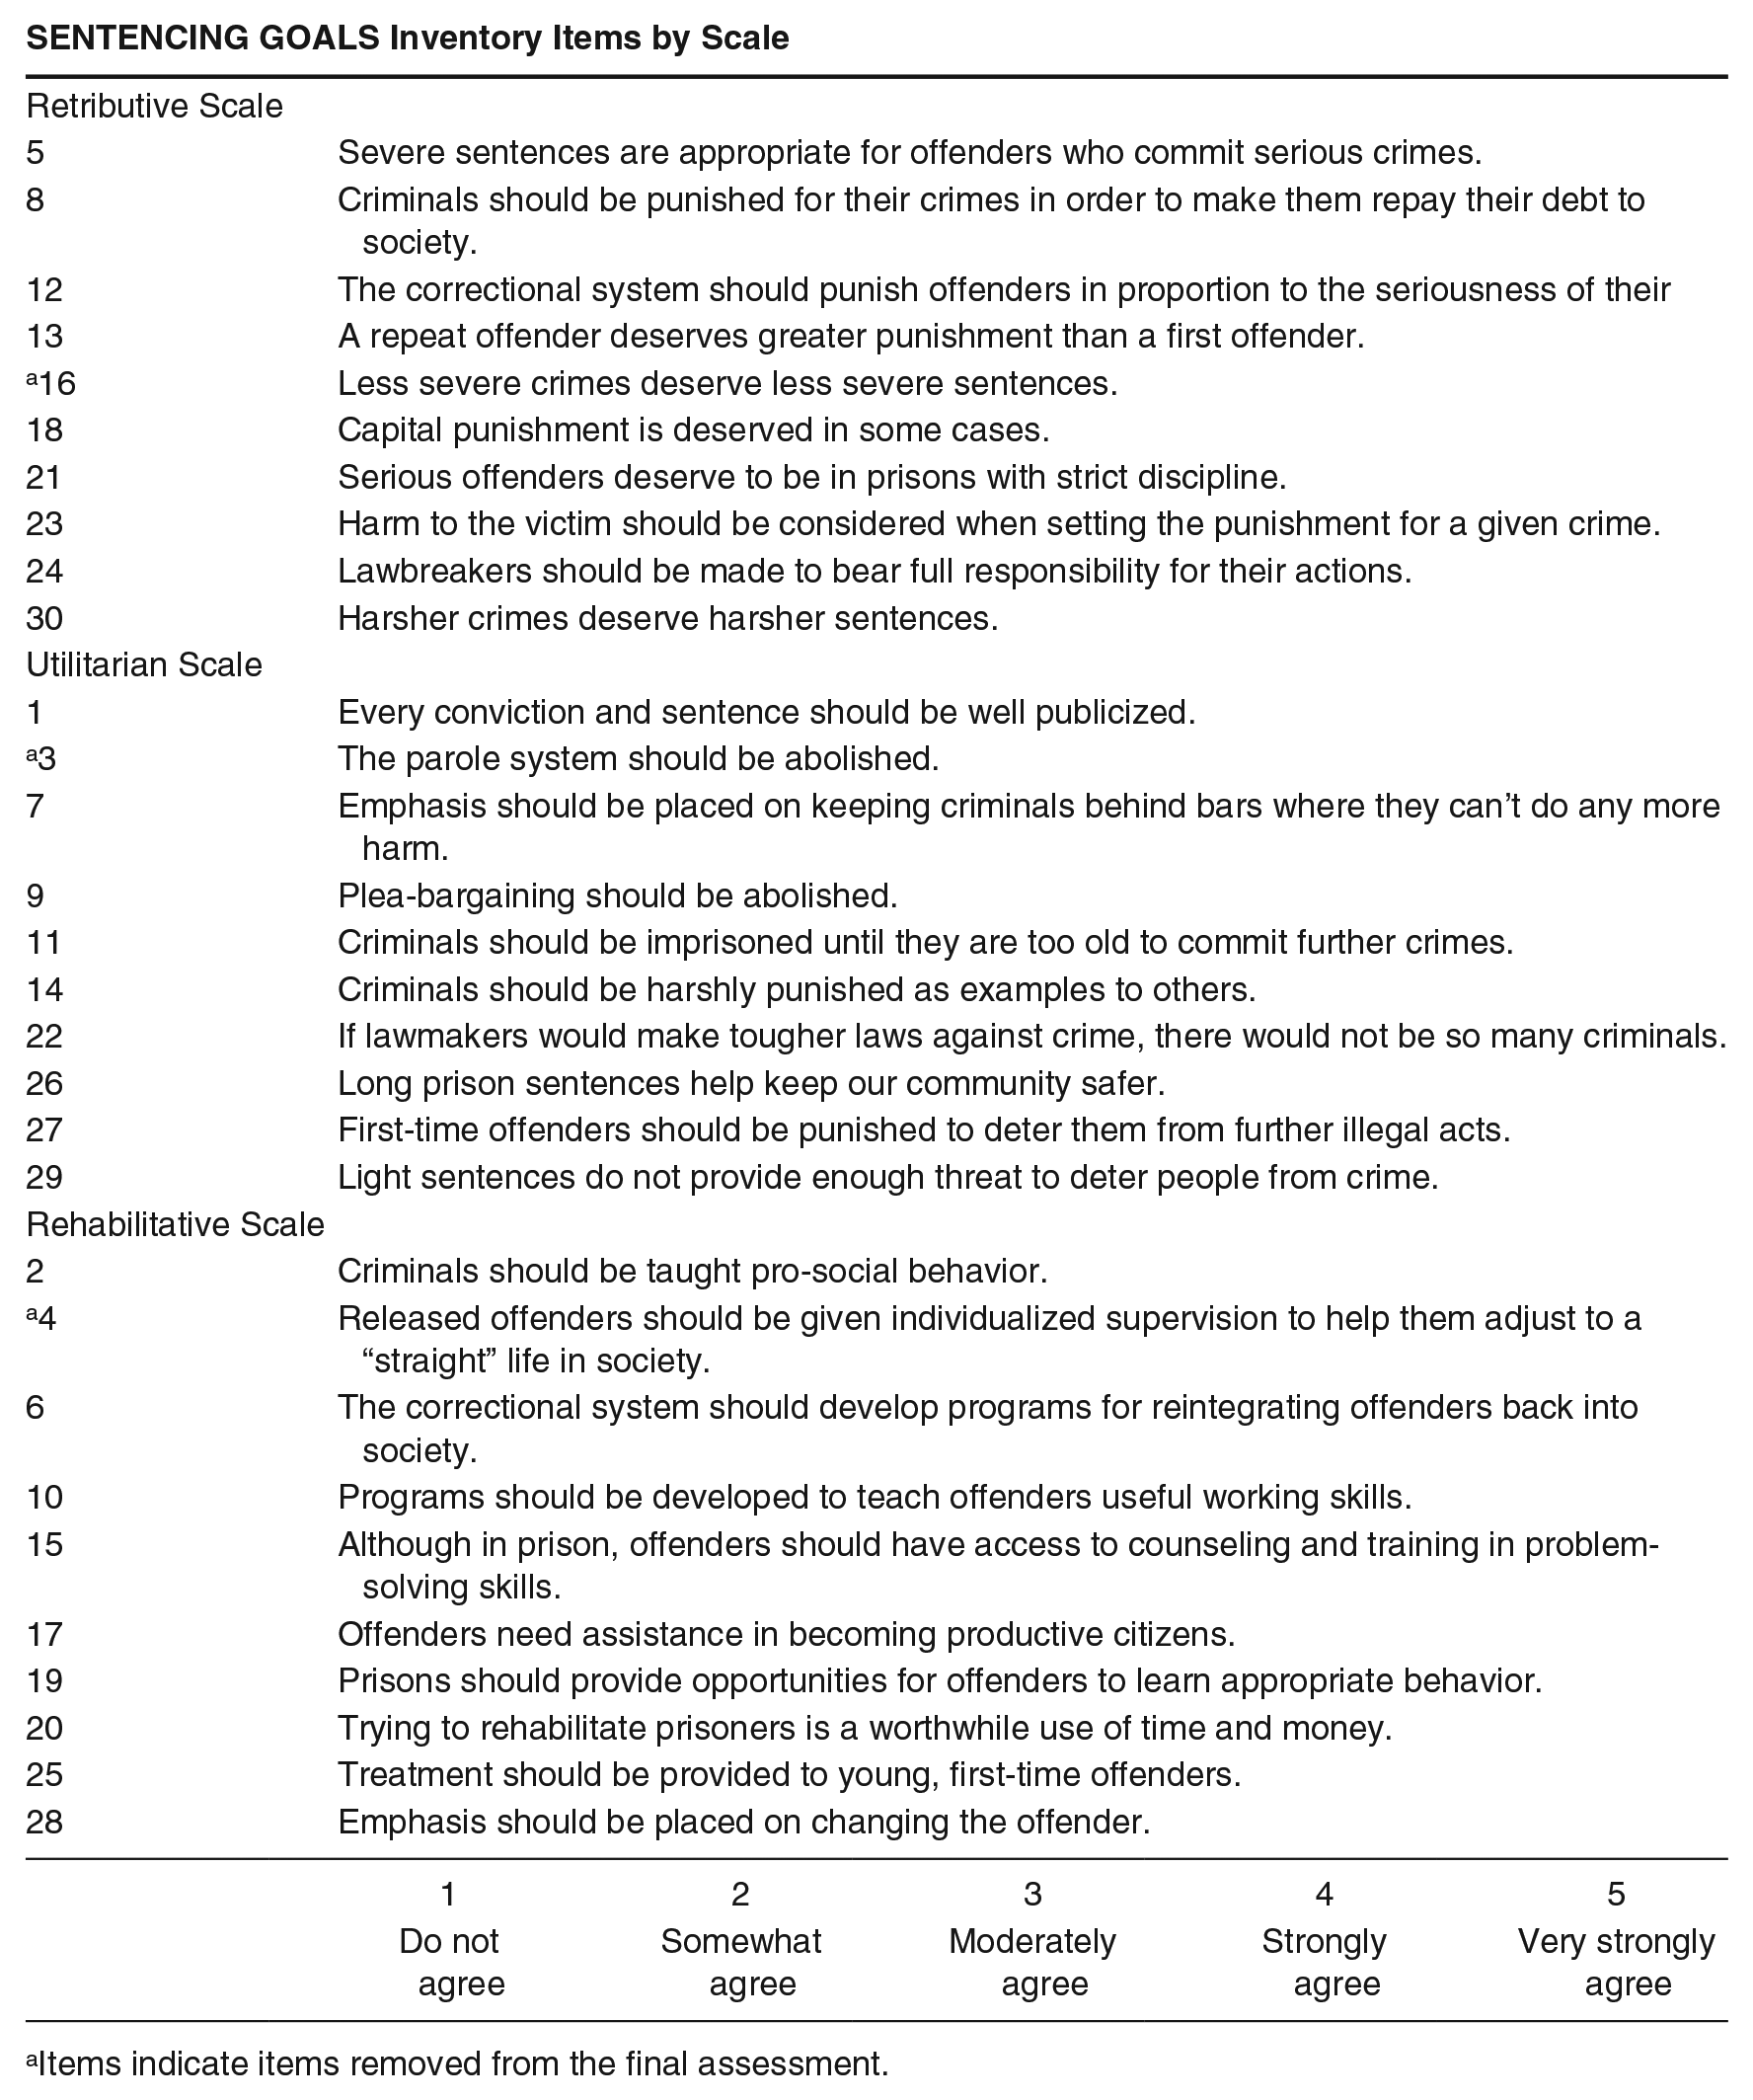
| Retributive Scale | |||||
| 5 | Severe sentences are appropriate for offenders who commit serious crimes. | ||||
| 8 | Criminals should be punished for their crimes in order to make them repay their debt to society. | ||||
| 12 | The correctional system should punish offenders in proportion to the seriousness of their | ||||
| 13 | A repeat offender deserves greater punishment than a first offender. | ||||
| a 16 | Less severe crimes deserve less severe sentences. | ||||
| 18 | Capital punishment is deserved in some cases. | ||||
| 21 | Serious offenders deserve to be in prisons with strict discipline. | ||||
| 23 | Harm to the victim should be considered when setting the punishment for a given crime. | ||||
| 24 | Lawbreakers should be made to bear full responsibility for their actions. | ||||
| 30 | Harsher crimes deserve harsher sentences. | ||||
| Utilitarian Scale | |||||
| 1 | Every conviction and sentence should be well publicized. | ||||
| a 3 | The parole system should be abolished. | ||||
| 7 | Emphasis should be placed on keeping criminals behind bars where they can’t do any more harm. | ||||
| 9 | Plea-bargaining should be abolished. | ||||
| 11 | Criminals should be imprisoned until they are too old to commit further crimes. | ||||
| 14 | Criminals should be harshly punished as examples to others. | ||||
| 22 | If lawmakers would make tougher laws against crime, there would not be so many criminals. | ||||
| 26 | Long prison sentences help keep our community safer. | ||||
| 27 | First-time offenders should be punished to deter them from further illegal acts. | ||||
| 29 | Light sentences do not provide enough threat to deter people from crime. | ||||
| Rehabilitative Scale | |||||
| 2 | Criminals should be taught pro-social behavior. | ||||
| a 4 | Released offenders should be given individualized supervision to help them adjust to a “straight” life in society. | ||||
| 6 | The correctional system should develop programs for reintegrating offenders back into society. | ||||
| 10 | Programs should be developed to teach offenders useful working skills. | ||||
| 15 | Although in prison, offenders should have access to counseling and training in problem-solving skills. | ||||
| 17 | Offenders need assistance in becoming productive citizens. | ||||
| 19 | Prisons should provide opportunities for offenders to learn appropriate behavior. | ||||
| 20 | Trying to rehabilitate prisoners is a worthwhile use of time and money. | ||||
| 25 | Treatment should be provided to young, first-time offenders. | ||||
| 28 | Emphasis should be placed on changing the offender. | ||||
| 1 | 2 | 3 | 4 | 5 | |
| Do not agree | Somewhat agree | Moderately agree | Strongly agree | Very strongly agree | |
Items indicate items removed from the final assessment.
Authors’ Note:
Jake Plantz was affiliated with Arizona State University during the time this project was conducted, but was at McGill University for much of the writing and editing of the paper. For a portion of this project, Tess M.S. Neal was supported by Fulbright Scholarship from the Australian-American Fulbright Commission. This manuscript is not an official Department of State publication, and the views and information presented here are the authors’ and do not represent the Fulbright Commission or the host country’s government or institutions.
Author Biographies
![]()
References
Supplementary Material
Please find the following supplemental material available below.
For Open Access articles published under a Creative Commons License, all supplemental material carries the same license as the article it is associated with.
For non-Open Access articles published, all supplemental material carries a non-exclusive license, and permission requests for re-use of supplemental material or any part of supplemental material shall be sent directly to the copyright owner as specified in the copyright notice associated with the article.