
Abstract
The introductory course to sociology serves the multiple roles of providing students with the foundations of the field while also being its “public face” and possibly improving its image. The outcomes of introductory courses have been investigated mostly in quantitative ways in the past. The article presents a qualitative, longitudinal study of the “mental image” that 397 students of an introductory course at a Hungarian university formed about sociology. Participants were asked to draw mind maps around the central concept of “sociology” right before, right after, and years after taking the course. Results from the content analysis of mind maps indicate that while students are able to situate sociology as a science of the human world, their mental image of the field is often vague beyond that. Mind maps drawn years after taking the course bear the closest resemblance to the ones drawn even before studying it.
The introductory course to sociology, or IntroSoc, has received ample scholarly attention. Beyond its role in conveying the foundations of the discipline, it is also the “public face” of the field: For large swaths of students, what the course relays will simply be sociology. The literature asserts that IntroSoc courses should contribute to a clear and favorable public image of the field. While there is a rich research tradition of quantitative assessment of learning in IntroSoc courses, qualitative descriptions of what students carry with them from a course, in other words, what their “mental image” of sociology is, especially in the long term, have not been abundant. The present study aims to contribute to that underresearched area. Based on mind map data from 397 students of an IntroSoc course at a Hungarian university, the mental image they have of the field right before, right after, and years after studying the subject will be described in terms of its thematic variety. Findings indicate that years after studying IntroSoc, student views of sociology are limited to ideas that are basic but not wrong.
Literature Review
The present study relates to two broad topics. The first is the content and functions of the introductory sociology course, and the second is the assessment of student learning in sociology. The literature for these topics will be reviewed briefly.
The Introductory Sociology Course: Its Content and Functions
Introductory courses in any science play the role of relaying foundational knowledge to students: “fundamental findings that are congealed into the canon of the discipline” (Ballantine et al. 2016:7). The subject matter is “consensual” and “primary,” meaning that it is agreed on by practitioners in the field and typically does not cover the newest developments (Stephan and Massey 1982:428). Sociologists have been looking for such a “core” in their field for over a century in various ways: by interviewing experts (Persell, Pfeiffer, and Syed 2007; Wagenaar 2004) and analyzing sources such as textbooks (Keith and Ender 2004; Manza, Sauder, and Wright 2010) or syllabi (Grauerholz and Gibson 2006; Lowney, Price, and Gonzalez Guittar 2017). The results of those investigations allowed for different interpretations, arguing either for a lack of a core or the existence of some kind of consensus. Recently, the discourse has moved on from trying to define an ultimate “core” either in terms of “content” or “skills” to delineating practicable learning goals (Ballantine et al. 2016; Ferguson 2016).
The literature on IntroSoc, however, makes it clear that laying the foundations is not the be-all and end-all of the course. On the one hand, it faces constraints such as having to conform to legal and administrative requirements or to measurably impart skills to students (Ballantine et al. 2016:152–54). On the other hand, practitioners in the field are often very optimistic about what the intro course can achieve. It can contribute to general education goals (Howard and Zoeller 2007), is said to help recruit new majors to the field, serves sociology students by providing them a firm professional identity (Greenwood 2013), and even “help[s] students to make more informed choices in their lives and communities” (Greenwood 2013:232). It is the “first and only” point of contact with sociology for large numbers of students and the “public face” of the discipline (Greenwood 2013; Zipp 2012). There is also a strong sense that if it wants to be effective, IntroSoc should be “current” and responsive to students and their lived experience (Greenwood 2013; Zipp 2012). It has to be noted, however, that those ambitious visions are not always accompanied by dedicated practical suggestions (e.g., about what that “public face” of sociology should look like in detail). Practitioners in the field seem confident that the intro course defined in terms of learning goals will contribute to such aims.
The problem of the core and a viable intro course have also repeatedly been portrayed as existential matters for sociology. Many have warned that if the discipline failed to define its core for itself, one would be forced on it by “others” such as “administrators, assessment experts, or government officials” (Ferguson 2016:164), suggesting a fear of a loss of autonomy. That argument is similar to the one made by Szelenyi (2015) who saw the rival fields of economics and political science encroach on sociology’s territory. Such fears in the U.S. context are coupled with threats of suffering cuts in funding or the elimination of whole programs and departments from certain universities (Ferguson 2016; Greenwood 2013). In Hungary, recent years have seen government hostility toward certain parts of social sciences and “progressive” ideas, such as the banning of gender studies as a stand-alone university program and the ousting of Central European University from Budapest (Pető 2020). Good sociology education is supposed to improve the discipline’s prestige in the eyes of both the academic and the general public and help prevent negative outcomes for the field (Downey et al. 2008:194; Gans 2016:10).
Measuring the Effects of Sociology Courses
Readers of Teaching Sociology will be familiar with the rich research tradition on quantitative measurement of the effects of sociology education. Most of the time, such studies investigate the outcomes of sociology courses in various designs such as cross-sectional, pretest-posttest, or experimental. They typically demonstrate that students do learn something from a sociology course in the short term and often also name sociodemographic or other correlates of success. The studies relating strongest to the present article are either qualitative or longitudinal.
Bandini et al. (2016) asked 25 sociology students open-endedly about what they thought they had learned in the major. Answers most often mentioned the topics of inequality, gender, privilege, and media and macro-level studies. Students also thought they were able to apply the sociological way of thinking, they became more compassionate and understanding, and improved their research, analytical, writing, oral and critical skills. However, they were not very confident about using quantitative methods.
Howard and Butler (2018) conducted a content analysis of 461 reflective essays written by students at the end of their introductory course about the most memorable things they had learned. Findings were organized in accordance with the Sociological Literacy Framework developed by Ferguson and Carbonaro (2016). Overall, the topic of socialization was mentioned most often, by over two-thirds of students, followed by stratification, the sociological eye, and social structure, all mentioned by roughly half of respondents, while references to social change were minimal.
Medley-Rath (2019) conducted a content analysis of captions written by students to photos in a visual sociology exercise in an introductory course. The study concluded that students used a limited range of broad sociological concepts in their work, that they often provided “unclear” captions, and most of them seemed either unable or unwilling to adopt more nuanced concepts. While students were able to make a connection between sociology and their everyday lives, they did not seem to gain a deep understanding of the subject material.
As for longitudinal studies involving sociology students, McKinney and Naseri (2011) investigated the development of students’ identities as learners, and Ashwin, Abbas, and McLean (2014) found that sociology students gained a more refined understanding of the field as they advanced in their studies.
Research Question and Aim
The research question of the present study is “What do students think about sociology before, right after, and years after taking the introductory class?” The apparent vagueness of the wording “think about” is intentional. The goal is not to measure learning or skills in the sense of a comparison to a standard. The thing under investigation is a “mental image” students form about sociology that is to be described in terms of the variety of themes and topics, not the depth or complexity of messages. The biggest attention will be paid to changes in time, from one data-gathering wave to the next. Hypothesis testing is not a goal in this study. The reason for that is the practical limitation that the length of one research article only allows for a content-analytical description of findings.
Data and Method
The Introductory Course and the Sample
The data were provided by students of a “Foundations of Sociology” course held during the fall 2015 semester at Corvinus University of Budapest. Students were all first-years coming from five different majors (in Hungary, students apply directly for majors before beginning their studies). Four of those belonged to the Faculty of Social Sciences: sociology, political science (PS), media and communication (MC), and international studies (IS); the fifth was landscape architecture (LA). The course comprised a weekly 90-minute lecture open to all students but not compulsory, held by the same instructor, and a weekly 90-minute seminar open and compulsory only to social scientific majors, held in groups of up to 40 by eight different PhD students.
The lecturer of the course was given a free hand in defining the content and teaching methods; institutional review for the course was not required. The course was a “survey of the discipline” and was not revolutionary in content or methods. Each week covered a topic, 12 in total, which were Introduction, Methodology, Demography, Family and Groups, Social Stratification, Social Mobility and Migration, Economy, Gender and Sexuality, Culture and Lifestyle, Deviance, Religion, and Ethnicity and Minorities, in that order. The syllabus of the course did not define learning goals worded as such but listed some “desired outcomes,” namely, to acquaint students with the sociological way of thinking and doing research, provide them with findings about Hungarian society, improve their analytical and creative thinking, and move beyond commonsensical interpretations of social phenomena.
The course was accompanied by a textbook (Andorka 2006), which, besides the translation of Giddens’s well-known textbook, is the only one available in Hungarian. It was originally published in 1997 and last updated in 2006. The lecturer emphasized to students that the learning material consisted mainly of his presentation slides, provided to students every week, and the material covered in the seminars, strongly suggesting that the textbook played a secondary role. The evaluation system of the course relied most heavily on two multiple-choice tests written at halfway and at the end of the semester, worth 80 points together. A further 20 points could be gained from small tests covering set readings. Evaluation was done on the basis of a total of those 100 points. Additionally, extra credits were available for class activity and project work. Student feedback indicated that the course was thought to be useful, and the lecturer was very popular.
There were three data-gathering waves, all involving the same students. The first wave (T1) was conducted during the very first week of the semester (September 2015), while the second wave (T2) was done during the last week (December 2015). The third wave (T3) was done in June 2018 for majors at the Faculty of Social Sciences and in December 2018 for LA students. T1 and T2 were conducted in class, whereas in T3, students were reached right after their bachelor-level thesis defense. In T1 and T2, students were rewarded with six extra points in the course for participation. Table 1 summarizes the sample size and composition for each wave.
Overview of the Sample in Waves T1, T2, and T3.
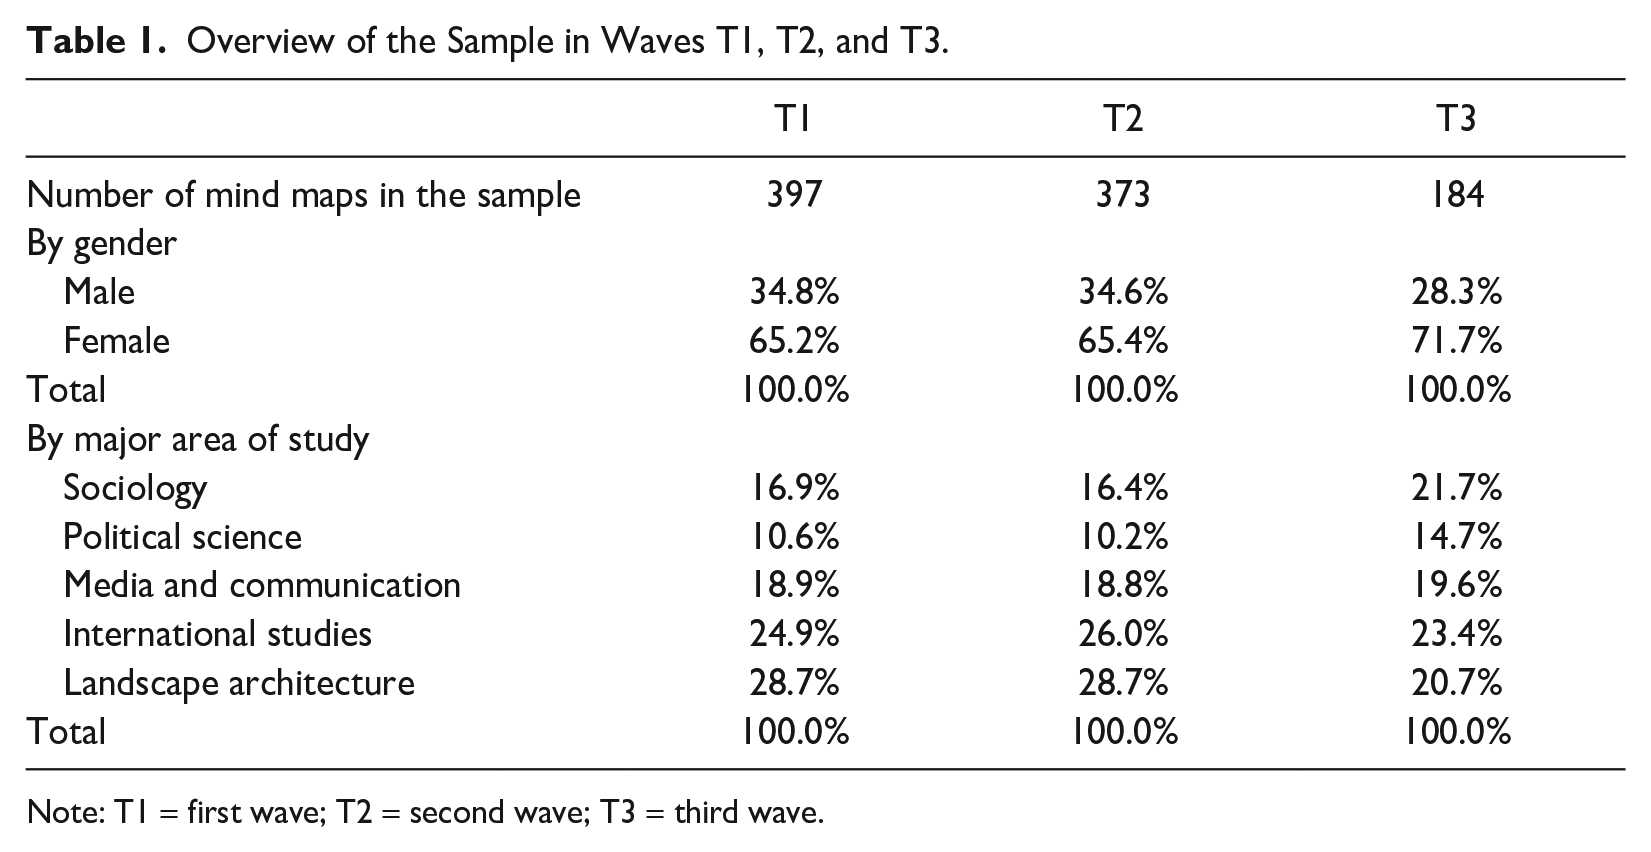
Note: T1 = first wave; T2 = second wave; T3 = third wave.
The total number of students enrolled in the course was 428, therefore the sample sizes of 397 and 373 in T1 and T2, respectively, mean a 92.8 percent and 87.1 percent coverage. By T3, only 43 percent of all students was reached. The composition of the T3 sample is visibly different from earlier waves in that female, sociology, and PS students are overrepresented and male and LA students are underrepresented. The majority of students came from a solid middle-class background. Out of the T1 sample, 74 percent of students had at least one parent with a university degree.
At the time, institutional review for the research was not required because the institutional framework for it had not yet been established at the university. The lecturer was aware and supportive of the research, and the leader of the Institute of Sociology and Social Policy was also informed and gave their approval. The author of this article was a teaching assistant in the course and did not hold the lecture or any of the seminars.
Features and Limitations of the Data
The data come from mind maps that students drew around the central concept of “sociology.” A mind map is a drawing containing portions of text (nodes) connected with lines branching out from a center. Before doing their own, students were shown a simple example of a mind map prepared by the researcher, drawn around the concept of “university,” which included associations such as “classes,” “campus,” or “students.” Respondents did not receive instruction about possible uses of mind maps as learning tools, and mind maps were not used in the introductory course in any capacity. The instruction given to students was worded as “What comes to your mind when hearing the word sociology?” Students were given roughly 20 minutes to work on their mind maps. Students were aware that the mind maps they drew did not influence their evaluation in the course.
Using mind maps as a data source has a number of advantages. First, because of the instruction being minimal and there being no cues, the researcher exerts no influence on responses. Moreover, because everybody is allowed to express their mental content freely, there is no pressure to use specialized vocabulary. Finally, the material is rich in content and lends itself to several ways of analysis (Umoquit et al. 2011; Wheeldon and Ahlberg 2011). For example, a subset of the data analyzed in the following was investigated before from a “learning” point of view in a quantitative way, in the vein of pretest-posttest studies (Miskolczi and Rakovics 2018). The mind maps given by students typically contained concepts or things that could be named with one word. In every data-gathering wave, out of all the nodes in all the mind maps, 72 percent to 76 percent was a single word. This suggests that students in general did not aim to convey complex messages.
Some features of the study and the data can be regarded as limitations. First, sampling was not random, and although the sample was close to complete in T1 and T2, in T3, it was selective for those students who completed their studies in the preassigned time frame. The research does not aim to purport that its results are statistically generalizable, and nonrandom sampling prohibits such claims anyway. Measures of statistical significance are nevertheless reported in the following in respect of standard practice. One further limitation is that students had no extrinsic motivation to participate in the T3 wave. Finally, while the nature of mind map data is very amenable to answering a “what do students think” question, it cannot show why they think that, and it also cannot show whether they gained procedural knowledge or skills. Data were treated and conclusions drawn accordingly.
The Method of Data Analysis
The method applied was content analysis because the goal was to give a quantitative summary of the message of a large body of text (Neuendorf 2017). Mind maps were treated as texts, and everything contained in them was accepted as being connected to sociology in the student’s mind.
Dictionary building
First, a dictionary of search terms was built. The process was both deductive and inductive. Based on the presentation slides of the lecturer, every author named therein, and every concept that was either set in bold, was given a definition, or was a slide heading was included in the list. Further items for the dictionary were arrived at by looking at word counts from the data in every wave. In the next step, the tentative items of the dictionary were checked for their validity. This was done by looking at all the mind map nodes that contained a given search term. That check helped ensure that, for example, the nodes brought up by the search term soci* indeed referred to “supra-individual phenomena in human life” like a sociologist would assume, such as society and all things social or societal, and not to something nonsociological such as ant society or dissociative disorders. Eventually, the dictionary contained 396 terms. Every term was treated as a variable with two possible values: 1 if present in the respondent’s mind map and 0 if not.
The majority of dictionary items referred to things or concepts that could reasonably be accepted as true and conscious references to sociological topics, such as demography, stratification, inequality, race, or deviance. However, some items of the dictionary, mostly ones brought up by word counts, were much less clear in their meaning. Words such as conclusion, connection, difference, effect, phenomenon, problem, process, and relationship, most often used in the plural, were abundant in student mind maps, often as nodes on their own. The meaning of such terms was checked in context manually. In several cases, it turned out that a “problem,” for example, was clarified in context on the mind map (e.g., sociology–problems–poverty/discrimination/alcoholism), but in others it was still not (e.g., sociology–social science–problems, where it is not clear whether problems refer to social problems such as the previous example or to scientific problems such as that of structure and agency). After the manual check, the meaning of the aforementioned terms was either resolved or was assigned as “vague.”
Theme creation
Next, the terms of the dictionary were sorted into themes, the names of which hopefully speak for themselves and, when not, are described briefly as they appear in the text. Themes, once again, were arrived at both deductively and inductively. First, the topic structure of the introductory course was taken into account because it was likely to influence students’ thinking, resulting in themes such as Demography, Deviance and Crime, religion, or Social mobility, most often referenced by those very words on mind maps. Next, some themes were inspired by the literature on the sociological core, namely, the Sociological Literacy Framework (Ferguson and Carbonaro 2016). Sociology as a way of thinking, Society as a higher order (structural) entity, and Social change were such. It has to be noted that words of the dictionary were always taken at “face value,” for example, a mere mention of “family” counted toward the theme Family but was not interpreted as a reference to a structural element of society. Similarly, one item of the dictionary only counted toward one theme; for example, mobility was sorted to the theme of Social mobility and not grouped also to Social change.
Lastly, the data also influenced some decisions about theme creation. For example, the richness of concepts belonging to the general topic of inequality allowed for the creation of the separate themes (a) Inequality and stratification for terms referring to material differences, class, and poverty and (b) Conflict and injustice, involving more “active” terms such as discrimination, exclusion, and segregation. The theme Student experiences (mentions of the class, the instructors, the tests) was also established after its presence in mind maps became clear. The most significant inductive theme, however, is that of Vague terms, which contains terms that occurred in high numbers, but their exact meaning could not be established even after a manual check, as described in the previous section.
Eventually, 34 themes were created. The number is high but is justifiable by the intention to grasp the thematic richness of the source material. Every theme was a variable either present (value = 1) or not present (value = 0) in a mind map. For a theme to earn the value 1, the presence of only one term of the dictionary belonging to it was sufficient. The dictionary building and theme construction was a solitary effort by the author.
Results
Knowing that 34 themes could be present (or not) on every mind map, theoretically, 234 different types of mind maps could exist. The number of actual types were 367, 359, and 179 in T1, T2, and T3, respectively, while the greatest number of the same type (i.e., containing the exact same themes) were 6, 5, and 3.
Average Mind Maps and Theme Patterns
To give an overview of such a diverse set of data, “average mind maps” were constructed for each wave. First, the average number of themes mentioned by students was calculated. Next, a relative frequency was calculated for every theme showing what proportion of respondents mentioned them. Themes were then ranked by relative frequency, and the first n items of the ranking, n corresponding to the average number rounded in the normal way to the nearest integer, were included in the average mind map.
Quantitative overview
The figures in Table 2 show that the whole sample, both genders, and almost all majors mentioned the greatest number of themes in T2 and the lowest in T3. Paired-samples t tests showed that the differences between the number of themes mentioned in separate waves were also statistically significant for the whole sample and almost all subgroups analyzed. In T1 and T3, the average mind maps of sociology students contained significantly more themes than those of all other majors, but in T2, they were fractionally overtaken by MC and IS students, although the difference was not statistically significant. The average number of themes for LA students was significantly lower than the rest in all three waves. Female students mentioned more themes on their mind maps than males in all waves, but the difference was only significant in T2. All the aformenentioned claims about statistical significance are true at a p < .05 threshold.
Average Number of Themes on Mind Maps in Each Data-Gathering Wave (T1–T3), by Gender and by Major Area of Study.
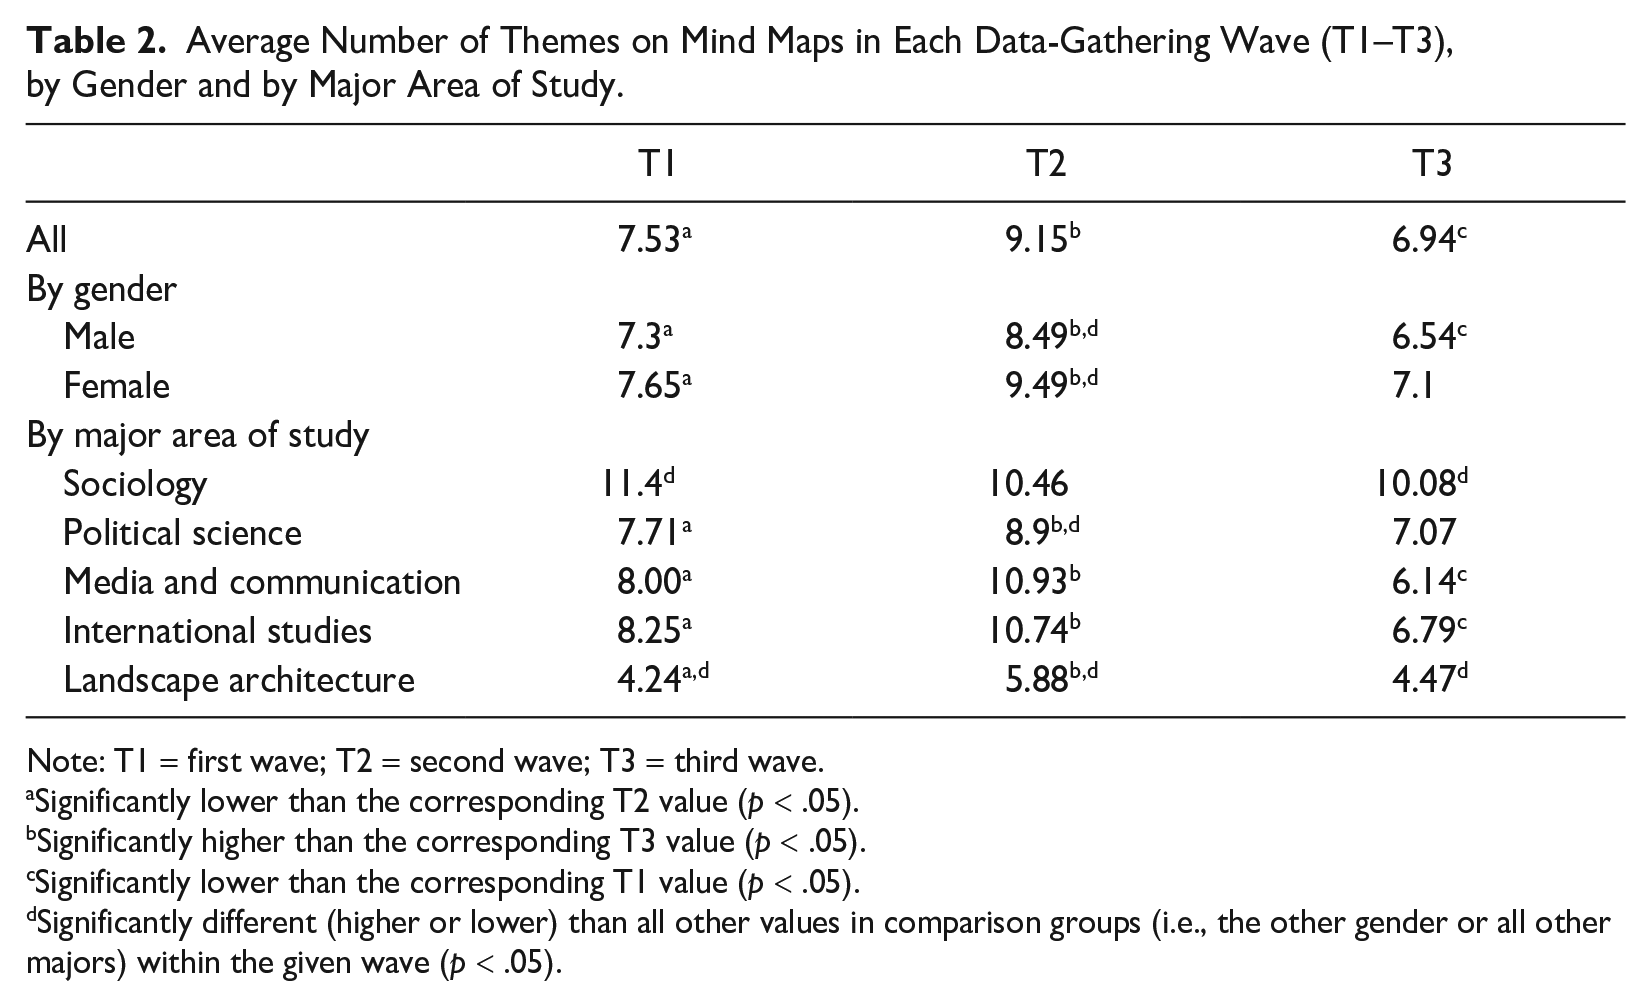
Note: T1 = first wave; T2 = second wave; T3 = third wave.
Significantly lower than the corresponding T2 value (p < .05).
Significantly higher than the corresponding T3 value (p < .05).
Significantly lower than the corresponding T1 value (p < .05).
Significantly different (higher or lower) than all other values in comparison groups (i.e., the other gender or all other majors) within the given wave (p < .05).
The most frequent themes
Table 3 summarizes the average mind maps for each wave by showing which themes were present in them, providing relative frequency values as well. The main finding is that there were only two themes that appeared on the average mind map in all three waves (called “staples”), both indicating basic and largely unspecified knowledge about sociology. The first theme was named It’s about people, and it signifies the presence of key terms such as social, society, people, group, and community, showing that students were aware that sociology dealt with supra-individual phenomena of human life. The second theme was that of a Scientific/empirical endeavor, signaled mostly by the words science, research, and to a lesser extent, theory, which indicate that students were aware of the scientific nature of sociology. The relative frequencies attained by these two themes, at least 72 percent in each wave, overshadow the numbers of all others.
Themes on Average Mind Maps for the Whole Sample in T1, T2, and T3.
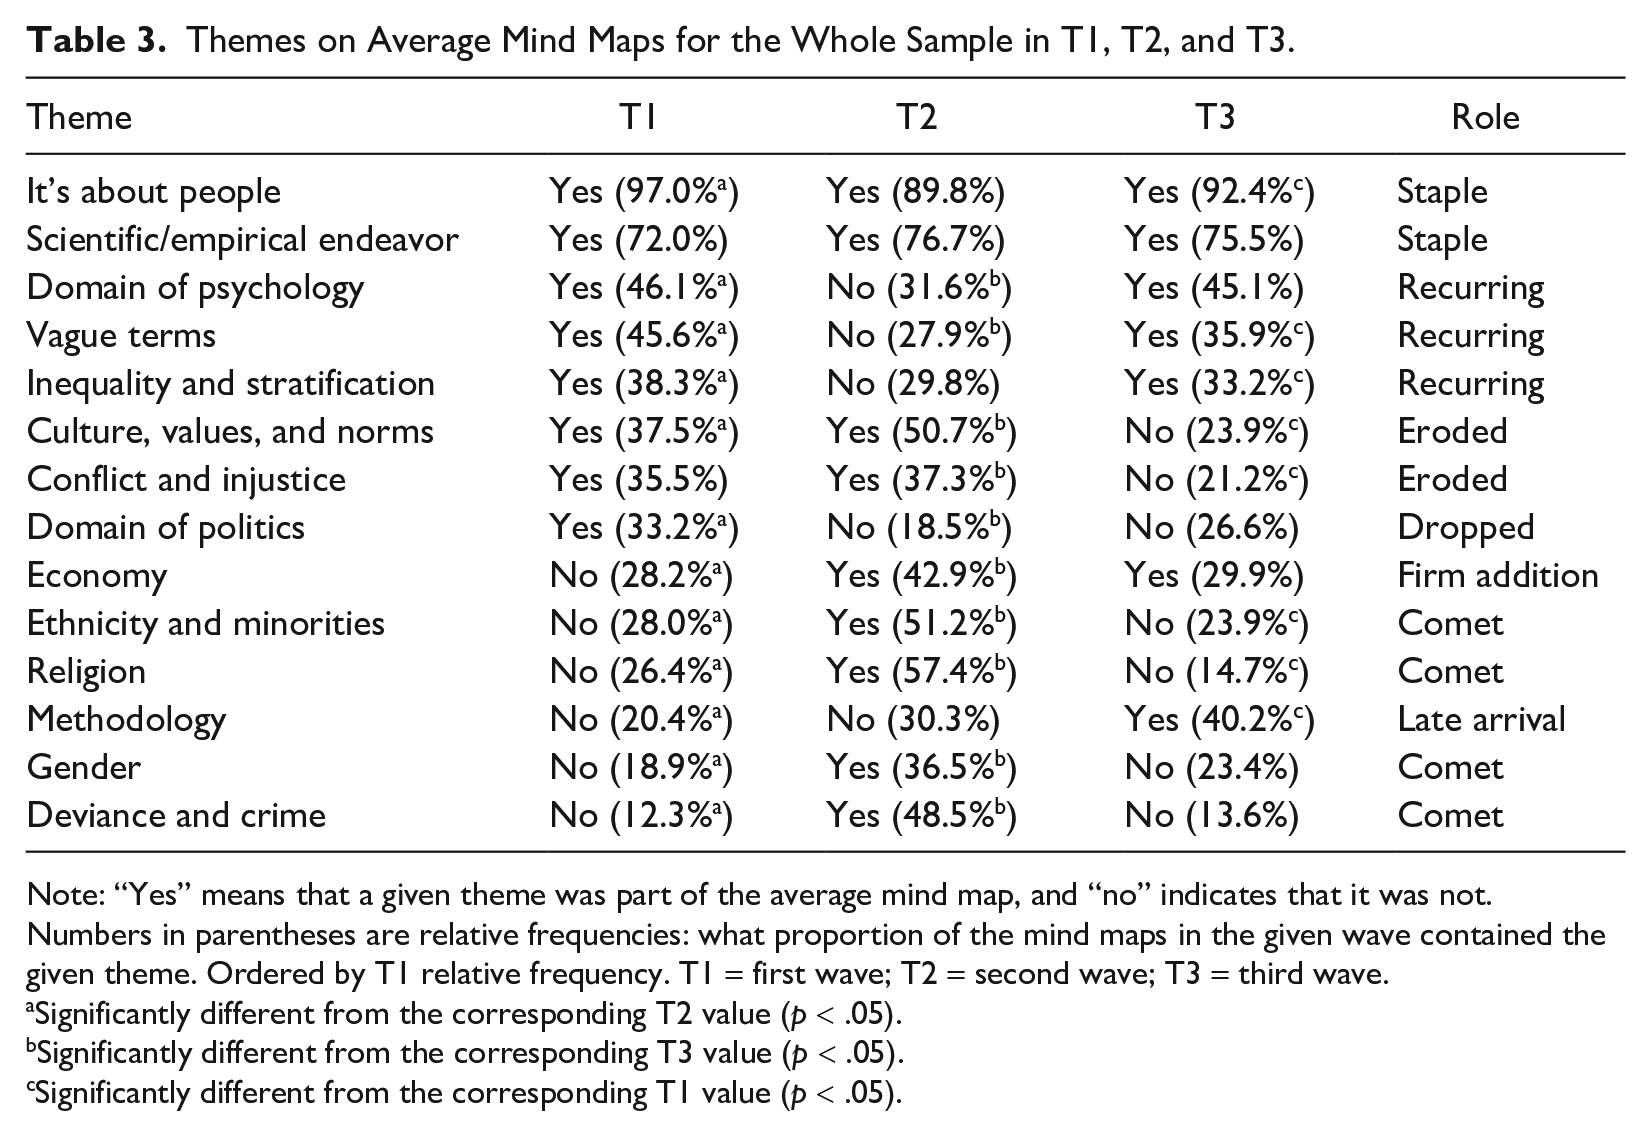
Note: “Yes” means that a given theme was part of the average mind map, and “no” indicates that it was not. Numbers in parentheses are relative frequencies: what proportion of the mind maps in the given wave contained the given theme. Ordered by T1 relative frequency. T1 = first wave; T2 = second wave; T3 = third wave.
Significantly different from the corresponding T2 value (p < .05).
Significantly different from the corresponding T3 value (p < .05).
Significantly different from the corresponding T1 value (p < .05).
The diversity of student views about sociology
In all three waves, the aforementioned two themes were followed by a “long tail” of others never scoring above 60 percent relative frequency and not even above 50 percent in T1 and T3. In T1, 13 themes had a relative frequency between 20 percent and 60 percent; in T2, there were 16 such themes; and in T3, there were again 13. In all, there were 19 themes, more than half of the total 34, that scored a relative frequency between 20 percent and 60 percent in at least one wave, suggesting that students had diverse thematic associations about sociology. Out of those 19 themes, 12 made it to the average mind map in at least one wave. Out of those 12, 6 appeared on the average mind map in two waves and 6 only once, and the relative frequency scores of themes in separate waves were significantly different in most cases (see Table 3). This suggests that there was a level of volatility in the mental content of respondents about sociology over time. The “roles” assigned to themes in Table 3 are intended to grasp that volatility in a meaningful way. Overall, the average mind maps in T1 and T2 shared four topics, the ones in T2 and T3 shared three, and those in T1 and T3 shared five, suggesting that it was the T1 and T3 mind maps that were the most similar.
Average Mind Maps by Gender and Major
Average mind maps were constructed separately for genders and for majors as well. When it comes to comparing genders, the differences were quantitatively small (as shown in Table 2). The themes mentioned closely matched the ones on the average mind maps of the whole sample, and in each wave, at least five themes were shared between the average mind maps of both genders.
Table 4 provides an overview of average mind maps separately for each major by showing which themes appeared on them in which waves. The main takeaways are the following. First, in total, 19 themes appeared at least once on any major’s average mind map, further suggesting that students had diverse views about sociology. Next, average mind maps of MC and IS students were extremely similar and showed great volatility, having 16 themes showing up on them at some time, with a high number of topics only appearing in T2. Sociology students’ view about the field was more stable over time than that of others. They had the greatest number of themes appearing in all waves, and their average mind maps, containing 11 themes at T1 and 10 later, were made up of only 14 themes overall. Finally, the average mind maps of LA students were both quantitatively and qualitatively meager.
Description of Average Mind Maps by Major.
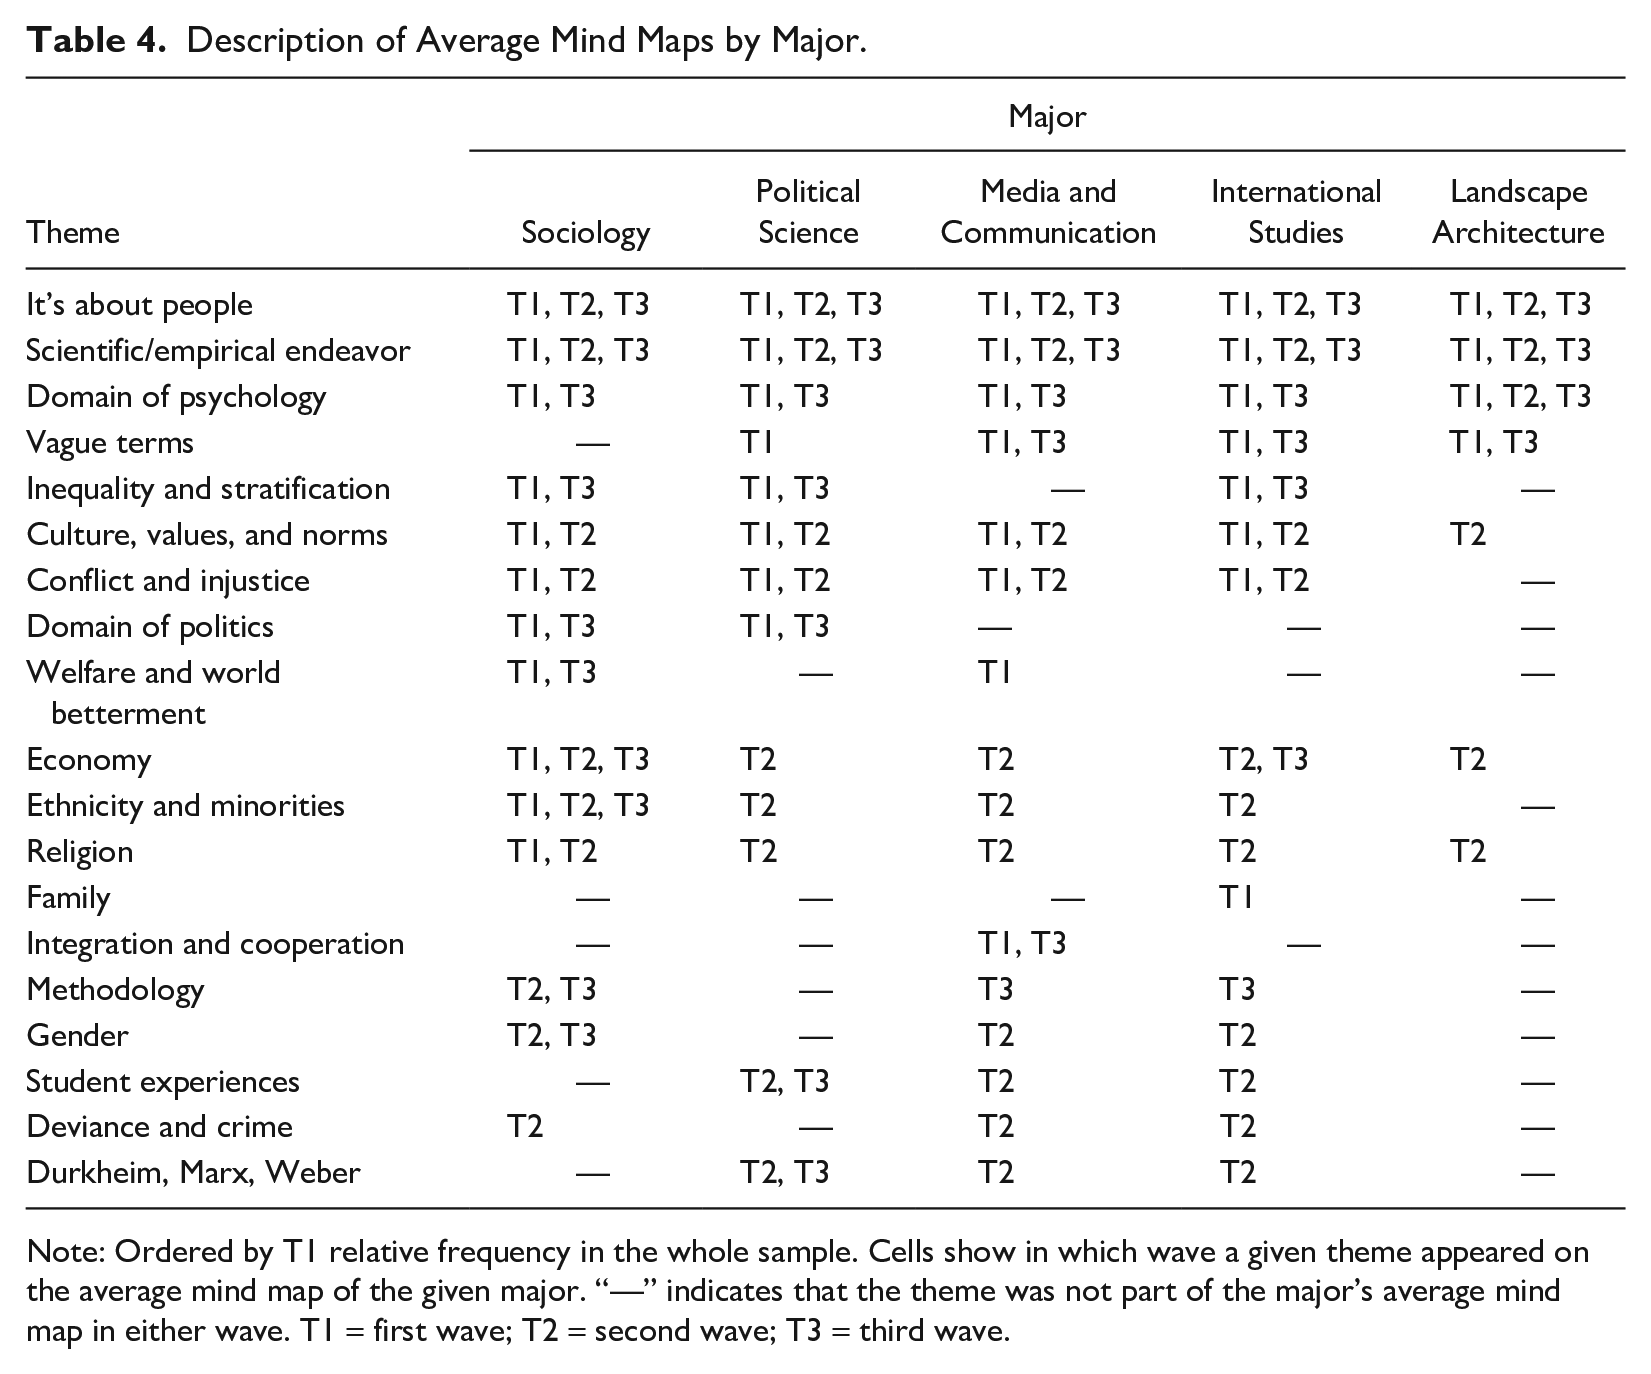
Note: Ordered by T1 relative frequency in the whole sample. Cells show in which wave a given theme appeared on the average mind map of the given major. “—” indicates that the theme was not part of the major’s average mind map in either wave. T1 = first wave; T2 = second wave; T3 = third wave.
Other Notable Results
Other notable results include the fact that the theme Social mobility, which had a week of its own devoted to it in the introductory course, was virtually absent from mind maps in all waves for all genders and majors (its best relative frequency score was 14.8 percent, in T2 among sociology students). Similarly, the theme of Migration was mentioned scarcely, only scoring above 10 percent in T1 overall and below that in all further waves. Social change barely scored above 10 percent in T1 and below that later; the fact that sociology involved a special way of thinking never recorded a relative frequency above 9 percent. The concept of socialization had its highest relative frequency in T2 at 4 percent. A possibly “exciting” theme, Sexuality, scored 16.9 percent in T2 but below 5 percent in other waves.
Description of the T3 Sample
As indicated earlier, the T3 sample was smaller and of a different composition than the previous ones, which might have distorted T3 results. Table 5 provides some information about students who were present only in the T1 and T2 samples compared with students present in all three waves.
Average Scores of Students Present in the Sample in All Three Waves, Compared to Those Present in Waves T1 and T2 Only.
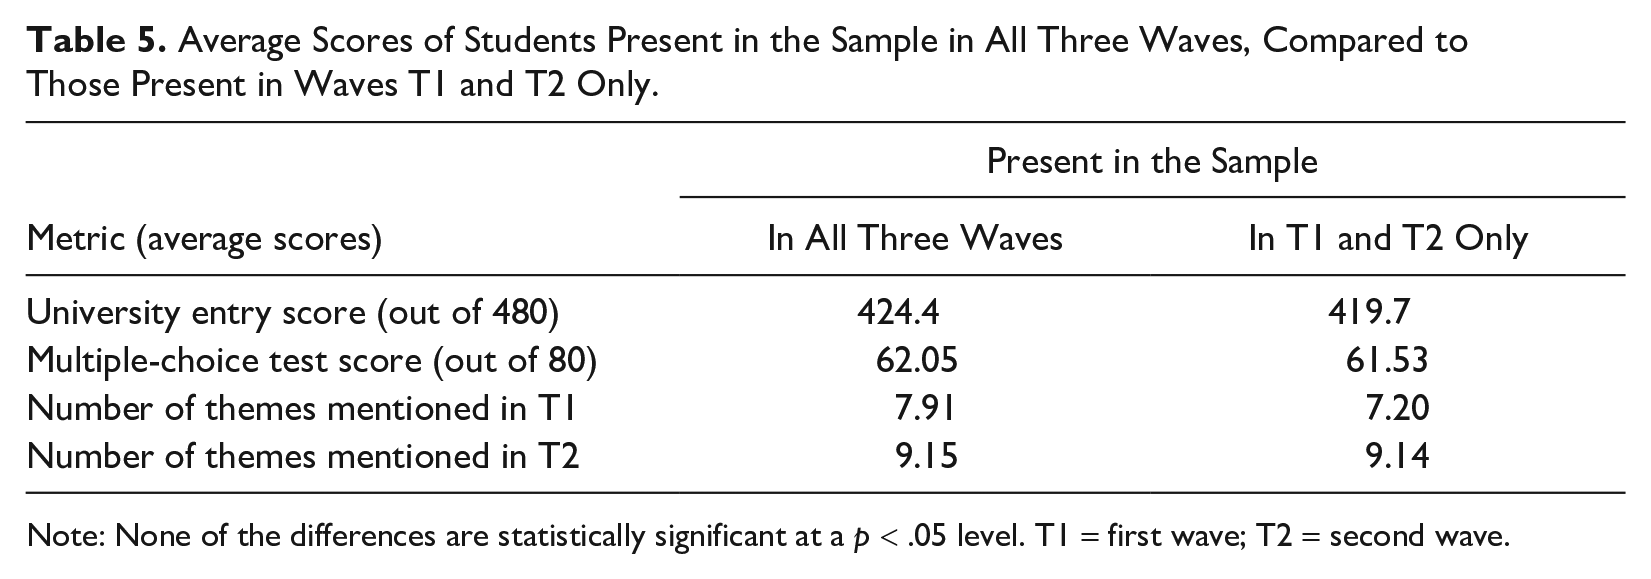
Note: None of the differences are statistically significant at a p < .05 level. T1 = first wave; T2 = second wave.
The data lend limited credence to the notion that students present in all three waves were academically superior to the rest of the T1 and T2 samples. They do score a little better on every metric shown in Table 5, but none of the differences are statistically significant. Eventually, the composition of the T3 sample was likely to have a limited distorting effect on T3 results. If anything, it could only “improve” them in terms of quantitative and qualitative richness, not even because the T3 sample was composed of academically superior students but because sociology and female students were overrepresented in it.
Discussion
The present study was not a controlled experiment, which makes it unknowable why exactly students produced the mind maps they did in the separate data-gathering waves. However, it can be assumed that at T1, they worked on their prior knowledge, whatever its source, and that at T2, their responses were heavily influenced by the education in sociology that they had freshly received. In the long term, by T3, the mental image they formed around sociology must have come from multiple sources: first, their prior ideas that the course did not dislodge; second, memories remaining from the intro course; and third, further experiences, mostly studies in their respective fields. Theoretically, elements of those further experiences could have been linked to things encountered in the intro course, thereby reinforcing some themes. The following discussion assesses some of the key results of the research.
What Students Do Know
The fact that an overwhelming majority of students associated the themes It’s about humans and Scientific/empirical endeavor with sociology is probably welcome, as is the fact that “the centrality of inequality” (Ferguson 2016:6) is reflected on average mind maps in all three waves because these findings show that students have a sound basic idea of our field. The fact that respondents typically did not associate a wide variety of topics with sociology in T3 echoes the findings of Medley-Rath (2019) about students relying on a limited range of broad sociological topics in their work. In the case of students not majoring in sociology, probably not much more can even be expected knowing that they did not receive further education in the field.
Changes over Time
Two things are especially noteworthy about how students’ mental image of sociology changed over time. The first is that there were a high number of “comet” topics, ones that only showed up in T2 and no other wave, on the average mind map of the whole sample and several majors separately as well. Those themes, Deviance and Crime, Ethnicity and Minorities, Gender, and Religion, correspond to topics that were covered in the second half of the semester in the course and were part of the second multiple-choice test written in the same week as the T2 data gathering. That supports the notion that student knowledge is “an artefact of requirements” (Bandini et al. 2016:415). For the majority of students in the sample, completing the course was likely just a step toward earning the degree and not conceived as a means to personal enrichment, leading to a short-term strategy of studying for the test and not for deep incorporation of knowledge.
The second finding worthy of attention is that the smallest number of themes on average mind maps was found in T3. That result is consistent with research on long-term learning that shows that over a span of two to six years, students typically forget 70 percent of a learned material (Conway, Cohen, and Stanhope 1992; Landrum and Gurung 2013). Looking at the exact themes making up the average T3 mind map of students, however, reveals something more intriguing. On the one hand, there are welcome new additions compared with the initial T1 state, namely, the themes of Economy and Methodology (references to various quantitative or qualitative research methods). On the other hand, in T3, students relapse into mentioning the Domain of psychology (references to psychology, to emotions and behavior) more frequently than anything else beyond the two staple themes, and Vague terms also recur. The recurrence of Vague terms in T3 is comparable to Medley-Rath’s (2019) finding that students used “unclear” captions in their visual sociology exercises.
“Exciting” and Controversial Topics
Research on learning suggests that students remember “exciting” or interesting topics such as sexuality or deviance easier than they do “drier” ones (Landrum and Gurung 2013; VanderStoep, Fagerlin, and Feenstra 2000). Results of the present study do not necessarily support that notion. Out of some viable candidate themes for an “exciting” status, only Deviance and crime and Gender showed up on the average mind map of students as comets in T2, while Sexuality never made the cut. Knowing that the T1 and T2 data gathering was conducted in the second half of 2015, when public discourse in Hungary was heavily occupied with the European “migration crisis” (Bocskor 2018), the theme of migration could also have easily showed up, but in fact, it barely seemed to register with students. Knowing the country, the theme of Ethnicity and minorities can be considered controversial, but it only played a comet role. While it has to be noted that several of the aforementioned topics were more salient for sociology students when investigated separately, the results suggest that such topics either did not excite students after all or that students were possibly afraid of mentioning them or were simply reluctant to adopt new ideas beyond the ones they had already had, again echoing the findings of Medley-Rath (2019).
Landscape Architecture Students
In this study, LA students represented a “lay audience” with no favorable disposition toward social sciences. Indeed, their average mind maps show very little idea about sociology beyond the basic understanding of it being a social science. Presumably, these students encountered several issues during their studies that a sociologist would readily consider “social.” The fact that they failed to connect those to the field of sociology suggests that the intro course did not provide them with suitable foundations or “hooks” on which to hang new pieces of knowledge. The practicable insight from this finding is that at least in this case, a single IntroSoc course was not suitable to serve diverse majors and that different audiences might require separate intro courses as suggested by Greenwood (2013:236).
The Persistence of Psychology
The fact that psychology’s relation to sociology was so persistent in the minds of students overall is worthy of attention. Most probably it is not a product of the course. It is true that the introductory course made references to psychology more often than to any other social science. Yet it was exactly right after the course, at T2, that the theme Domain of psychology scored its lowest relative frequency. While it is also true that students of social scientific majors did have dedicated psychology courses during their studies between the T2 and T3 waves, they also had mandatory economics, political science, philosophy, and law, none of which came close to being mentioned as frequently in T3 as psychology. Moreover, LA students had no psychology in their curriculum, but still they kept on associating it with sociology. This finding at the very least does not contradict the suspicion that students struggle to see the exact boundaries between sociology and psychology and that IntroSoc courses should put extra emphasis on delineating the differences between the fields.
Sociology Students
The mental image of sociology students about their own field was relatively stable over time, with several themes appearing on their average mind maps in at least two waves. While it is true that the number of themes they mentioned actually decreased by 1 from the high mark of 11 in T1, majoring in the field probably furnished them with a depth of knowledge that the mind maps did not (and the present analysis did not intend to) capture. What is notable about the average mind maps of sociology students is the recurrence of the themes Domain of politics and Welfare and World betterment (references to solutions, help, civil society, equal opportunity) in T1 and T3. This finding allows the interpretation that students of sociology are not only interested in scientific investigations of the human world but also in ways of acting on it or changing it. That rhymes with the finding of Bandini et al. (2016) of students reporting that they became more compassionate during their sociology studies. Such an inclination toward civic commitment is often encouraged among the learning goals of IntroSoc courses (Ferguson 2016; Persell et al. 2007), but it has also received criticism (Miskolczi and Király 2016).
Applicability of Findings
As stated previously, the data were obtained by way of nonrandom sampling at a Hungarian university, and claims of statistical generalization are out of the question. However, there are reasons to believe that the results of this study are not the idiosyncratic products of the cultural context and might be informative to educators in sociology elsewhere, too. The content of the course was fairly standard for a Western cultural context, and the “survey textbook model” that the course followed (cf. Ferguson and Carbonaro 2016:165) is also still widely practiced. Furthermore, some topics that might have been special for the time and place, mainly migration, did not leave their mark on students’ mental image of sociology. For those reasons, and also keeping in mind the parallels found between the findings of Medley-Rath (2019) and those obtained herein, it is probably safe to assume that the general lessons learned from the present study might be applicable in the United States or other Western societies.
Conclusion
As the literature indicated, IntroSoc courses are now designed with practicable learning goals in mind, but many in the field believe that the course is capable of contributing to several ambitious goals. The present article aimed to describe a general “mental image” that students of an intro course formed about sociology at three points in time. Similar qualitative-longitudinal studies have been scarce.
Some of the findings were in line with what could be expected, for example, that students had the richest picture of sociology right after studying the course and that years later, their views were simpler. The fact that sociology students had a richer view of their field at the end of their BA studies than students of other majors is reassuring. However, the finding that the mental image of students years after taking the course is most similar to the one they had had before even studying it provides reason for reflection. Even if expecting long-lasting effects from just one introductory course is not realistic, an almost total lack of change in initial ideas of students is still remarkable. If nothing else, it probably suggests that the particular IntroSoc course studied herein could have done a better job of captivating students.
Practitioners in the field emphasize the importance of a good public image of sociology as a well-defined science with a proprietary subject matter. Results here indicate that while students do have a sound basic understanding that sociology is a science dealing with human life and that they are aware of the importance it places on studying inequality, they probably also have a hard time differentiating it from psychology and think about it in vague terms. Those insights can inform decisions about course design.
Footnotes
Acknowledgements
I thank the reviewers of the manuscript for their valuable suggestions that helped improve the article’s quality. I thank the lecturer of the introductory course studied, Gábor Király, for his enduring support.
Editor’s Note
Reviewers for this manuscript were, in alphabetical order, Stephanie Bradley, Stephanie Medley-Rath, Mary Senter, and Myron Strong.