
Abstract
Keywords
In recent years, promise (or “free college”) programs have become increasingly popular solutions to address issues of college access and affordability (Billings, 2018a; Miller-Adams, 2015). These programs provide scholarships to cover tuition (and sometimes fees) and are unique because their eligibility criteria emphasize residency—where students live or attended a K-12 school rather than other common eligibility criteria such as academic merit or financial need (Billings et al., 2021; Miller-Adams, 2015). Existing research suggests that promise programs increase college enrollments (Carruthers & Fox, 2016; Page et al., 2019). For instance, Li and Gándara (2020) found that promise programs increased the number of first-time, full-time undergraduate students at public, 2-year colleges by 22%, while Nguyen (2020) found a 40% enrollment increase. Programs are especially effective at increasing enrollment numbers for historically underserved populations, specifically Black and Hispanic students (Billings, 2018b; Gándara & Li, 2020; Nguyen, 2020).
With these large enrollment increases at community colleges, additional resources are needed to ensure that students make academic progress and reach their educational objectives. Numerous studies suggest that higher levels of spending, especially on instruction, are associated with improved student outcomes at community colleges (Bailey et al., 2006; Belfield et al., 2014; Thompson & Riggs, 2000). Previous research has found examples of promise programs that expanded student success programs, such as priority registration, specialized promise advisors, and career and professional development (Burkander, Ballerini, et al., 2019; Burkander, Kent, et al., 2019; Meehan et al., 2019). However, not all colleges have sufficient resources to support their promise students. Examples include Tennessee, Nevada, and Oregon, where community colleges were unable to create or maintain these types of student services due to limited resources or discontinued funding sources (Ballerini et al., 2019; Burkander, Kent, et al., 2019; Meehan et al., 2019). Therefore, it is important to examine how community colleges spend their money after implementing a promise program, especially if these programs induce students to attend college who otherwise would not attend, or attract students who would have attended 4-year universities.
Our study examined the spending patterns of 30 community colleges with promise programs. We focus on this institutional sector because approximately two-thirds of programs are located at community colleges (Billings, 2018a). We limited our sample to programs that only allow students to use their scholarship at one institution, because the effect of the program is concentrated rather than being spread across multiple institutions. Using data from multiple sources, a generalized difference-in-differences (DD) approach, and event-studies, we addressed the following research questions:
What is the effect of promise program implementation on community college expenditures (including total expenditures and individual expenditure categories)?
Does the effect of promise program implementation on community college expenditures vary by the funding source for the program (public, private, and a combination of both)?
Literature Review
The introduction of a promise program could affect a community college’s expenditures in various ways, including increasing the institution’s revenue streams and/or changing how the college allocates its resources across various budget categories. Much of the research on higher education policy and finance has focused on macro-level financing, such as how state and local appropriations are allocated to colleges (e.g., Dowd & Grant, 2006; Melguizo et al., 2017), while less attention is paid to how policies affect budgeting decisions within colleges.
Institutional expenditures are important because they help predict college retention and completion (Thompson & Riggs, 2000; Titus, 2006). Bailey et al. (2006) found that an additional $1,000 spent on instruction per-FTE was associated with a 1.3% increase in graduation rates at community colleges. In a study of Tennessee community colleges, institutions that spent a greater share of their budget on academic support, instruction, student services, and operations and maintenance reported better than average outcomes in the state’s performance-funding model, including standardized test scores, maintenance of accreditation, survey scores, retention rates, and job placements (Thompson & Riggs, 2000). In contrast, community colleges that spent more on institutional support, public service, and scholarships and fellowships tended to perform below the mean on these performance measures (Ishitani & Kamer, 2020; Thompson & Riggs, 2000). Although the relationship between expenditures and student success is complex (Calcagno et al., 2008), research suggests that increasing student persistence and completion requires sizable investments in institutional expenditures (Belfield et al., 2014).
Promise Program Effects on Community Colleges
Our study builds on prior research on the effects of promise programs on community colleges. We also garner insights from case studies of promise programs, which reveal how operations change within institutions, and summarize the more limited literature on program effects on expenditures. Previous research has found significant increases in enrollment at promise-eligible colleges; for example, among statewide promise programs affecting community colleges, studies of the Oregon Promise have demonstrated a 4.0 to 5.3 percentage point increase in the percentage of high school graduates enrolling in 2-year colleges (Burkander, Kent, et al., 2019; Gurantz, 2020; Zumeta & Huntington-Klein, 2020). Similarly, the Tennessee Promise increased the percentage of high school graduates enrolling in 2-year colleges by 6 percentage points (Zumeta & Huntington-Klein, 2020). Knox Achieves, a predecessor to the Tennessee Promise, increased the likelihood of college entrance directly after high school by 3.5 to 4.0 percentage points (Carruthers & Fox, 2016), and increased total first-time, full-time enrollment at eligible colleges by as much as 40% (Nguyen, 2020). Higher enrollments can lead to higher total spending, because more students create a greater demand for support services (Getz & Siegfried, 1991).
Promise Programs and Operations at Community Colleges
Research examining how colleges have changed their operations or expanded the scale of services after the introduction of a promise program is instructive for understanding patterns in spending categories. In a survey on the financial sustainability of promise programs, over 70% of respondents stated their programs offered support services, including academic counseling, career counseling, mentoring, summer orientation, and bridge activities (College Promise, 2020). Other examples of supports include textbooks, laptops, campus meals, or access to food pantries (Rauner & Smith, 2020). To inform our understanding of how expenditures change after promise program adoption, we draw on empirical findings from previously cited studies, a case study of four single-institution promise programs (Perna et al., 2020), and case studies of statewide promise programs (Ballerini et al., 2019; Burkander, Ballerini, et al., 2019; Meehan et al., 2019).
The studies reviewed identified potential changes in personnel spending, especially in the areas of academic and student support. Some colleges hired additional staff, including promise coordinators (Ballerini et al., 2019; Monaghan & Attewell, 2023), while others did not (Odle & Monday, 2021; Perna et al., 2020). In some cases, staff members’ existing responsibilities shifted to accommodate promise-related tasks (Monaghan & Attewell, 2023; Perna et al., 2020). For instance, with the Tennessee Promise, eligible colleges hired new or additional success coaches and advisors for promise students and launched early alert systems, which presumably required additional spending on personnel (Meehan et al., 2019). In Perna et al.’s (2020) study of last-dollar programs, some required students to meet with their advisors or participate in summer bridge programs. At one college, staff tracked student academic progress and reached out to students on the margin of renewal eligibility to provide individualized advising and coaching. These changes could lead to additional expenditures in academic support or student services (funded by new revenue), or redistributed resources within a college. Alternatively, in some cases, existing staff members may shoulder additional duties if colleges do not hire supplementary personnel (Odle & Monday, 2021). One study of a promise program in the Midwest found that a single staff member was hired to support the program. The program was additionally staffed by other personnel who were either reassigned from other units or who took on new responsibilities (Monaghan & Attewell, 2023).
It is important to note that promise-specific services are sometimes covered by external entities, although outside funding streams can be temporary. For instance, in Oregon, institutions initially received funding from the state to implement a first-year experience program, hire a student success team, and provide professional development. However, the state discontinued that funding stream in subsequent biennia. At least one college used its own resources to continue to fund a staff position to support promise students (Burkander, Kent, et al., 2019).
Promise programs could also increase spending on recruitment and marketing for the program, such as by sending out mailings (Burkander, Ballerini, et al., 2019) or hiring student support specialists to help high school students apply for the program (Perna et al., 2020). However, similar to student services expenses, marketing costs are not always fully incurred by the participating college. For instance, in the Tennessee Promise, these costs were shared by the colleges, state entities, and the nonprofit partner (Meehan et al., 2019).
Promise Program Impacts on College Expenditures
Two studies have evaluated whether resource re-allocations occur within community colleges. Delaney and Hemenway (2023) explored whether community colleges with promise programs experienced changes to expenditures, finding that among 19 public 2-year colleges affected by single-institution programs, there was a 15.4% decline in student services spending and a 39% decline in public services spending (logged total). In contrast, they found no changes to spending on instruction, academic support, institutional support, or auxiliary enterprises. Among colleges most likely to be treated that were affected by multiple-institution programs, there was a 3.3% decrease in instructional spending, no changes in academic support, a 9.3% decrease in student services, a 59% decrease in public services, no changes in institutional support, and a 19% increase in auxiliary spending (Delaney & Hemenway, 2023).
Odle and Monday (2021) found somewhat similar patterns in their study of spending and staffing patterns following the implementation of the Tennessee Promise. Specifically, the program was associated with reduced spending per-FTE student (logged) on instruction (a 3.5–4.3% decline), academic support (4.7–7.9% decline), and institutional support (18.2–20.1% decline). On the other hand, the authors observed additional spending on scholarships (a 10.2% increase), and no changes to student services spending. The authors also found no changes to overall spending and concluded that colleges shifted their spending away from instruction, academic support, and institutional support and toward scholarships (Odle & Monday, 2021).
In these studies, there appears to be a diversion away from expenditure categories most directly tied to student success (excluding the financial aid that follows promise students). One potential explanation given for decreased spending on academic support was the increased levels of academic preparedness of students enrolling in colleges after the initiation of promise programs (Odle & Monday, 2021). Additionally, it is possible that not all costs, including costs for additional supports, were incurred by the colleges themselves, as these can be funded by external entities (College Promise, 2020). The state-funded Tennessee Promise provides services related to the administration of the program, including student outreach, which are expenses that colleges do not incur.
Our study departs from these previous studies in several ways. First, our samples and the time periods studied are different. We examine two more years compared to Delaney and Hemenway (2023), which allows us to include eight new promise programs that started in 2013 and 2014. The authors also draw from programs that they identify in previous work (Hemenway, 2018) as “community sustained,” whereas we restrict our sample to single-institution programs, which produces a different set of programs. Odle and Monday’s (2021) study examined a single promise program, the Tennessee Promise. As noted previously, findings from that study may not be generalizable to other 2-year promise programs, given the centralized administration of the Tennessee Promise (and thus reduced program administrative costs for participating colleges). Unlike both studies, we disaggregate the treatment effect of promise programs across publicly funded, privately funded, and mixed-funded because community colleges’ expenditure patterns may differ based on the funding source. Our estimation strategies also differ; although all three studies use DD, we use a distinctive approach to identify a control group and conduct event-studies following recent developments in analyzing the effect of time-varying treatment adoption (Sun & Abraham, 2021).
Conceptual Framework
Our analysis of the effects of promise program implementation is guided by resource dependence theory (Pfeffer & Salancik, 1978), which posits that the survival of an organization depends on its ability to secure critical resources from the environment. The theory predicts that an organization will spend money in ways that allow it to secure critical resources, which applies to higher education institutions. For instance, using this framework, Fowles (2014) examined whether growing reliance on tuition revenue among public institutions affected their expenditures. Consistent with resource dependence theory, the study finds that increased dependence on net tuition revenue led to higher spending on education and related expenses, a measure that includes the direct and indirect costs associated with instruction and student services. 1 We conceptualize the implementation of a promise program (the “treatment” in our analytic models) as an external or environmental force that can cause colleges to change their behavior in ways that are reflected in their expenditures. Behavioral changes would align with the interests of the constituency associated with the new source of revenue (i.e., new, or reallocated funds associated with the promise program). These changes would be manifested as changes in expenditures aligned with promise program goals—a primary one which is to increase credential completion (Miller-Adams, 2015). Guided by these perspectives, we pose two competing hypotheses, which we test empirically.
H1: The implementation of promise programs will produce increases in expenditures that align with the goals of those programs (increases in college access and credential and degree completion).
Drawing on prior literature on the positive relationship between spending in specific areas and improved student outcomes (e.g., Bailey et al., 2006; Thompson & Riggs, 2000), we expect higher spending in the categories of instruction, academic support, and student services at treated community colleges. Alternatively, we hypothesize the following:
H2: The implementation of promise programs will not result in any meaningful changes in their expenditures.
This may happen for several reasons, some of which are consistent with resource dependence theory. First, programs may utilize existing institutional infrastructure and other resources to fund their instruction, academic, and student support services (Perna et al., 2020). Programs may also respond to the demands of funders, but in ways that do not affect their spending on instruction, academic, or student support services (e.g., by investing in workforce initiatives). Both of these scenarios—using existing resources or responding to external constituencies in ways that are unrelated to instruction, academic, or student support services—are in alignment with resource dependence theory but would result in negligible changes to spending patterns. Moreover, community colleges have numerous stakeholders, some of whom may have competing interests. These include students (current and prospective), faculty and staff, donors, private business and industry, and policymakers. While a promise program may produce new demands, these may conflict with those of other constituents, leading to negligible changes in spending patterns.
It is also possible that resource dependence theory does not explain how colleges respond to the implementation of promise programs if external demands align with the existing goals of the organization. Community colleges may seek out partnerships that lead to a promise program (Monaghan & Attewell, 2023), rather than being passive recipients of the constraints imposed by the interorganizational relationships associated with the program. The new external constituency produced by the creation of a promise program does not constrain the organization, but rather enhances it, furthering or focusing its mission. Thus, the program would not produce meaningful changes in spending patterns.
Another possibility is that decision-making within higher education institutions is rife with ambiguity (March & Olsen, 1975). The garbage can model of organizational choice would lead us to expect null changes in spending, since the effects of promise program implementation would be idiosyncratic across colleges with differing internal dynamics (i.e., problem, solutions, and people) (M. D. Cohen et al., 1972).
Data
Promise Program Sample
To construct our dataset of promise programs and their features (establishment year, colleges affected, funding sources, etc.), we relied on program websites and publicly available databases from the University of Pennsylvania (Perna & Leigh, 2020), which houses a catalogue of local and state promise programs and characteristics such as need-based, merit-based, and first versus last-dollar distribution, and the W.E. Upjohn Institute, whose database of community-based and institution-based programs focuses on geographically-bounded, early awareness programs (Miller-Adams, 2015; Miller-Adams et al., 2022). When sources conflicted, we verified the information to the best of our ability using publicly available newspaper articles, websites, and press releases. 2 Our sample consists of 30 local-level promise programs, each of which is affiliated with a single community college. All programs awarded a scholarship with eligibility criteria based on students’ place of residence and/or school attendance. Our data spanned academic years 2001 to 2002 to 2015 to 2016 and included programs that started awarding promise scholarships between 2003 to 2004 and 2013 to2014, allowing for at least two pre-program years and two post-program years. From the Upjohn Institute, we collected information on each program’s funding sources (Miller-Adams et al., 2022): private, public, and mixed funding. Among the programs, 8 were privately funded, 7 were publicly funded, and 12 were mixed. There were three programs with missing data on funding sources and they were only included in the full sample analyses. Appendix A displays details on our sample of programs.
From the promise program databases and websites mentioned above, we identified a comparison group of colleges that did not have a promise program during our years of observation (i.e., 2001–2015) but were plausibly similar to our treated group because they eventually partnered with a promise program. These 39 community colleges partnered with promise programs between the years 2016 and 2020, and awarded scholarships that could only be used at a single community college. Because the treatment for these 39 colleges only took place after 2015, their institutional spending outcomes should not have been influenced by promise program adoption during our years of observation. In the meantime, different from colleges that have never had a promise program, this “late adopting” control group may have shared unobservable characteristics and externalities with the treated colleges that made them experience the treatment eventually. This approach has been used by similar studies in other fields (Alda, 2023; Shybalkina & Bifulco, 2019). 3
Institution and County-Level Data
We constructed a college-level dataset from years 2001 to 2002 to 2015 to 2016 using IPEDS and the Delta Cost Project (DCP). The reporting standards for the IPEDS Finance Survey changed across years, and DCP provided the variable mapping instructions to recreate variables. We incorporated these calculations, ensuring that the definition of each expenditure category remained consistent across time. We chose 2015 as our last year of analysis to allow for a substantial number of late adopting colleges for our comparison group.
Our outcome variables consisted of total expenditures per student (12-month unduplicated headcount), and expenditures per student in the categories of: (1) instruction (direct expenses for in-classroom academic, occupational, and vocational instruction); institutional support (operational support including administrative services, legal, logistics, public relations, etc.); academic support (including libraries, academic administration, and media); and student services (areas contributing to students’ emotional and physical well-being), as defined by the Integrated Postsecondary Education Data Systems (IPEDS, n.d.; see Appendix B for detailed definitions of spending categories). Other expenditure categories were excluded because of higher proportions of missing data. We adjusted all financial variables to 2015 dollars using the Consumer Price Index (CPI). We chose to analyze per-headcount versions of expenditures, because as referenced in the literature review, promise programs generate notable increases in enrollment. If we analyzed the raw amount of total expenditures, we would not account for the anticipated increase in enrollment, which would likely increase total expenditures due to the college serving additional students. Thus, enrollment-adjusted expenditure is a more accurate representation of the phenomenon we investigate—whether colleges allocate more or less per student.
Our inclusion of control variables was informed by prior research. Spending levels at community colleges could vary depending on institutional revenues, demographic characteristics, and economic features of the local community. First, spending levels could vary with levels of revenue (Bowen, 1980). Spending within individual expenditure categories could also be associated with changes in specific revenue categories. The revenue budget is heavily dependent on enrollment forecasts, changes to tuition rates, and projected state and local tax support (two prominent sources of community college funding; Dowd et al., 2020; Dowd & Grant, 2006). In all models, we controlled for the amount of revenues each college received from net tuition, local appropriations, and state appropriations (all logged), lagged by 1 year, allowing prior year’s revenue to affect current year’s spending.
To avoid overcontrol bias (Cinelli et al., 2022), we did not include variables for colleges’ demographic characteristics even though the demographics of a student body could play a role in how much community colleges spend across categories. We did not include a variable related to financial aid, since the treatment likely affects the share of students who receive financial aid, as most programs require FAFSA completion or Pell eligibility. Similarly, we excluded a variable related to the racial/ethnic composition of the student body, as prior research shows that promise programs differentially affect college enrollments across racial/ethnic groups (Gándara & Li, 2020; Nguyen, 2020). Instead, we relied on county-level demographic and economic characteristics, which do not constitute “bad controls” (Angrist & Pischke, 2009; Cinelli et al., 2022). County-level characteristics contribute to the revenues received by colleges and are an indicator of local socio-demographic circumstances surrounding colleges. Prior research shows that patterns in total spending, education and general (E&G) spending, and instructional spending differ across colleges depending on whether they are in low- or high-income counties (Kolbe & Baker, 2019). Healthier economic conditions increase tax revenues, which affect community colleges via local appropriations (Dowd et al., 2020). Moreover, local economic conditions are generally countercyclical to community college enrollment demand (COVID-19 pandemic notwithstanding), and enrollments tend to increase when poverty and unemployment rates are high (Toutkoushian & Paulsen, 2016). Economic downturns also require colleges to explore internal inefficiencies (Palmer, 2014), potentially impacting spending. Accordingly, using data from the Bureau of Labor Statistics and the Bureau of Economic Analysis, we controlled for county-level income per capita, percent of the population living below the poverty line, unemployment rate, and the population count (logged). Summary statistics are displayed in Table 1, across all 15 years, for the treated sample of 30 promise colleges (n = 450) and the comparison group of 39 “late adopters” colleges (n = 585).
Summary Statistics (2001–2002 to 2015–2016).
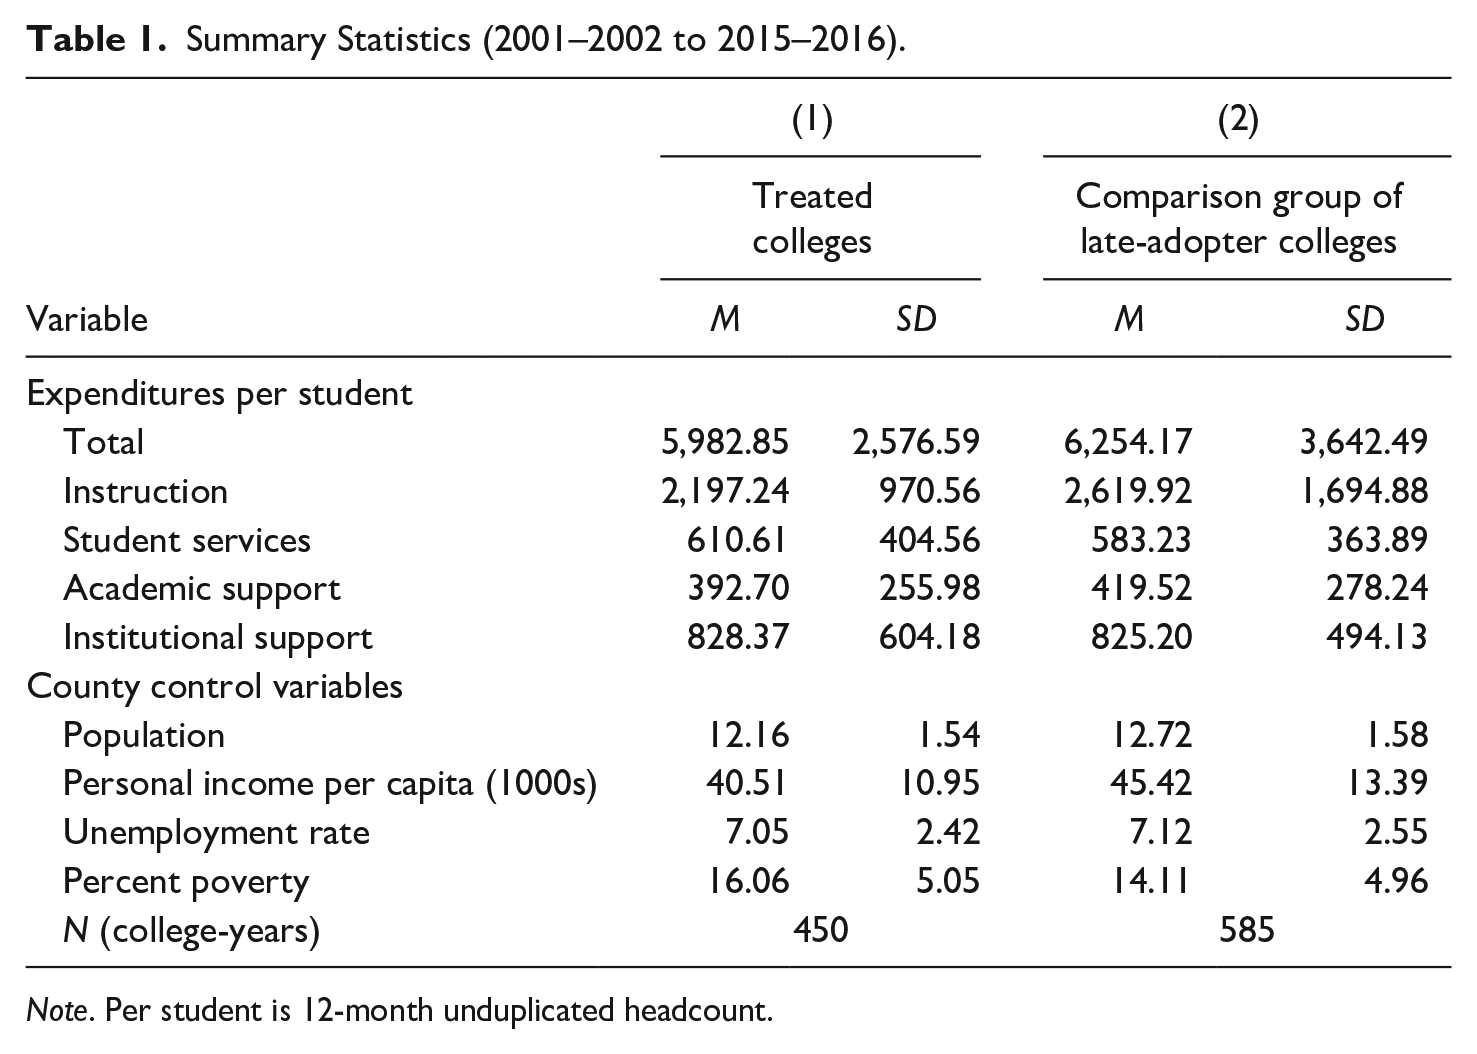
Note. Per student is 12-month unduplicated headcount.
Methods
To analyze the average impact of a promise program on institutional expenditures, we employed difference-in-differences (DD). The average treatment effect on the treated (ATT) is determined by the difference in outcomes between treated and comparison units across time. Many empirical applications consist of multiple time periods and staggered adoption of treatment, where once treated, the units remain treated in all subsequent time periods (Callaway & Sant’Anna, 2021). In our study, all 30 promise programs remained in place after their initial adoption. To explore the parallel trends assumption, we first visually inspected time-series plots of each expenditure outcome for treatment and comparison groups. Student services, academic support, institutional support, and total spending per student exhibited parallel trends. For instructional spending per student, the comparison group experienced a slight decline in earlier years, compared to the treatment group’s steady spending during the same time period. Nevertheless, the restriction of pre-trends can be slightly relaxed to generate valid estimation in the presence of non-parallel pre-trends by using a fixed comparison group of untreated units (39 untreated colleges between 2001 and 2015), rather than comparing units in years when they are treated with the same units in years when they are not yet treated (Marcus & Sant’Anna, 2021).
Generalized Difference-in-Differences Model
In our DD setup, the first difference is the change in expenditures between pre- and post-treatment periods for treated colleges, and the second difference is the change in expenditures for control colleges. When we subtract the first difference from the second difference, we calculate the DD estimate; this method exploits differences across time and colleges (Angrist & Pischke, 2009). We estimated a standard two-way fixed effects (TWFE) DD with robust standard errors:

where
Panel Event-Study Design
We also conducted event-studies to explore dynamic indicators for time relative to treatment and examine treatment effects that are heterogeneous across adoption cohorts (Sun & Abraham, 2021). Event-study designs consist of staggered adoption periods where units (colleges) are treated at different times (years), and there are untreated, control units. The unit-level treatment effect becomes the difference between the observed outcome relative to the untreated counterfactual outcome. Event-studies generate unit-level treatment effects at a given time period (i.e., the cohort-specific average treatment effect on the treated), offering a visual representation of the policy’s impact by considering variation in outcomes depending on the timing of policy adoption (Clarke & Tapia-Schythe, 2021; Sun & Abraham, 2021). Panel event-studies assume parallel trends in the baseline outcomes of treated and control units, the absence of anticipatory effects prior to treatment, and that each cohort follows the same path of treatment effects. We estimated the following model using the eventdd command in Stata:

where
Limitations and Robustness Checks
Given the relatively small sample of programs, we were unable to differentiate between program design features that could affect institution-level expenditures, such as the benefits offered by the program and eligibility requirements. Second, because we examined multiple programs, heterogeneous treatment effects are possible. If some colleges increased spending while others decreased, this could present a null aggregate estimate, masking patterns within individual colleges. Our results present average effects across colleges and programs with varying designs.
While the directionality of the event-study estimates were consistent with the generalized DD results, not all of the lags in the event-studies showed statistical significance when the aggregate DD estimate of a treatment effect was significant. This inconsistency can be explained by the bias of generalized DD estimation with staggered adoption (Baker et al., 2022). Due to this bias, the coefficient of staggered treatment from a generalized DD regression can be negative while the treatment effect is actively positive in every group and time period (de Chaisemartin & D’Haultfœuille, 2020). Though the panel event-study design can capture treatment effects during leads and lags, the estimates become less precise when they are further away from the omitted year (Clarke & Tapia-Schythe, 2021), because with more leads and lags, only colleges that were affected by promise programs in earlier years would have a substantial number of post-treatment years, and the composition of the treated sample changes. We ran additional event-study specifications to bin observations within ±5 years, ±6 years, ±7 years, and ±8 years before and after treatment, along with bootstrapped standard errors with 50 repetitions on all DD models (Angrist & Pischke, 2009). These standard errors were slightly smaller or larger in comparison, yet the overall findings were generally consistent, and we report our full-year event-studies as our main results.
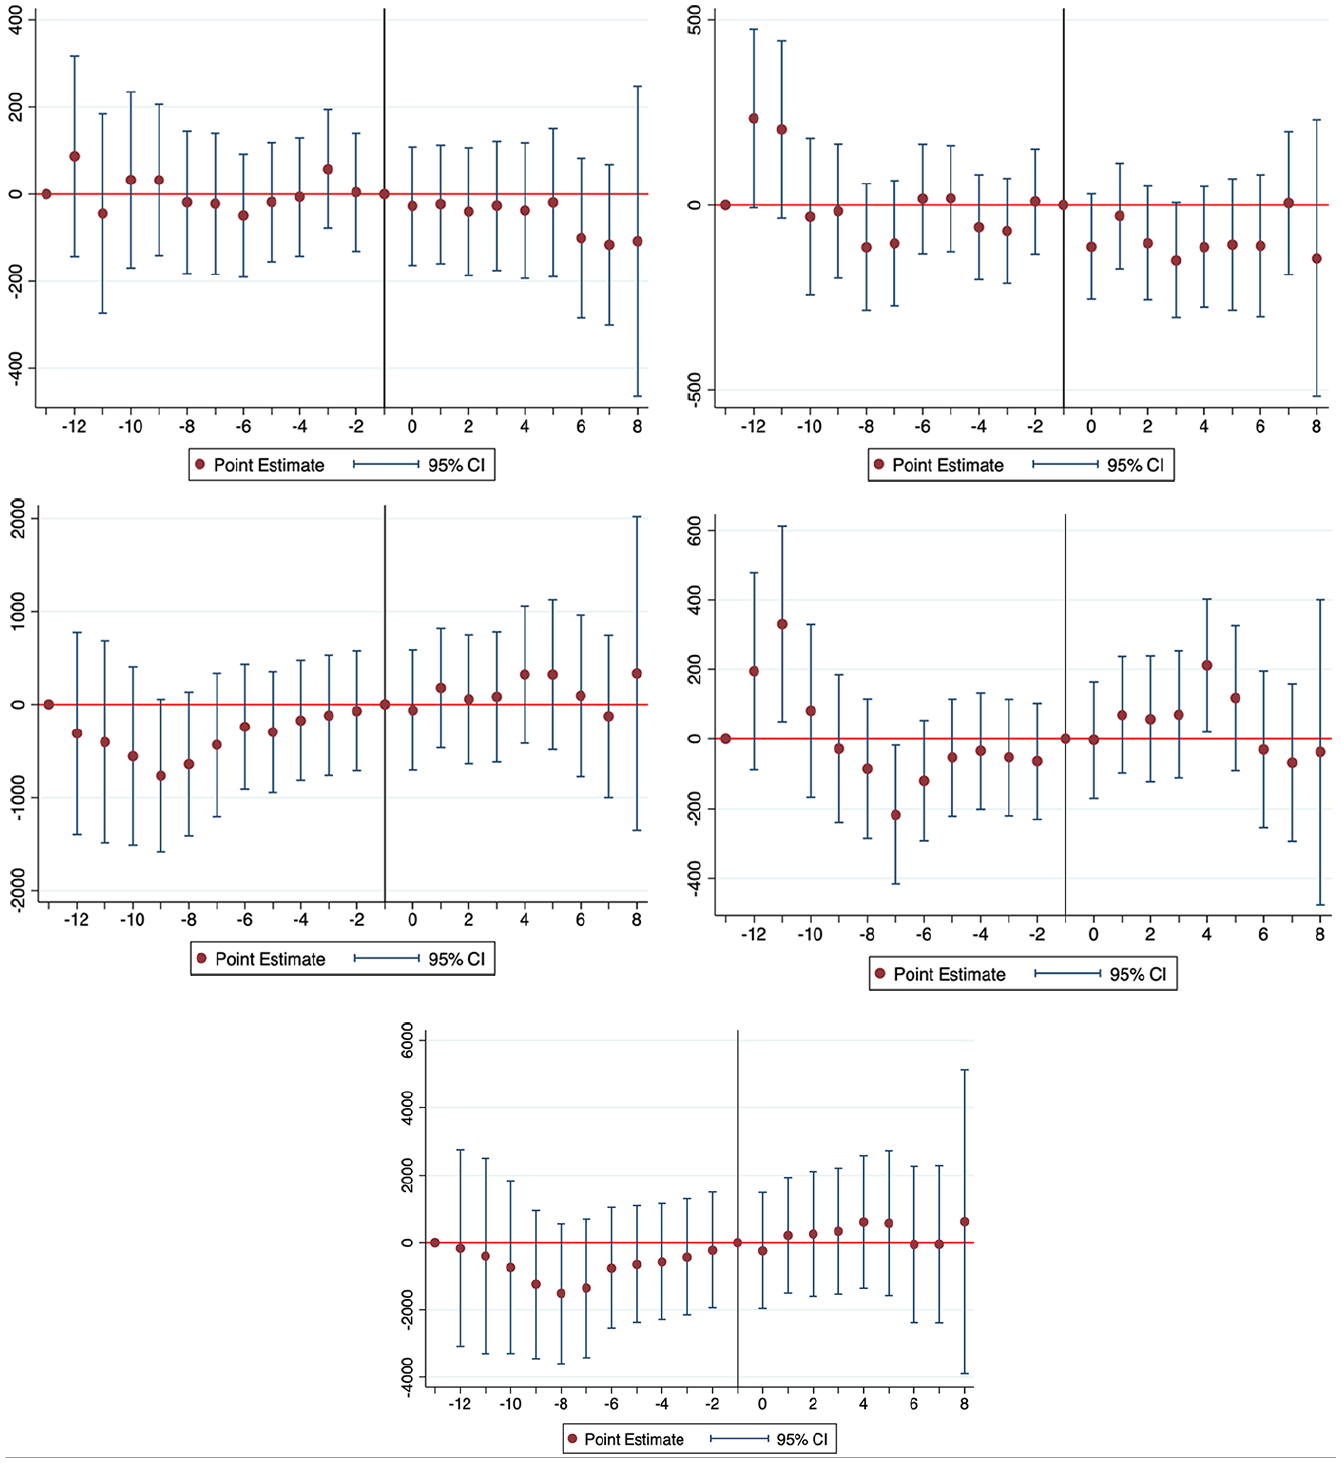
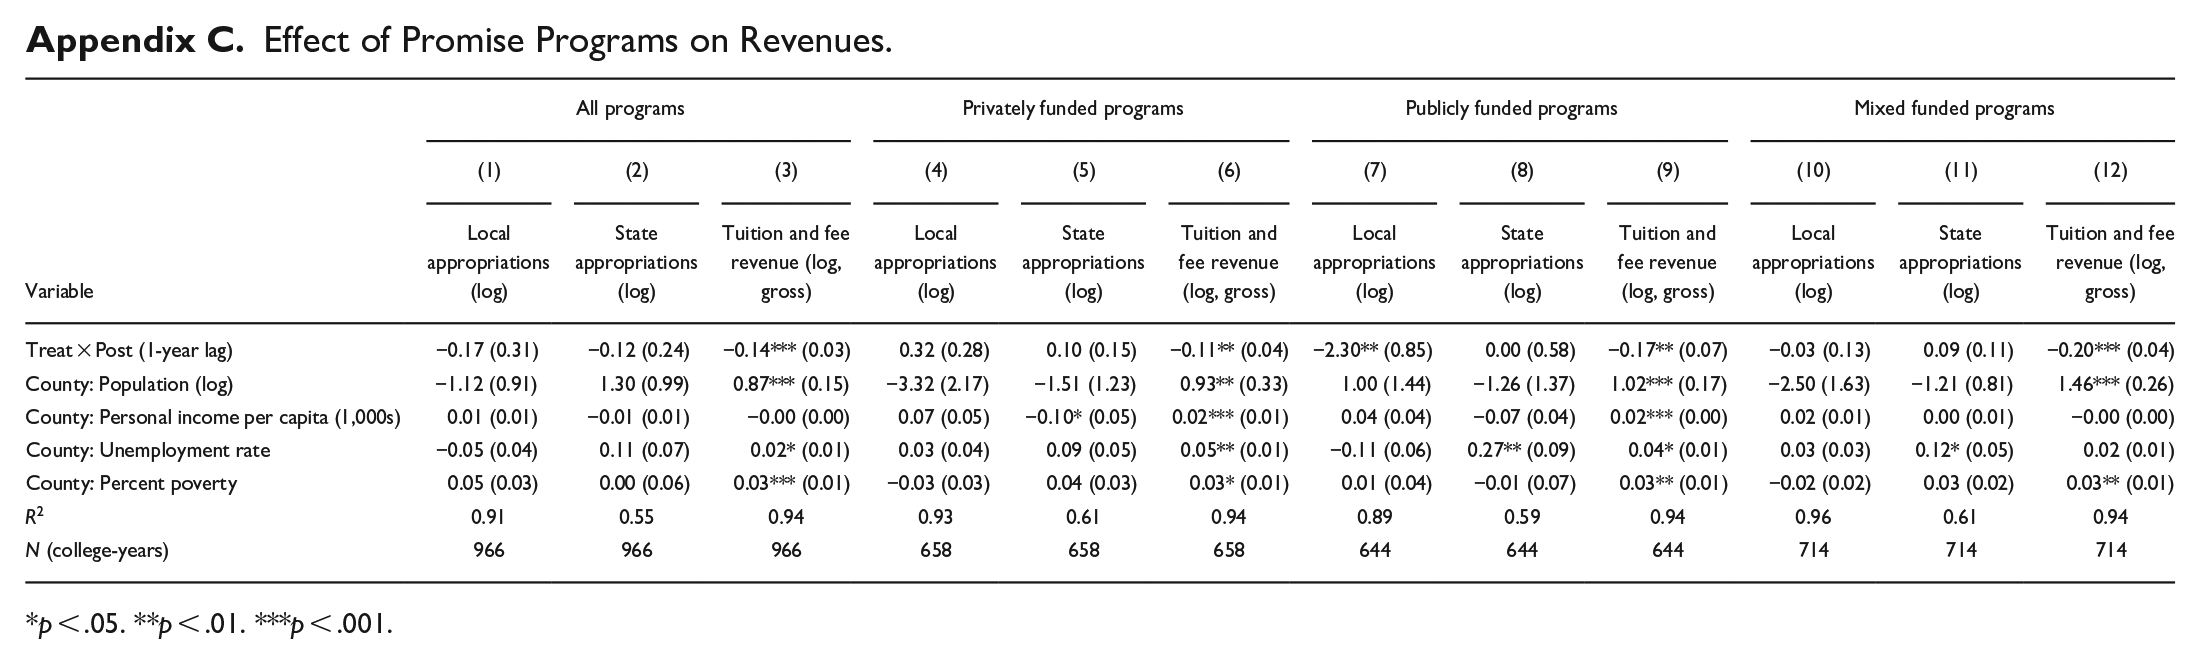
Finally, we conducted a robustness check to identify whether revenues changed after the implementation of promise programs. Appendix C shows DD estimates for each revenue source that we included as control variables (local appropriations, state appropriations, and gross tuition and fees). These models included the three county-level controls (personal income per capita, unemployment rate, and percent of population in poverty), along with college and year fixed effects. The treatment variable was program implementation, and the control group remains the same. For all types of programs (full sample, privately, publicly, and mixed funded), there were significant declines in tuition and fee revenues. For publicly funded programs, there was a substantial decline in local appropriations, yet state appropriations did not change for any of the samples. These results give us confidence that publicly funded promise programs would exert less pressure on colleges to shift their spending allocations, consistent with our conceptual framework.
Results
Expenditures per Student Among Full Sample of Promise Programs
The generalized DD estimates are shown in Table 2, which cover all promise programs in our full sample regardless of their funding source. We include results from the analyses using all years of data (labeled “Full Sample”) and the partial “Sample with 5 Pre- and Post-Treatment Years” as a robustness check. Compared to the control group of late-adopting colleges, the treated colleges experienced, on average, a $622 increase (p < .05) in total spending per student in response to a promise program (i.e., during post-treatment years). Using the partial sample, promise colleges did not appear to change their total spending per student, suggesting that these changes were driven by early adopters or that colleges needed several years to experience the effects of programs. In Table 2, Column 2, we see that treated colleges saw a significant increase in instructional spending per student, an average increase of $276 to $277 for the full and partial sample, respectively (p < .05). Among the three other categories (student services, academic support, institutional support), there were no statistically significant changes to spending levels after program adoption.
All Promise Programs (Regardless of Funding Source) Versus Control Group.
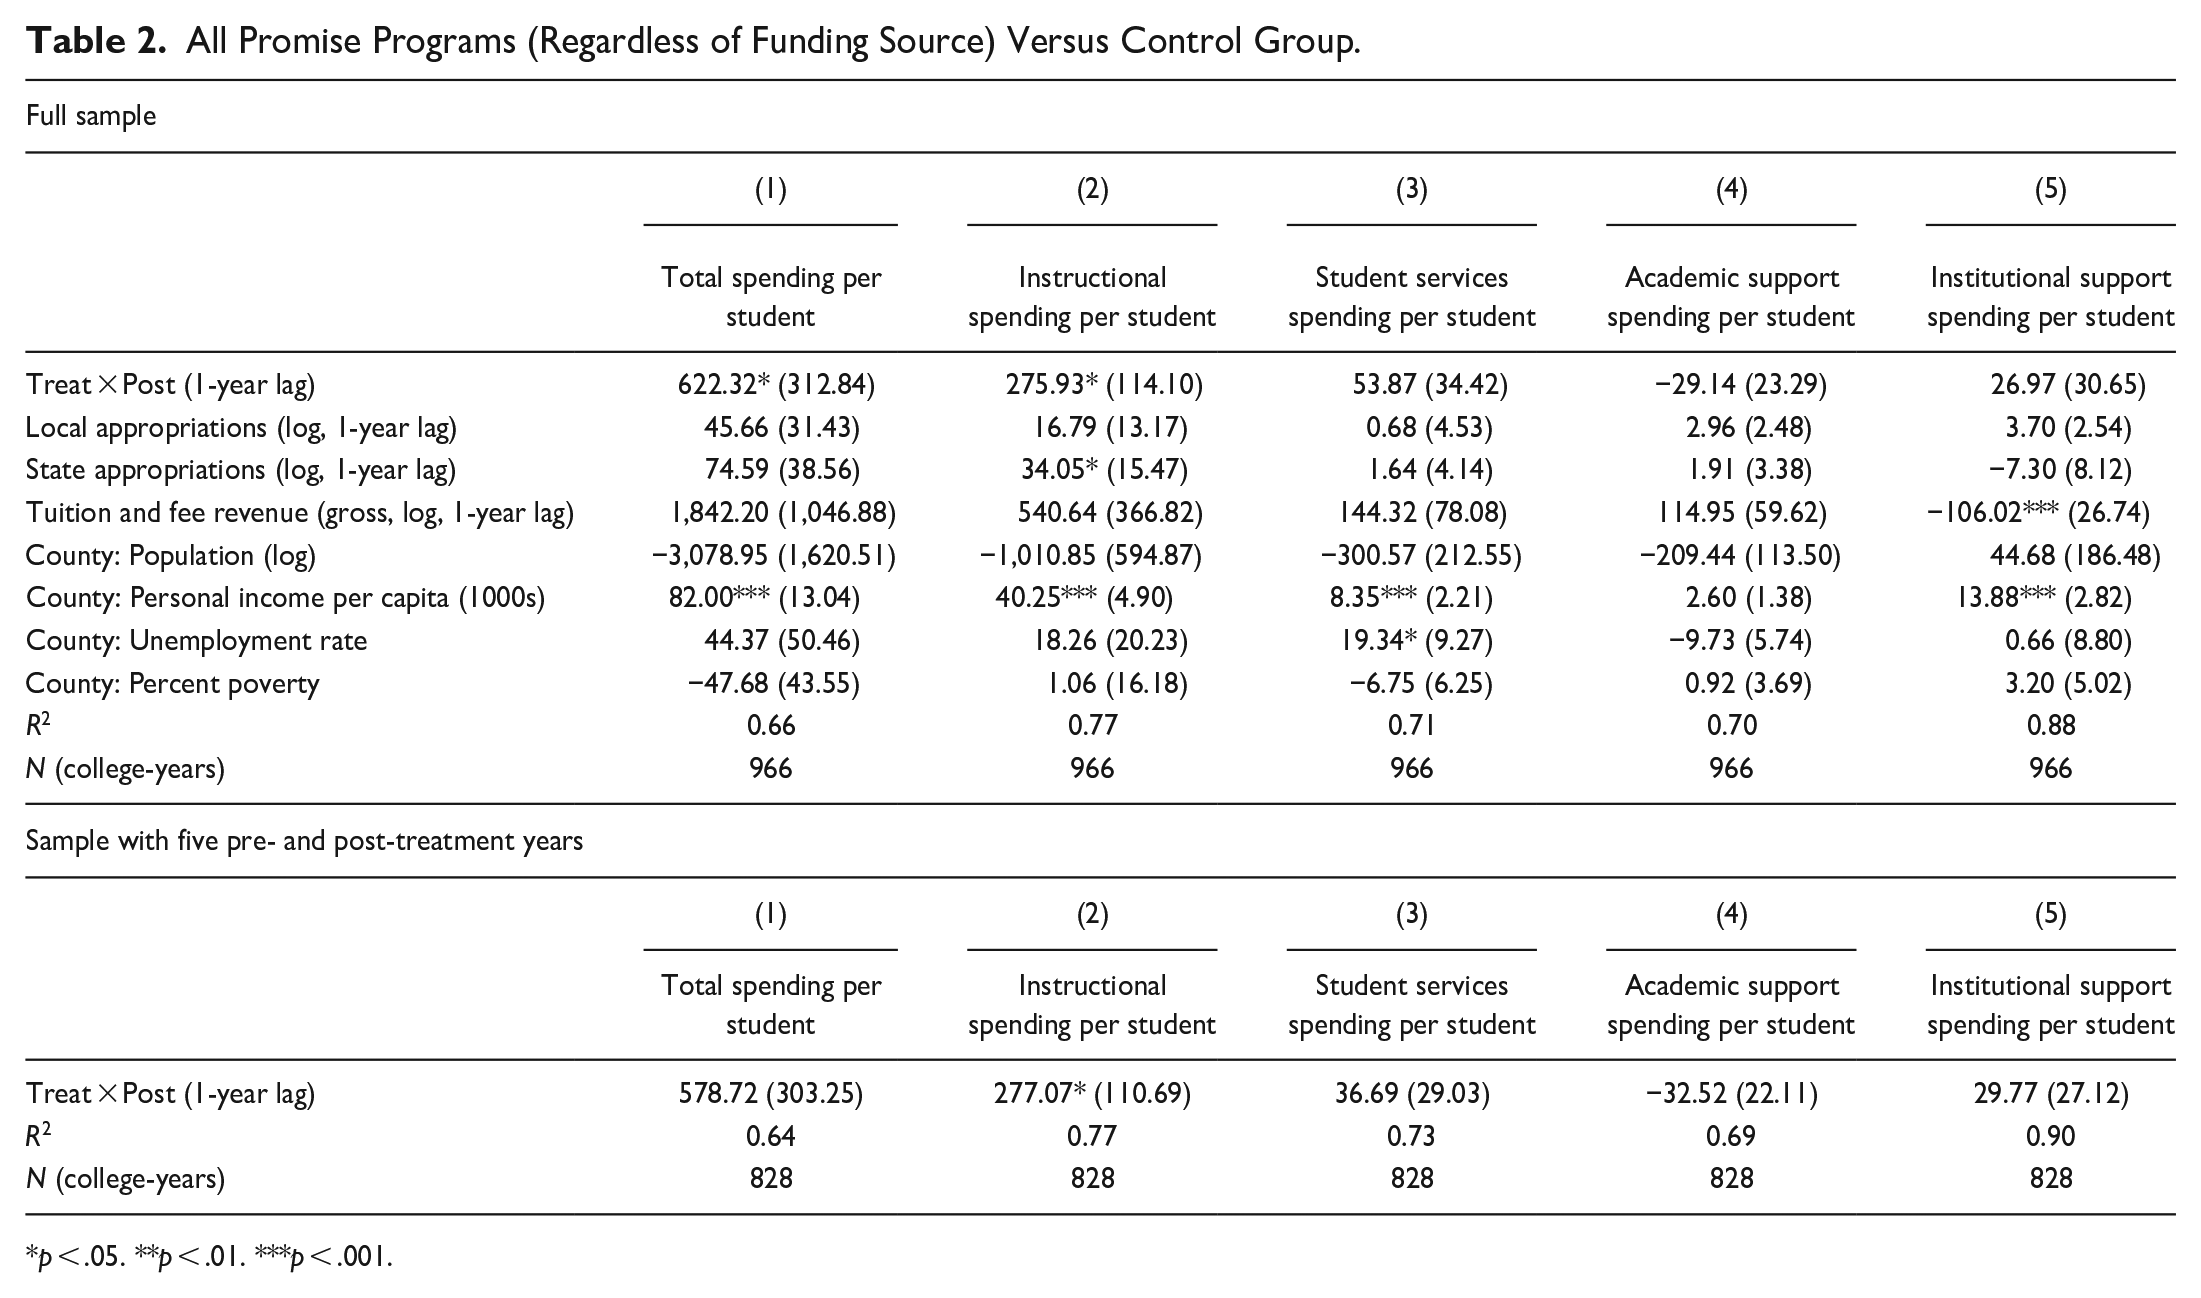
p < .05. **p < .01. ***p < .001.
We turn to our results for the panel event-study designs. In Figure 1, we graphed the event-study plots across all pre- and post-treatment years for the full sample. Each plot shows the estimated differences in all leads and lags in the outcome between treated and control colleges, compared to the prevailing differences in the baseline period (i.e., the year immediately preceding adoption). The plotted dot is the point estimate of this difference for that particular pre- or post-treatment year (leads and lags), and the bands around the point estimate show the 95% confidence intervals. Figure 1 demonstrates that 8 years and earlier before treatment, total spending, instructional spending, and institutional support per student had different trajectories. However, the years leading up to treatment are parallel, giving some confidence to meeting the parallel trends assumption. Student services spending per student showed a significant increase in Year 9 of colleges being treated with a promise program. For institutional support spending, we see significant upticks in Years 7 and 10. These increases occurred many years after program implementation, casting doubt that the changes could be in direct response to the program itself, which is consistent with the null estimates for these two outcomes from the DD results (Table 2). Generally, the event-studies show that during each of the post-treatment years, the outcomes between the treated and control groups were essentially null. While our DD estimates of the average aggregate spending changes suggested increases in total and instructional spending, this result was not reflected in the event-studies. Explained earlier, it is possible that the individual years of post-treatment do not show statistical significance, yet an overall DD estimate indicates a statistically significant treatment effect. Again, we place the most credibility on results that are consistent across the two methods and derive implications accordingly.
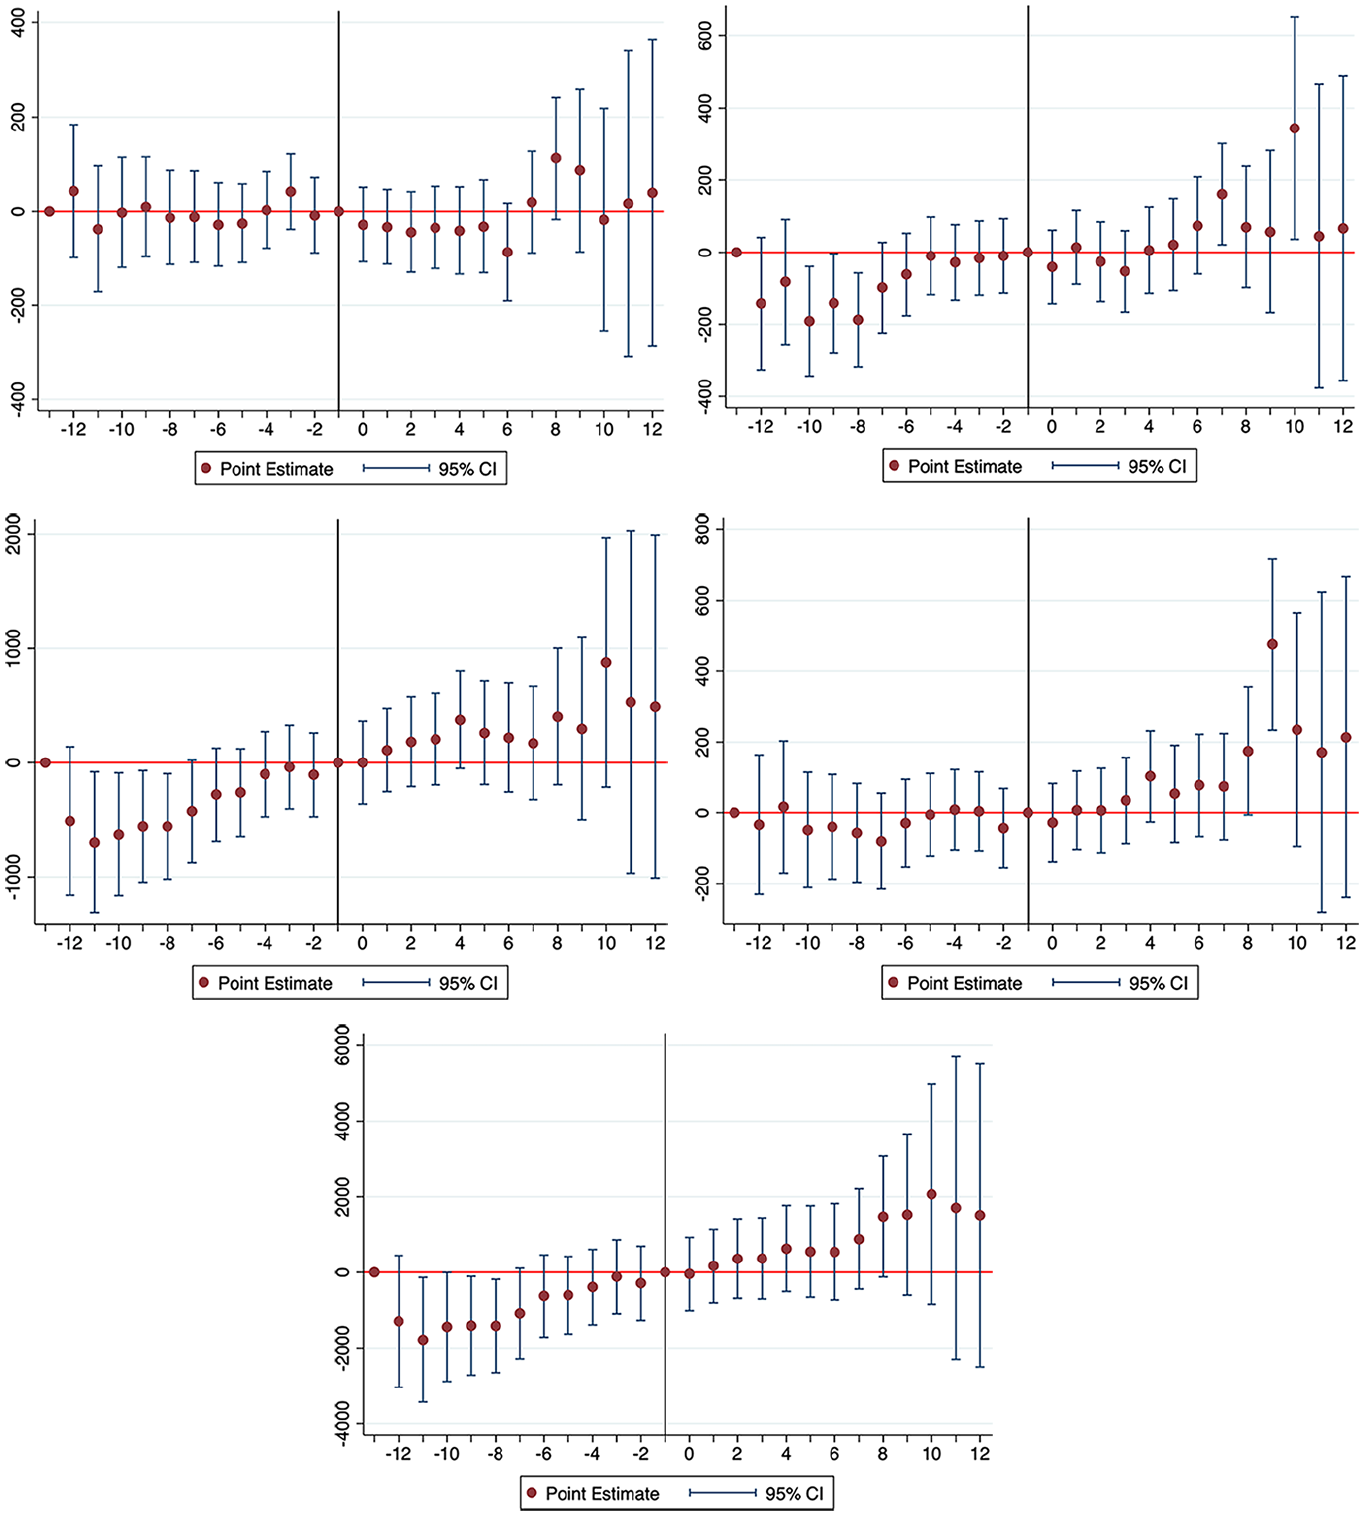
Event study plots of all promise programs (Regardless of funding source).
Expenditures per Student Among Privately Funded Programs
Turning to privately funded promise programs, among the eight colleges (Table 3), there was a significant average increase in per student total spending ($1,149 more for the full sample; $837 more for the partial sample, both p < .01), instructional spending (a $433 increase for the full sample, p < .01; a $289 increase for the partial sample, p < .05), and institutional support ($236 more for the full sample, p < .001; $166 more for the partial sample, p < .01). Our findings partially support both hypotheses—instructional spending increased at treated community colleges, although no changes occurred to student services or academic support.
Privately Funded Promise Programs Versus Control Group.
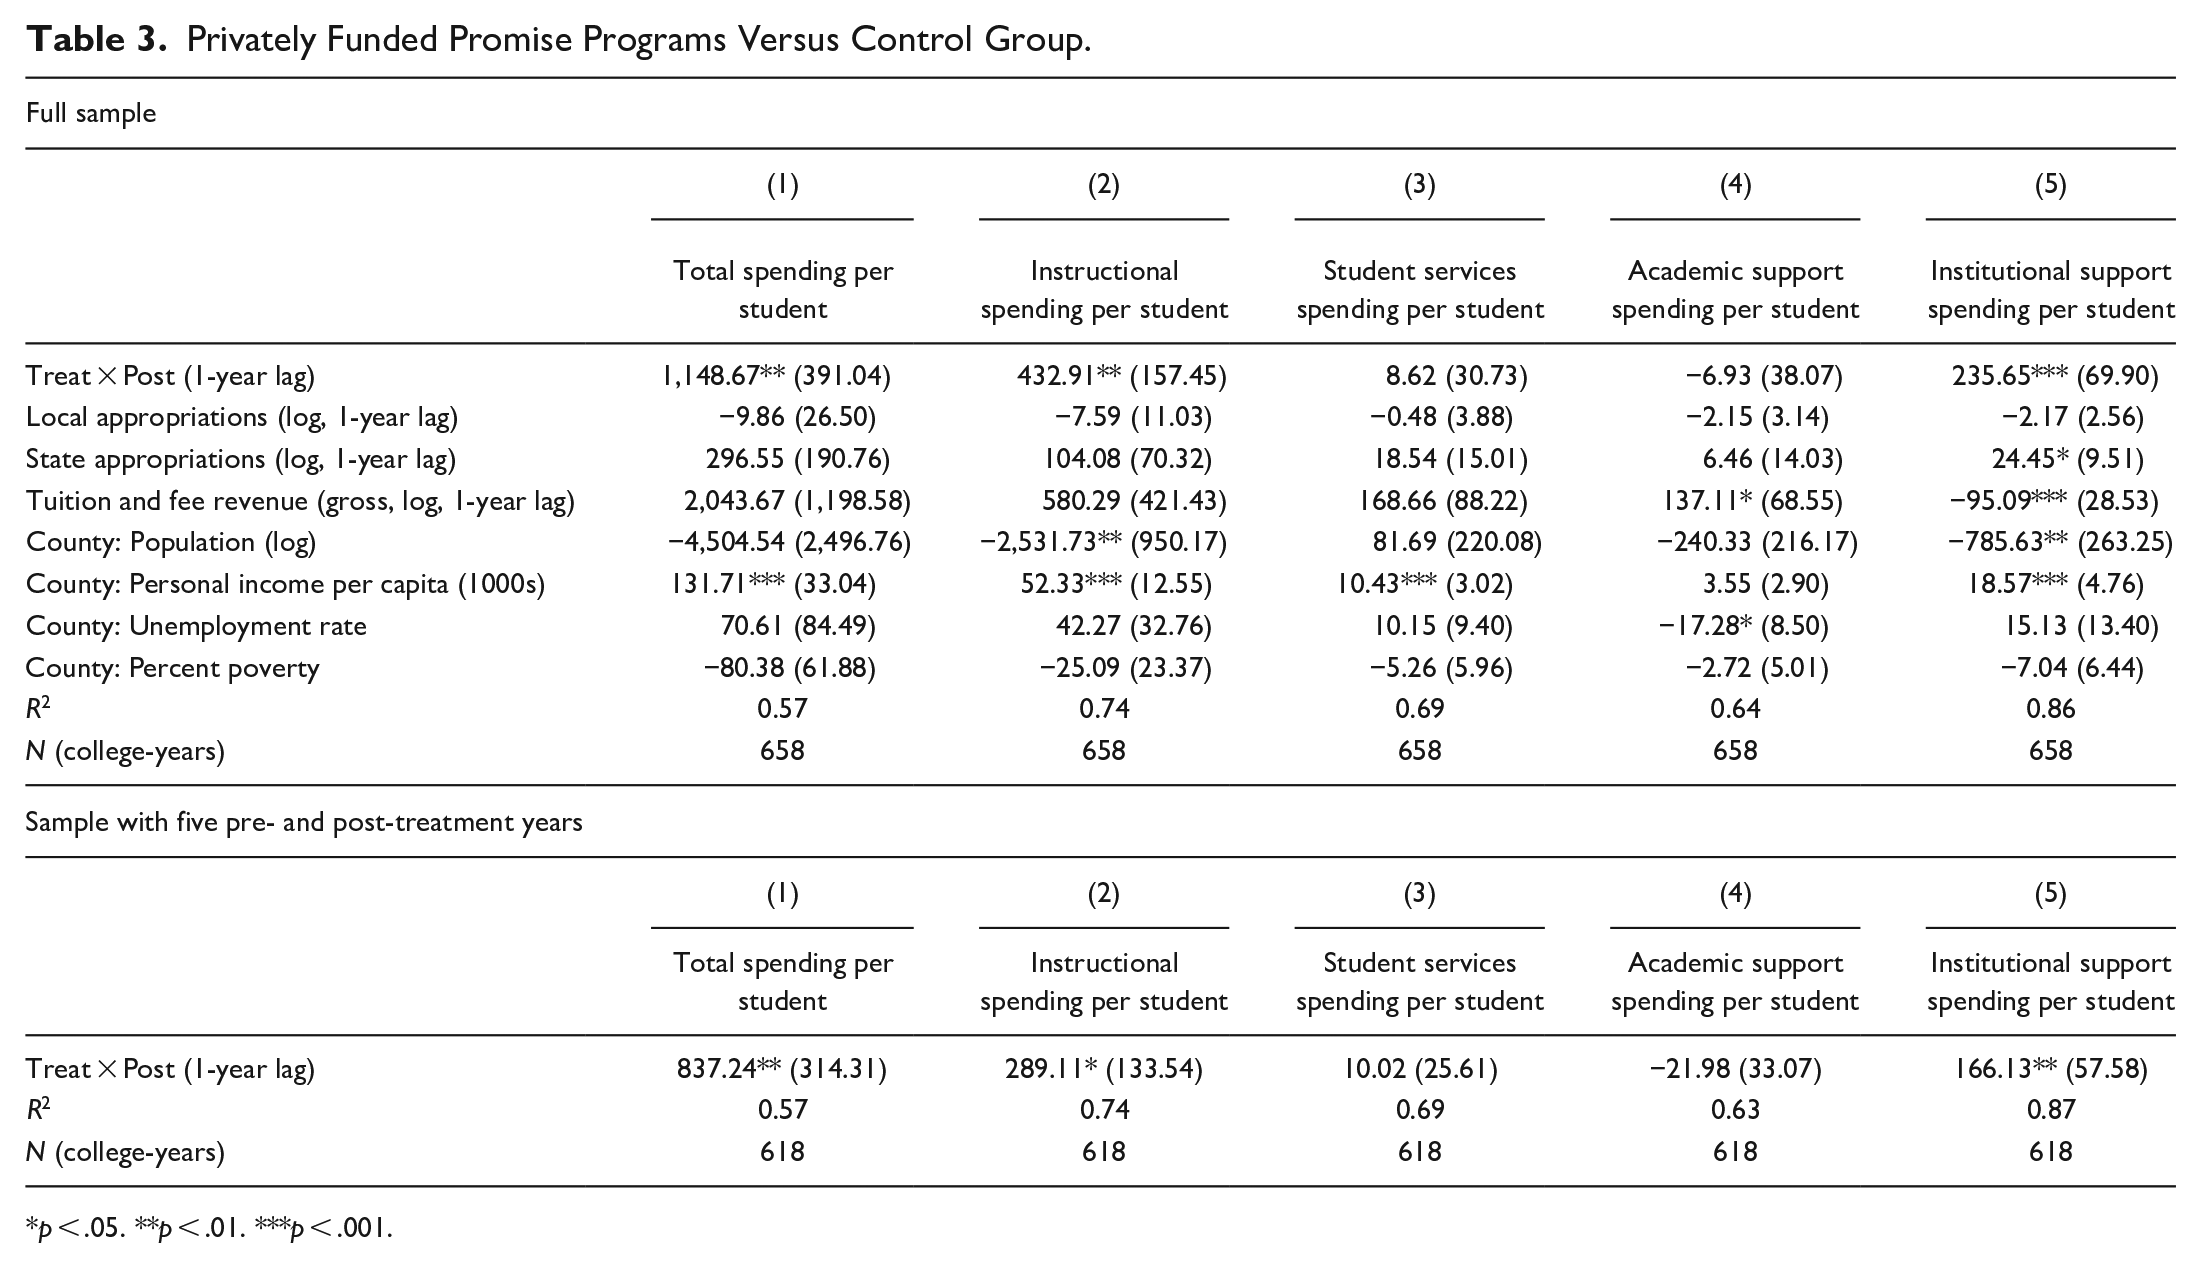
p < .05. **p < .01. ***p < .001.
The corresponding event-studies for privately funded programs are displayed in Figure 2, which suggest that none of the spending outcomes showed changes after promise programs, except for institutional support spending, which increased substantially during a program’s operating Years 4 through 8. This finding maps onto the statistically significant increases of $166 to $236 in institutional support from our DD estimates (Table 3). However, the two other spending categories, total and instruction, demonstrated aggregate DD increases after treatment, yet this did not appear in the event-studies. Encouragingly, the plots reveal limited evidence of pre-treatment trends leading up to program implementation; the confidence intervals cross zero.
Event study plots of privately funded promise programs.
Expenditures per Student Among Publicly Funded Programs
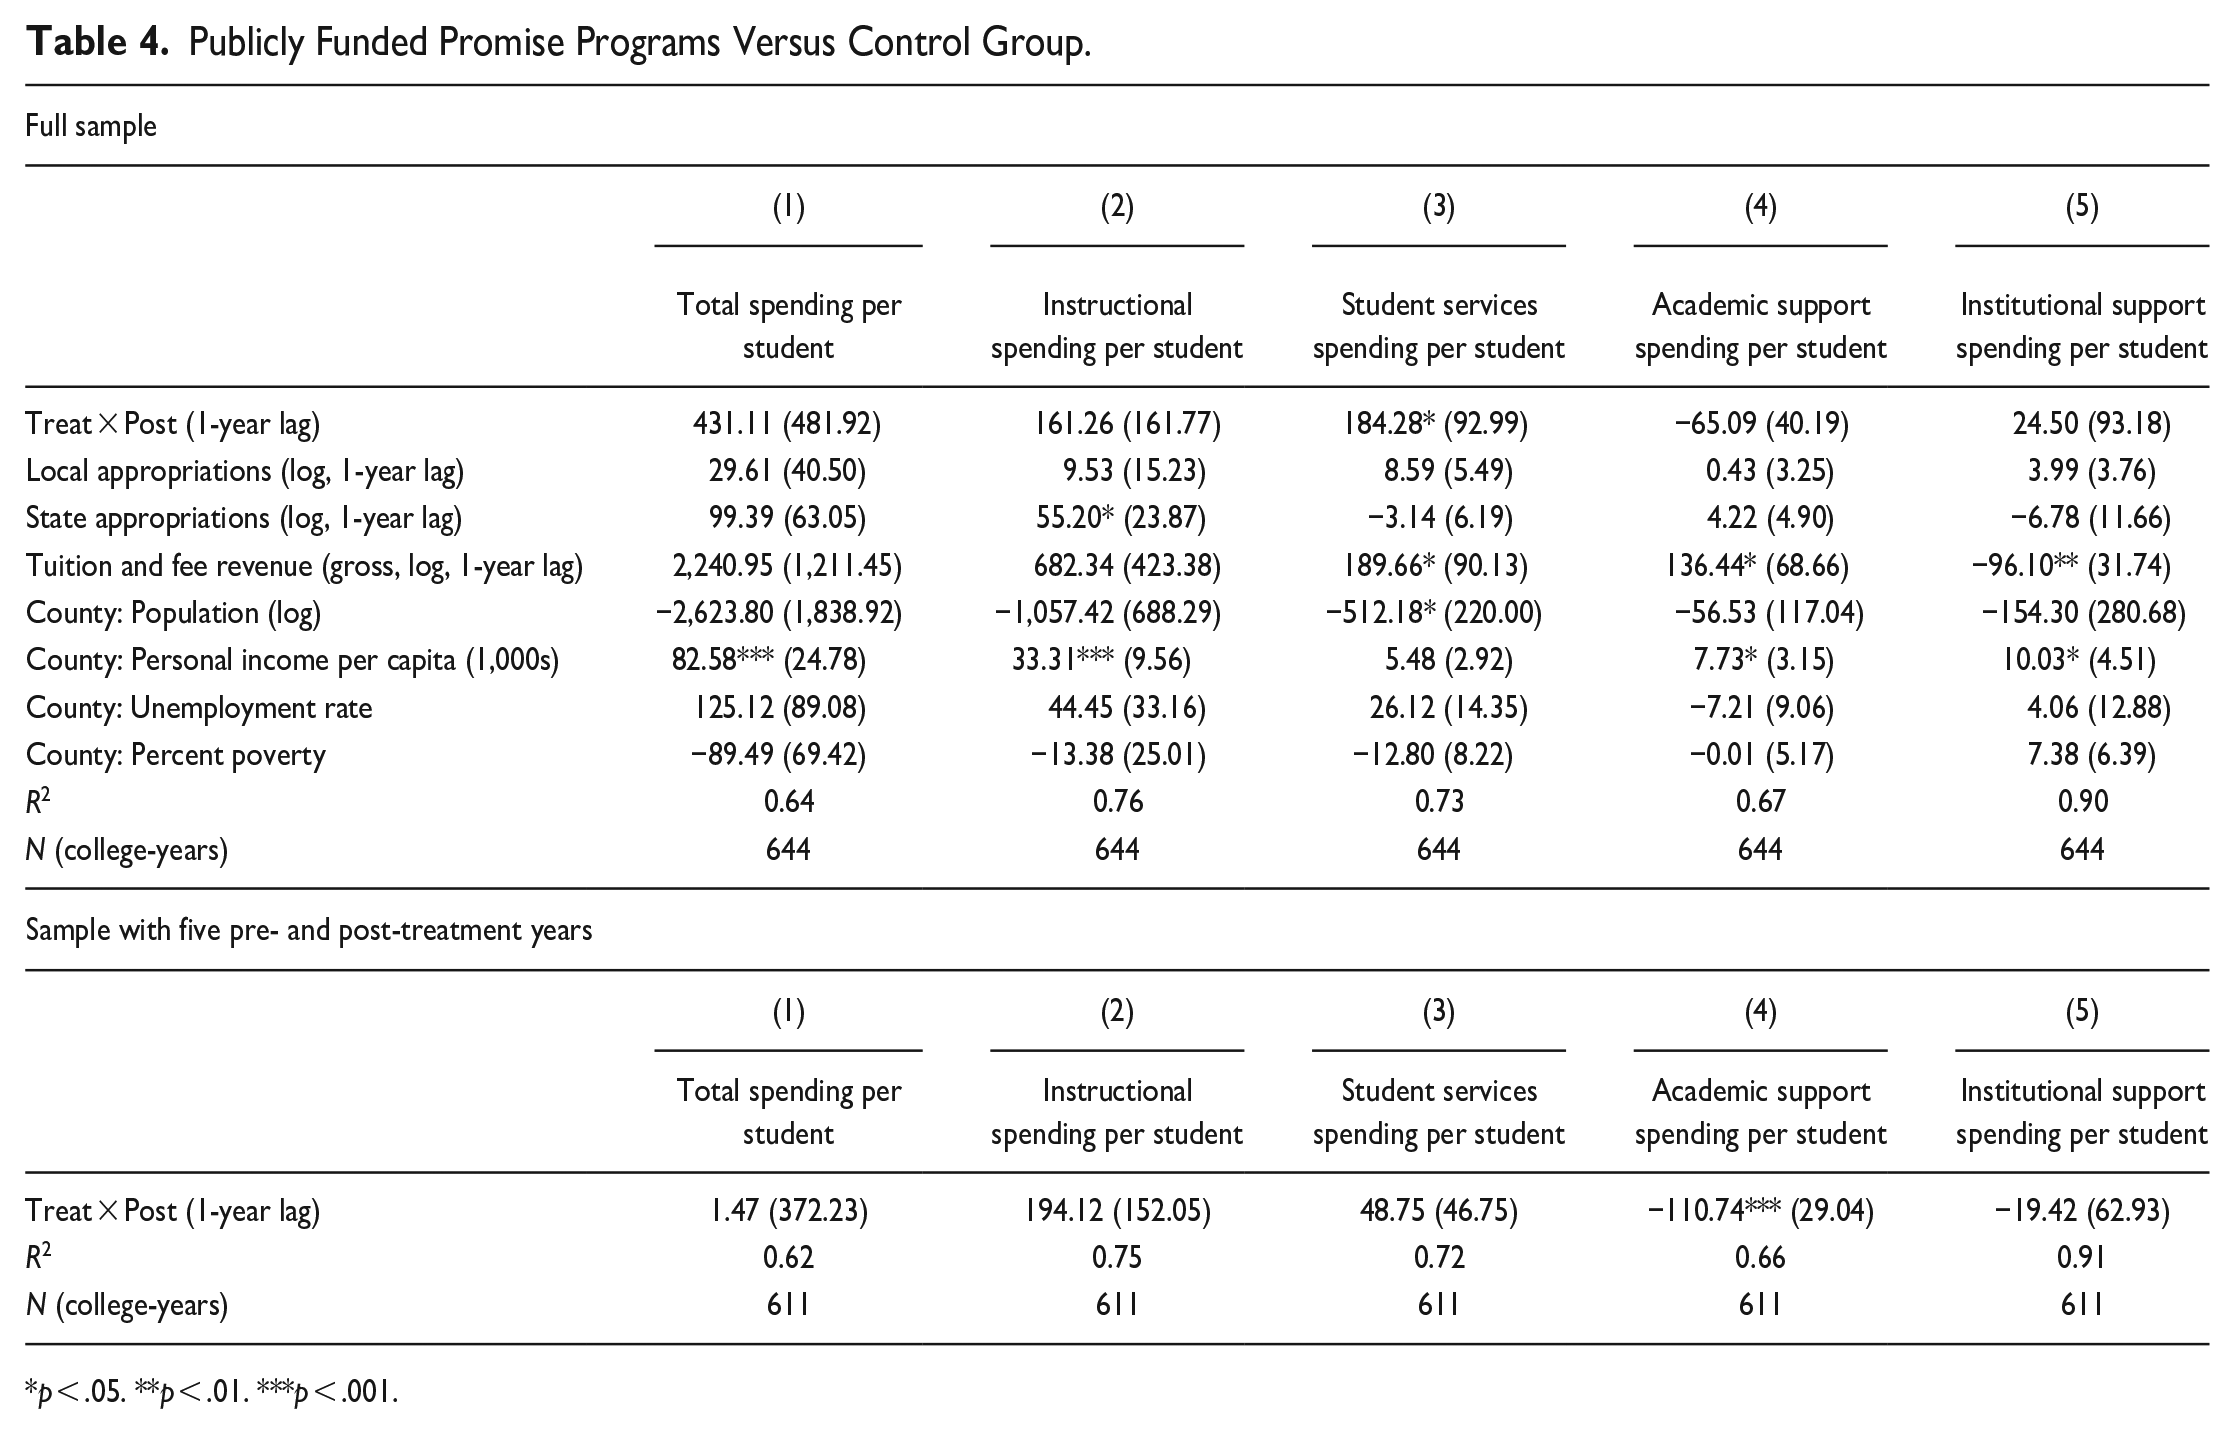
Our results analyzing spending changes for the subset of seven publicly funded programs mostly support the second hypothesis predicting negligible changes in spending patterns—with the exception of student services spending, which increased $184 (p < .05), total spending and spending on other categories remained stable across the full sample (Table 4). However, when analyzing the partial sample, promise colleges appeared to reduce academic support spending by $111 per student (p < .001). The conclusions from the full versus partial sample differ, but mostly support our hypothesis that promise programs would not experience major changes to their spending, the exception being an increase in student services spending, which is potentially offset by a reduction in academic support spending during early years of implementation.
Publicly Funded Promise Programs Versus Control Group.
p < .05. **p < .01. ***p < .001.
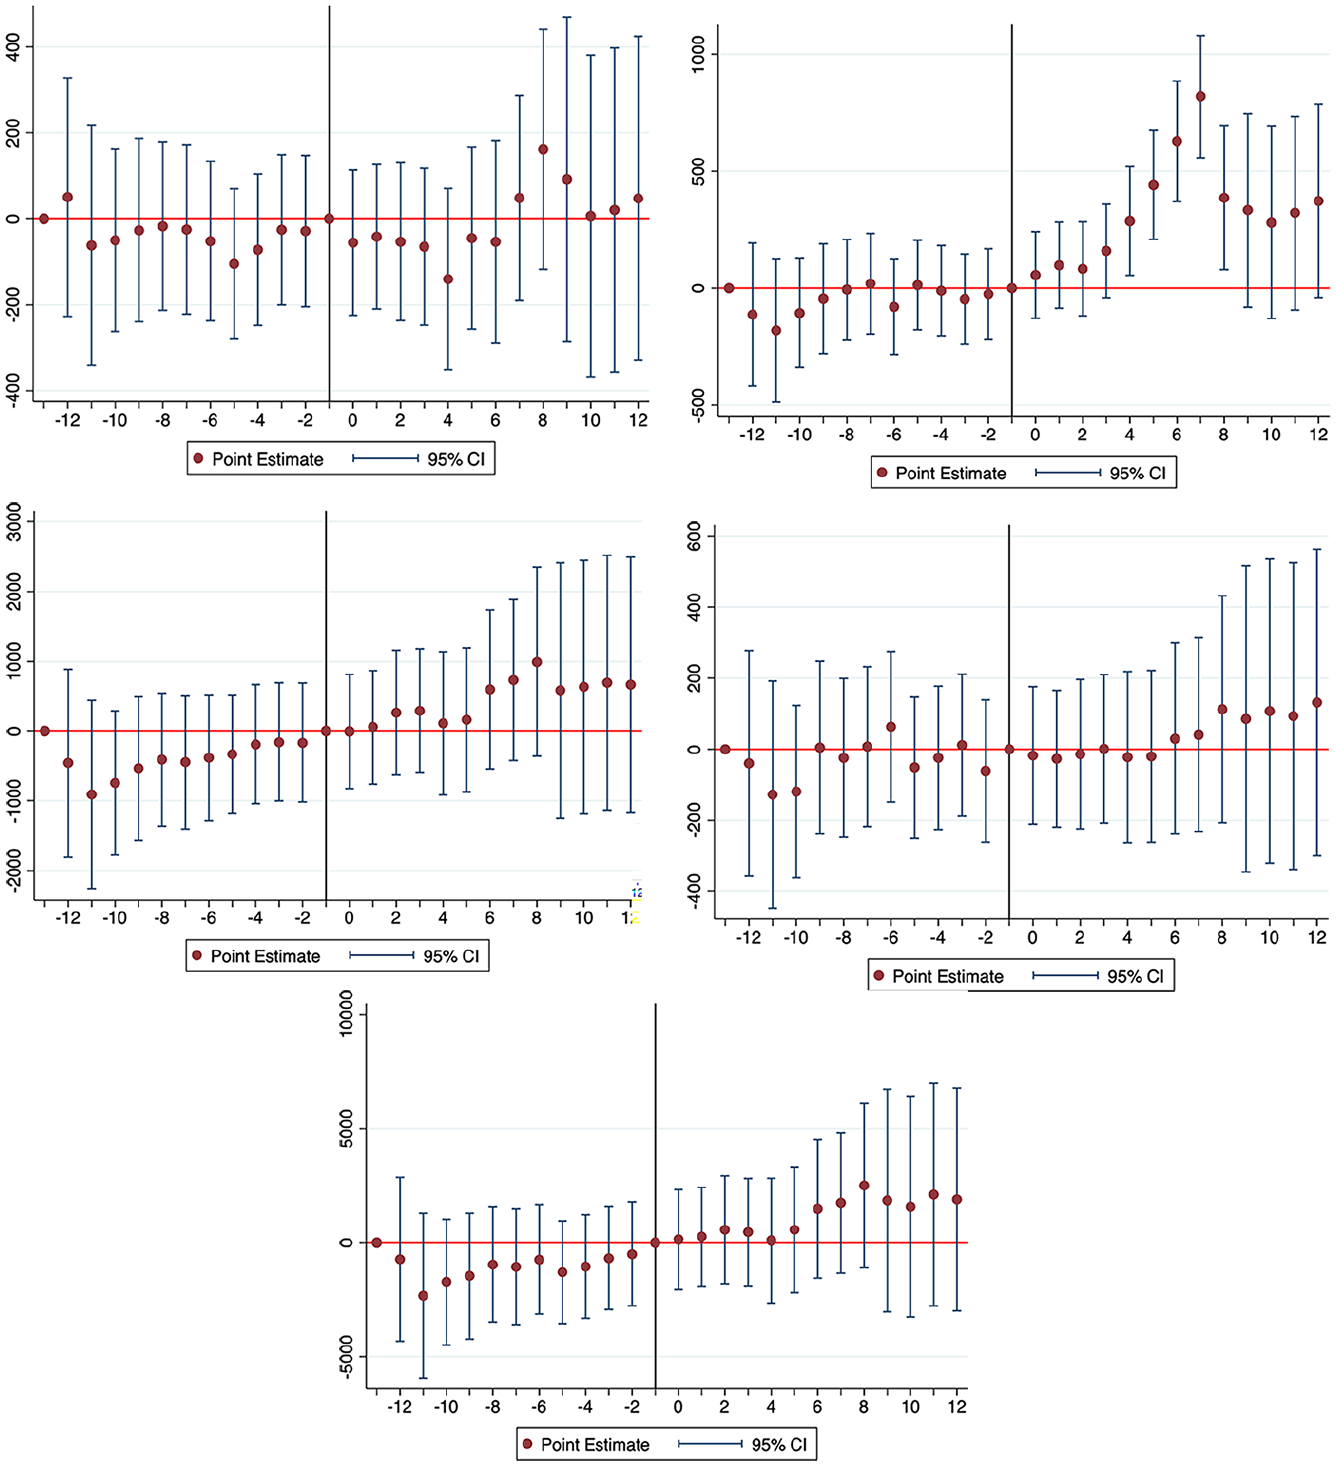
Amongst publicly funded programs (Figure 3), there were significant increases in student services spending during Years 6 through 9 after treatment. These changes were far enough in the future to warrant a bit of skepticism that they resulted from the treatment, although earlier treated years did show positive yet statistically insignificant changes. For institutional support, we advise caution in interpreting the single positively significant lag year (Year 10) because it occurred considerably after treatment. For the three remaining outcomes (total spending, instructional spending, and academic support), the event-studies illustrate no effects from the implementation of a promise program. In the case of publicly funded programs, we observe a mostly consistent story between the DD estimates and the event-studies, which both point to increases in student services spending, and negligible changes in other categories.
Event study plots of publicly funded promise programs.
Expenditures per Student Among Mixed Funded Programs
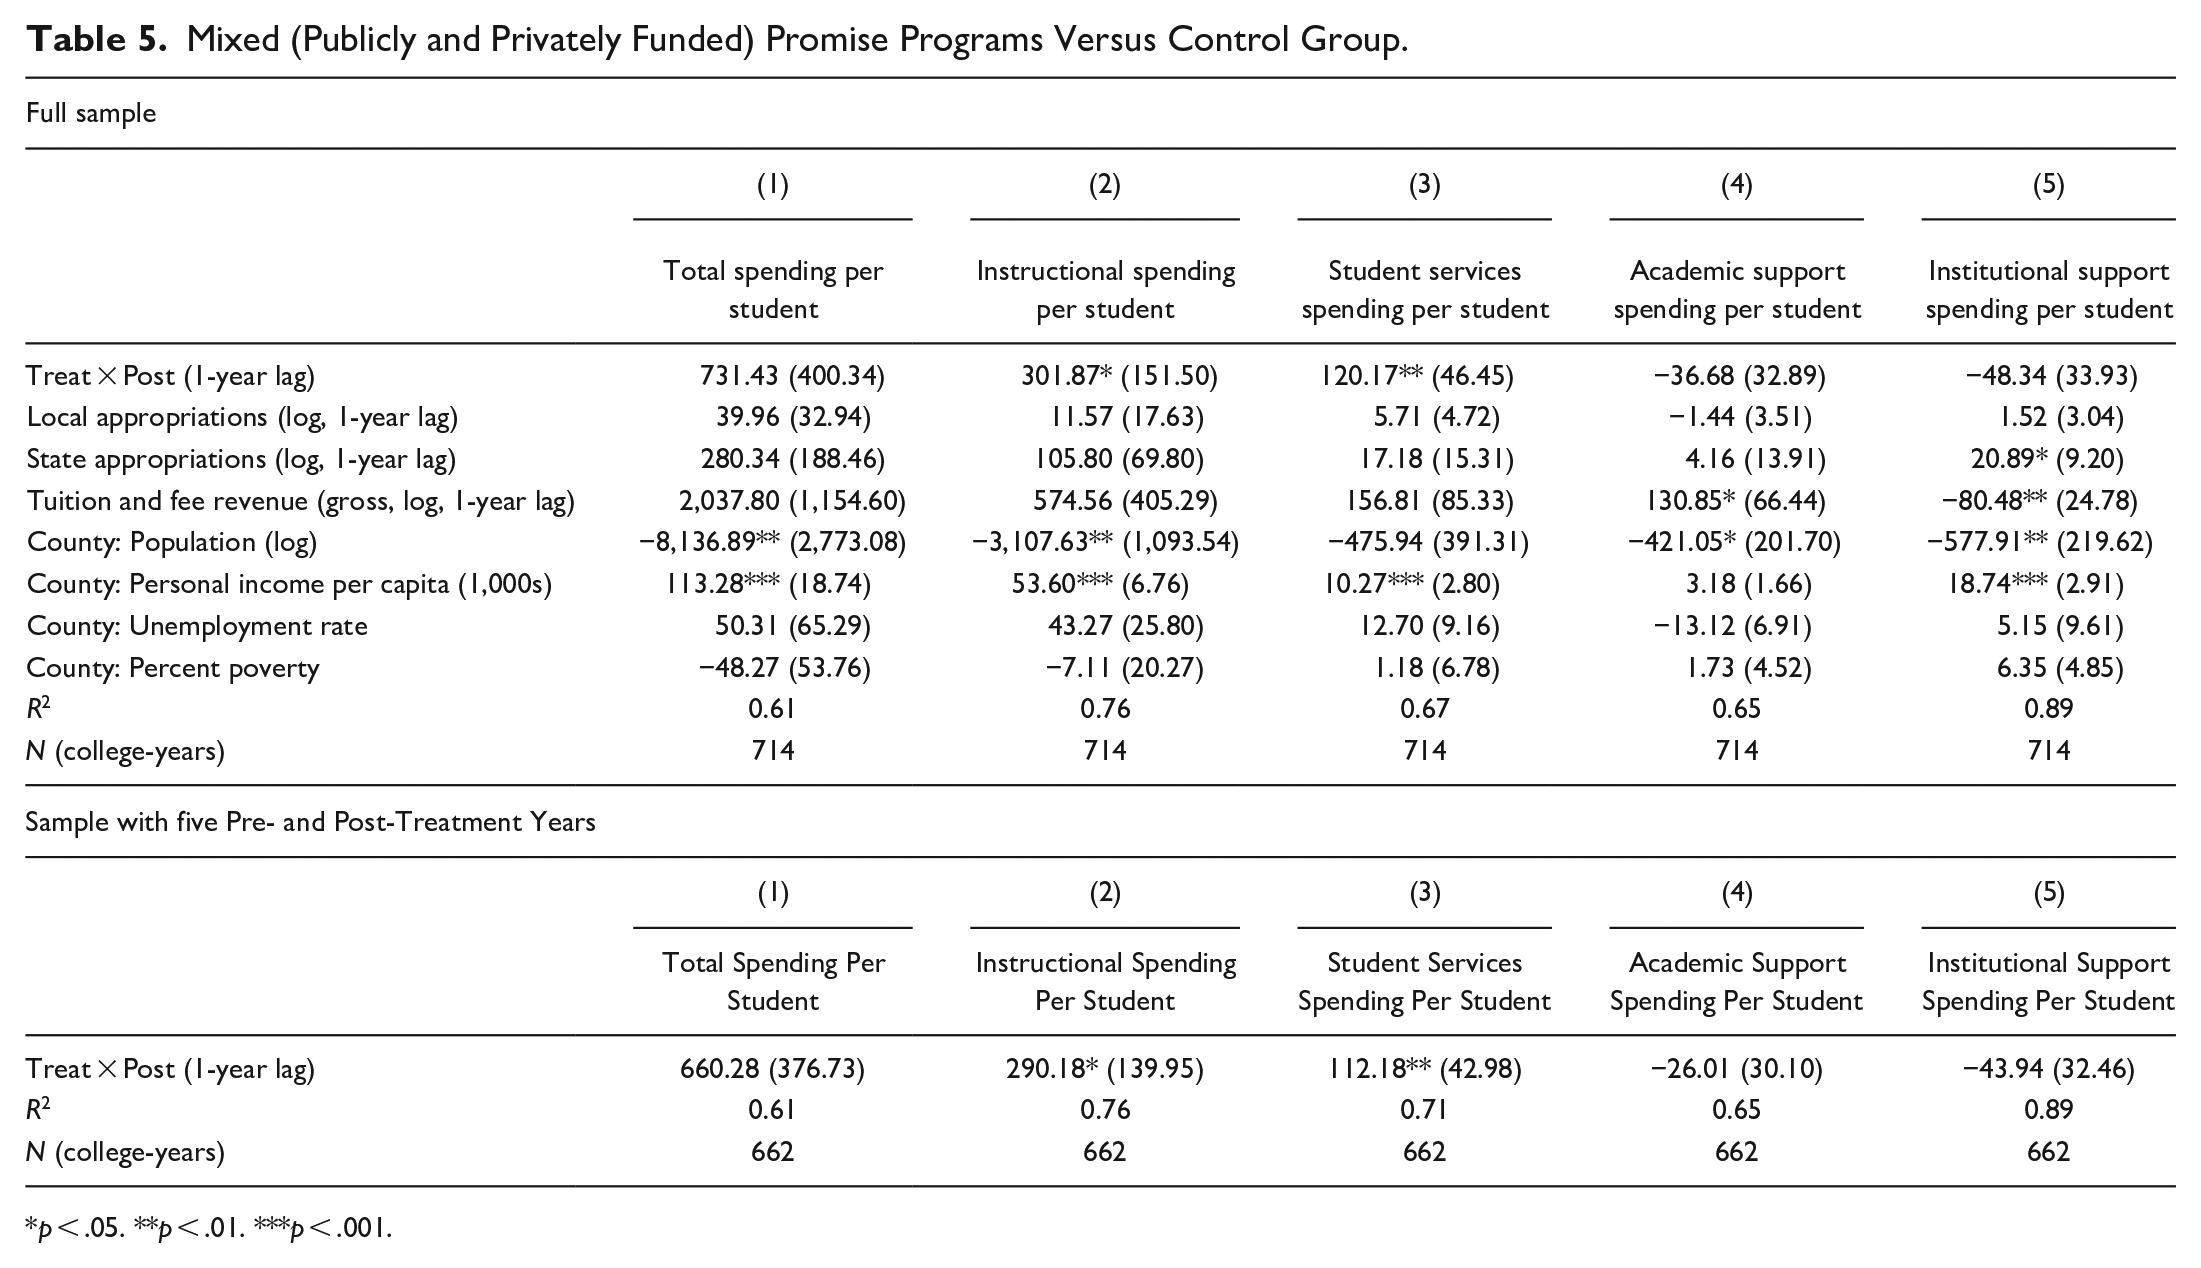
Lastly, Table 5 reports estimates using the subset of 12 mixed funded promise programs that receive funding from both public and private sources. We found that across the full sample of years, instructional spending increased $302 per student (p < .05), and student services spending increased $120 (p < .01). Similarly, for the partial sample of ±5 years, instructional spending increased $290 per student (p < .05), while services spending increased $112 (p < .01). The mixed-funded sample was the only one that consistently had a statistically significant coefficient on student services, suggesting a unique scenario that prioritizes student support that would enhance student experiences and ultimately, degree completion.
Mixed (Publicly and Privately Funded) Promise Programs Versus Control Group.
p < .05. **p < .01. ***p < .001.
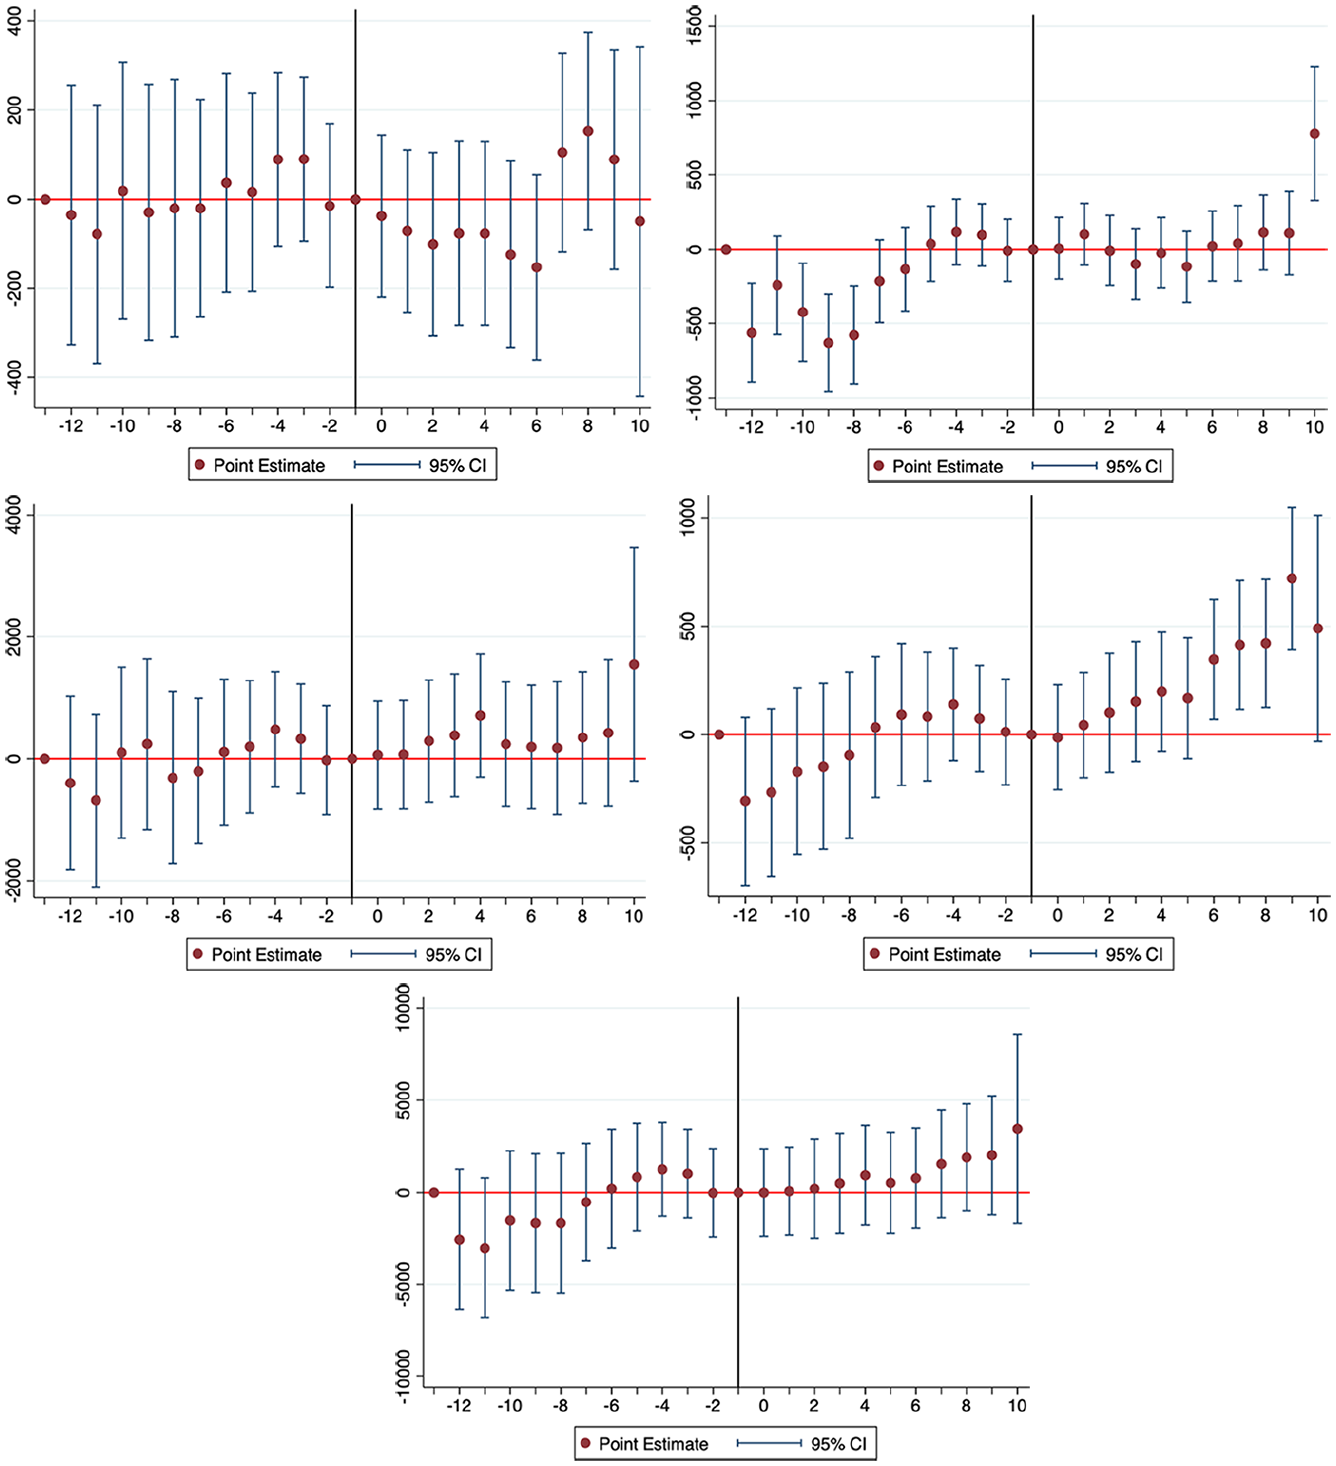
The corresponding event-studies in Figure 4 suggest no changes to total spending nor any category of spending. While our estimates of the aggregate spending changes suggested increases in instructional spending and student services (Table 5), these results were not reproduced in the event-study plots, again, a discrepancy that can occur with staggered treatment timing (de Chaisemartin & D’Haultfœuille, 2020). We infer that mixed-funded programs produced no changes to expenditures, consistent with our second hypothesis.
Event study plots of mixed (Publicly and privately funded) promise programs.
Discussion
As promise programs continue to spread across the United States, it is important to understand how they alter the finances of the institutions affected. This study provides evidence on expenditure patterns at community colleges affiliated with single-institution promise programs. The focus of this study on community colleges is particularly valuable considering the relatively low levels of per student funding at these institutions (A. M. Cohen et al., 2014). Community colleges also deserve greater attention in light of concerns about their internal allocation of funds, given multiple and competing goals within their missions (Rosenbaum et al., 2007). They serve numerous functions beyond promoting associate degree attainment and upward transfer (which tend to be the primary goals of many promise programs), including career and technical education, vocational education, continuing education, and upskilling (A. M. Cohen et al., 2014). A program could focus resources on areas that support policy goals (e.g., credential completion and, in some cases, transfer), potentially shifting the institutions’ priorities. Research suggests that community college promise programs can improve enrollment, transfer, and degree attainment rates (Bell & Gándara, 2021; Li & Gándara, 2020). By investigating a first-level effect of programs on institutional expenditures, this study expands knowledge on a missing link between promise programs and student outcomes—changes to expenditures are the mechanism (or intermediate outcome) through which programs can influence the ultimate outcomes of retention and completion.
Across all programs, the event-studies did not support the positive estimates on total and instructional spending from the DD analyses, and we conclude that when not accounting for funding source, promise programs do not produce changes in expenditures. Our analyses demonstrate that the relationship between promise programs and per student expenditures depend in part on funding source. While there is suggestive evidence, according to aggregate estimates, that privately funded programs experience the largest per student increases in total spending, instructional spending, and institutional support, we only have sufficient evidence to conclude that institutional support increases. Institutional support consists of operational support in areas such as administrative services, executive-level planning, legal and fiscal operations, space management, personnel, purchasing, public relations, and development/fundraising (Integrated Postsecondary Educational Data Systems, n.d.). Prior research does not indicate any relationship between institutional support spending and student success, rather, greater instructional spending improves student outcomes (Bailey et al., 2006; Belfield et al., 2014; Calcagno et al., 2008). Yet, we do not observe consistent increases in instructional spending across any of the samples. Our findings specific to privately funded programs contradict our theoretical expectations that community colleges spend money to achieve retention and completion goals that will allow them to secure funding from external entities (Fowles, 2014; Pfeffer & Salancik, 1978). Instead, colleges may be engaging in other behaviors to boost their outcomes and garner financial support for their programs, such as setting high eligibility standards (Monaghan & Attewell, 2023). Moreover, institutional support spending, which includes public relations and development, might increase because privately funded programs face accountability pressure to broadcast that philanthropy money is well spent.
Our findings reveal that publicly funded programs, which are funded by a government entity, the college itself, or its foundation, increase spending on student services—activities outside of formal instruction that advance students’ emotional, intellectual, cultural, and social development. These results are consistent across DD and event-study models. It is encouraging that such programs are allocating resources to an area that influences student success.
As for mixed-funded programs, our analyses suggest that while these programs show a consistent increase in instruction and student services spending in the DD estimates, the event-studies do not support these conclusions. It is possible that mixed-funded programs may involve spending on student services that already exist within the college, combined with additional support that specifically targets promise students. Additional research could uncover why spending does not change in any category.
Our findings differ substantially from prior studies (Delaney & Hemenway, 2023; Odle & Monday, 2021). Across our full sample, we find no changes to any expenditure categories. This contrasts with Delaney and Hemenway’s (2023) findings regarding 19 single-institution community college programs, which saw declines in student services spending and no changes to instruction, as well as Odle and Monday’s (2021) findings of declines in instruction, academic support, and institutional support after the Tennessee Promise. Our findings differ from Delaney and Hemenway (2023) perhaps because we use a stricter definition of single-institution promise programs and cover an additional 2 years in our study which allows us to include eight new promise programs. Our sample is national, unlike Olde and Monday’s (2021), who focus on the effect of a single statewide promise program (Tennessee Promise) across multiple community colleges.
Perhaps reassuringly, our findings suggest that colleges are not taking away from spending categories relevant for student success. Odle and Monday (2021) posited that their results could be due to Tennessee Promise’s concentrating spending on more scholarships to students (our study did not examine spending on scholarships given high levels of missing data for that variable). As mentioned previously, different findings across studies could be explained by differences in the sample, years observed, and the analytical choices made. Further research is warranted using more detailed finance data on community college budgets that contain line items for promise program activities. More detailed budgets beyond what is available in IPEDS would provide a clearer picture of the shifts in spending after community colleges partner with promise programs. Currently, the IPEDS data are unable to isolate spending specifically for promise programs since these data capture spending for a variety of programs and initiatives.
Aside from scholarships, institutional expenditures may not change because of cost-sharing models of many promise programs and staff members’ expanded responsibilities to accommodate promise-related tasks (Monaghan & Attewell, 2023; Perna et al., 2020). Institutional practices to prioritize student services and deliver programs such as academic advising to promise students may not manifest in detectable changes to student services spending or academic support. Furthermore, institutional efforts associated with promise program operations, including promoting student success, may be funded by external entities (Ballerini et al., 2019; College Promise, 2020; Meehan et al., 2019). Such efforts would not be reflected in the college’s budget.
It is also feasible that community colleges are shifting funding within expenditure categories (e.g., from a student success program for all students to a program targeting promise students), which we would not be able to capture in our study. We found evidence that was consistent with this practice from a separate, ongoing qualitative study on promise program finances and support services. In spring 2023, three out of the four authors interviewed administrators and staff at community colleges. A promise program director at one of our mixed-funding colleges explained how they asked their partners to dedicate resources for promise students from “teams that already exist” because “it’s not an ask that costs additional funds.” Instead, they reasoned, “it’s more just a repurposing of personnel to case manage or service a specific group.” While it is unclear how widespread this practice is, the anecdote highlights why we may not detect shifts in spending in our data given the broad expenditure categories in IPEDS. Additionally, colleges could be relying on lower-cost strategies to engage and support students (e.g., information sharing via websites and YouTube videos) given their smaller budget compared with 4-year institutions (Feldman & Romano, 2019).
Findings from this study have direct implications for community college stakeholders by generating knowledge about expenditures within colleges and starting the conversation about adequacy of financial support. Because our findings show that publicly funded programs direct additional support to student services, perhaps promise programs should evaluate their existing funding priorities and identify whether this increase results in improved retention and graduation outcomes. Student services are critical because capacity constraints can emerge for student affairs practitioners if they are tasked with serving more students (due to enrollment increases from promise programs) within the same budget. Our study expands prior research on promise programs, which has overwhelmingly focused on the effects of these programs on students. In particular, this study is one of the first few to pay specific attention to privately versus publicly and mixed-funded programs.
Footnotes
Appendix
Effect of Promise Programs on Revenues.
| All programs | Privately funded programs | Publicly funded programs | Mixed funded programs | |||||||||
|---|---|---|---|---|---|---|---|---|---|---|---|---|
| (1) | (2) | (3) | (4) | (5) | (6) | (7) | (8) | (9) | (10) | (11) | (12) | |
| Variable | Local appropriations (log) | State appropriations (log) | Tuition and fee revenue (log, gross) | Local appropriations (log) | State appropriations (log) | Tuition and fee revenue (log, gross) | Local appropriations (log) | State appropriations (log) | Tuition and fee revenue (log, gross) | Local appropriations (log) | State appropriations (log) | Tuition and fee revenue (log, gross) |
| Treat × Post (1-year lag) | −0.17 (0.31) | −0.12 (0.24) | −0.14*** (0.03) | 0.32 (0.28) | 0.10 (0.15) | −0.11** (0.04) | −2.30** (0.85) | 0.00 (0.58) | −0.17** (0.07) | −0.03 (0.13) | 0.09 (0.11) | −0.20*** (0.04) |
| County: Population (log) | −1.12 (0.91) | 1.30 (0.99) | 0.87*** (0.15) | −3.32 (2.17) | −1.51 (1.23) | 0.93** (0.33) | 1.00 (1.44) | −1.26 (1.37) | 1.02*** (0.17) | −2.50 (1.63) | −1.21 (0.81) | 1.46*** (0.26) |
| County: Personal income per capita (1,000s) | 0.01 (0.01) | −0.01 (0.01) | −0.00 (0.00) | 0.07 (0.05) | −0.10* (0.05) | 0.02*** (0.01) | 0.04 (0.04) | −0.07 (0.04) | 0.02*** (0.00) | 0.02 (0.01) | 0.00 (0.01) | −0.00 (0.00) |
| County: Unemployment rate | −0.05 (0.04) | 0.11 (0.07) | 0.02* (0.01) | 0.03 (0.04) | 0.09 (0.05) | 0.05** (0.01) | −0.11 (0.06) | 0.27** (0.09) | 0.04* (0.01) | 0.03 (0.03) | 0.12* (0.05) | 0.02 (0.01) |
| County: Percent poverty | 0.05 (0.03) | 0.00 (0.06) | 0.03*** (0.01) | −0.03 (0.03) | 0.04 (0.03) | 0.03* (0.01) | 0.01 (0.04) | −0.01 (0.07) | 0.03** (0.01) | −0.02 (0.02) | 0.03 (0.02) | 0.03** (0.01) |
| R 2 | 0.91 | 0.55 | 0.94 | 0.93 | 0.61 | 0.94 | 0.89 | 0.59 | 0.94 | 0.96 | 0.61 | 0.94 |
| N (college-years) | 966 | 966 | 966 | 658 | 658 | 658 | 644 | 644 | 644 | 714 | 714 | 714 |
p < .05. **p < .01. ***p < .001.
Author’s Note
Xiaodan Hu is now affiliated to Southern Methodist University, Dallas, USA.
Declaration of Conflicting Interests
The author(s) declared no potential conflicts of interest with respect to the research, authorship, and/or publication of this article.
Funding
The author(s) received no financial support for the research, authorship, and/or publication of this article.