
Abstract
Community colleges serve as an entry point into postsecondary education for a third of first-time college students (Digest of Education Statistics, 2018), including many who plan to earn a Bachelor’s degree (Fink, 2017). By taking up to half of their courses at a community college before transferring to a bachelor’s degree-granting institution, transfer students may be able to realize considerable financial savings, less loan debt, and improved economic stability due to lower average costs of attendance at community colleges (Belfield & Bailey, 2011). Yet transfer students are only able to enjoy these benefits if their transfer pathway supports a smooth curricular transition to and through their selected 4-year institution. Recent research indicates that support at 2- and 4-year colleges, such as transfer advising and transfer articulation agreements, are an important component of transfer success (Hodara et al., 2016). Despite their importance, access to this support and other educational resources are not distributed equally and often depend on a student’s geographic context (Lobao et al., 2007; Roscigno & Crowley, 2001).
The purpose of this study is to better understand the relationship between characteristics of transfer students’ geographic context and their 4-year curricular outcomes. These curricular outcomes fall into two main categories: (1) credit transfer and efficiency and (2) academic major choice behavior. Credit transfer and efficiency include the number of community college credit hours students can use toward their bachelor’s degree program requirements (transfer) as well as overall excess credits upon graduation (efficiency). The number of majors a student declares at the 4-year institution represents academic major choice behavior. Our focus on curricular outcomes provides insight into a key area of transfer student success as a student’s experience moving through the transfer process not only impacts credit applicability and efficiency but also their academic decisions (Dowd, 2012; Fink et al., 2018; Hodara et al., 2016).
Using student-level data from the University of North Carolina (UNC) system, we assess our outcomes of interest through the lens of spatial inequality theory, which argues for the importance of geography in the replication of social inequities (Lobao et al., 2007). Specifically, we operationalize county-level geographic context with measures of urbanicity, economic distress levels, and broadband internet access. Our guiding research questions are as follows:
How do characteristics of a transfer student’s community college spatial context relate to their later outcomes at the 4-year college, namely credit transfer and efficiency and major field of study choices?
How do changes in spatial context upon transfer relate to these same outcomes?
Given previous research that indicates the importance of assessing spatial dynamics through multiple frameworks (Isserman, 2005; Manly et al., 2020), our comprehensive approach to analyzing transfer student pathways represents an important contribution to the literature on community colleges and college access. In addition, our study adds to the literature on the geography of opportunity in higher education (Hillman, 2016). First, we incorporate multiple measures of spatial difference into our study—urbanicity, economic distress, and broadband access—to have a broader understanding of spatial inequality. Second, our work not only investigates how these geographic characteristics are associated with transfer student success, but also how changes in geographic context that students often experience when they transfer between postsecondary institutions are associated with student success. The results of our study have implications for researchers examining spatial inequality as it relates to student outcomes, as well as policymakers and practitioners designing student success interventions.
Theoretical Framework
Spatial inequality is a sociological paradigm that assesses the role of social institutions in the creation, mitigation, or reproduction of social stratification (Lobao et al., 2007). In particular, spatial inequality theory seeks to explain how inequality manifests across geographies, in part through unequal access to social and material resources. Given this emphasis on resource allocation across spatial context as well as prior literature that indicates institutional support for transfer may vary across geographies (Roscigno & Crowley, 2001), we ask how student movements across institutional and geographic settings may be related to their outcomes. Should students beginning in under-resourced areas or transitioning between locales with differential resource allocation appear especially vulnerable to reduced credit efficiency, excess credit accumulation, and multiple major changes, they may also be more at risk for additional debt, greater time to degree, and dropping or stopping out (Best & Gehring, 1993; Fink et al., 2018; Jenkins & Fink, 2015; Ziedenberg, 2015).
Spatial inequality theory also emphasizes the analysis of small areas, that is, geographic units below the national and state level (Lobao et al., 2007). While this approach can offer a more nuanced understanding of resource distribution across space, it presents a challenge when researchers seek to operationalize space through quantitative measures. For example, while spatial analyses often incorporate measures of rurality or urbanicity, a location’s classification can differ depending on the source and scale of the data (Isserman, 2005; Manly et al., 2020). Often, rurality is defined at the county-level where a county is designated in its entirety as either rural, suburban, or urban (Byun et al., 2012; Johnson, 2012). County-level urbanicity designations can be problematic, as they may lead researchers to overlook variability in racial/ethnic composition, geographic isolation, and opportunity structure within counties (Byun et al., 2012). Alternative definitions of rurality use sub-county areas of analysis such as census tracts, which contain roughly equal numbers of people who may experience more comparable economic or living conditions (Isserman, 2005). Due to their smaller size, census tracts can account for greater nuance in definitions of place than those aggregated to the county level. Nevertheless, census tracts remain problematic units of analysis for examining student outcomes in educational research as recent research has found that this census tract-based measures of rurality often miscategorize rural communities on the urban fringe (Burdick-Will & Logan, 2017). To mitigate these problems, literature suggests that researchers should employ composite measures of rurality that more accurately reflect the social and economic conditions related to place (Isserman, 2005; Manly et al., 2020). The present study adds to the emerging literature that considers spatial inequality and seeks to operationalize space by using several small-area indicators of a student’s educational context as a means of considering the relationship between geography and postsecondary transfer pathways.
Literature Review
Barriers to Successful Community College Transfer
Vertical community college transfer, wherein a student completes part of their degree program at a community college and part at a 4-year college, has become an essential pathway for many students with aspirations to attain a Bachelor’s degree (Jenkins & Fink, 2015; Shapiro et al., 2017). However, there is evidence that community college transfer students face many challenges, specifically surrounding credit mobility and major choice, as they progress toward their degree (Giani, 2019; Hodara et al., 2016; Simone, 2014; Ziedenberg, 2015).
Credit Transferability, Applicability, and Efficiency
Some of the most common challenges transfer students face are poor credit transferability and applicability, which can result in credit loss and excess credits at graduation, thereby hindering credit efficiency. Credit loss occurs when the receiving institution does not accept the student’s community college course credits upon transfer (poor transferability), leaving students to fulfill prerequisite or general education requirements at the 4-year college (Giani, 2019; Hodara et al., 2016). Community college transfer students lose an average of 13 credits upon enrollment at their receiving institution and 39% of transfer students are unable to transfer any credits to their 4-year college (Simone, 2014). Recent work out of North Carolina (NC) estimates that transfer students loose about 7% (4.9 credits) of earned credits upon transfer (Giani, 2019). Credit loss can lead to excess credit accumulation since students may be forced to retake courses or take additional courses to fulfill degree requirements at the 4-year college. Students may also earn excess credits at graduation if the college only accepts community college courses as elective credits (poor credit applicability).
Prior research focused on explaining variation in transfer student success has reasoned that inefficient or unarticulated transfer pathways, lack of early personalized academic advising, and student uncertainty about their choice of major field of study can exacerbate credit inefficiencies and hinder transfer student success (Giani, 2019; Goldhaber et al., 2008; Hodara et al., 2016; Mullin, 2012). Students attending schools with inefficient, under prescribed, or no transfer articulation agreements may not be able to plan their courses for transfer, leaving them susceptible to credit loss or excess credits. In addition to structural barriers, students who do not receive adequate academic advising may lack information about the transfer process, which could lead them to take courses at the community college that do not transfer into their eventual degree program. Similarly, students who have not received advising or who are unsure about their academic plans may declare a degree program upon entry to a 4-year institution only to discover that the major is not what they envisioned (Hodara et al., 2016). Students who are unhappy with their major and choose to change their course of study after transfer may lose the credits they took in their previous degree program.
Poor credit transferability, applicability, and students’ major choice decisions have implications for college affordability, as students who face credit mobility issues or change their majors may face larger financial and opportunity costs for their degrees (Fink et al., 2018). A recent study found that in one community college system, students who completed an associate degree and transferred paid for 14 excess credits at graduation on average, which cost students an additional $3,878 (Ziedenberg, 2015). In addition, students who spend more time in college delay their entry into the workforce. Given the wage premium associated with postsecondary credentials, students may be losing tens of thousands of dollars in foregone earnings when they do not complete their college degrees in a timely fashion (Ma et al., 2019). Due to the impact that credit transferability and applicability can have on transfer student success, we include credit transfer, excess credit accumulation, and number of major changes as our dependent variables of interest in this study.
The body of literature reviewed thus far suggests that student transfer success is determined by contextual factors at both the 2- and 4-year college. While this research is useful in conceptualizing ways in which both 2- and 4-year institutions can ameliorate transfer inefficiencies, spatial inequality theory suggests that these resources and policies are not equally distributed across geographic contexts (Lobao et al., 2007). Despite this work, we lack an understanding of how unequal spatial distribution of resources relates to transfer student success.
Spatial Inequality and Community College Transfer
Research on the relationships between geography, the economy, and infrastructure and postsecondary access and success reveal that students who transfer to and from lower-resourced areas may experience worse post-transfer outcomes (Calcagno et al., 2008; Dickes et al., 2010; McHenry & McInerney, 2014). In this section we present literature that speaks to the relationship between our indicators of spatial inequality—rurality, economic distress, and internet access—and transfer student success.
Rural Locales
Spatial inequality theory notes that resource distribution may vary by geographic context (Lobao et al., 2007). Students attending rural community colleges may face unique challenges in the transfer process compared to their (sub)urban peers, as rural institutions are often smaller, have fewer resources such as academic advisers, and lack the capacity to offer a wide variety of courses (Calcagno et al., 2008; Dougherty, 1994; Leist & Travis, 2010; Murray, 2007). Access to academic advising is a particularly crucial resource for course planning. A recent survey of academic advisors indicates that those at small institutions are often charged with many responsibilities outside of academic advising, therefore limiting the time available to focus on advising (National Academic Advising Association, 2011). This overreliance on advisors for non-advisory roles could prevent students at rural colleges from accessing the types of pre- and post-transfer academic advising that have been linked to reduced credit loss and excess credit accumulation (Hodara et al., 2016).
Similarly, rural community colleges often employ fewer faculty members than their urban counterparts (Leist & Travis, 2010). In some cases, one or two faculty members serve as the only instructor for their disciplines (Murray, 2007). Given these resource constraints, rural community colleges may not be able to offer a wide variety of courses or multiple sections of popular transfer courses in every semester. Students transferring from rural community colleges may be unable to take the exact courses needed to fulfill early degree requirements, which could prevent them from advancing through the courses in their degree sequence in a timely manner once enrolled at the 4-year college (Kilgore et al., 2019). Students who are unable to fulfill early degree requirements or continue their progress toward degree completion upon transfer will likely face additional credit accumulation as they retake courses or wait for courses to be offered (Kilgore et al., 2019). Students concerned about the cost of their education or time-to-degree may consider changing their major rather than accumulating credits or delaying graduation (Wright, 2018).
Students attending rural institutions are not at a deficit, however. While several characteristics of rural institutional contexts may be detrimental to transfer student success, literature also indicates that these students enjoy unique social support within their communities (McNamee, 2019; Tieken, 2016), which they leverage to support their educational aspirations. It is possible that students transferring from close knit, rural communities may experience an added level of support, leading them to excel in college and pursue challenging majors. Considering literature detailing the possible impact of unique social supports and limited institutional resources in rural areas on transfer, we have chosen to examine whether students transferring to and from rural locales experience different post-transfer outcomes.
Economic Inequality
In addition to geographic context, spatial inequality theory and research on educational attainment has acknowledged the important role of economic context in shaping student outcomes (Coleman et al., 1966). Categorizations of geographic locale such as urban versus rural tend to be closely intertwined with other important predictors of postsecondary success such as median income, education levels, and economic activity within the surrounding community (Ardoin, 2018; Byun et al., 2015; Roscigno & Crowley, 2001). While rurality is not synonymous with poverty (Provasnik, et al., 2007; United States Department of Agriculture, 2017), students transferring to and from low-income communities face many of the same barriers to transfer success as students attending institutions in rural communities. Low-income communities are often characterized by low postsecondary education attainment, which suggests that students in these communities may have access to fewer college knowledge resources like transfer advising than their peers in high-income communities (Perna, 2006). This is especially true in the context of this study. Because NC community colleges rely on local funding, it is likely that colleges in economically distressed counties have fewer resources than their counterparts in wealthier counties (North Carolina General Assembly, 2016).
The transition from low-income to high-income areas could also affect student outcomes. When students move from low-income to high-income communities upon transfer, they are likely to experience an increase in their cost of living, as rental prices are often driven up by high-income households (McHenry & McInerney, 2014). This increase in the indirect costs of their education in addition to likely greater direct costs of tuition and fees at the 4-year institution may prompt transfer students to attempt to save money by taking reduced course loads or working to reduce excess credits by switching to a major that will accept more of their existing credits (Mukherjee et al., 2017; Wright, 2018).
Infrastructural Barriers
Finally, spatial inequality theory recognizes that social resources may vary across space (Lobao et al., 2007). In addition to a county’s degree of rurality and the health of the local economy, infrastructural barriers, such as limited or slow broadband internet access, have been shown to impact college access as students traverse the geographic landscape to attain their degrees (Cejda, 2007; Skinner, 2019). Policy discourse over the last two decades has repeatedly highlighted the presence of a “digital divide” between rural and urban America as broadband access in cities and suburbs has dramatically outpaced the provision of high-speed internet in rural communities (Dickes et al., 2010; Strover, 2003). Digital divides not only exist between communities but also within, as recent research has found disparities in broadband access for low-income people and people of color tied to Depression-era redlining practices (Skinner et al., 2021). The current study conceptualizes broadband access as an important means of accessing information about transfer pathways (Pew Research Center, 2018). Students with poorer access to online transfer plans and academic advising may make less-informed course planning, and in turn less-than-efficient outcomes like major change after transferring to a 4-year institution (Smith et al., 2009).
In sum, prior research emphasizes that financial, social, and informational resources offered within institutions and communities likely influence post-transfer outcomes. Despite their importance, the theoretical framework for this project notes that these resources are often distributed unevenly across space (Lobao et al., 2007). This study examines whether students’ transitions between lower and higher resource areas and institutions upon transfer have a bearing on student success. Drawing on previous literature and spatial inequality’s emphasis on the social, economic, and geographic factors that affect resource distribution, we examine whether changes in context upon transfer affect post-transfer outcomes. We begin with a county-level measure of spatial boundaries from the U.S. Census Bureau’s three-category locale coding that captures urbanicity. We also test a state-specific composite economic measure of space, the North Carolina Department of Commerce’s (n.d.) County Distress Tiers, that notes county-level economic distress. Finally, we use measures of broadband internet access from the Federal Communications Commission in a student’s community college service area that capture differences in technological infrastructure across space.
Method
The current study builds on the bodies of literature on resource distribution across geographies and community college transfer and provides a more nuanced understanding of the relationships between different aspects of spatial inequality and transfer students’ curricular outcomes. Specifically, we analyze how various measures of rurality, economic distress, and access to broadband internet are associated with credit transfer, excess credit accumulation, and academic major choice behaviors. In addition to accounting for students’ community college contexts, we also adopt a perspective of geographic and economic measures that accounts for changes in students’ contexts when they transfer. In a second set of analyses, we examine how changes in rurality, economic distress, and access to broadband are associated with the same student curricular outcomes. With these analyses, we consider that the transition from 2- to 4-year itself, in addition to baseline measures of the community college area, may play an equally important role in the success of transfer students.
Data
The primary dataset for this study comes from the UNC System Office, which we accessed through the Belk Center for Community College Leadership and Research. This data includes all students who transferred from one of the state’s 58 community colleges to one of the 16 4-year UNC System institutions during four academic years: 2015 to 2016 to 2018 to 2019 (N = 47,116). This dataset contains rich information regarding students’ background characteristics and their academic pathways post-transfer, most notably our three post-transfer outcomes of interest. Our motivation for including students transferring in these four specific academic years was due to availability of data on broadband internet access, one of our predictors of interest, and a change in state transfer policy in 2014. Briefly, in 2014, NC adopted a revised comprehensive articulation agreement, which previous research has shown to impact at least one of our outcome variables (credit accumulation) (Worsham et al., 2021). Consequently, we limit our analyses to the period after this policy change. Data from several additional external sources, described below, served to supplement this primary dataset with variables capturing measures of spatial inequality and institutional characteristics.
Outcomes of Interest
The first outcome (or dependent variable) of interest in this study is the number of transfer credits that a student was able to apply to their declared degree program in the first term post-transfer at a UNC System institution. Our second outcome of interest was the number of excess credits that a student had accumulated at the time of bachelor’s degree completion. To calculate this outcome, we first limited the dataset to students who had completed a bachelor’s degree (N = 12,032) and then subtracted 120 (the number of credits required for a typical bachelor’s degree) from the cumulative credits that a student had accumulated at graduation. Most, but not all degrees require 120 credits, therefore there may be some error in the analysis. To calculate our third outcome, the number of majors a student declared while enrolled at their UNC System institution, we counted the number of unique CIP (federal classification of instructional programs) codes assigned to each student over the course of their enrollment. These codes represent any major (first or second) that a student had declared at the UNC System institution. For this outcome, we also limited the dataset to students who had completed a bachelor’s degree.
Predictors of Interest
Our predictors of interest in this study correspond to county-level measures of spatial inequality during the year that a student transferred and are based on either the location of a student’s community college or the location of both their community college and their 4-year transfer institution. This latter group of predictors accounts for the fact that when students transfer, they often experience shifts in their spatial environment, such as a shift from a more rural location to a more urban one or a shift from an economically prosperous location to a less prosperous one. Our first predictor of interest was derived from the U.S. Census Bureau’s three-category locale coding which classifies all counties as either mostly urban (at least 50% of people in the county are living in urban settings), mostly rural (50–99.9% live in a rural area), or completely rural (100% live in a rural area) and corresponded to the physical address of students’ postsecondary institutions. In our statistical models, we first accounted for this measure at the student’s community college, with no reference to the locale of their 4-year institution. We then used these categories to calculate a variable that ranged from −2 to 2, with 0 representing no change in locale category due to transfer. This variable increased in value as a student moved from a rural location to a more urban location when they transferred institutions. For example, if a student transferred from a community college located in a completely rural area to a 4-year institution located in a mostly urban area, that student was assigned a 2. A student who transferred from a mostly rural community college to a completely rural 4-year institution was assigned a −1.
We defined the changes in economic conditions in a student’s surrounding location that may have occurred concurrent with transfer in a similar way. The NC Department of Commerce defines economic distress tiers each year based on the economic well-being of individual counties (North Carolina Department of Commerce, n.d.). This measure incorporates a county’s adjusted property tax base per capita, percentage population growth, median household income, and average unemployment rate to produce a categorical measure of economic well-being. In this system, the most economically distressed counties are classified as Tier 1, while the least distressed are designated Tier 3. These tiers are used by state programs to support economic activity in less prosperous counties (North Carolina Department of Commerce, n.d.). For our study, we first used the categorical measure corresponding to the county where the students’ community college sits. There are some colleges, especially those in rural areas, that serve multiple counties; however, this measure only considered the geographic setting of the college. We do not believe that this aggregation will affect our findings, as counties that are served by the same community college generally have similar economic conditions, as seen in the county tier designations (North Carolina Department of Commerce, n.d). We then calculated a measure that increased in value (again, ranging from −2 to 2) as a student moved from a less economically prosperous location to a more economically prosperous location when they transferred. We used the tier designation that applied the year that students first enrolled, so if a student enrolled in 2014, we used the definition from 2014. For example, if a student transferred from a community college located in a Tier 3 county (the lowest tier of economic distress) to a 4-year institution located in a Tier 2 county, this student was assigned a −1. A student transferring from a community college in a Tier 1 county to a 4-year institution in Tier 3 was assigned a 2.
We also included two predictors representing spatial inequality and infrastructural barriers in a student’s community college environment, both of which relate to the student’s ability to access online information regarding transfer. Specifically, these variables corresponded to measures of fiber internet access that we constructed using fixed (non-mobile) broadband data from the Federal Communication Commission FCC 477 forms. In their raw form, these data report maximum advertised download and upload speeds across a range of technologies (e.g., DSL, cable modem, fiber to the home) offered by internet service providers across the United States, with records at the Census block level. For our analyses we created two variables that we assign to each NC community college. The first is the average proportion of the college’s service area with access to fiber to the home (FTTH), which we define as having an internet service provider (ISP) that offers FTTH in the area. 1 The second is the average number of unique FTTH ISPs in the institution’s service area. Together, these measures serve as proxies for students’ broadband access options. Aggregating these values from the Census block level, we first computed averages at the Census block group level (one level up). We next aggregated these Census block group averages to each college’s service area using Census block group population counts from the 2010 decennial Census as weights. In using population weights, we account for the fact that students in a college’s service area are not equally dispersed, but instead are likely to come from higher population areas.
Covariates
We include both student- and community college-level covariates in our analyses. At the student level, we include indicators of whether a student received federal Pell grant funding (a proxy for individual socioeconomic status), racial/ethnic identity, and gender (coded as a binary value in the administrative data). We also included covariates representing students’ academic pathway prior to transfer. The first was a covariate indicating whether the student earned Advanced Placement (AP) or International Baccalaureate (IB) credit prior to enrolling in postsecondary education. We also included an indicator corresponding to the community college degree that a student earned, if any, prior to transfer: Associate in Arts (AA), Associate in Science (AS), Associate in Applied Science (AAS), or a different kind of associate degree. Inclusion of this indicator is important, since NC’s Comprehensive Articulation Agreement guarantees junior status to students who transfer from a community college to a public 4-year institution in the state after having earned an AA or AS degree (North Carolina Community College System, 2014). Moreover, another study suggests that students who earn an associate degree prior to transfer are more successful at their 4-year institution, linking community college credentialing explicitly to several of our outcomes of interest (Wang et al., 2017).
At the community college level, we include covariates corresponding to total enrollment, to account for the size of the school that a student attended, Carnegie undergraduate instructional program classification (transfer focus, vocational focus, and mixed transfer/vocational focus), 2 the percentage of students of color enrolled (defined as all non-White students), percentage of students receiving Pell funding, expenditure on instruction per student, expenditure on academic support per student, and the college’s student-to-faculty ratio. These variables were derived from IPEDS and corresponded to the year when students transferred. These covariates account for differences in the scholastic environments that students experienced prior to transfer, which may impact their outcomes. Further, in light of our conceptual framework, these covariates account for differences in resources across campuses and geographies that may contribute to student success.
Analysis
To explore the relationship between our spatial inequality variables and our outcomes of interest, we estimated a series of regression models. For our outcomes that involved counts skewed towards zero—number of excess credits a student accumulated at the time of bachelor’s degree completion and number majors a student declared—we used a negative binomial regression model.
A negative binomial regression model is a generalized version of a Poisson regression, a more standard analytic approach for count outcome variables, that accounts for one of its limitations, the potential for data overdispersion (Cameron & Trivedi, 2001; Coxe et al., 2009). Specifically, one assumption of a Poisson model is that the conditional mean and variance exhibit equal values. However, counts may exhibit more variability than expected in a standard Poisson regression, thus biasing model standard errors (Coxe et al., 2009). The probability distribution function of a Poisson regression follows a Poisson distribution, as in equation (1)

where

where α accounts for overdispersion in the standard Poisson model. If α is equal to 0, then there is no overdispersion and the model reduces to a standard Poisson regression (Coxe et al., 2009).
For our applied credits at transfer variable, a continuous variable, we employed an ordinary least squares (OLS) regression model. This model is represented in equation (3)

where
We estimated a total of six regression models, each with a different model specification. The first three regression models included predictors of interest that corresponded only to students’ community colleges: locale, economic tier, and the two FTTH measures. In the second three regression models, we included our change predictors for locale and tier, while also accounting for the same community college FTTH measures. For each outcome variable and measurement scenario, we entered three types of predictors: our predictors of interest to explain the outcome variable, covariates corresponding to students’ demographic profiles and their pre-transfer academic pathways, and covariates corresponding to students’ community college contexts. When our predictors of interest included changes in locale or economic tier rather than these variables corresponding to only a student’s community college, we also control for the student’s community college locale and economic tier to isolate the relationship of the change in these variables from characteristics of the location where students began their postsecondary studies. For negative binomial regression models, we converted coefficients to average marginal effects for the purpose of interpretation (results tables including original coefficients are available upon request).
Results
Descriptive Statistics
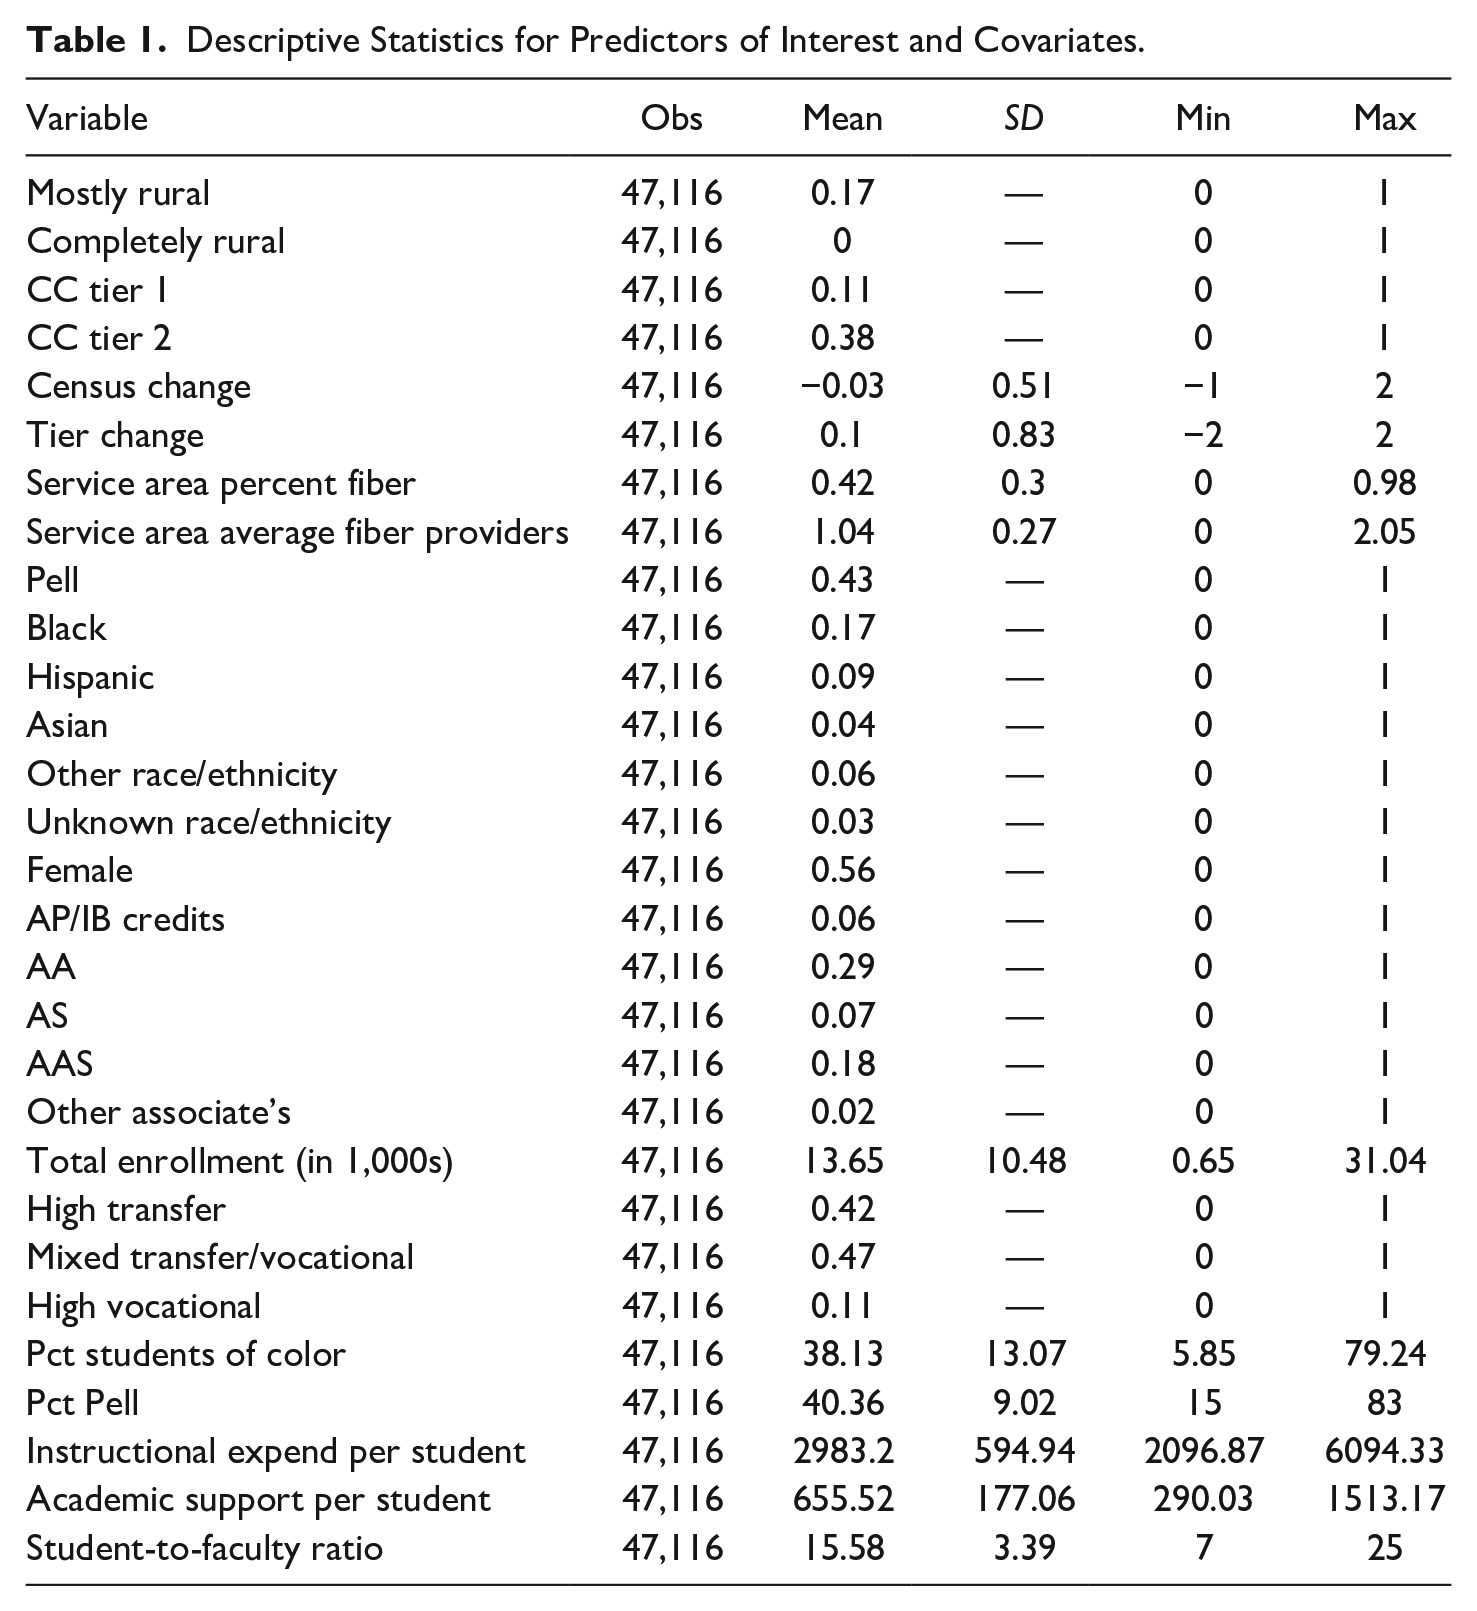
Table 1 provides a descriptive overview of the students in our dataset and spatial indicators of their transfer experiences. Focusing first on our predictors of interest, this table indicates that around 17% of students attended a community college in a “mostly rural area,” with less than 1% attending a community college in a “completely rural” area (the rest of students attended community college in an urban area). Regarding economic prosperity, around 11% of students attended a community college in the least prosperous (Tier 1) economic tier, while 38% attended community college in the middle tier (Tier 2) (the remaining students attended a community college in the most prosperous economic tier, Tier 3). When they transferred, students, on average, transitioned from a less rural area to a more rural area and from a less economically prosperous area to a more economically prosperous area. Students transferred from community colleges located in service areas with a population-weighted average of 42% FTTH access and with a population-weighted average of around one fiber provider.
Descriptive Statistics for Predictors of Interest and Covariates.
Community College Indicators Regression Results
Table 2 presents the results of regression models that use our predictors of interest corresponding to students’ community college contexts. This table indicates that students who attended community colleges in a completely rural area transferred in more credits to their degree programs in their first term and graduated with more excess credits compared to students who attended community college in an urban area. More specifically, students who transferred from a community college in a “completely rural” county transferred around six credits more (p < .001) and graduated with around seven excess credits (p < .05) as compared to those attending urban community colleges. In contrast, students attending a community college in the “mostly rural” category transferred around one fewer credit to their declared degree program at the time of transfer compared to those attending urban community colleges (p < .01). These students did not graduate with more or fewer excess credits compared to their urban peers.
Results of Regression Models Predicting Credit Transfer, Excess Credits, and Number of Majors Using Community College Predictors of Interest.
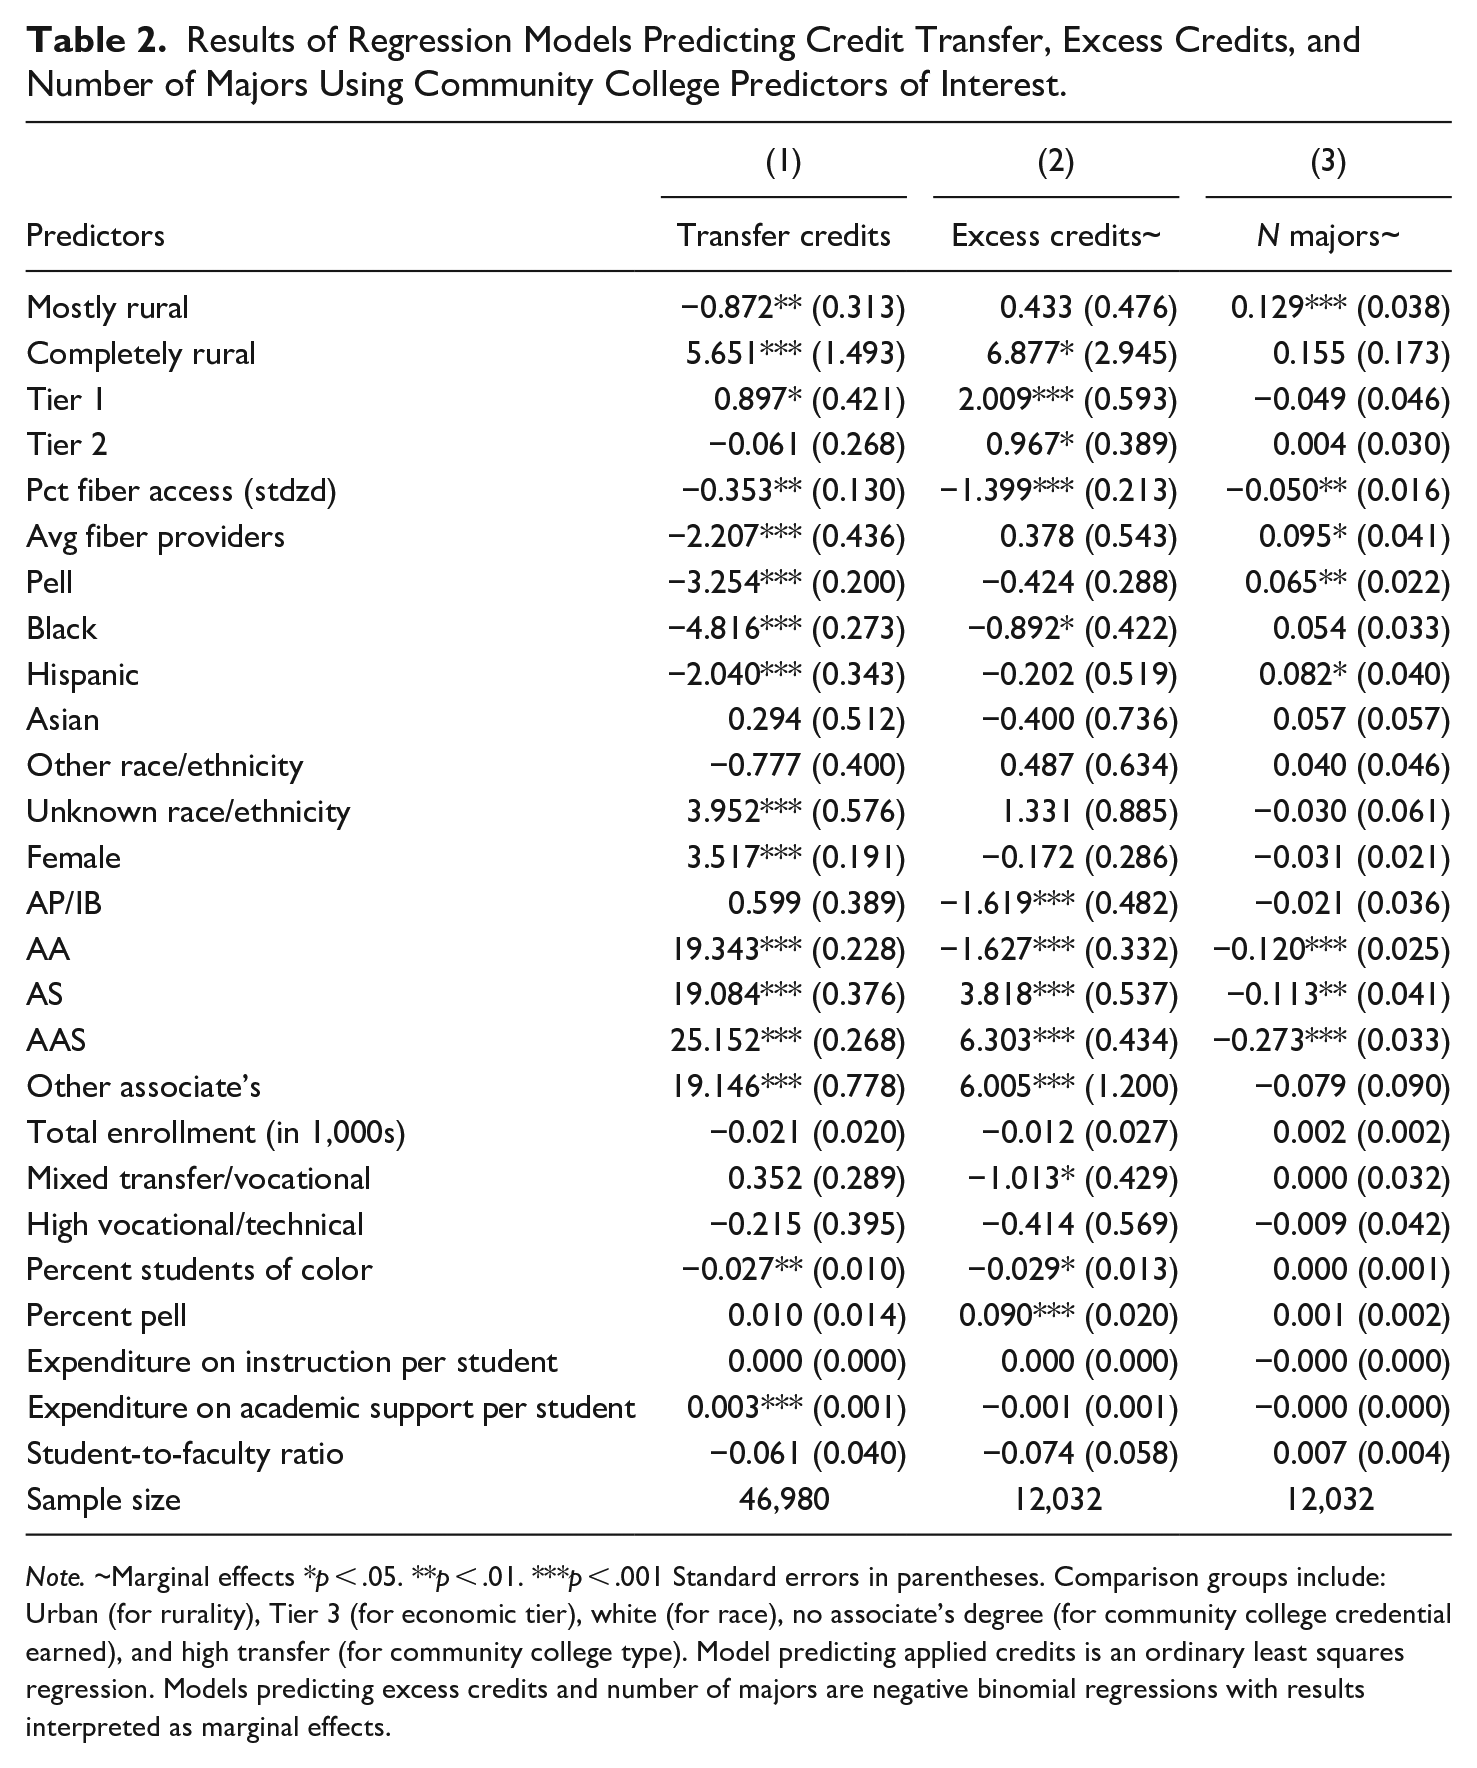
Note. ~Marginal effects *p < .05. **p < .01. ***p < .001 Standard errors in parentheses. Comparison groups include: Urban (for rurality), Tier 3 (for economic tier), white (for race), no associate’s degree (for community college credential earned), and high transfer (for community college type). Model predicting applied credits is an ordinary least squares regression. Models predicting excess credits and number of majors are negative binomial regressions with results interpreted as marginal effects.
Students attending community college in less economically prosperous counties transferred more credits to their degree programs and graduated with more excess credits. Compared to Tier 3, the most economically prosperous category, students in Tier 1 counties transferred around one additional credit (p < .05) and graduated with around two excess credits (p < .001). Students in Tier 2 counties graduated with approximately one more excess credit (p < .05) compared to those in Tier 3. Finally, both of our FTTH variables were negatively related to applied credits, and the percentage of individuals with access to fiber was negatively related to excess credits. A standard deviation increase in the proportion of individuals with access to FTTH in the community college service area was related to a decrease of around 0.3 transferred credits (p < .01) and around one excess credit (p < .001). An increase in the average number of FTTH providers in the community college service area was associated with a decrease of around two transferred credits (p < .001).
Regarding number of majors, we found that, compared to students attending community college in an urban area, those attending community college in a mostly rural area declared 0.13 more majors on average (p < .001). A community college’s economic tier did not significantly relate to this outcome. Regarding FTTH, these results suggest a negative relationship between the percentage of the community college’s service area with access to FTTH and number of majors declared, but a positive relationship between the average number FTTH providers and this same outcome variable. Specifically, a standard deviation increase in access to FTTH corresponded to an approximate 0.05 decrease in the number of majors a transfer student declared (p < .01). A one-unit increase in average FTTH providers, on the other hand, corresponded to an approximate increase in 0.10 majors (p < .05).
Change Indicators Regression Results
Table 3 summarizes our regression results when using the change indicators for locale and economic tier rather than only the measure corresponding to students’ community colleges. Compared to the measures in the first set of regressions, these variables account for the movement that happens when students transfer from one institution to another, potentially experiencing a change in locale or economic prosperity surrounding the student. We observed that a one-unit change in our Census change variable (indicating a transfer from a more rural community college to a less rural 4-year institution) was associated with an average increase of around 1.4 credits transferred to a student’s declared degree program (p < .001) and around 2.3 excess credits at the time of graduation (p < .001). In contrast, a one unit change in our Tier change variable (representing a transfer from a community college located in a less economically prosperous area to a 4-year institution in a more economically prosperous area) was associated with a decrease of around 2.3 transferred credits (p < .001) and a decrease of around 3.2 excess credits (p < .001). Our FTTH variables indicated a negative relationship with transferred credits, with a one unit increase in standardized percentage access to fiber corresponding to a 0.4 decrease in transferred credits and a one unit increase in average fiber providers corresponding to around two fewer transferred credits (p < .01 and p < .001, respectively). Percentage fiber access also exhibited a negative relationship with excess credits, with a one unit increase corresponding to 1.4 fewer excess credits at graduation (p < .001).
Results of Regression Models Predicting Credit Transfer, Excess Credits, and Number of Majors Using Change Predictors of Interest.
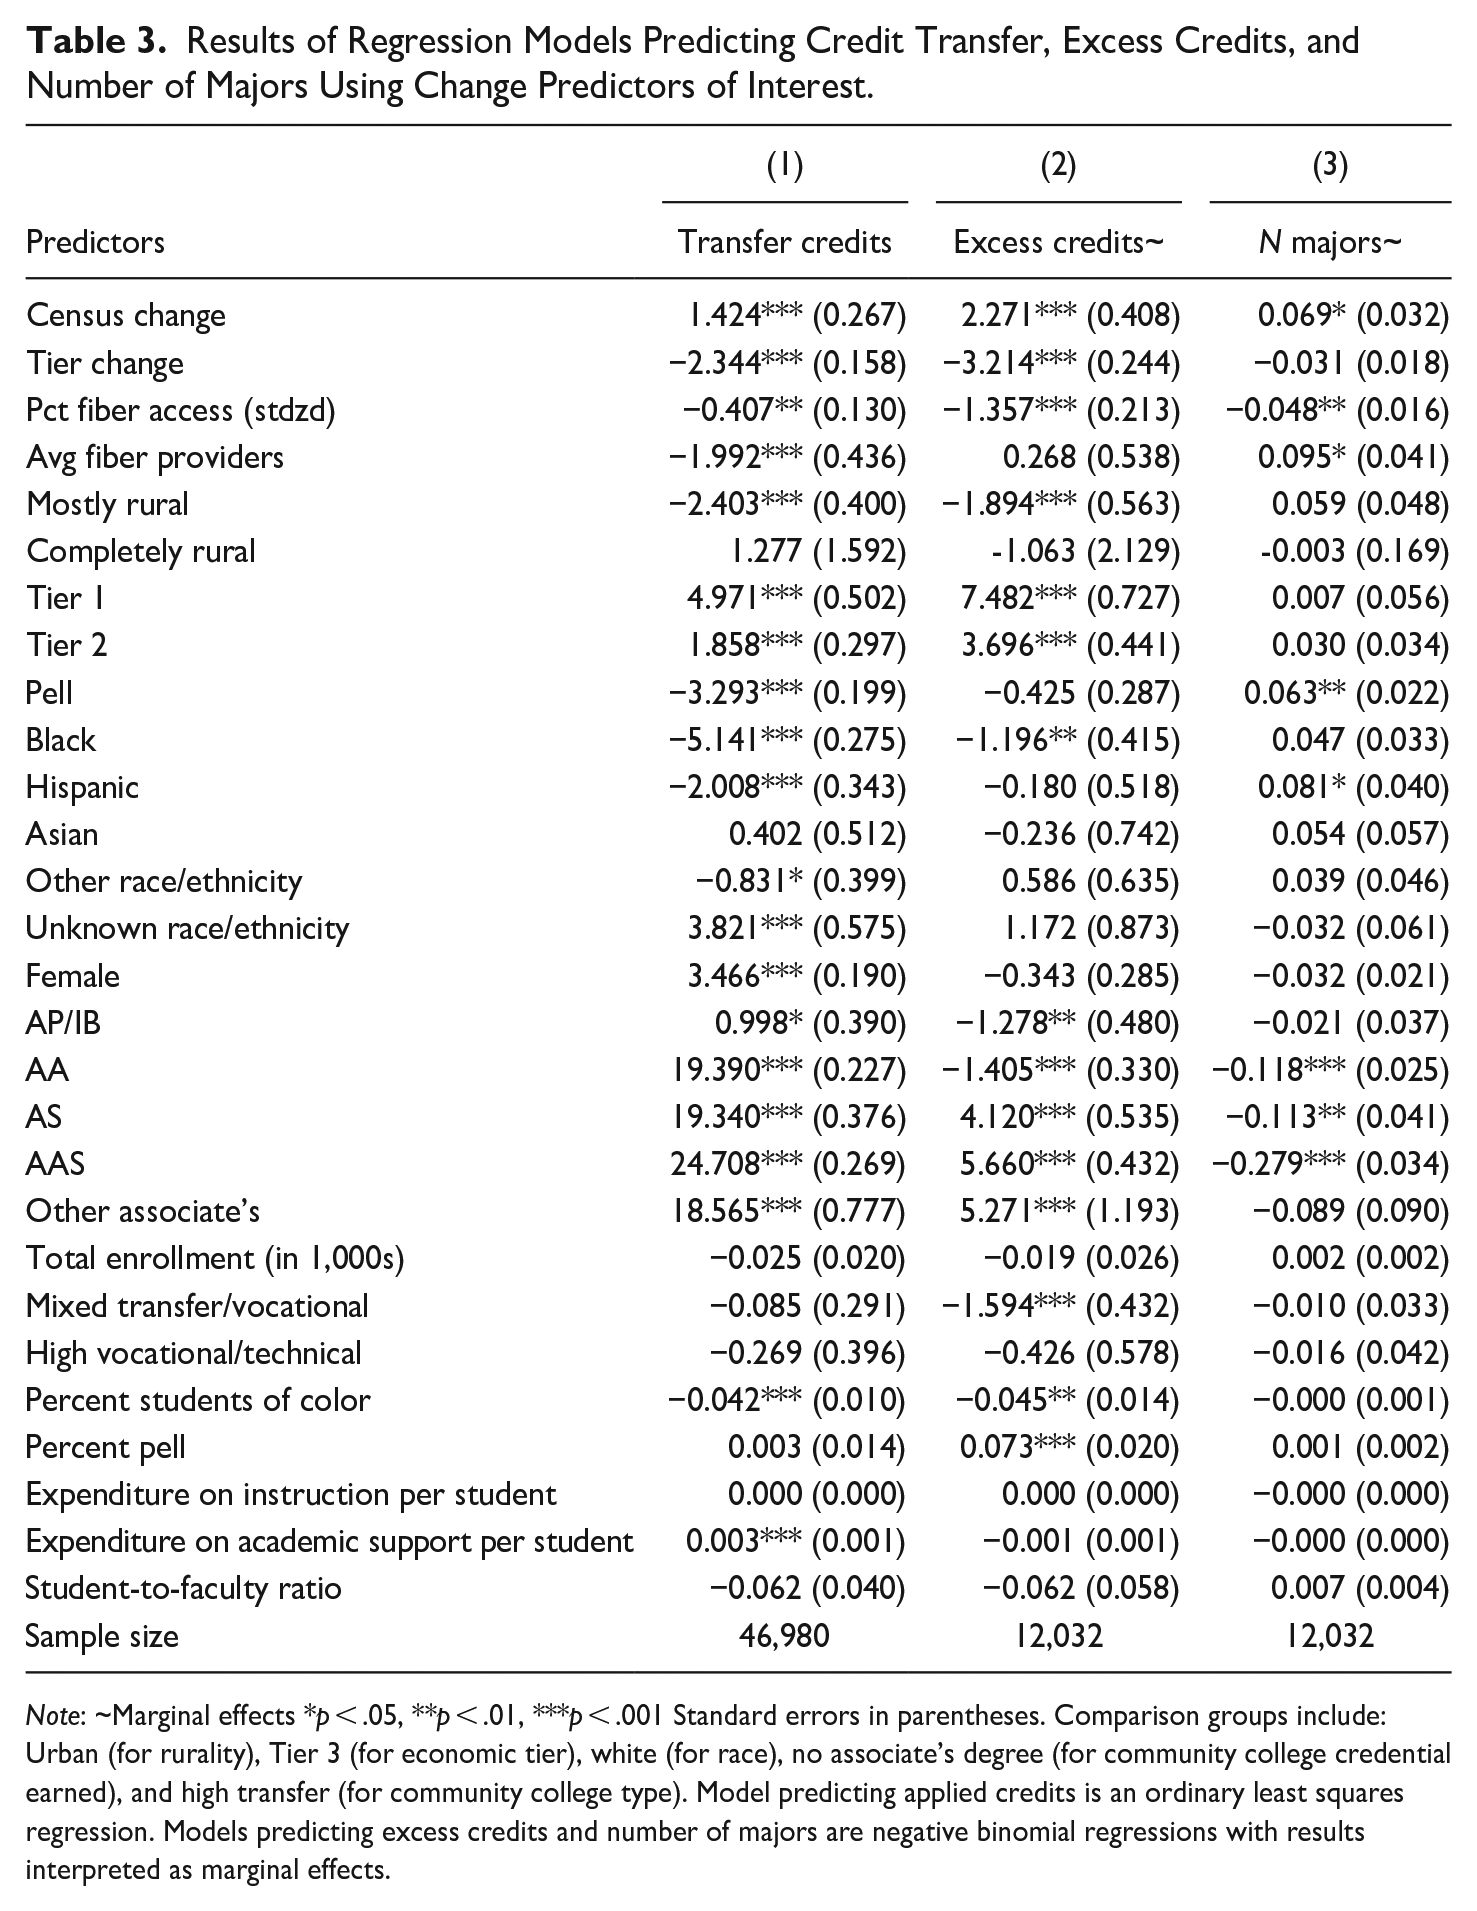
Note: ~Marginal effects *p < .05, **p < .01, ***p < .001 Standard errors in parentheses. Comparison groups include: Urban (for rurality), Tier 3 (for economic tier), white (for race), no associate’s degree (for community college credential earned), and high transfer (for community college type). Model predicting applied credits is an ordinary least squares regression. Models predicting excess credits and number of majors are negative binomial regressions with results interpreted as marginal effects.
Regarding our major change outcome, we found that a one-unit increase in our Census change variable corresponds to an increase of around 0.07 majors declared on average (p < .05). Concerning FTTH, we observed a negative relationship between percentage of a service area with access to fiber and number of majors declared, with a one unit increase in this standardized variable corresponding to a decrease of around 0.05 a major (p < .01). At the same time, a one unit increase in the average number of fiber providers corresponded to an increase of 0.1 majors declared (p < .05).
Limitations
Although this study contributes significantly to our understanding of spatial inequality and transfer student success, it suffers from several limitations due to the data that we employed. Because our data come from the UNC System, we do not have access to key variables that occurred while students were enrolled at the community college, including students’ specific topical area of concentration within their degree programs, information regarding their course-taking at the community college, exposure to academic advising, or a variable corresponding to whether students participated in dual enrollment while in high school. Our use of county-level measures of spatial inequality also presents a potential limitation of this study, as students living within the same county may live in very different spatial contexts. Whereas a student who lives in the urban center of a particular county may have access to considerable resources, such as high-speed internet, this may not be the case for students living further away from this urban center. However, given the salience of the county context for policymakers who allocate funding and make other decisions about postsecondary education in NC, we consider our selection of the county as the unit of analysis for spatial inequality measures one that produces results with clear policy implications.
Discussion
Drawing upon spatial inequality theory, our study produced evidence that the spatial context in which community colleges and 4-year institutions are situated is related to transfer students’ subsequent educational outcomes.
Geographic Locale
With respect to our first category of outcomes, credit transfer and excess credit accumulation, we find that students beginning at a community college in the “completely rural” category transferred more credits to their declared degree program in the first term post-transfer and earned more excess credits upon graduation compared to those who attended urban community colleges. Similarly, our analyses focused on changes in geographic context upon transfer indicated those transferring to a more urban area transferred more credits and earned more excess credits upon graduation. These results were surprising, as prior literature on credit mobility notes that a students’ ability to transfer credits to their program of study is crucial in ensuring credit efficiency (Giani, 2019; Hodara et al., 2016). However, it appears that, in our sample, there is potential for a positive relationship between the number of credits transferred into students’ degree programs in their first term post-entry and excess credits at graduation, which is a symptom of credit inefficiency. These results appear to be a result of poor credit applicability (credits transferred as electives rather than filling core major requirements). Students attending 2-year colleges in rural communities may face fewer course offerings and fewer advising resources (Calcagno et al., 2008; Dougherty, 1994; Leist & Travis, 2010; Murray, 2007). Therefore, due to lack of information or scarcity of courses, students may take classes at the community college that only transfer as elective credits, which can lead to excess credit accumulation (Hodara et al., 2016). Additionally, prior literature has underscored the importance of transfer advising in helping students choose their major field of study (Hodara et al., 2016). Students who attend institutions with fewer advising resources may take courses for one degree program at the community college, change their major once they have transferred, and be unaware of the implications of the decision. This would likely mean that the credits transferred to the 4-year institution would not fulfill the degree requirements of the student’s eventual major, leaving the student to accumulate excess credits to meet degree requirements.
In addition to uncovering potential credit applicability issues, the results of this study indicated some heterogeneity across rural contexts, as students transferring from community colleges in the “mostly rural” category transferred in fewer credits and earned a similar amount of excess credits at graduation as compared to their urban peers. While only a small percentage of transfer students in NC began at a “completely rural” college, these results underscore the importance of our theoretical framework’s emphasis on small area analyses, as we would not have uncovered this heterogeneity had we combined “mostly rural” and “completely rural” in our models.
Our results for the number of majors a student declared at the 4-year institution indicated that students transferring from “mostly rural” community colleges changed their degree plans more often after transfer compared to those transferring from more urban community colleges. As with the analyses of applied and excess credits, we found heterogeneity across rural contexts suggesting no effect for students transferring from completely rural colleges. In our change analyses, we also found that students transferring to a more urban area enrolled in more majors in their time at the 4-year college. Both findings could be explained by our theory that students attending rural community colleges may be unable to take courses for the field they eventually would like to study or possibly receive less support in choosing a field of study at their community college. These factors could lead to indecision about choice of study and multiple major changes.
Economic Tiers
Our models examining the role of economic context on curricular outcomes for students reveal similar patterns to our analyses considering geographic context. First, reflecting the findings of our geographic analyses, we find that students transferring from more economically distressed counties transferred in more credits and earned more excess credits at graduation. It is possible that these results can again be explained by opportunity and support structures within the community college. Institutions in more economically distressed areas may have fewer resources available to provide robust academic advising and have fewer instructors able to provide a wide range of coursework (North Carolina Community College System, 2021). These factors could lead students to take courses that are transferable to the 4-year college, but that only satisfy elective requirements, leading to a greater number of community college credits that become excess credits at graduation.
Our change analyses indicated that students who transfer to a more economically prosperous county tend to transfer fewer credits to their degree programs and earn fewer excess credits at graduation. We are not certain of the factors driving these results; however, we hypothesize that they may be explained by students’ cost-cutting behaviors. Students transferring from lower to higher-income areas likely experience an increase in their cost of living (McHenry & McInerney, 2014). This increased cost of attendance, beyond the tuition increase accrued when enrolling at a 4-year institution, could prompt students to take cost cutting measures such as only taking courses at the community college that they know will transfer and satisfy core degree requirements. While we have no evidence to support this assertion, these findings highlight the need for qualitative work that examines transfer student course planning decision-making.
Internet Access
The final spatial indicators included in our analyses were the percentage of the population with broadband access and the average number of broadband providers, which serve as proxies for access to and cost of broadband internet in the county of a student’s community college, respectively. We found that students transferring from counties with less access to broadband internet and fewer providers transferred more credits to their 4-year institution. Additionally, those transferring from areas with less broadband access graduated with more excess credits. These patterns were the same when we added factors related to change in geographic and economic context upon transfer.
These results could be driven by access to online coursework, as students with limited access to the internet may also have limited access to classes taught in the virtual environment (Skinner, 2019). Students unable to access certain courses online before transfer may be unable to take courses required for their degree program prior to transfer. If students are required to maintain full-time enrollment for financial aid purposes, they may fill their schedule with other courses that would transfer as electives, leading to more transferred credits and excess credits at graduation.
These results could also be a symptom of informational barriers. The UNC system institutions host information about transfer on their websites (see North Carolina State University, 2018). Students who have limited access to these resources due to internet connectivity constraints may not be able to plan their community college course taking in a way that maximizes credit transferability and applicability. Finally, it is possible that our internet access variables are another measure of wealth or economic prosperity at the community college service area level, or that the number of internet providers serves as a proxy for the cost of broadband access. Recent research has shown that access to the internet and income are highly related (Pew Research Center, 2018). Perhaps students with more limited access to broadband resources also face economic constraints and make decisions focused on reducing the cost of their degrees.
While these two internet variables yielded similar results for the credit applicability and excess credit outcomes, we observed conflicting results for the number of majors outcome. Students transferring from community college service areas with less access to FTTH enrolled in fewer majors. We believe this finding may be a result of access to online course offerings and transfer information, which can limit credit transferability and applicability. Students facing excess credit accumulation may choose to limit the number of majors they declare to expedite their path to graduation once they arrive at the 4-year institution.
Our analysis of the relationship between average number of unique FTTH ISPs in the institution’s service area revealed that students who transferred from communities with more internet service providers enrolled in more majors. These results can possibly be explained by recent telecommunications litigation in NC. In 2011, the state legislature effectively banned local governments from building telecommunications networks, which means that rural communities often do not have access to a broadband provider (O’Boyle & Mitchell, 2013). As mentioned, the UNC system hosts much of its transfer pathway information online. Students who do not face barriers to internet access may have more exposure to information about transfer pathways that are hosted on colleges’ websites. Students to whom this information is readily available may have more awareness of major options, which could lead them to make more major changes or double major.
Taken together, our results provide evidence that transfer student success varies across geographies, as posited in the theoretical framework. In particular, we found that students transferring from areas that are rural, economically distressed, or without robust broadband access tend to experience less favorable outcomes than those transferring from more urban, resourced, and connected locales. Aligned with the theoretical framework, we posit that many of the negative outcomes we uncovered are due to resource constraints.
Implications for Future Policy, Practice, and Research
The contributions of this study to policy, practice, and research are two-fold. First, we incorporated multiple measures of spatial inequality into our study rather than focusing on a single predictor. Our results demonstrate the complexity of spatial inequality, which cannot be captured using a single locale-based measure. A second contribution of this study is that it accounts for indicators of spatial inequality over the course of a transfer student’s enrollment in postsecondary education, accounting for both their community college and their 4-year institutional contexts. We encourage policymakers and practitioners to take factors related to spatial inequality, like geographic isolation, economic distress, and infrastructure, as they craft transfer policy and work with transfer students.
Measures of Spatial Inequality
Prior to engaging in this study, we expected that Census variables denoting rurality and our economic tier variables would be highly correlated and that we would therefore see similar results for these two variables across our models. Yet we found that results corresponding to these two predictors were dissimilar. One possible explanation for this counter-to-expectation finding is that many rural communities in NC, like those in the mountains or on the coast, are also home to seasonal tourism, which increases the economic prosperity of these communities and does not reflect the economic status of full-time residents. Our results are a reminder that rural communities are not always characterized by economic distress and the distinction between the two should be considered carefully in research and policy. Aligned with recommendations posed by Isserman (2005) and Manly et al. (2020), we encourage policymakers to consider various dimensions of spatial inequality when allocating funding or making decisions about education. This can be accomplished by using multiple county-level indicators together, like rurality and economic distress, to inform decisions, or creating a composite measure that more accurately reflects the social, economic, and geographic conditions related to place.
We alternatively observed that, in the context change analysis, our results regarding economic prosperity and percent fiber access tended to vary together. These results may be due to a correlation between a household’s likelihood of having internet access and its income level (Pew Research Center, 2018). Future research that examines the economic context of a specific locale should consider the extent to which access to broadband internet is an indicator of wealth. Finally, our analyses revealed that the two internet variables often returned conflicting results, which indicates that these two measures should not be considered interchangeable in research considering spatial inequality.
Finally, we relied heavily on county-level measures of spatial inequality to explore transfer student success. While this unit of measurement is salient for legislators who often prescribe policy at the county level, the scale of the measure undoubtedly obscures variability in racial/ethnic composition, geographic isolation, and opportunity structure that occurs within counties (Byun et al., 2012). As such, the results of analyses using county-level predictors cannot necessarily be generalized to smaller areas within counties, such as towns or census tracts. We suggest that policymakers and researchers alike not only explore composite measures of inequality, as suggested above, but also work to generate smaller-scale measures that more accurately characterize within county variation in inequality and opportunity structures.
Transfer Student Success
Our results also speak to issues surrounding transfer student success. In our examination of credit transfer and excess credit accumulation, we found a consistent pattern wherein students from certain geographic contexts transferred more credits to their degree and also tended to graduate with more excess credits (and vice versa for students from other contexts). These results were quite surprising, as the literature indicated that credit loss upon transfer can lead to excess credit accumulation (Hodara et al., 2016). We believe that the possible link between increased transferred credits and increased excess credits may be due either to courses that transferred as electives rather than satisfying major-specific requirements or to courses transferred in that do not fulfill the correct degree requirements. It is also possible that students who transfer in many credits must wait to take advanced courses that are offered sporadically, which would prompt students to take additional elective credits to stay enrolled full time. While our dataset does not offer the opportunity to explore the link between credit transfer and excess credits, researchers with access to complete transcript data should examine this relationship. Additionally, qualitative researchers should seek to understand the factors that may encourage a transfer student to stay enrolled at their 4-year institution longer than necessary. Furthermore, practitioners working with students should provide information and guidance about course transferability and class planning before and after transfer. Finally, policymakers, practitioners, and researchers should carefully consider how they measure credit applicability, as transfer credits that apply to a students’ program of study, but only as elective credits, likely do not yield efficiency gains.
Another key finding of this study relates to similarities in results corresponding to broadband internet access in a student’s community college location and a transition from an area with less to more economic prosperity. Policymakers and practitioners should consider the implications of which communities have internet access and how much internet access costs when designing policies and programs aimed to help ease transfer. Policies and programs that rely on student access to the internet to take coursework or discover information about course or program articulation are likely to place students in some communities at a disadvantage.
Conclusion
In response to literature that encouraged researchers to utilize measures of space beyond the urban-rural paradigm (Isserman, 2005; Manly et al., 2020), this study explored varying operationalizations of spatial inequality. We then applied these measures to study the relationship between transferring from one spatial context to another on student curricular outcomes. Our findings broadly suggest that transfer student success has a relationship with the spatial context wherein community colleges and 4-year institutions are situated. In particular, our study indicates that students transferring from areas that likely face resource constraints experience less favorable credit transfer outcomes. These findings underscore several important lessons for researchers, policymakers, and practitioners. First, the results of our study indicate that spatial inequality is complex and can be defined in many ways, often presenting seemingly conflicting results. These findings highlight the importance of using composite and small area indicators of spatial inequality when targeting areas for inquiry or intervention. Next, we posited that many of our results were driven by resource constraints within certain spatial contexts. Drawing on spatial inequality theory (Lobao et al., 2007), our discussion suggests that those working to increase transfer efficiency should consider how access to important resources like reliable broadband, academic advising, and diverse course offerings are distributed across space.
Footnotes
Acknowledgements
The authors thank the Belk Center for Community College Leadership and Research at NC State University, which provided access to the data used in this study. The authors thank Dr. Audrey J. Jaeger for her leadership and for providing feedback on earlier drafts of this article.
Authors’ Note
Rachel E. Worsham is now affiliated to Center for Education Policy Research, Graduate School of Education, Harvard University, Cambridge, MA, USA.
Andrew Crain is now affiliated to Missouri University of Science and Technology, Rolla, Missouri, USA.
This work was not completed in collaboration with the Center for Education Policy Research and does not reflect the views of the Center.
Declaration of Conflicting Interests
The author(s) declared no potential conflicts of interest with respect to the research, authorship, and/or publication of this article.
Funding
The author(s) received no financial support for the research, authorship, and/or publication of this article.