
Abstract
This study aims to contribute to understanding how social networks serve as an intervening pathway leading to socioeconomic health inequality among older adults in Norway. Longitudinal survey data from the second and the third waves of the Norwegian Life Course, Ageing, and Generation Study were used in this paper. Hayes PROCESS was used to estimate the mediating effect of the contact frequency and the support potential of friends on the impact of social-economic position (SEP) at wave 2 on health outcomes at wave 3. The total indirect effect of the income on physical health observed was 0.04. The total indirect effect of the highest level of education attained on physical health observed was 0.12. The result showed a social-economic gradient in health among older adults in Norway where the social network is a crucial pathway via which SEP influences peoples’ health.
Introduction
Health inequalities are defined as, “the systematic, avoidable and unfair differences in health outcomes that can be observed between populations, between social groups within the same population or as a gradient across a population ranked by social position” (McCartney et al., 2019). This difference in health is a public health threat as it has a broader socioeconomic implication and affects every member of society (Woodward & Kawachi, 2000). For example, the AIDS epidemic has largely appeared in the context of poverty, and not only does this phenomenon affect or is confined to the people or groups where it has emerged but this also affects everyone else within the society. As a result, reducing inequality will bring benefits to everyone. Research shows that health inequality does not emerge solely as a result of individual health choices, rather it is shaped by the broader social, political, and economic conditions (Arcaya et al., 2015). The existence of health inequality implies that individuals and groups are not enjoying their rights to attaining the highest standard of physical and mental health available (Woodward & Kawachi, 2000). Further, the health inequalities across populations or specific groups are easily avoidable, thus posing significant implications for social justice (Marchand et al., 1998; Woodward & Kawachi, 2000).
Norway is a social-democratic welfare state characterized as a highly egalitarian society that aims to provide equity of the highest standards for all citizens (Huijts & Eikemo, 2009). Furthermore, the Norwegian welfare state is based on the principle of universalism (Bergqvist et al., 2013), where income, education, and health services are more equally distributed among the citizens compared with other European countries (Brekke et al., 2011). Despite this, Norway has not succeeded in reducing health inequality. For example, socioeconomic inequality in the morbidity and mortality rates in Norway is not significantly different from other European countries (Mackenbach et al., 2003; Mackenbach et al., 2008). People aged 65 or above with a higher level of education live four years longer compared with people who have a lower level of education in Norway (NIPH, 2016). These inequalities are paradoxical since Norway is expected to have low inequality owing to its status as an egalitarian society. Therefore, this paper argues that a better understanding of health inequality will contribute positively to policies aimed at reducing this phenomenon.
It is a well-established fact that people with a higher socioeconomic position (SEP) have better health status compared with people that have a lower SEP. This is because people with a low SEP are more likely to live and work in an unhealthy physical environment, are less likely to have access to quality health care, and are more likely to adopt risky health behaviors. The housing and living conditions survey by Statistics Norway showed that people with lower income live in poorer housing conditions compared to people with higher income (SSB, 2018). In Norway, cigarette consumption and cigarette dependency are higher among people from low SEP compared to their high socioeconomic counterparts (Lund, 2015).
Various studies have documented the income and education gradient of health in Norway. The risks of mortality are lower among people with high incomes. The odds of mortality among people in low-income groups is 1.034 times the odds of mortality among people in a high-income group (Dahl et al., 2006). A study that evaluated the association between mortality and income inequality in 35 Norwegian regions using registered mortality data between 1994 and 2003 indicated that regional mortality was significantly higher in regions with larger income disparities (Elstad, 2011). In a Norwegian study conducted between 1984 and 2008, the socioeconomic inequalities in health care utilization showed that people with a higher education level have greater utilization of general practitioner services compared with people of a lower education level (Vikum et al., 2012). This is similar to Iverson and colleagues’ findings that people with a higher education level utilize more specialized services and have better access to general health care services (Iversen & Kopperud, 2005). In Norway, people with a higher education level who are diagnosed with cancer live longer compared with those with a lower level of education (Kravdal, 1999; Strand et al., 2014). There is also a significant economic gradient in overall mortality rates in Norway, and this is more prevalent for avoidable mortality such as mortality from Ischemic heart disease and other preventable deaths (Espen et al., 2007). Dhal and colleagues argued that the mortality-related education gradient is because people with less education have fewer resources that can help them to adhere to medical advice and treatment regimens (Espen et al., 2007).
Various scholars have purposed different perspectives to explain the reason for health inequality. We utilize the fundamental cause theory (FCT) as a possible explanation for why health inequality exists in Norway. This is because FCT argues that an individual’s social factors, particularly their SEP, are the root cause of health inequality. This is because SEPs are associated with numerous resources that can be used to avoid various health risks and minimize the consequences when disease occurs. Health inequality exists as long as the general socioeconomic structure giving access to these resources remains stable. Norway has reduced inequalities in access to material and immaterial resources; however, these are not yet completely eliminated (Mackenbach, 2012). Therefore, people being from different SEPs has an impact on their ability to access a wide range of serviceable resources such as money, knowledge, prestige, power, and beneficial social connections that can be used to one’s health advantage (Link & Phelan, 1995; Phelan et al., 2004).
Socioeconomic stratification being linked to a person’s social network implies that those with the most disadvantaged SEP experience the most impoverished network function and structure (Campbell et al., 1986; Lin, 2000). A German study focusing on disadvantageous SEP levels showed that older adults aged between 45 and 74 reported having poorer network structure and lower social support levels compared to people from advantageous SEP (Weyers et al., 2008). Krause and colleagues’ study on the social class difference on social networks showed similar results, where older adults with higher income and higher education reported having a higher frequency of contact with friends and higher social support compared to older adults with lower income and lower education (Krause & Borawski-Clark, 1995). Furthermore, Letki and colleagues suggested that people with a higher level of education and higher income tend to have larger networks spread over a wider geographical area, and further that the support they receive tends to be of better quality than people of a lower level of education and income (2015). This is because people in higher SEPs are able to use their economic resources to form better social relationships (Letki & Mieriņa, 2015).
Among the various utilizable resources, Link & Phelan identify social networks as a major resource that can be used to avoid or minimize health risks and prolong life (Phelan et al., 2010). Social networks refer to the web of social relationships and the characteristics around which an individual is surrounded. Various theories and empirical findings reveal the influence of social networks on physical and mental health (Agadjanian, 2002; McLaughlin et al., 2002; Pescosolido Bernice & Levy Judith, 2002). Social relations and their characteristics are complex in nature, where they are able to operate in different ways to influence health (Fiori et al., 2006; Windsor et al., 2016).
Scholars have commonly differentiated the nature of the social network according to network structure and function (Avlund et al., 2004; Berkman et al., 2000; Due et al., 1999; O'Reilly, 1988). The structural aspect of social networks represents the number of social relations that people have, the frequency of seeing other people, the diversity of social relations, and the reciprocity of social relations, whereas the qualitative and behavioral aspects of the social relations such as social support, social anchorage, and relational strain is represented in the network function (Avlund et al., 2004; Berkman et al., 2000; Due et al., 1999; O'Reilly, 1988). A longitudinal study by Ellwardt and colleagues among older adults in The Netherlands showed that the structural characteristics of the network (number of social contacts and number of social roles) improve the chance of survival among older adults (Ellwardt et al., 2015). This is similar to findings from a meta-analytical review across 148 studies (308,849 participants) conducted by Holt-Lunstad and colleagues that showed the chance of survival increases by 50% among participants with stronger social relationships (Holt-Lunstad et al., 2010). Weaker social ties as represented by limited social contact and social isolation have a negative influence on health and survival. A population-based cohort study among 21,604 participants in Denmark has shown that social isolation increases the chance of mortality by 60%–70% (Laugesen et al., 2018).
Scholars have identified various pathways and processes through which a social network influences physical health. Berkman’s causal pathway model showed the mediating role of a social network in the relationship between macro-social determinants of health (i.e., SEP and poverty) and micro-social determinants of health (i.e., social support), which in turn influence various health outcomes. Berkman elucidated that the social, cultural, and political contexts determine the extent, size, and nature of the social network. In turn, these offer people the opportunities to receive social support, social engagement and attachments, access to resources and material goods, and social influences (Berkman et al., 2000). Overall, these resources influence health outcomes through their influence on health behaviors; the chance to have exposure to various infections and disease agents: physiological stress responses, psychological states, and characteristics such as self-esteem and security (Berkman et al., 2000).
Current social network–related research commonly differentiates between the structural and functional dimensions of the social network as having the potential to influence pathways to health (Berkman et al., 2000; House et al., 1988). Network structure positively affects physical health by providing opportunities to access various resources that determine health behaviors and emotional responses (Berkman et al., 2000; House et al., 1988). For example, having a larger and more extensive social network increases the availability of information that individuals can use for health advancement (House et al., 1988). Furthermore, social integration is associated with a sense of physical and emotional security as well as self-esteem, which is associated with positive health outcomes. On the other hand, the functional dimensions of the network prevent stress from occurring by providing various kinds of support such as emotional and instrumental, and this has a positive influence on physical health (Due et al., 1999; Faber Ashley & Wasserman, 2002; Uchino, 2004a, p. 114).
Various health inequality–related studies have indicated that the social network’s role can influence socioeconomic inequalities in health. For example, Vonneilich and colleagues evaluated the mediating effect of social networks on the relationship between SEP and subjective health among people aged between 45 and 75. The structural aspect was indicated by the Social Integration Index (SII) and the functional aspect was measured by social support (i.e., emotional support and instrumental support). The study revealed that the structural aspects of a social network reduced the relationship between education and income by 15%. At the same time, emotional and instrumental support reduced the association between education and subjective health by 6% and 2%, respectively (Vonneilich et al., 2012).
On the contrary, a different study showed no mediating effect of a social network on the socioeconomic differences according to the onset of mobility-related disability among older Danes (Nilsson et al., 2010). A US study found similar results, where psychosocial factors such as negative emotions did not meditate the SEP according to self-rated health (Barger, 2006). Further, Aartsen and colleagues’ study on the mediating role of the social network in the relation between SEP and health among people aged between 40 and 81 in Norway concluded that not all dimensions of the social network are important. This study showed that network structure does not meditate the relationship between SEP and Health, whereas the functional aspect does act as a meditator (Aartsen et al., 2017). These research findings show a mixed role of key social network dimensions in the relation between SEP and health. Social network research explains that structural aspects (i.e., size and contact frequency) can influence various network functions (i.e., emotion, informational, or instrumental supports) (Seeman & Berkman, 1988). The interconnectedness between network structure and function might explain this ambiguous result.
This paper posits that this ambiguity in results may be because of the differing roles present in a social network, where the roles are a set of norms and expectations applied to the incumbent of a particular position. For example, some attributes of the social network are based on ascription, where roles are assigned based on characteristics over which the person has no control, that is, they require no effort to form, such as family and kinship (Banton, 1966, p. 29). This is in contrast to social roles that form as a result of choice, individual effort, and competition; thus, being considered a form of achieved roles, that is, friendships (Banton, 1966, pp. 30–31).
Furthermore, achieved roles such as friendships are considered important for maintaining cognitive functioning and physical health in old age (Holt-Lunstad et al., 2010). The positive aspects of friendship provide meaning to older adults’ lives, which is crucial for their health and well-being. The mechanism for the positive effect on health can be attributed to friends offering emotional and instrumental support, as well as companionship (Felmlee & Muraco, 2009). Furthermore, this alleviates loneliness among older adults (Chen & Feeley, 2013).
Despite such importance of achieved relationships, very limited research has been conducted to explore how friendships the functional and structural aspects of influence the health status of older adults in Norway. More specifically, this paper focuses on the structural and functional role of friendships in order to illuminate its mediating role between SEP and health. A deeper understanding of the network structure and function may better inform policy makers and aid in the development of effective health interventions that in turn may better address health inequality. Therefore, this study aims to contribute to the understanding of how structural and functional dimensions of friendships in the social network may serve as an intervening pathway between socioeconomic position and physical health among older adults in Norway.
Hypothesis
Following the discussion above, this study expects to find the following associations between various indicators of SEP, the social network and physical health:
H1
H2a
H2b: A higher income is associated with more support potential of friends, which in turn is related to a higher physical health score
H3a: A higher level of education is associated with more frequent contact with friends, which in turn is related to a higher physical health score
H3b: A higher level of education is associated with more support potential of friends, which in turn is related to a higher physical health score
Method
This paper is based on longitudinal survey data from the second and the third wave of the Norwegian Life Course, Ageing, and Generation Study (NorLAG). The NorLAG is the nationwide population study that gathers information on four major aspects of life: (i) Health and Care (ii) Family and generation (ii) work and retirement, and (iv) Mastery and quality of life (Veenstra et al., 2021). Data are planned to be collected in five waves, so far three waves of data collection were completed in the year 2002–2003, 2007–2008, and 2017, respectively.
The NorLAG second wave (NorLAG2) encompasses the nationwide gross sample of 9238 respondents aged between 40 and 80 during the time of the interview (Veenstra et al., 2021). NorLAG2 constituted by the gross sample of NorLAG1, younger birth cohorts 1962–1966, and refreshment sample from birth cohort 1922–1961. The refreshment samples from the birth cohort 1922–1961 were added to compensate for the dropout rate. The attrition rate from the first wave to the second wave was recorded at 28.4% (Slagsvold et al., 2012). Altogether, 6099 respondents aged between 50 and 95 during the time of the interview participated in the third wave of NorLAG (NorLAG3). All the people who participated in NorLAG3 were born between 1922 and 1966 and also participated in the first and second waves of NorLAG (Veenstra et al., 2021). Among 9338 people who participated in NorLAG2, 5711 responded in NorLAG3 accounting attrition rate of 38%. Similarly, loss to follow-up due to mortality between NorLAG2 and NorLAG3 was recorded at 11% (Veenstra et al., 2021).
The second and third waves of NorLAG adopted a stratified sampling design where the sample was stratified according to gender, age, geographical region, and centrality of a residential municipality (most central to least central), resulting in 78 strata. Statistics Norway collected data through a combination of computer-assisted telephone interviews (CATI) followed by postal questionnaires with a supplementary question in both NorLAG2 and NorLAG3. Moreover, In NorLAG3 participants have the option to choose between a web-based and a postal questionnaire. In NorLAG2 and NorLAG3, the overall response rate for both CATI postal questionnaires was 61% and 68%, respectively (Veenstra et al., 2021). About 70% responded to CATI, whereas the response rate for post postal questionnaires was 79% in NorLAG2. Similarly, the response rate for CATI accounted for 73% in NorLAG3; however, this rate was higher in web-based self-administrative questions, that is, 81%. Written approval from Norwegian Social Science Data Services (NSD) was taken to use this datasheet.
Measures
Physical Health
The dependent variable physical health is assessed with PCS-12, this is the physical health component of the short-form generic measure of health SF-12 (Ware et al., 1998, p. 11). The PCS-12 scale measures physical functioning, role limitation due to the physical health problem, bodily pain, and general health aspects to evaluate individual physical health status (Ware et al., 1998, p. 19). The value of the physical health component (PCS-12) of SF-12 survey ranges from 0 to 100, where a lower value corresponds to a lower level of physical health (Ware et al., 1998).
Social-Economic Position (SEP)
In line with several other studies, the focus of this study is on education and income as the two most relevant aspects of SEP (Galobardes et al., 2006). In NorLAG, the respondents’ level of education is obtained from register data that is recorded using the International Standard Classification of Education (ISCED-97) and represented in the following five categories: (1) No education and primary education, (2) Basic education and higher education, (3) Supplementary higher education and higher secondary, (4) University and college education, lower level (5) University and college education, higher level and doctorate.
A respondent registered gross income (in Norwegian Kroner, NOK) after tax from 2007 is used to reflect the persons’ income. A Gross annual income of less than 50,000 NOK is considered an inadequate reflection of the financial situation of people living in Norway, as it is far below the level needed for an independent life (Aartsen et al., 2017). Hence, all entries less than 50,000 were recoded as system missing. Furthermore, the level of income was categorized in deciles to reduce the skewness of the income variable the deciles are as follows: gross income 50,000–140,000 = 1; 140,000–180,000 = 2; 180,000- 210,000 = 3; 210,000–230,000 = 4; 230,000–250,000 = 5; 250,000–270,000 = 6; 270,000–300,000 = 7; 300000–350,000 = 8; 350,000–430000 = 9, and above 430,000 = 10.
Network Structure
Contact frequency with friends is used as a proxy measure for network structure, and this has been assessed using the question “how often do you meet with your friends”?. The responses were coded in the following categories: 0 = does not have (friends)/is not alive (friends passed away); 1 = Never; 2 = Less often 3 = sometimes; 4 = Every month, but not daily; 5 = Every week but not daily; and 6 = Daily.
Network Function
In this paper, the network function is assessed through social support. Social support is chosen to assess network function since various scholars have shown that social support from social networks is a strong predictor of health outcomes. Berkman categorizes social support as emotional, informational, appraisal, and instrumental assistance. Accordingly, a scale measure for social support is developed by using the following questions (i) Have friends standing up for you in crisis; (ii) Have someone whom you can appreciate as a friend; (iii) been on holiday with friends; and (iv) Celebrated your birthday with friends. Thus, the new variable’ support potential of friends’ is created using the aforementioned variables in line with Beekman’s categories. A respondent had to categorize their response that he/she made about each statement, answering as 0 = No or 1 = Yes. The reliability of the social support scale was calculated by using the Cronbach’s α coefficient. The reliability measurement for social support was 0.69 ≈ 0.70, which is considered an acceptable level of internal consistency among questions (Tavakol & Dennick, 2011).
Older Adults
In line with several other physical health studies on older adults (Geerlings et al., 2000; Petry, 2002), people aged 55 or older were considered as older adults for this study. Thus, only those people aged 55 and above were selected during the data analysis process.
Covariate
Some demographic factors such as gender and marital status can produce a spurious association in the relationship between SEP and health (Wongpakaran et al., 2016). For example, studies have shown that married people are healthier than unmarried people (Williams & Umberson, 2004), since marriage provides social support and social control for health behaviors (Ross et al., 1990). Health outcomes differ among males and females even if they are exposed to an equal amount of risk of disease (Manandhar et al., 2018). For example, women who smoke tobacco develop the more severe chronic obstructive pulmonary disease compared to men who smoke the same amount of tobacco (CDC, 2014). Therefore, gender and marital status were statistically controlled for during analysis.
Analytical Strategy
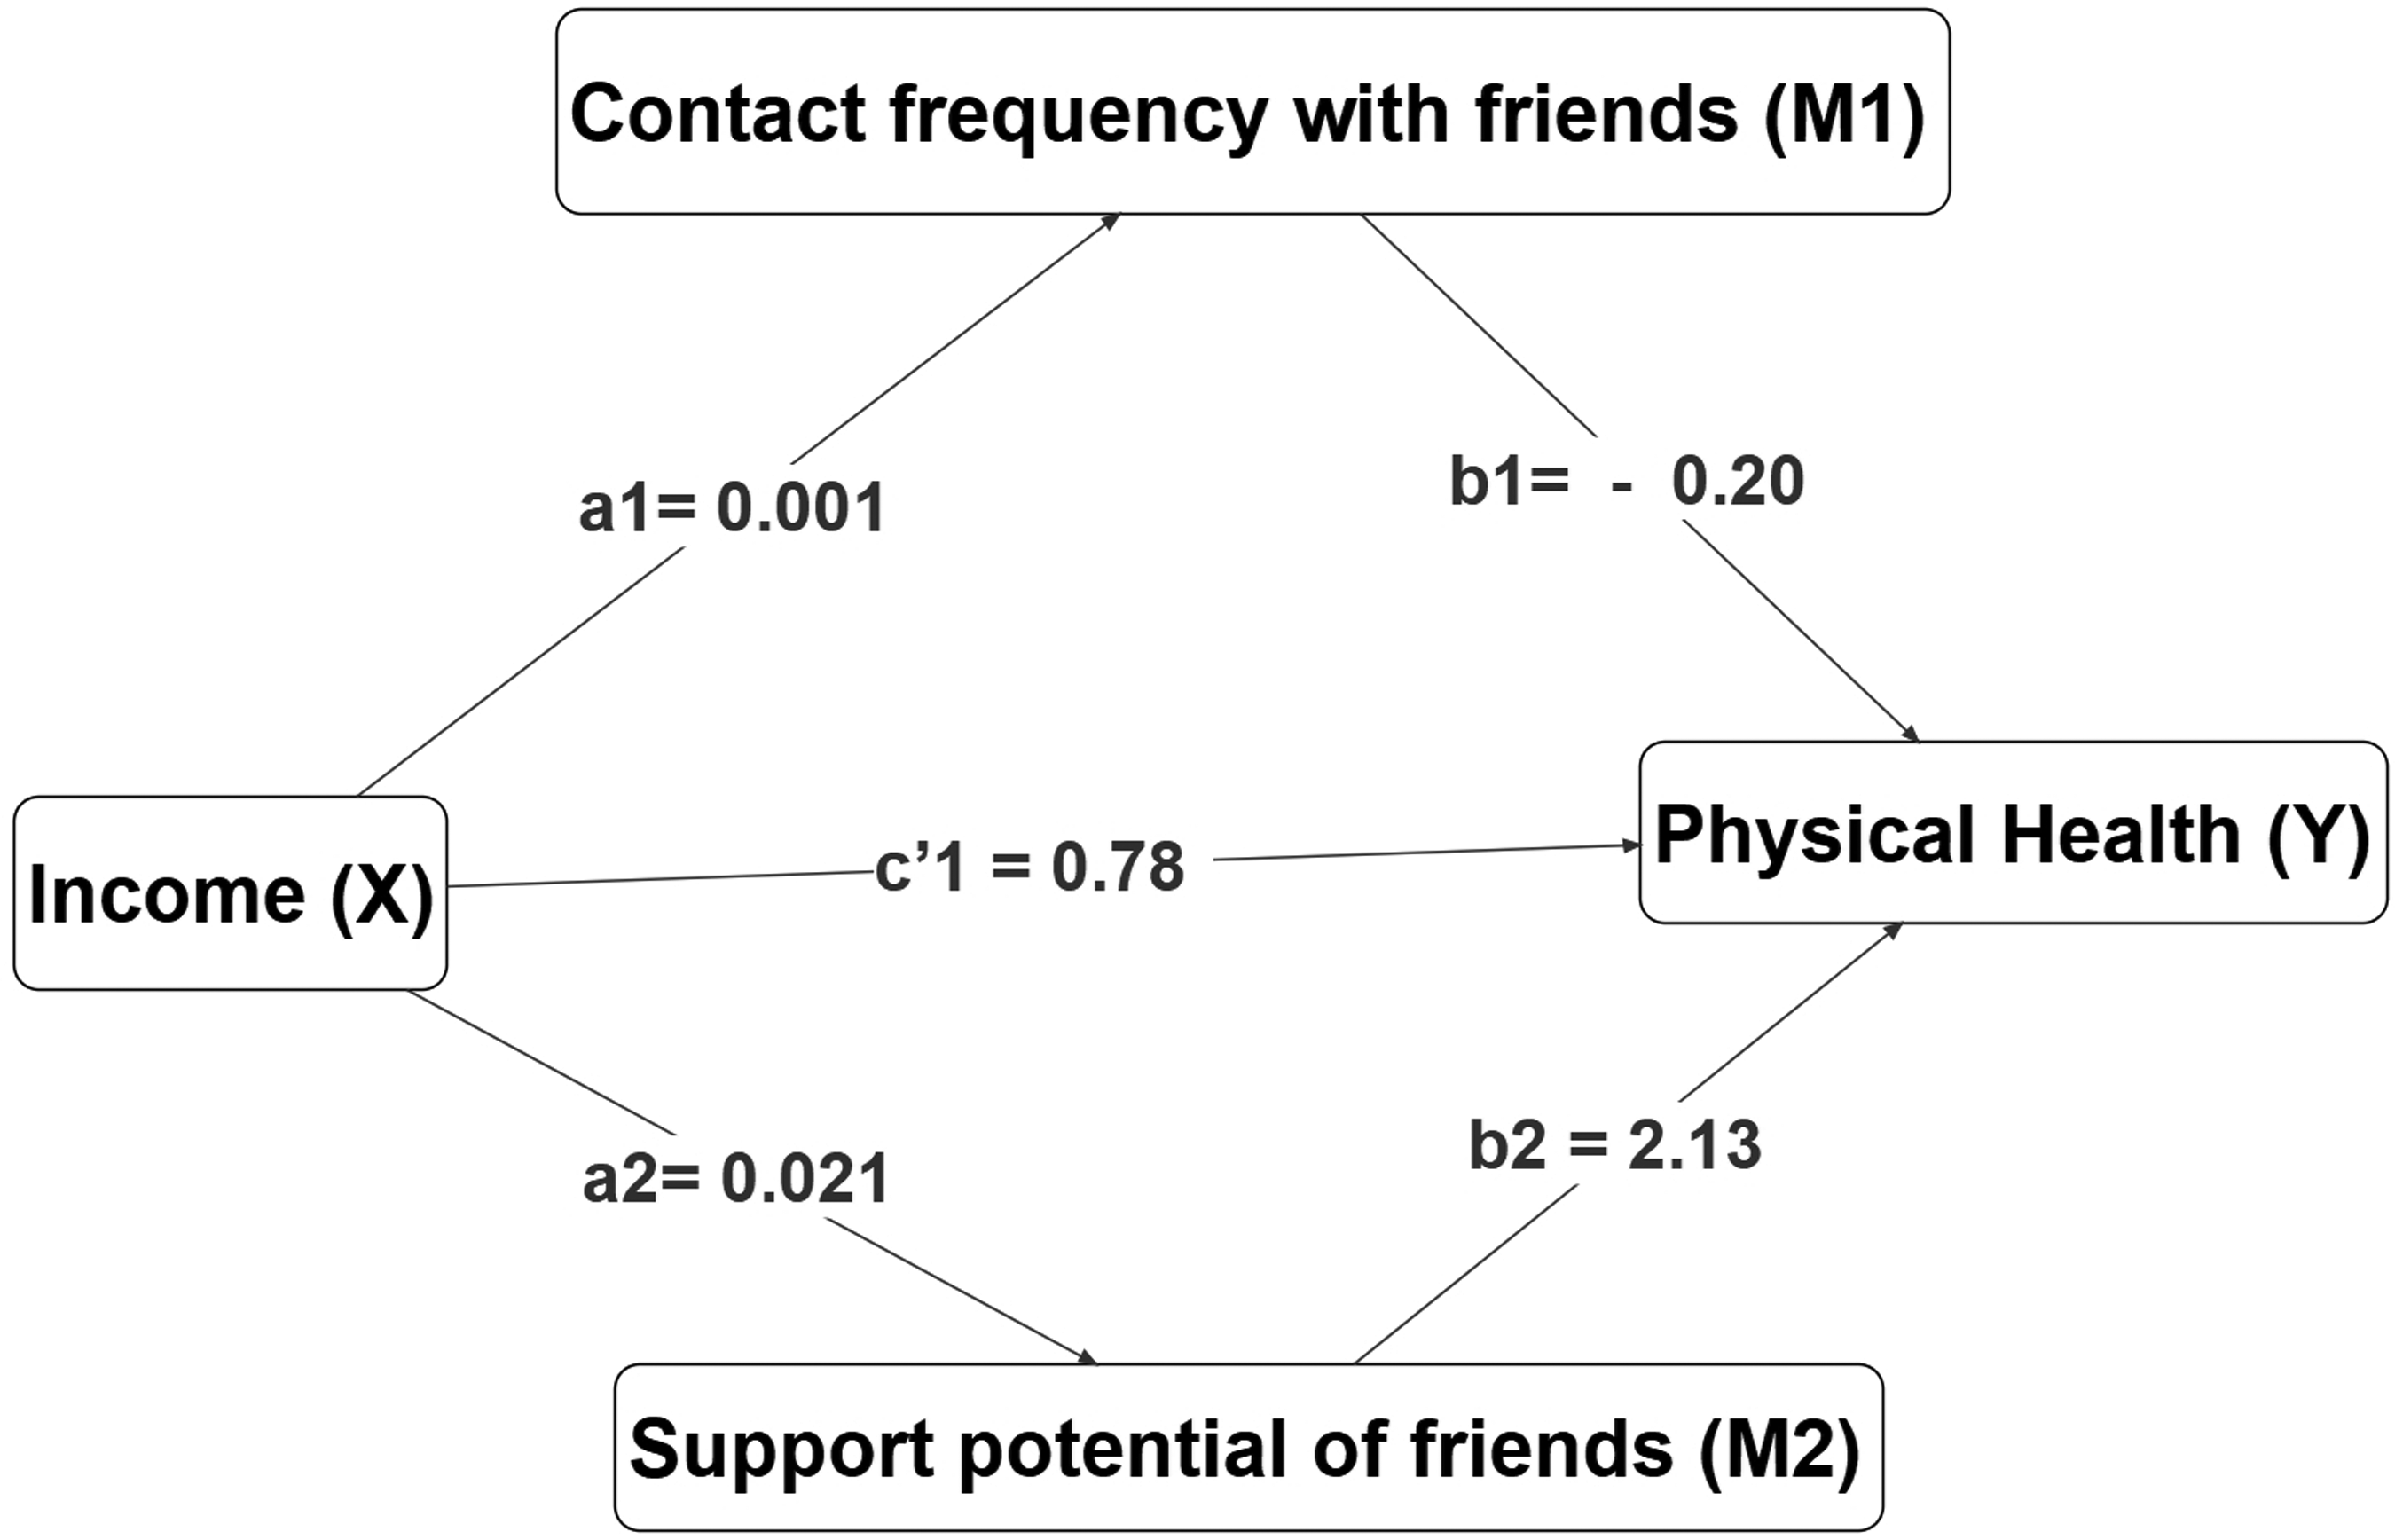
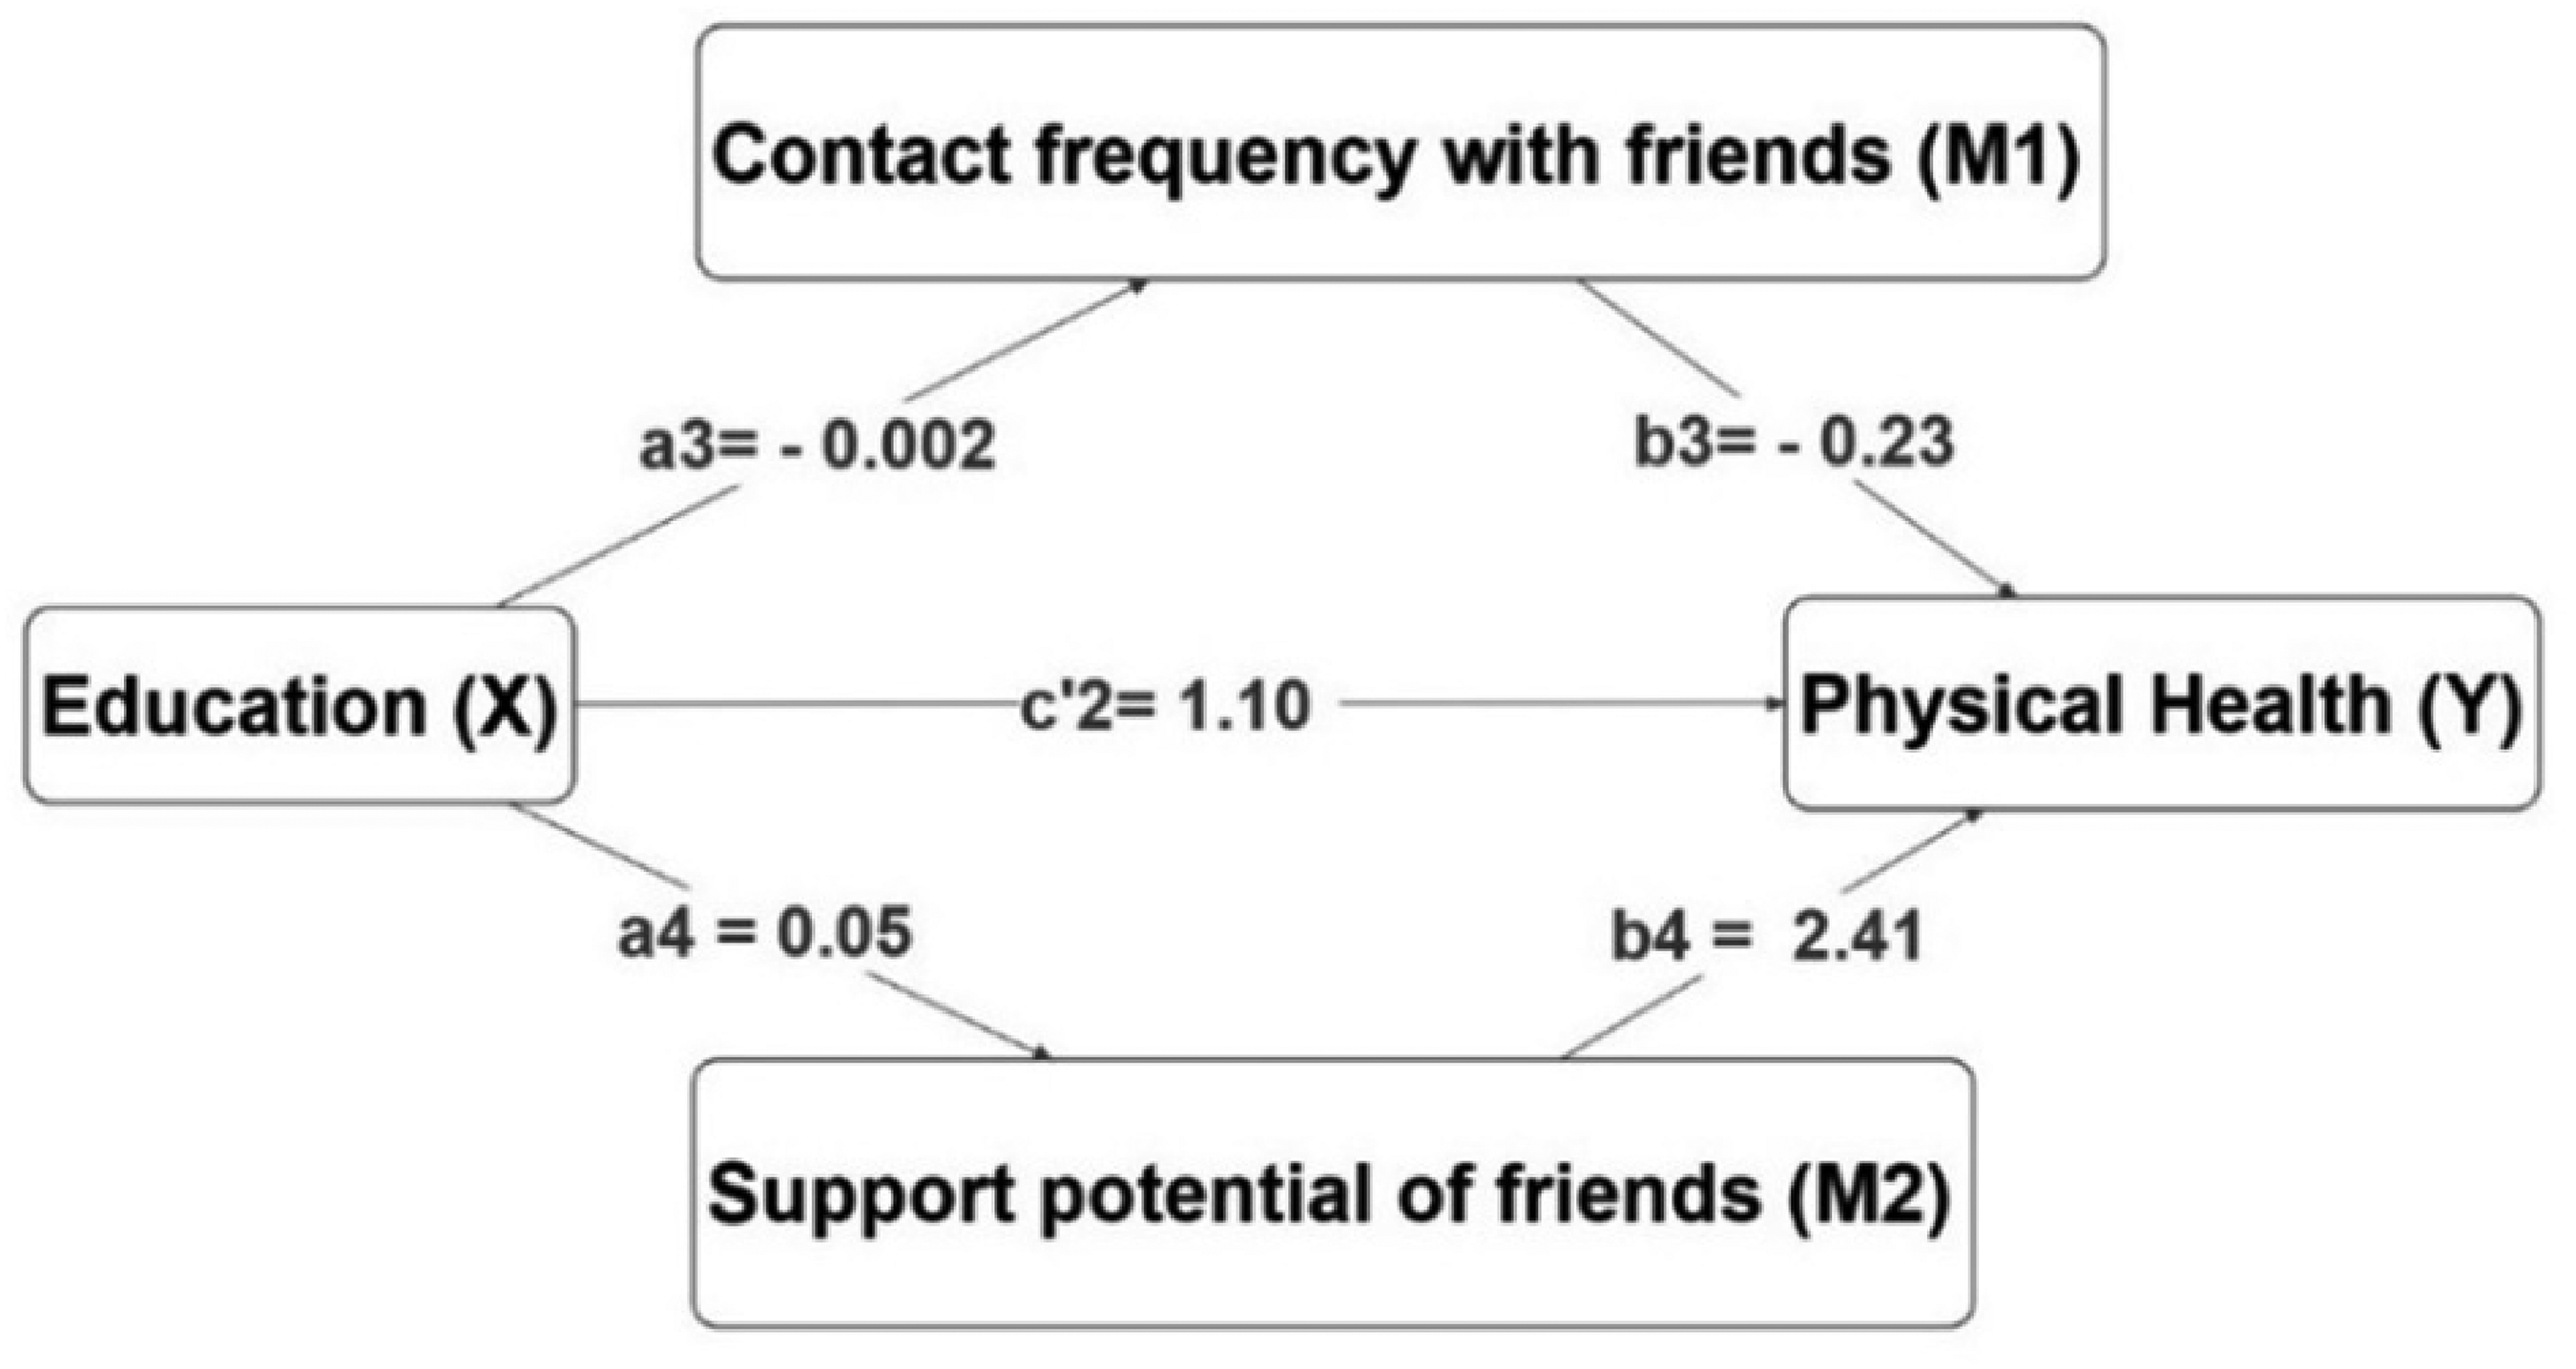
Basic data screening and normality test of the variable’s physical health score, income, education, contact frequency with friends, and support potential of friends was performed before conducting any statistical analysis to ensure the accuracy and legibility of data. Only participating older adults aged 55 and above during the third wave (N = 2856) were used for the analysis to prevent the effect of attrition and loss to follow-up. Two separate parallel multiple mediation models as shown in Figures 1 and 2 were used to evaluate whether the association between SEP and physical health status is mediated by the social network, so that no mediator causally influences the other. The first model shows social networks (i.e., contact frequency with friends and the support potential of friends) as a mediating pathway between income and physical health. The second model shows the mediating role of the social network between education and health status. A multiple mediation model is used because it allows for a test of the combined effects (i.e., the total indirect effect) of all proposed mediators, and further allows examining and reporting of the individual effects of each mediator while controlling for the others (Hayes & Rockwood, 2017). Moreover, various covariates can be included in the model.
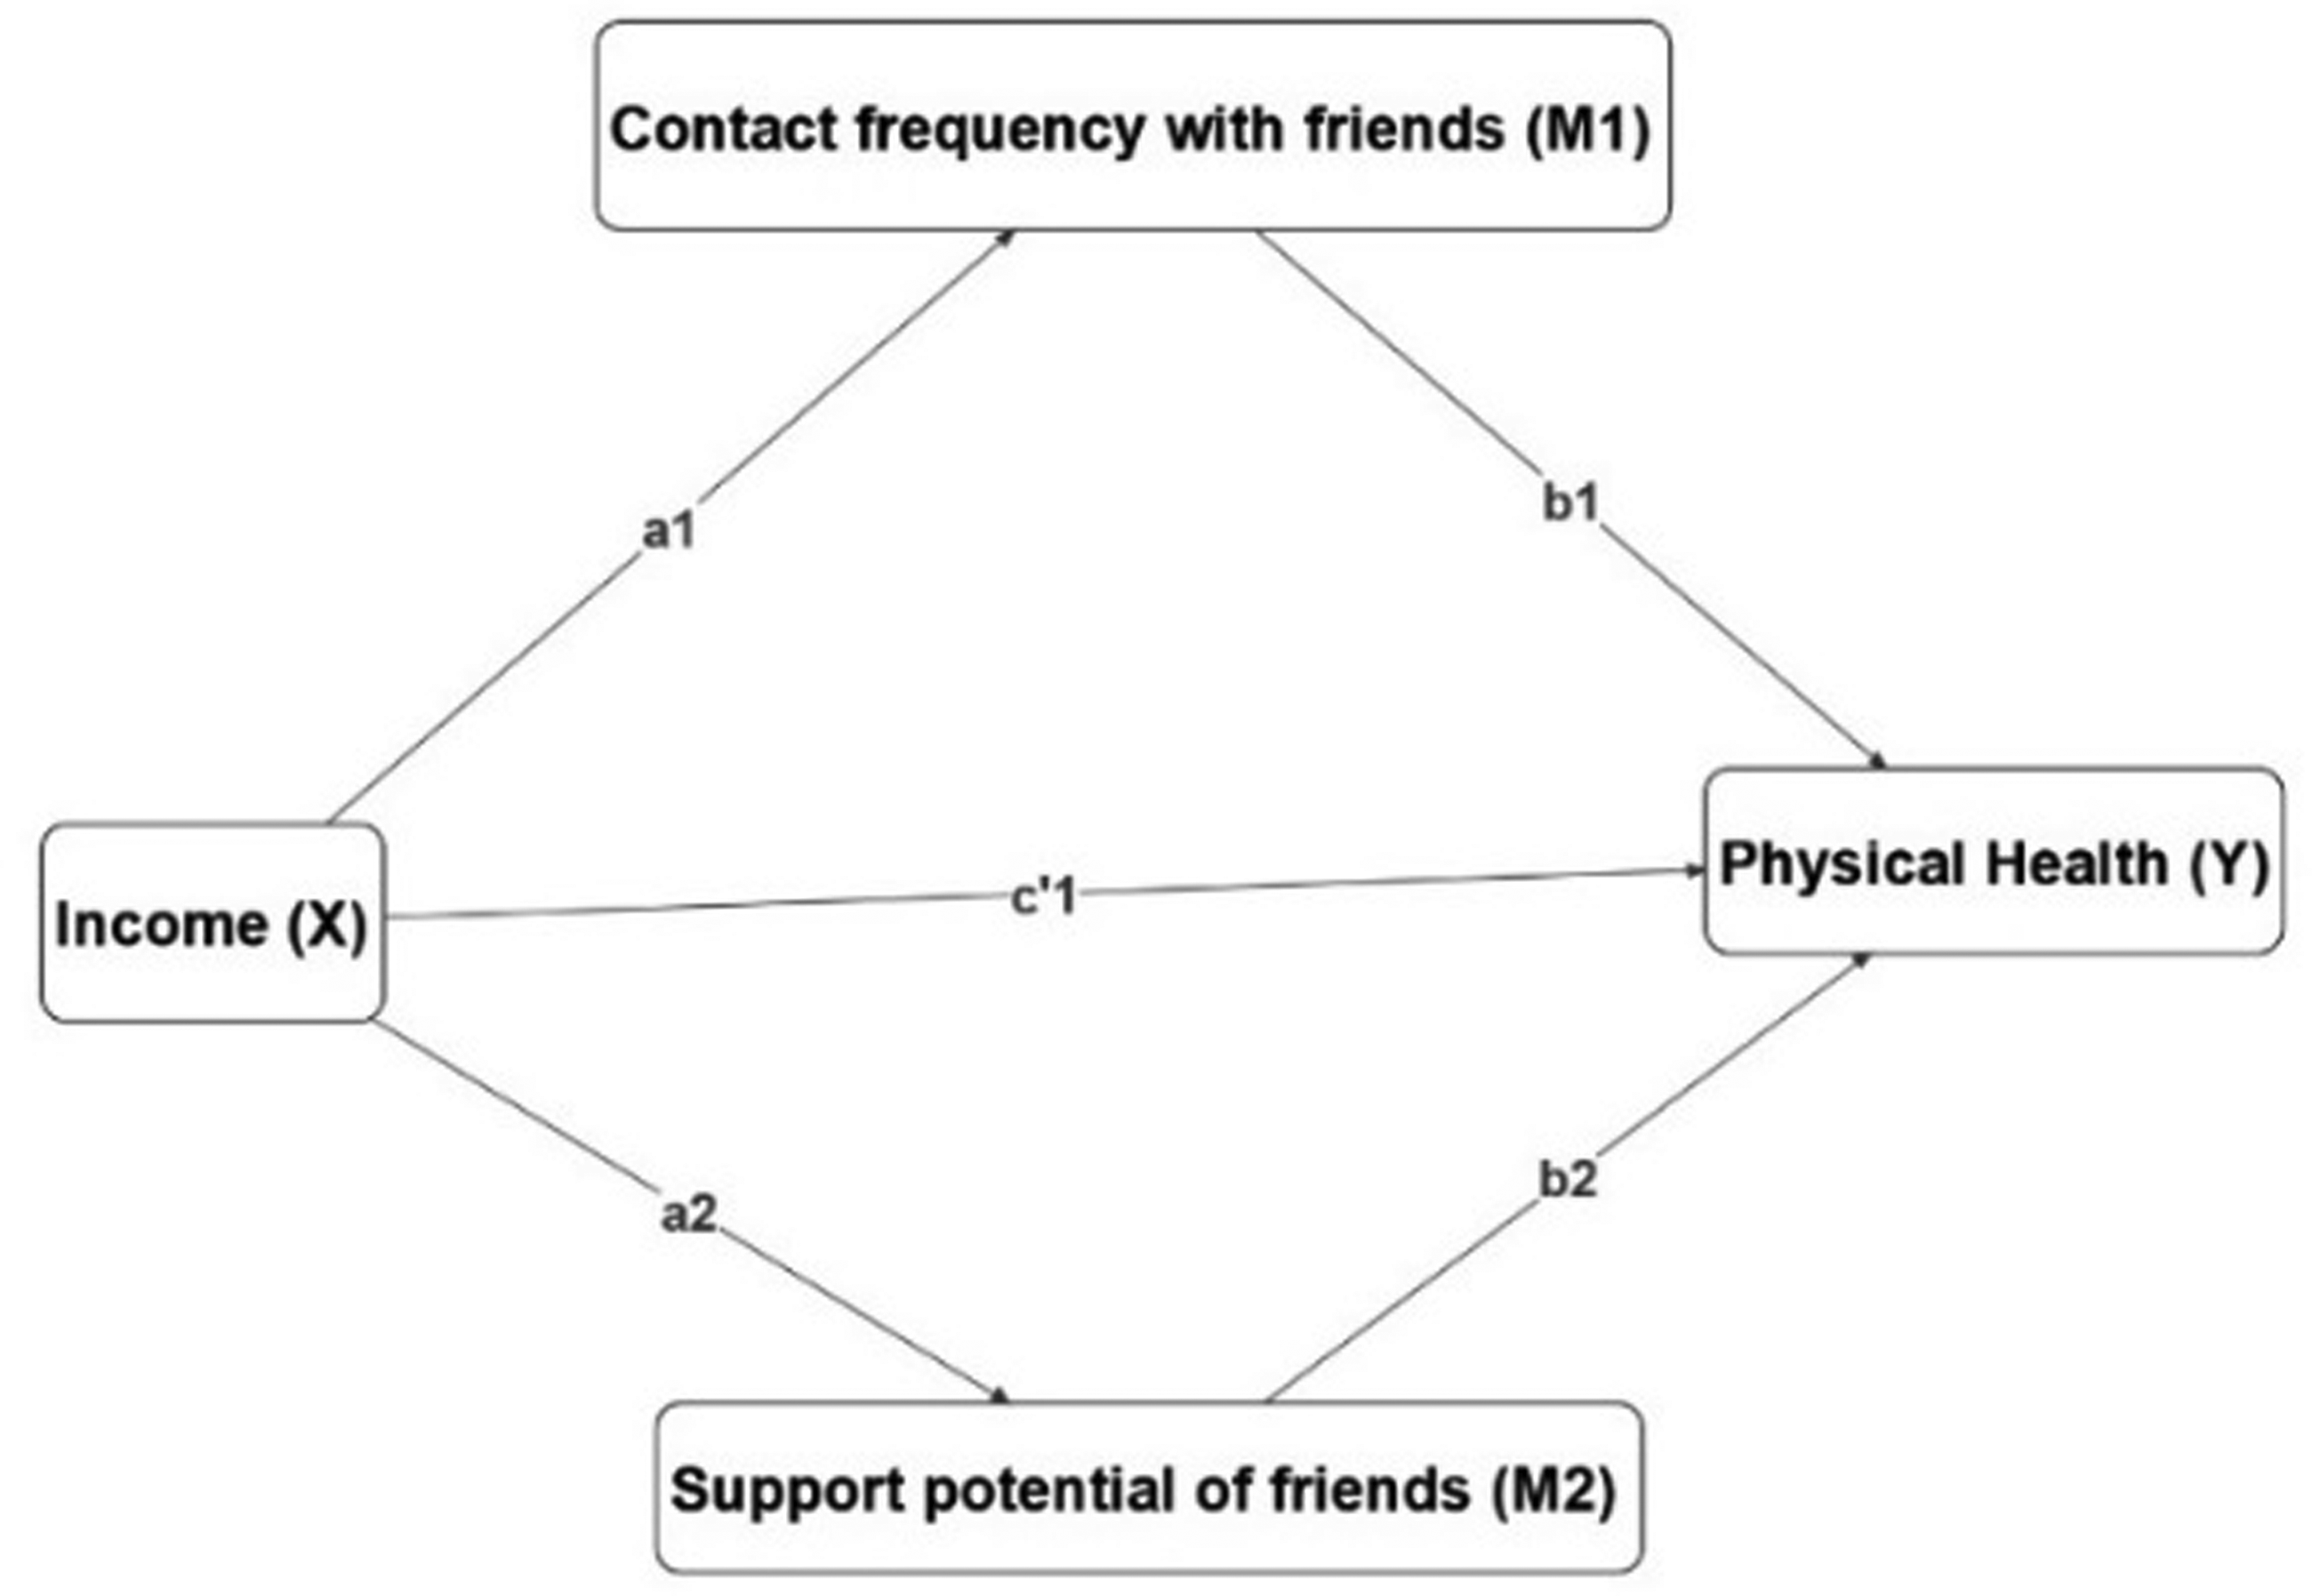
Multiple mediation model income, social network, and physical health.
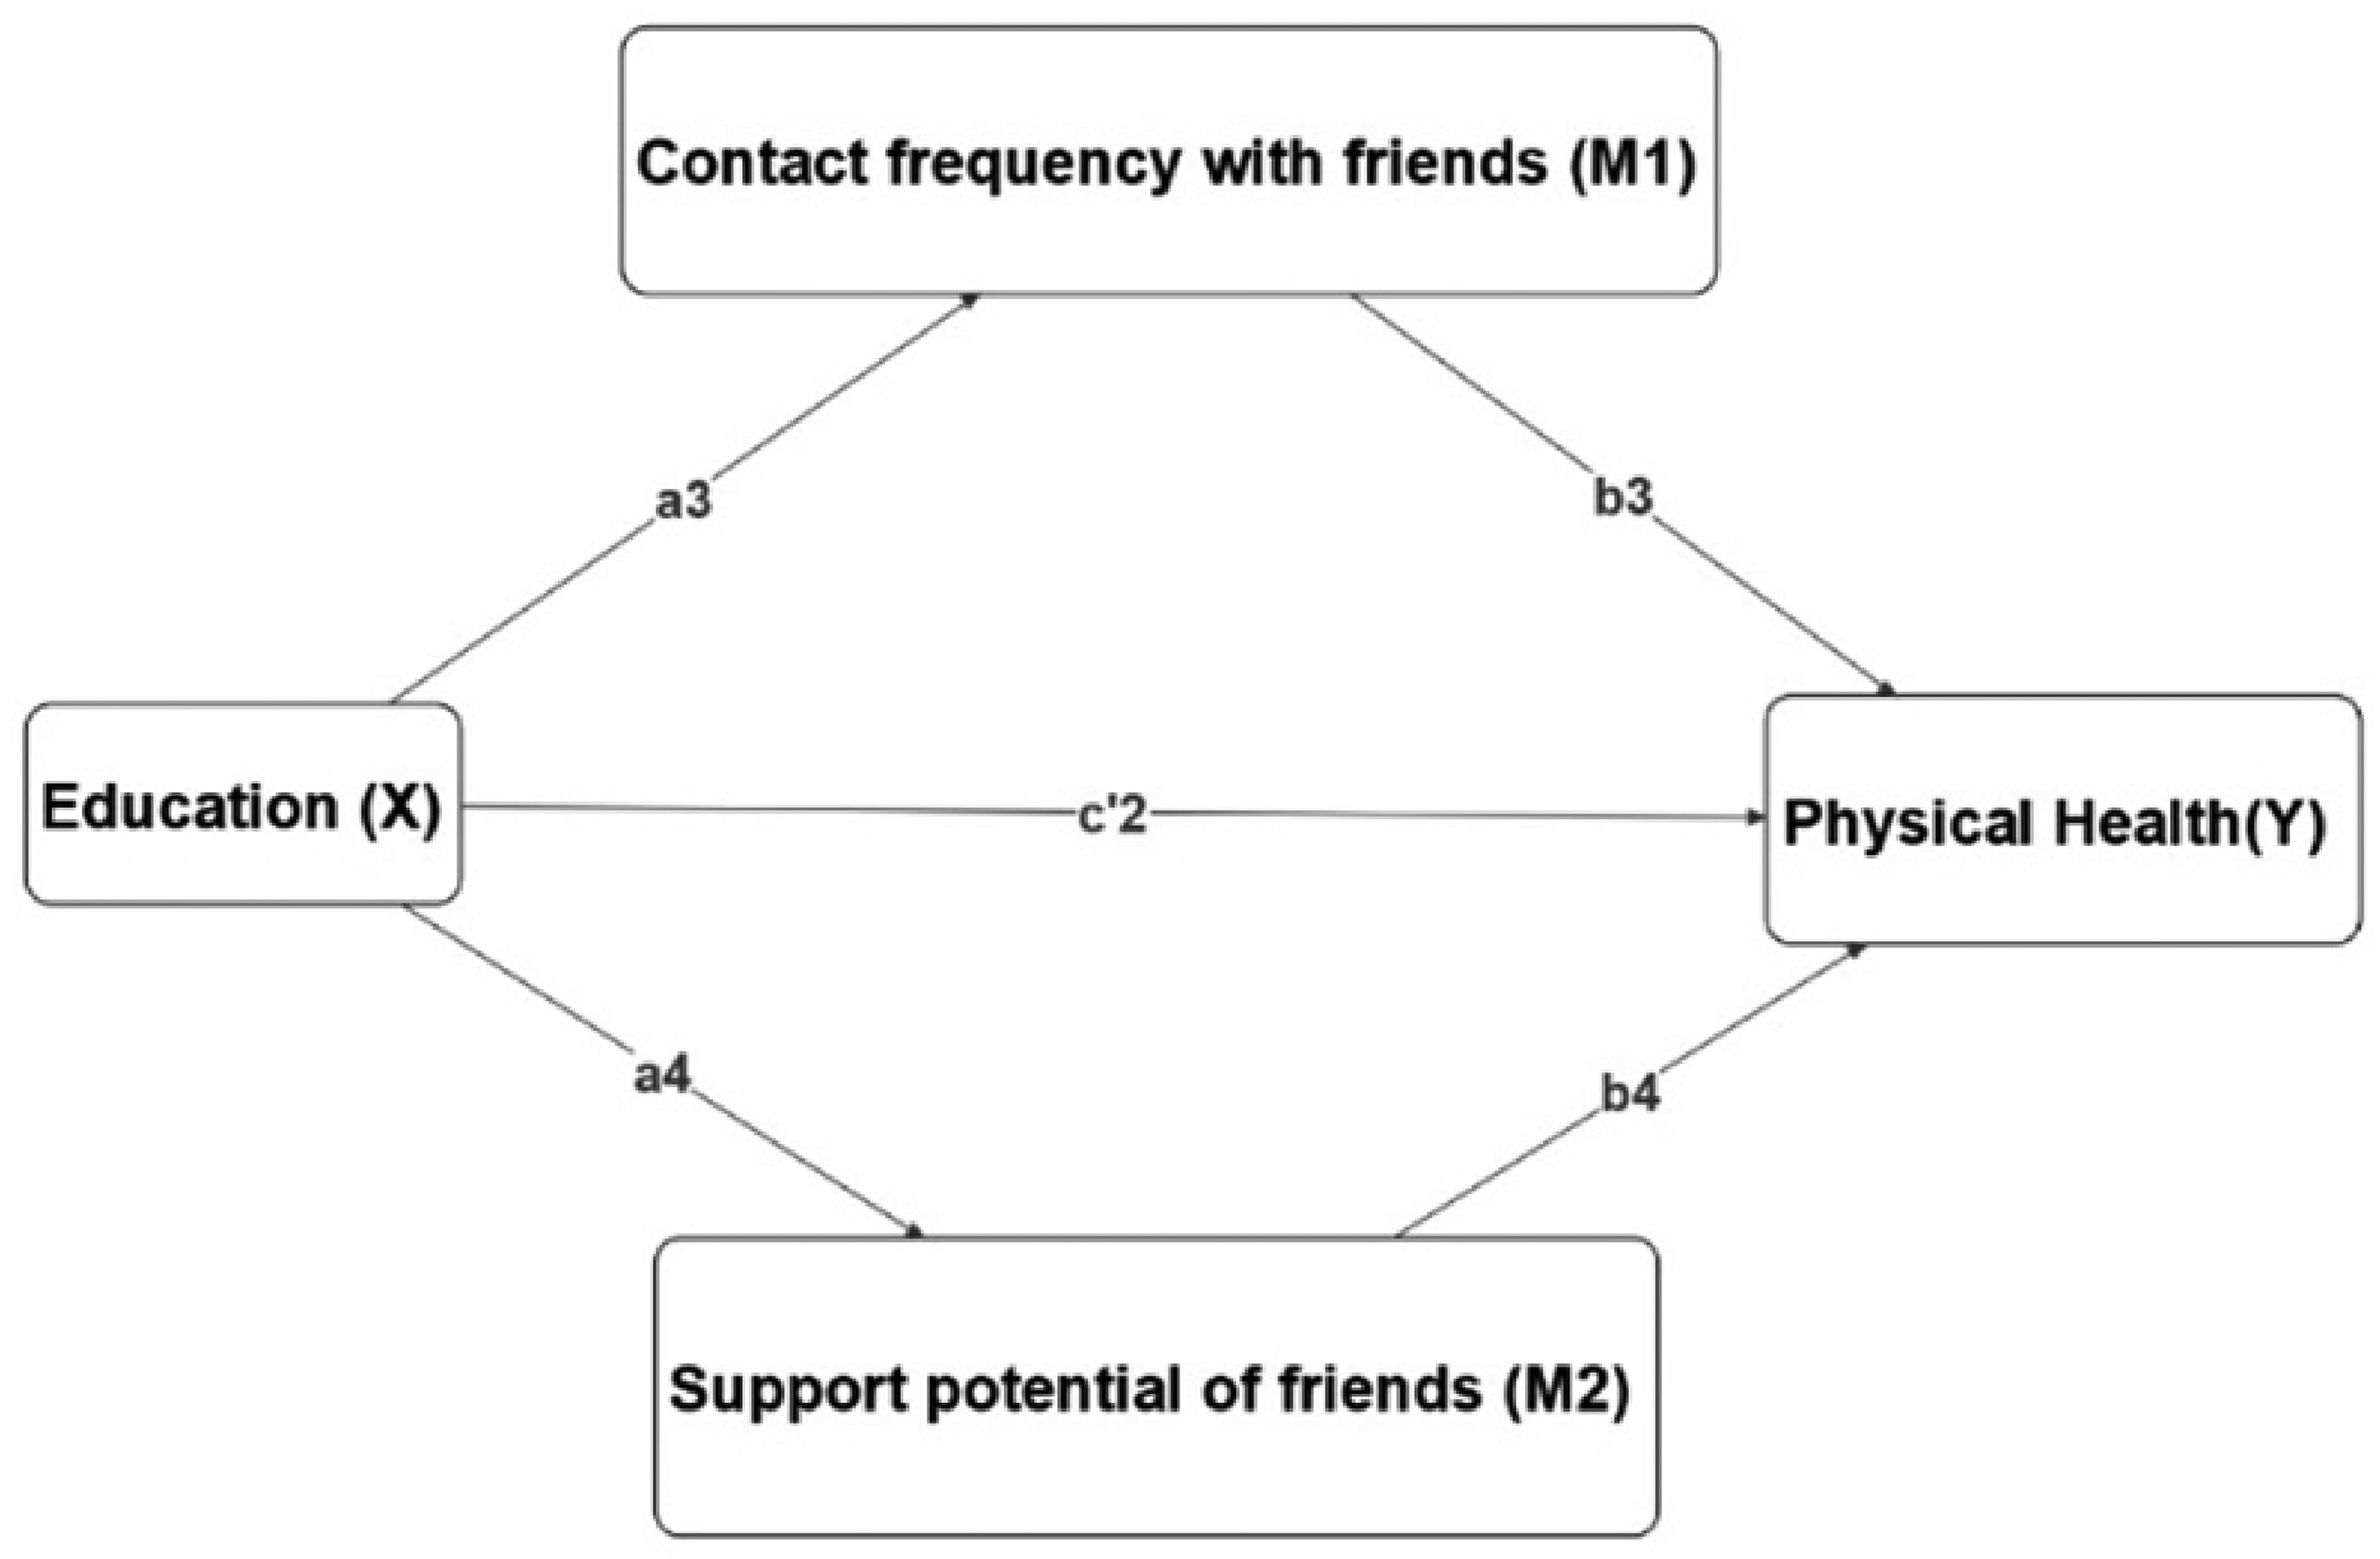
Multiple mediation model education, social network, and physical health.
Hayes PROCESS macro-regression analysis (Hayes & Little, 2018) developed by Andrew F. Hayes is used to predict the direct effect of SEP (X) on physical health (Y), and also the indirect effects of contact frequency with friends (M1) and support potential of friends’ (M2) on the relationship between SEP (X) and physical health (Y). Accordingly, the pathway leading from SEP to physical health without passing through social networks is called the direct effect of SEP on physical health. Likewise, the indirect effect shows how physical health is influenced by SEP through a causal sequence in which SEP influences social networks, which in turn influences physical health.
In the first mediation models, a1 and a2 represent the amount of variation in M1, and M2 caused by a one-unit change on X. b1 estimates the amount of variation in Y caused by one-unit change on M1, while holding M2 and X’s effects on physical health constant (Hayes & Little, 2018, pp. 149–161). Similarly, b2 estimates the amount of variation in Y caused by one-unit change on M2, while holding M1 and X’s effects on physical health constant. Finally, c′1 represents the direct effect, this is the variation in Y for one-unit change in X, while holding the effects of M1 and M2 constant.
The specific indirect effect of X on Y through M1 is a1b1, while the specific indirect effect through M2 is a2b2. The total indirect effect of X on Y is represented by a1b1 + a2b2, while c1 represents the total effect.
Similarly, in the second mediation model a3, a4 represents the amount of variation in M1 and M2 caused by a one-unit change on X.b3 estimates the amount of variation in Y caused by one-unit change in M1 while holding M2 and X’s effects on physical health constant. Similarly, b4 estimates the amount of variation in Y caused by one-unit change in M2, while holding M1 and X’s effects on physical health constant. Finally, c′2 represents the direct effect, this is the variation in Y for one-unit change in X, while holding the effects of M1 and M2 constant. The specific indirect effect of X on Y through M1 is a3b3, while the specific indirect effect through M2 is a4b4. The total indirect effect of X on Y is represented by a3b3 + a4b4, while c2 represents the total effect. A bootstrap confidence interval (CI) approach is used to make an inference. A total of 50,000 bootstrap samples was used to estimate at a 95% CI for direct effects, indirect effects, and specific indirect effects.
Hayes PROCESS macro-regression is used for mediation analysis because it is considered superior and more powerful than Sobel’s test and Baron and Kenny’s causal steps method. For example, in Sobel’s test, the product of two normally distributed coefficients may not follow a normal distribution (Hayes & Preacher, 2014), thus it can lead to wrong conclusions (Hayes et al., 2017). Similarly, Baron and Kenny’s method has low statical power (MacKinnon et al., 2002). These weaknesses are overcome in Hayes PROCESS macro–regression analysis by generating a CI with thousands of empirical samplings (Bootstrapping) (Hayes et al., 2017).
Results
Table 1 presents the descriptive statistics of various demographic characteristics of the study populations. All together 2856 older adults were included in the analysis of which 49.4% are men and 50.6% are women. The mean age of the study population was 63.57 (SD = 6.57) where the minimum age was 55 years and the maximum age was 85 years. The mean age for men was 63.46 (SD = 6.42) and 63.68 (SD = 6.63) for women. The mean PCS-12 physical health status score was 46.93 (SD = 10.39). The mean PCS-12 physical health score is higher for males 48.07 (SD = 9.64) compared to their female counterparts 45.82 (SD = 10.97). The average annual gross income of older adults was 285906 NOK (SD = 219,526). The male older adults have a higher average gross income (M = 340,465, SD = 282,823) than women (M = 231194, SD = 10,532). 16% of older men fall in the 10th income deciles while only 3.6% of female older adults were in the corresponding income group. More than three-fourth (77.6%) of male older adults and 61.1% of female older adults were with partners. The majority of male and female older adults having at least basic higher education accounting for 26.8% and 33.2%, respectively. The percentage of male older adults having higher university education was higher compared with their female counterparts with 13.6% and 5.1%, respectively.
Sociodemographic Characteristics of the Study Population.
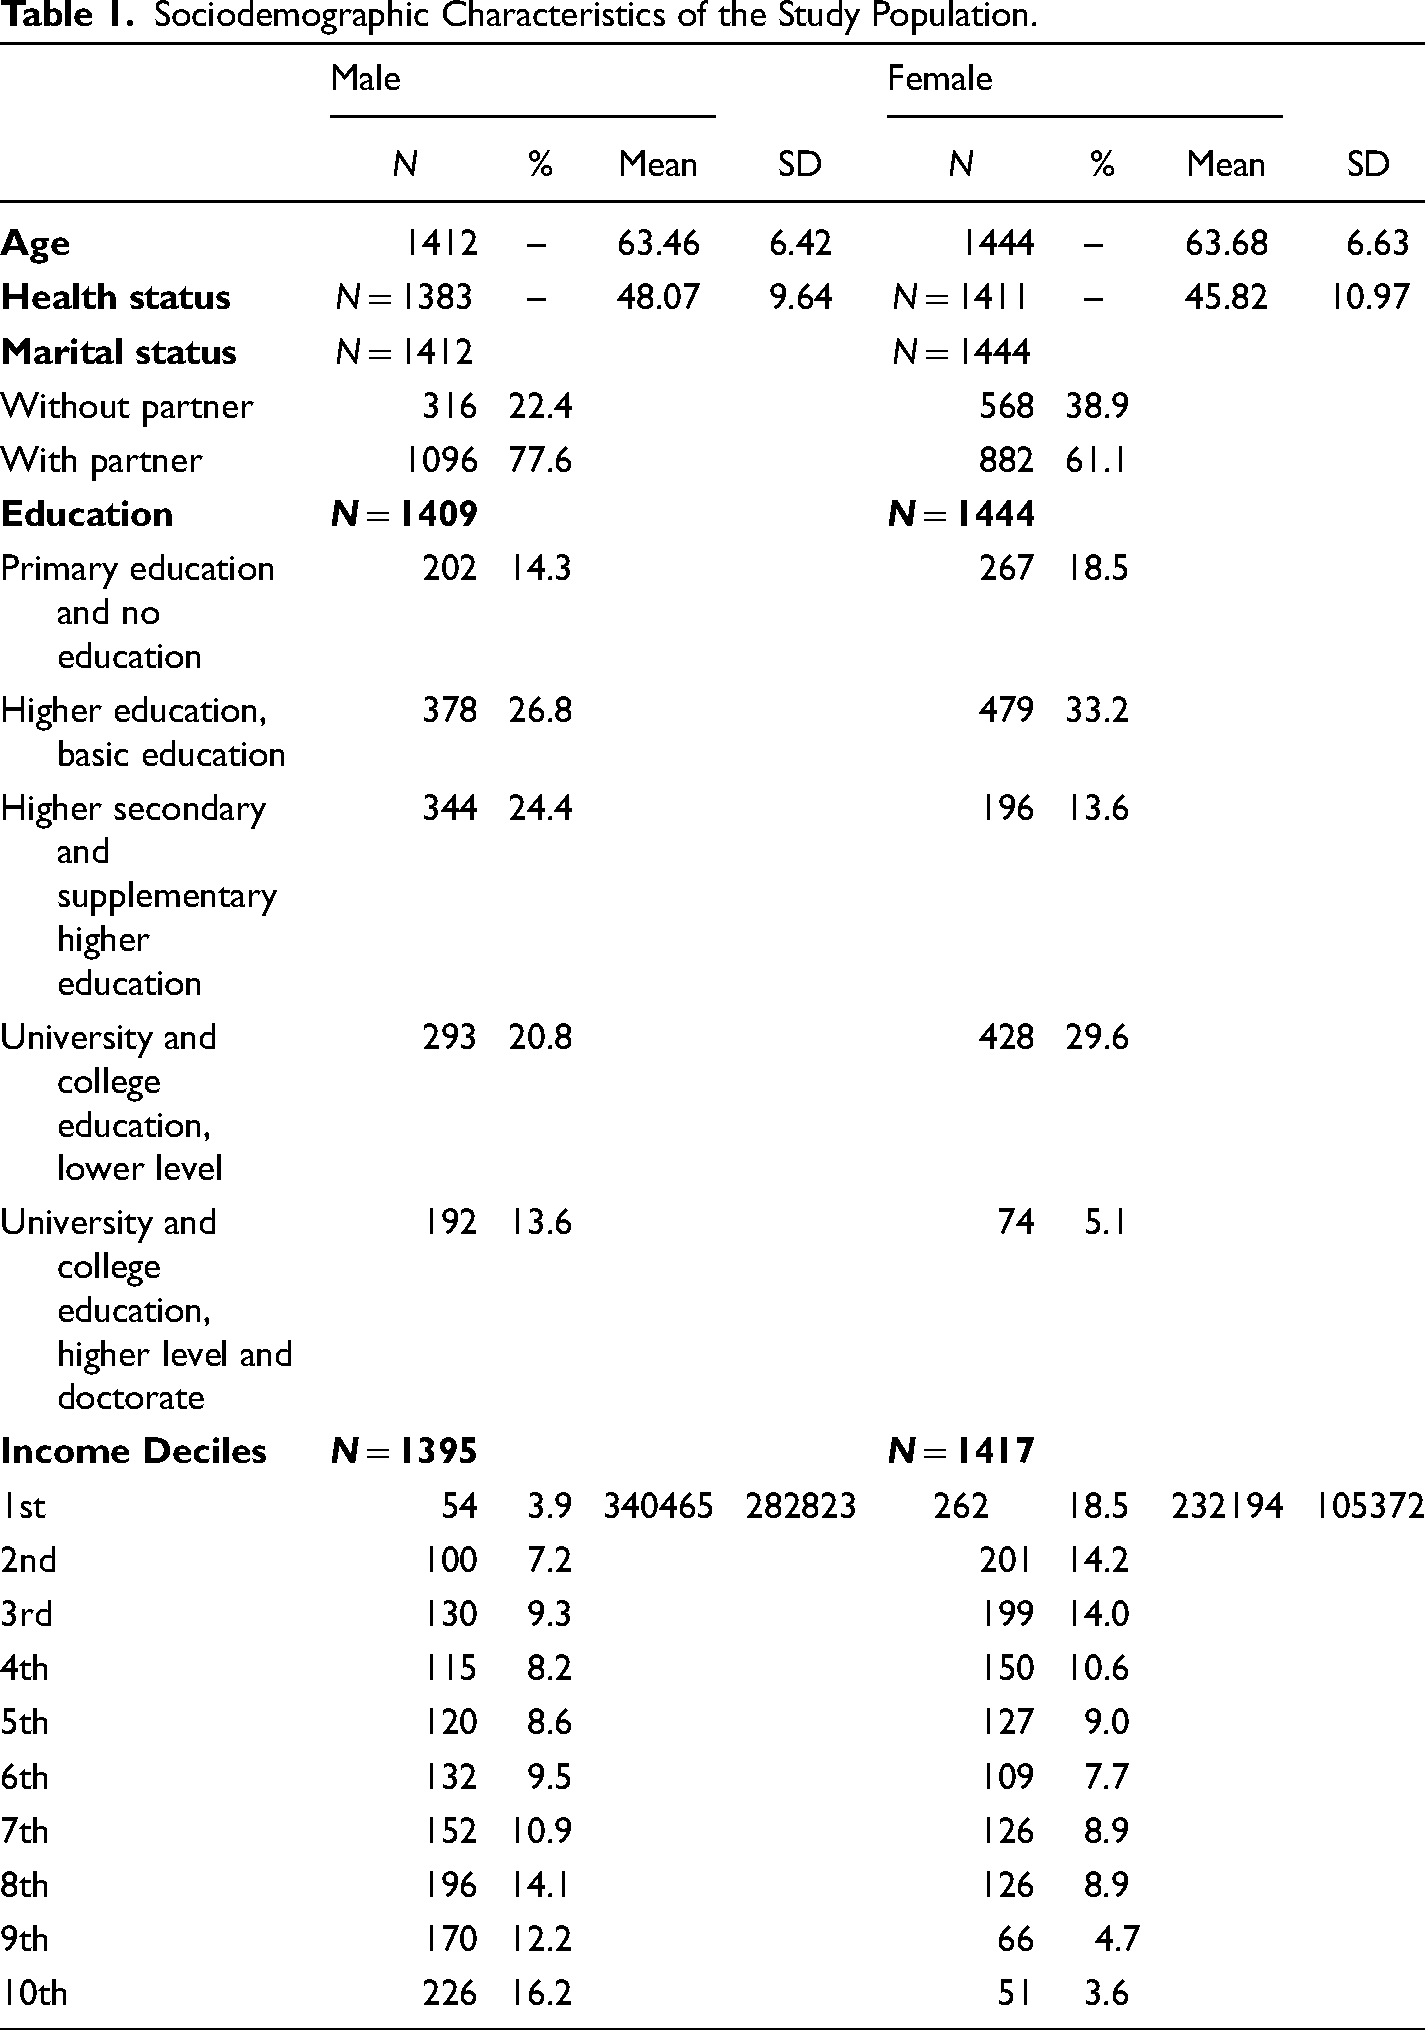
Table 2 presents the total effect (c1), direct effect (c’1), indirect effects (a1b1 and a2b2), total indirect effect (a1b1 + a2b2), and other regression coefficients (a1, a2, b1 b2) from the parallel multiple mediation model of income, social network, and physical health. The total effect of income on physical health alone is observed as 0.83 (c1 = 0.83, SE 0.78, CI: 0.67, 0.98). The direct effect (c′1 = 0.78, SE 0.79, CI: 0.62, 0.94), quantifies the effect of income on physical health score independent of the effect of the proposed mediators on physical health score. Irrespective of differences between the groups in their contact frequency with friends and support potential of friends and how those mediators relate to physical health scores, those with higher income have higher physical health scores (because c′1 is positive) than those with low-income levels. The indirect effect of contact frequency with friend is estimated as (a1b1 = −0.002, SE = 0.002, CI: −0.005, 0.005). This implies that a one decile increase in income is likely to decrease the physical health score by 0.002 units. This suggests that those with higher contact frequency with friends are likely to have a lower physical health score. A 95% CI straddles zero
Model Summary Information for the Parallel Multiple Mediator Model (Income, Contact Frequency with Friends, Support Potential of Friends, and Physical Health).
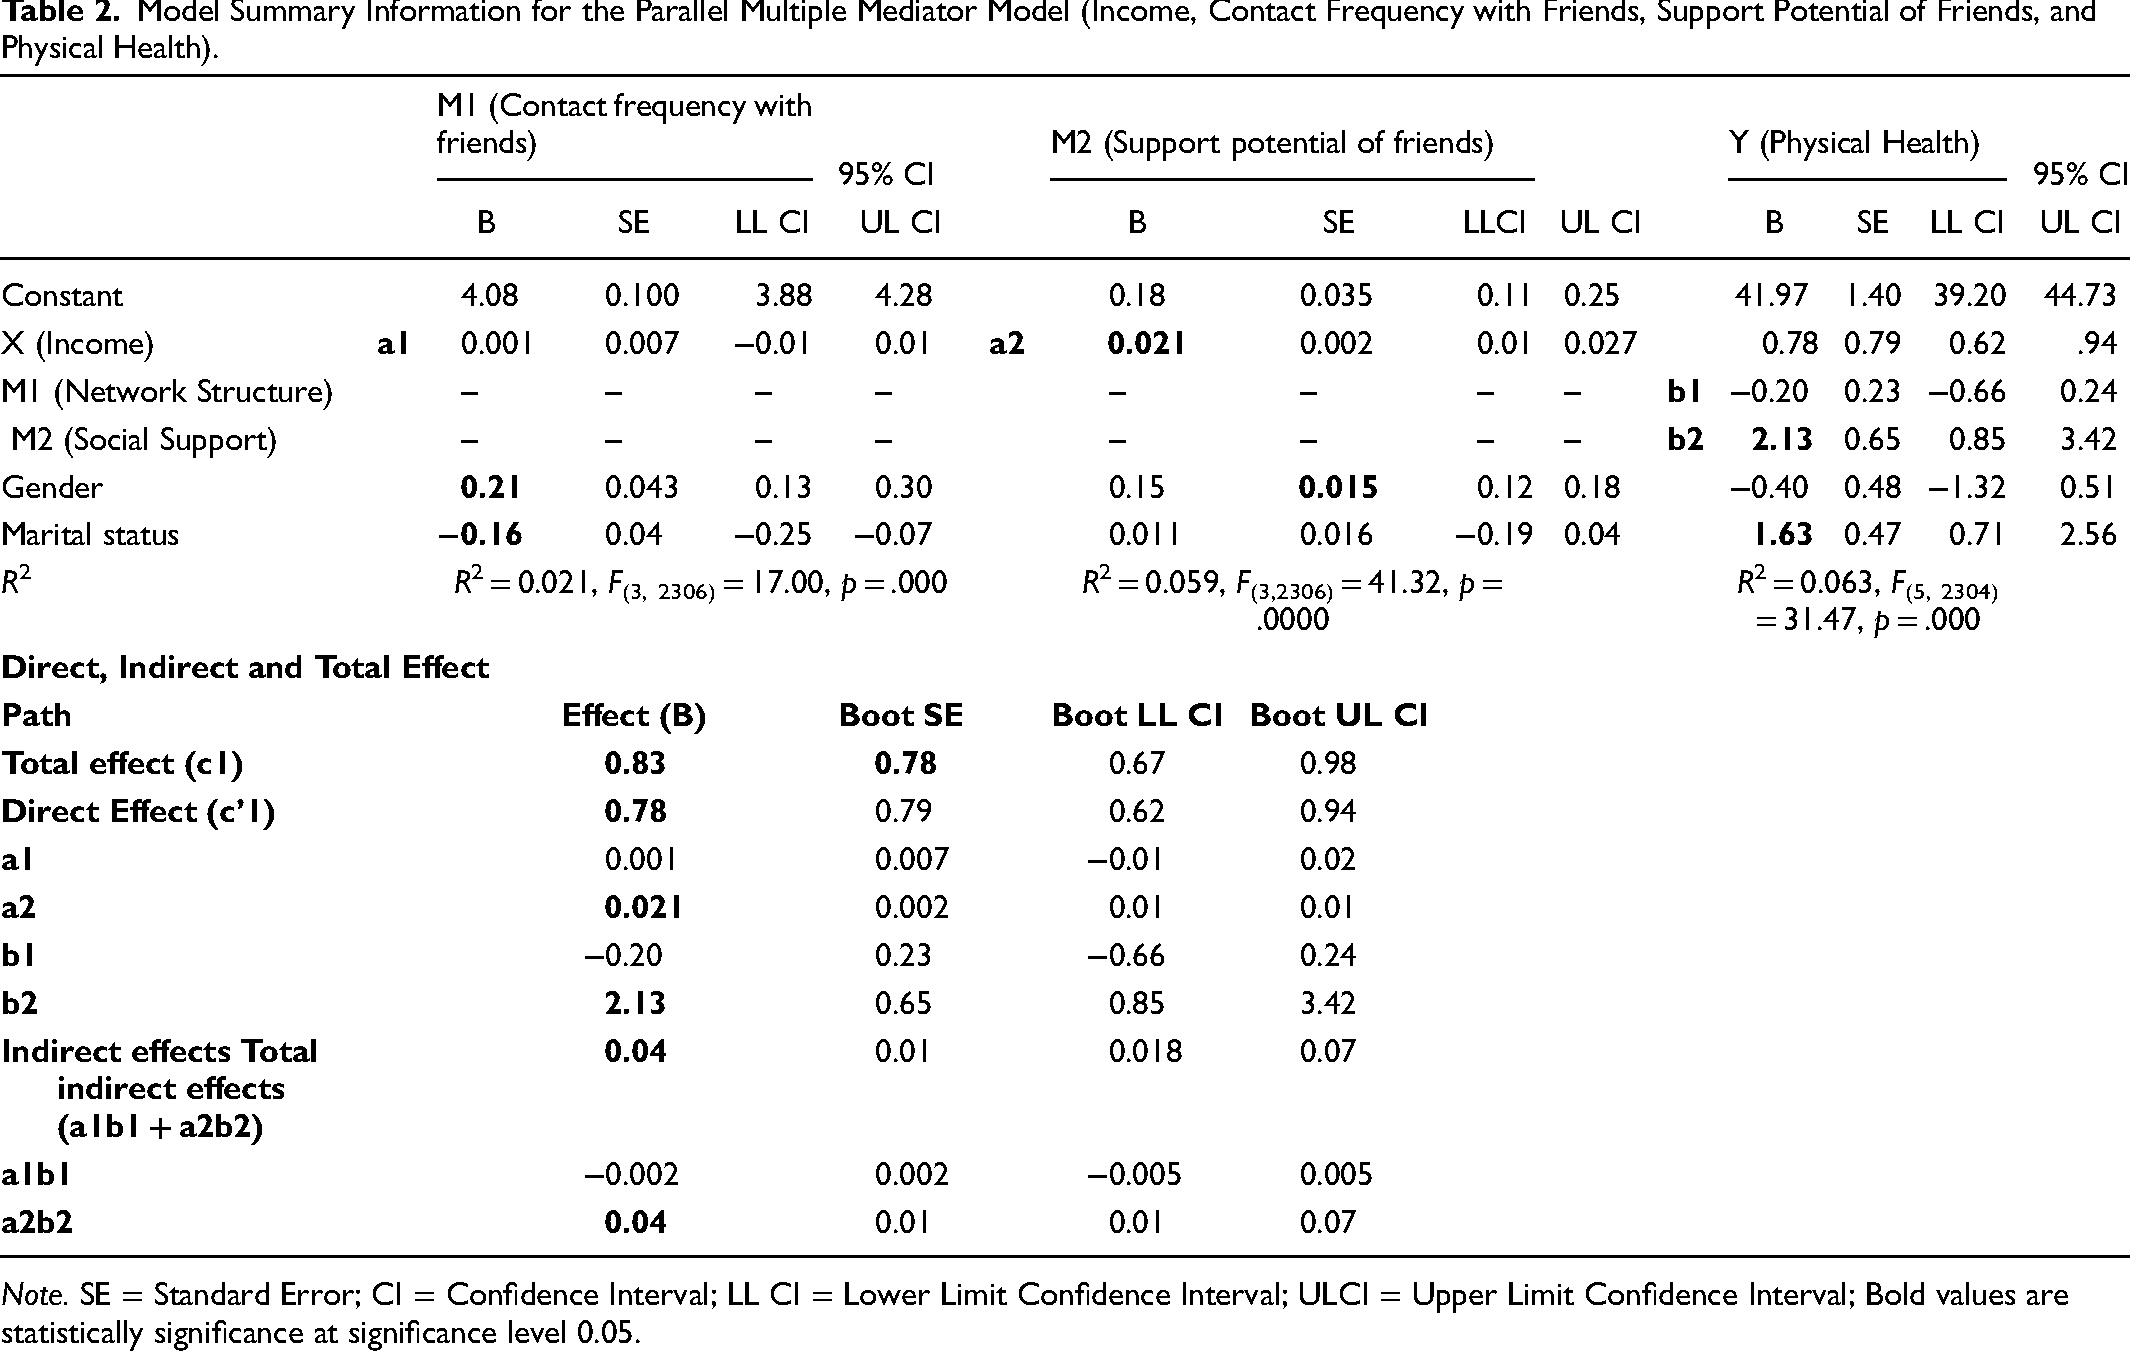
Note. SE = Standard Error; CI = Confidence Interval; LL CI = Lower Limit Confidence Interval; ULCI = Upper Limit Confidence Interval; Bold values are statistically significance at significance level 0.05.
The indirect effect of income on physical health summed across all mediators is called the total indirect effect of income on physical health, which is observed as 0.04, (a1b1 + a2b2 = 0.04, SE 0.01, CI: 0.018, 0.07). The total indirect effect is positive, meaning that those with a higher contact frequency with friends and higher support potential of friends, on average report 0.04 units higher on the physical health score than those with lower contact frequency with friends and lower support potential of friends. This is a result of incomès effect on the mediators, which in turn influence physical health. In the mediation model, we can be 95% confident that incomès total indirect effect through both mediators simultaneously is somewhere between 0.018 and 0.07. This supports the claim that contact frequency with friends and friends’ support potential collectively mediate the effect of income on physical health scores. The values of a1 and a2 are observed as (a1 = 0.001, SE = 0.007, CI: −0.01, 0.01), (a2 = 0.021, SE = 0.002, CI: 0.01, 0.01). This implies that a one decile increase in income is likely to increase the contact frequency with friends by 0.001 scale units, and friends` support potential by 0.02 scale units, respectively. The b1 (b1 = −0.20, SE = 0.23, CI: −0.66, 0.24) estimates the amount by which one scale unit increase in the contact frequency with friends decreases the physical health score while holding friends` support potential and income constant. Similarly, b2 (b2 = 2.13, SE = 0.65, CI: 0.85, 3.42) estimates the amount by which one scale unit increase in friends’ support potential increases the physical health score while holding contact frequency with friends and income constant; 2% variance in contact frequency with friends and 5.9% variance in friends’ support potential is explained by the income (R2 = 0.021, F(3, 2306) = 17.00, p = .000; R2 = 0.059, F(3,2306) = 41.32, p = .0000), whereas 6.3% of the variance in physical health score is accounted for by both proposed mediators and income (R2 = 0.063, F(5, 2304) = 31.47, p = .000).
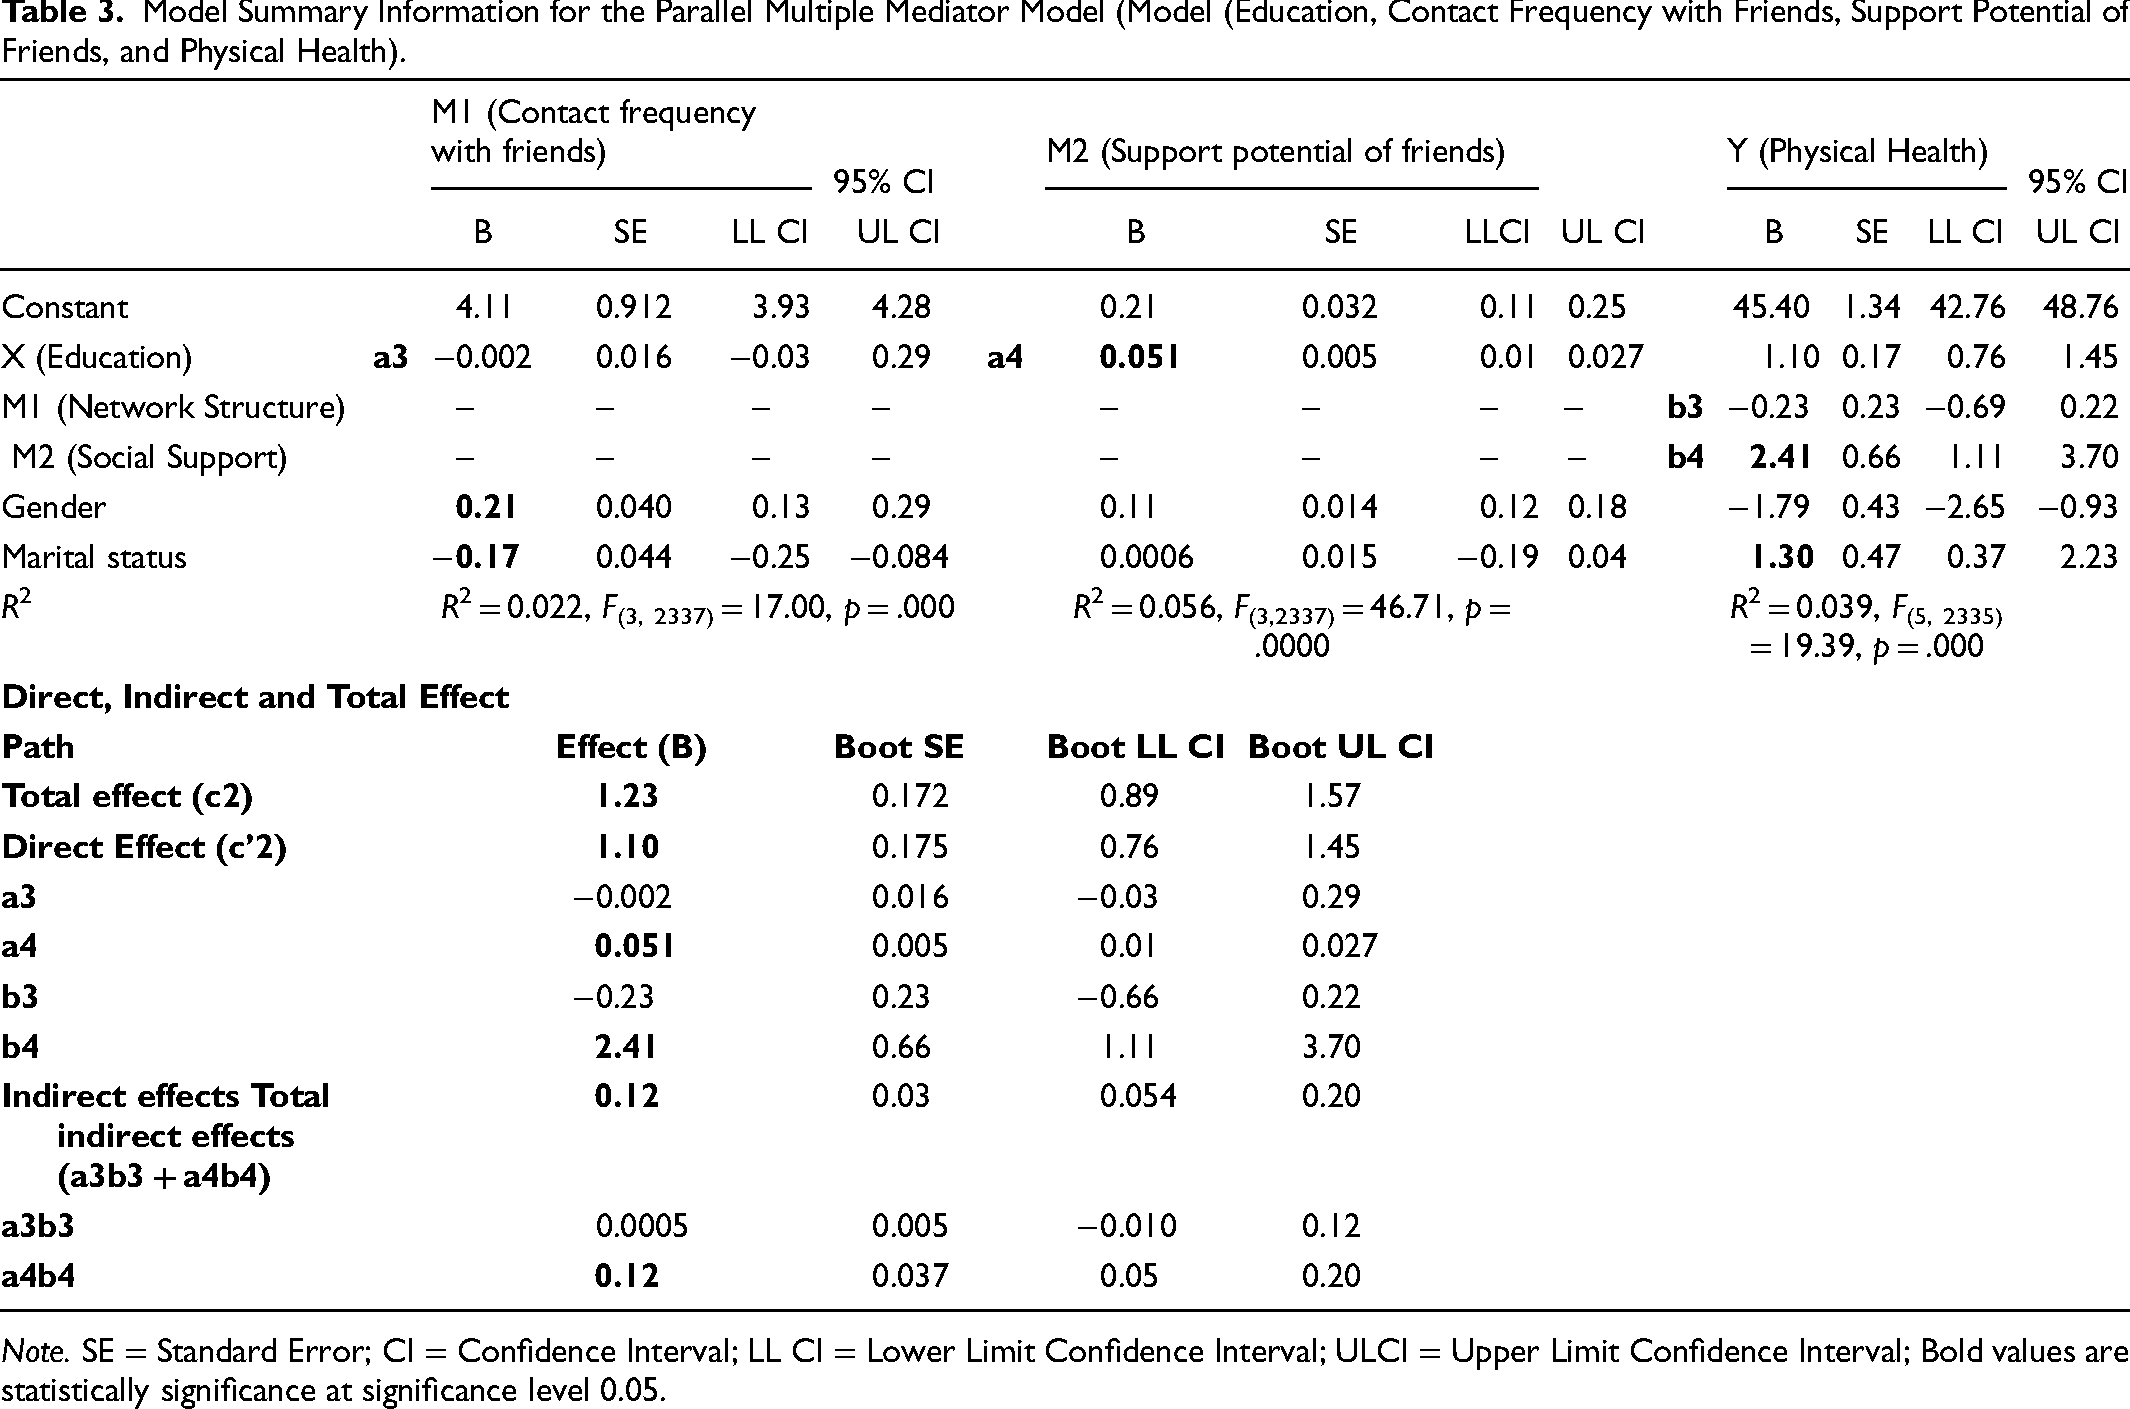
Table 3 presents the total effect (c2), the direct effect (c’2), the indirect effects (a3b3 and a4b4), the total indirect effect (a3b3 + a4b4), and other regression coefficients (a3, a4, b4, and b4) from the parallel multiple mediation models of the level of education attained, social networks, and physical health. The total effect of attained education level on physical health alone is observed as 1.23 (c2 = 1.23, SE 0.172, CI: 0.89, 1.57). The direct effect (c′2 = 1.10, SE = 0.175, CI: 0.76, 1.45). This shows the effect of attained education level on physical health score independent of the effects of the proposed mediators on physical health score. Irrespective of the differences between the groups with regard to their contact frequency with friends and their friends’ support potential, as well as how those mediators relate to physical health scores; those who have attained a higher education level have higher physical health scores than those with a lower attained education level. The indirect effect of contact frequency with friends is estimated as a3b4 = 0.0005 (a3b3 = 0.0005, SE = 0.005, CI: −0.010, 0.12). This means that a one-scale unit increase in attained education level is likely to cause a 0.0005 scale unit increase in the physical health score. This implies that those with a higher contact frequency with friends have a lower physical health score. The 95% CI straddles zero, so we cannot say that the attained education level influences physical health indirectly through contact frequency with friends.
Model Summary Information for the Parallel Multiple Mediator Model (Model (Education, Contact Frequency with Friends, Support Potential of Friends, and Physical Health).
Note. SE = Standard Error; CI = Confidence Interval; LL CI = Lower Limit Confidence Interval; ULCI = Upper Limit Confidence Interval; Bold values are statistically significance at significance level 0.05.
The indirect effect of friends’ social support is estimated as a4b4 = 0.12 (a4b4 = 0.12, SE = 0.037, CI: 0.05, 0.20). This implies that a one-scale unit increase in the attained education level is likely to cause a 0.12 scale unit increase in the physical health score. This suggests that those with a higher support potential of friends have a higher physical health score. The bootstrap CIs support the claim at the 95% confidence level. This means that the highest attained education level influences the physical health scores indirectly through friends’ support potential, as implied by that CI being entirely above zero.
The total indirect effect of the highest attained education level on physical health score is observed as 0.12 (a3b3 + a4b4 = 0.12, SE = 0.03, CI: 0.054, 0.20). The total indirect effect is positive, meaning that those with a higher contact frequency with friends and higher support potential of friend’s report on average 0.12 units higher on their physical health scores than those with lower contact frequency with friends and lower support potential of friends. This is a result of the effect of attained education level on the mediators, which in turn influence physical health. According to this mediation model, we can be 95% confident that the total indirect effect of the attained education level through both mediators simultaneously is somewhere between 0.054 and 0.20. This supports the claim that contact frequency with friends and friends’ support potential collectively mediate the effect of attained education level on physical health scores. The values of a3 and a4 are observed as (a3 = −0.002, SE = 0.016, CI: −0.03, 0.29), (a4 = 0.051, SE = 0.005, CI: 0.01, 0.027). This means that a one-scale unit increase in the attained education level is likely to decrease the contact frequency with friends by 0.002 units, and a one-scale unit increase in the attained education level is likely to increase the support potential of friends by 0.051, respectively. The b3 is (b3 = −0.23, SE = 0.23, CI: −0.66, 0.22), this implies that a one-scale unit increase in the frequency of contact with friends decreases the physical health score, while holding friends’ support potential and highest attained education level constant. Further, b4 is (b4 = 2.41, SE = 0.66, CI: 1.11, 3.70), implying that a one-scale unit on friends` support potential is likely to increase the physical health score, while holding contact frequency with friends and highest attained education level constant; 2.2% variance in the contact frequency with friends and 5.6% variance in friends’ support potential is explained by the level of education (R2 = 0.022, F(3, 2337) = 17.00, p = .000; R2 = 0.056, F(3,2337) = 46.71, p = .0000), whereas 3.9% of the variance in physical health score is accounted for by both proposed mediators and the highest level of education attained (R2 = 0.039, F(5, 2335) = 19.39, p = .000).
Discussion
This paper confirms that the socioeconomic gradient in health exists among older adults in Norway. This implies that older adults belonging to higher income groups and higher levels of education have a greater physical health status (H1). For instance, for every decile increase in the income of older adults, there is an expected increase in the physical health score by 0.83 units. Similarly, for each education level increase, there is an expected increase in the physical health score by 1.1 units.
The two separate parallel multiple mediation models as shown in Figure 3 and Figure 4 show the role of social networks in the relationship between SEP and the physical health status of older adults in Norway. In the first mediation model, it was expected that a higher income level would be associated with a greater support potential of friends, which in turn would be related to a higher physical health score (H2a). Likewise, a higher income level was expected to be associated with a greater support potential of friends, which in turn would be related to a higher physical health score (H2b). These assumptions are only partly supported by the results since the 95% CI does include zero for the indirect effect of contact frequency with a friend (a1b1) in the relationship between income and physical health, thus implying that the result is not statistically significant. On the other hand, the 95% CI does not include zero for the indirect effect of the support potential of a friend (a2b2) in the relationship between income and physical health, this implying the result is statistically significant.
Multiple mediator model income, contact frequency with friends, support potential of friends, and physical health (unstandardized direct and indirect effects).
Mediator model education, contact frequency with friends, support potential of friends, and physical health (unstandardized direct and indirect effects).
The second mediation model assumes that a higher level of education is associated with more frequent contact with friends, which in turn is related to a higher physical health score (H3a). Likewise, it is assumed that a higher level of education is associated with more support potential of friends, which in turn is related to a higher physical health score (H3b). These assumptions are only partly supported by the results since the 95% CI does include zero for the indirect effect of contact frequency with a friend (a3b3) in the relationship between education and physical health, thus implying that the result is not statistically significant. On the other hand, the 95% CI does not include zero for the indirect effect of support potential of a friend (a4b4) in the relationship between education and physical health, this implying the result is statistically significant.
In the case of each mediation model, the total indirect effect of income on physical health (a1b2 + a2b2) summed across the two mediators (i.e., contact frequency and support potential of friends), and the total indirect effect of education on physical health summed across two mediators (a3b3 + a4b4); both showed a positive and statistically significant association.
Therefore, from these findings, it can be concluded that social networks (i.e., friends’ support potential and frequency of contact with friends) mediate the relationship between SEP and health status among older adults in Norway, but only partially. The results show that a higher level of education results in greater support potential of friends, and in turn leads to better health status. Similarly, a higher income level is associated with greater social support potential from friends, which in turn is related to better physical health. These findings are similar to other studies that show that social support is related to a lower level of mortality and protects people from illnesses. In such cases, social support (i.e., emotional and instrumental support) in turn can promote healthier lifestyles and result in protection from various diseases (Seeman & Berkman, 1988). For example, a US-based longitudinal study with a nationally representative sample of older adults examined the relationship between social support and change in blood pressure measures over six years. The results showed a clear gradient in blood pressure (BP) measures according to social support. This was shown by the significant difference in BP profiles of older adults with higher levels of support (Yang et al., 2015). Yang et al. further highlighted that perceived social support was a prominent factor influencing blood pressure (Yang et al., 2015) but they did not provide a possible explanation. It may be that friends are an important source of perceived social support, that is, in the form of emotional support (Larson et al., 1986), which helps to reduce stress, and in turn, results in a positive influence on blood pressure. Furthermore, the meta-analysis paper by Shor et al. shows that social relationships facilitate healthy behaviors like adherence to treatment regimens and keeping healthy diets which are crucial during old age (Shor & Roelfs, 2015). In contrast to the above examples of social support, Seeman et al. (1988) and Hakulinen et al. (2016) studies show that a higher level of social support (i.e., in the form of practical support) is associated with poorer physical health (Hakulinen et al., 2016; Seeman & Berkman, 1988).
The current study’s findings were according to expectations and in agreement with the findings of Yang et al. and Larson et al., who posit that social support is associated with better physical health outcomes. However, the results were in contrast to Seeman et al.’s & Hakulinen et al.’s findings, which posited that social support is negatively associated with physical health outcomes. More specifically, this negative association is likely explained by the fact that people who become sick need more practical support, for example, sick persons often need assistance in order to utilize healthcare, that is, they need help with mobility and transport. In other words, these authors posit that those who are not physically fit tend to utilize more social support (Seeman & Berkman, 1988). The current study’s findings indicate the opposite, where an increased level of social support is associated with higher a higher physical health score.
There are mixed findings regarding contact frequency’s influence on physical health outcomes. Various meta-analyses results indicate that social contact is beneficial to health (Holt-Lunstad et al., 2010; Shor & Roelfs, 2015) and this effect is especially pronounced in the older population (Shor & Roelfs, 2015). Other studies show that a higher frequency (i.e., daily) of social interactions is not necessarily associated with better health outcomes (Stavrova & Ren, 2020). This paper finds that the contact frequency with a friend does not influence physical health outcomes among older adults in Norway. This might be because contact frequency is often associated with social support that older people receive, which in turn influences health. A study by Seeman et al. showed that received instrumental and received emotional support by those who are 65 year-olds and older are strongly related to the frequency of contact with their social network (Seeman & Berkman, 1988). However, in this paper, it is assumed that the frequency of contact and friends’ social support potential do not influence each other. Additionally, the data showed that the frequency of contact with the social network has a negative influence on older adult’s health, though this is not statistically significant. Thus, it can be assumed that social networks, especially the contact frequency, do not always act as a positive health predictor. The negative association between network structure and health is a result of the divergence of resources on other activities as a result of frequent social contacts, which otherwise could be used for positive health outcomes (Stavrova & Ren, 2020). Interestingly, people who actively seek solitude as a way to relax and regulate their emotions, for them the increase in the frequency of contact with others interferes with such valuable moments for solitude and other dimensions of personal life (Coplan et al., 2019). Also, individuals need to maintain a particularly high frequency of social contacts because that’s what they have to do, and not because that’s what they want to (Uchino, 2004b). Such frequent social contact might put people in a stressful situation (Stavrova & Ren, 2020; Uchino, 2004b) and it is a well-established fact that stress is a well-known predictor of poor health (Thoits, 2010). Following the above discussions and evidence, this paper reveals mixed findings; that is, some aspects of the social network (i.e., friends’ support potential) have a positive impact on physical health, while others have a negative impact (i.e., contact frequency with friends) on physical health. Therefore, health researchers also need to consider the deteriorating influence of social networks on health outcomes.
There are a number of limitations. This paper only uses a single measure of the network structure, that is, contact frequency with friends, therefore, does not comprehensively identify the network structure’s influence on health. This paper assumes that social structure does not relate to social support, however, studies have also indicated that a social network’s structure can influence various social support, which in turn can produce different health outcomes. Therefore, future studies could explore how various social network characteristics interact with each other and influence the relationship between SEP and health status using complex mediation models. The strength of this paper is the use of national-level longitudinal data spanning 10 years, which allows for a detailed estimation of the causal association between SEP, social network, and physical health.
Conclusion
The results show a socioeconomic gradient exists in the health of the older adults in Norway. This study’s results show that the social network is an important pathway via which SEP influences people’s health status. All aspects of the achieved social network (i.e., friends) do not play a positive role not have a significant influence on health outcomes. More specifically, the evidence highlights that contact frequency with friends does not show any influence on the relationship between SEP and health status among older Norwegian adults. Nevertheless, other aspects of the social network structure and their influences on health outcomes among older adults need further investigation, which was not included in this study owing to a limited scope of this research paper. This paper shows friends’ support potential is a significant pathway between SEP and health status in Norway. However, this limited operationalization of network structure is not sufficient and motivates a more comprehensive operationalization so that a better understanding of why these effects occur can be found. It is also necessary to investigate the specific dimension of social support (i.e., emotional, instrumental, appraisal, or informational) that has the most beneficial effect on physical health outcomes in Norwegian older adults, so that policy interventions may be more well informed.
Footnotes
Acknowledgments
The NorLAG data collections have been financed by The Research Council of Norway, four ministries, The Norwegian Directorate of Health, The Norwegian State Housing Bank, Statistics Norway and NOVA, OsloMet. NorLAG data are part of the ACCESS Life Course infrastructure funded by the National Financing Initiative for Research Infrastructure at the Research Council of Norway (grant no. 195403 and no. 269920)
Declaration of Conflicting Interests
The author(s) declared no potential conflicts of interest with respect to the research, authorship, and/or publication of this article.
Funding
The author(s) received no financial support for the research, authorship, and/or publication of this article.