
Abstract
This article examines the influence of bureaucratic structure on a public employee’s sense of inclusion. We argue that bureaucratic structure influences inclusion by accentuating or minimizing status differences. To test this argument, we investigate three types of bureaucratic structure: centralization, hierarchy, and span of control, all expected to lower inclusion, and “green tape,” or effective organizational rules, expected to increase inclusion. To test these expectations, we use quantitative and qualitative survey data, as well as administrative data collected from the employees of 31 departments in a county government in the Southeastern United States. Findings indicate that higher centralization and wider span of control reduce inclusion, whereas green tape increases inclusion. Hierarchy shows no statistically significant inclusion effect. The article concludes with the implications of these results of public sector organizational design.
Introduction
How can public managers design organizations to be more inclusive? Inclusion, the extent to which public employees feel both belonging and uniqueness in the workplace (Shore et al., 2011), is an increasingly researched public administration topic. An employee’s sense of inclusion appears to yield positive organizational outcomes, by moderating perceptions of diversity management (Ashikali & Groeneveld, 2015), fostering perceptions of strong organizational performance (Sabharwal, 2014), lowering turnover intentions (Sabharwal et al., 2019), and spurring employee effort (Ohemeng & McGrandle, 2021). Inclusive management has also been found to moderate the relationship between diversity and positive organizational outcomes, such as innovation and turnover intentions (Moon, 2018). Along with its organizational benefits, inclusive workplaces have been shown to boost job satisfaction (Findler et al., 2007; Hur, 2020) and employee well-being (Findler et al., 2007).
Given the individual and organizational benefits of inclusion, it is important from both theoretical and practical perspectives to understand the antecedents of inclusion in public organizations. Thus far, research on public personnel management has focused on the roles of representative bureaucracy (Andrews & Ashworth, 2015) and inclusive leadership practices (Ashikali et al., 2021), both of which have been shown to foster inclusion. While this research has jumpstarted attention to how to foster inclusion in public organizations, it is missing one potential determinant of the extent to which employees feel included: the bureaucratic structure of an organization. Bureaucratic structure formalizes organizational status (Brass & Burkhardt, 1993), which differentiates employees in an organization (James & Jones, 1976). This status differentiation will, in turn, undercut an employee’s sense of inclusion.
The bureaucratic structures of interest in this article include centralization, which is the extent to which decisions are concentrated at the upper levels of the organization (Aiken & Hage, 1966); hierarchy, or the layers of authority within an organization (Hall, 1999; Pugh et al., 1968; Rainey, 2009); effective rules, also known as “green tape” (DeHart-Davis, 2009); and supervisory spans of control, which is the number of employees managed by an individual supervisor (Meier & Bohte, 2003). Higher centralization, steeper hierarchy, and wider span of control are expected to reduce inclusion by conveying lower status, whereas green tape, by virtue of its status-leveling properties (DeHart-Davis, 2017), is expected to increase inclusion. This study focuses on centralization, hierarchy, rules, and span of control because they have been identified by public organization scholars as the basic forms of organizational structure (Rainey, 2009).
To test these expectations, this research drew on survey and administrative data collected from the employees of a county government in the Southeastern United States. The survey was administered in the summer of 2021 and achieved a 69% response rate (n = 1,699). Respondents hail from 31 different departments, including public safety, social services, and public health. We analyze quantitative and qualitative survey data as well as administrative data. The quantitative analyses employ hierarchical linear modeling to estimate the influence of bureaucratic structure on inclusion, while the qualitative analyses involve coding the open-ended survey comments related to the bureaucratic structure of those workplaces for which employees expressed high and low inclusion.
This article contributes to the literature on public personnel management in three ways. First, it expands theoretical knowledge of the organizational antecedents of inclusion in public organizations, also giving practitioners insights into how they can foster inclusion. Second, it delves into the role of bureaucratic structure, an overlooked but potentially important contributor to inclusion. Third, it measures the inclusion felt by individual employees rather than focusing on leadership practices thought to foster inclusion.
The article is organized as follows. The first section provides an overview of the inclusion concept. The second section lays out the theory underlying the expectations that bureaucratic structure will affect inclusion. The third section discusses the research design and data. Thereafter, the quantitative and qualitative results are presented followed by the discussion and conclusion section.
Inclusion
Inclusion has been conceptualized in a wide variety of ways and at multiple levels within organizations (Ferdman, 2014; Shore et al., 2018). At the organizational level, inclusive organizations are diverse, fair, and welcoming to all employees (McCandless et al., 2022) with norms and symbols signaling that all are welcome (Selden & Selden, 2001). Inclusion at the leadership level involves an array of strategies such as committing to inclusion from the top down, equipping employees to influence organizational decisions, treating employees fairly and equitably (Sabharwal, 2014), appreciating uniqueness rather than demanding assimilation (Randel et al., 2018); encouraging diverse perspectives and integrating all employees into teams (Ashikali & Groeneveld, 2015); and being fair, supporting, and empowering (Sabharwal et al., 2019). If leaders’ inclusion efforts are effective, all employees—whether from underrepresented or socially dominant groups—will collectively perceive a positive climate for inclusion (Nishii, 2013). Inclusion also occurs at the individual level and is referred to as psychological inclusion (Ferdman, 2014) and experiences of inclusion (Ferdman et al., 2009).
This article focuses on individual-level inclusion. This emphasis has several advantages. First, individual feelings are the building blocks of climates for inclusion; climates are shared individual perceptions (Ferdman, 2014). Assessing climate requires measuring individual feelings of inclusion, without which organizational and leader inclusion efforts are difficult to assess (Nishii & Rich, 2013). Consequently, individual experiences of inclusion are a first-order objective of inclusion efforts. Second, focusing on an individual’s sense of inclusion separates means from ends. Many studies of inclusion at the individual level emphasize employee perceptions of inclusive leadership practices rather than whether employees feel included (Bae et al., 2017; Hoang et al., n.d.; Moon, 2018; Sabharwal, 2014; Sabharwal et al., 2019). Our emphasis on individual feelings of inclusion contributes to this literature by studying the ultimate end goal of inclusion efforts, the extent to which individual employees feel included.
Scholars have defined an individual’s feelings of inclusion in a variety of ways. Shore and colleagues (2011) build on a range of social science theories to define inclusion as a sense of both belonging and uniqueness. Pelled and colleagues (1999) describe inclusion as feeling like an organizational insider. Ferdman et al. (2009) associate inclusion with a wide range of experiences, such as “to feel safe, trusted, accepted, respected, supported, valued, fulfilled, engaged, and authentic in their working environment, both as individuals and as members of particular identity groups.” Looking across these descriptions, inclusion requires an integration of the full individual into the organization.
Bureaucracy and Inclusion
This research examines the role of bureaucracy in fostering or undercutting inclusion at the individual level. Bureaucracy provides the scaffolding for organizations, locating individuals in relation to one another, and defining their roles (Hall, 1999; Tolbert & Hall, 2015). Bureaucracy is a ubiquitous feature of all organizations but is particularly relevant for public sector organizations which rely on rules, hierarchy, and formal processes to function with accountability and transparency (Hill & Lynn, 2015). Bureaucracy is explicitly developed and sanctioned by the organization, formally separating organizational members from each other by virtue of different roles and ranks (Zlatev et al., 2016). Whereas inclusion seeks integration of all employees, bureaucracy serves to differentiate employees from one another (Jackson & McGehee, 1965). These two purposes, we contend, work in opposition to one another.
We examine four forms of bureaucratic structure for their effects on inclusion: hierarchy, the number of layers within an organization or group (Worthy, 1950); centralization, the upward locus of authority in an organization (Aiken & Hage, 1966); span of control, defined as the number of employees overseen by a supervisor (Gulick, 1937); and “green tape,” defined as effective organizational rules (DeHart-Davis, 2009). These structural attributes represent fundamental forms of structure by organizational scholars (Rainey, 2009). The following section begins the theoretical exploration by examining the potential for hierarchy to impact inclusion at the individual level.
Hierarchy and Inclusion
Hierarchy is the most fundamental type of bureaucratic structure, defined by the configuration of supervisory layers in an organization or group (Hall et al., 1967; Worthy, 1950). Hierarchies with more layers are steeper in configuration, while fewer layers indicate flatter configurations (Porter & Lawler, 1965).
We pose four reasons that steeper hierarchies may undermine inclusion. First, hierarchies differentiate employees by status, e.g. employee versus supervisor, supervisor versus manager, etc. This differentiation places psychological distance between employees and those located above them (Payne & Mansfield, 1973). Psychological distance theoretically undermines the goal of inclusion to integrate all employees into the full life of the organization (Ely & Thomas, 2001; Ferdman, 2014). An employee, we argue, cannot be both integrated and distanced simultaneously. Second, status differentiation distributes respect unequally within organizations according to an employee’s rank (Anderson & Brown, 2010; Bunderson et al., 2016; Magee & Galinsky, 2008). By contrast, inclusive work environments accord respect to all employees (Ferdman et al., 2009). Third, the competition for status removes the incentive to treat all employees as insiders, a theoretical precursor to an employee’s sense of inclusion (Pelled et al., 1999; Shore et al., 2011). In addition, finally, the incentive to defer to the higher ranks discourages employees from speaking up, even when the stakes are high (Edmondson, 2018; Nembhard & Edmondson, 2006). This disincentive to speak up violates the premise that inclusion involves empowering employees and encouraging their perspectives (Ashikali & Groeneveld, 2015; Sabharwal et al., 2019). These arguments lead to the following hypothesis:
Centralization and Inclusion
Centralization is another form of bureaucratic structure with implications for inclusion. Defined as the upward concentration of decision-making in organizations (Aiken & Hage, 1966; Dalton et al., 1980; Pugh et al., 1968), centralization concentrates decision-making in the hands of a few members.
Centralized decision-making is expected to diminish an employee’s sense of inclusion by restricting decision participation. Decision participation is commonly identified as a key organizational ingredient for fostering individual inclusion (Mor Barak et al., 1998; Ferdman, 2014; Nishii, 2013; Pless & Maak, 2004). The ability to participate in decisions brings employees a sense of being an organizational insider (Pelled et al., 1999) and encourages engagement in their workgroups (Mor Barak et al., 2016). In the public management literature, leaders who involve employees in decision-making have been shown to foster inclusive climates (Ashikali et al., 2021). By contrast, centralization assigns decision-making to a few upper-level organization members, thus hoarding decisions that lower-level employees could make (Aiken & Hage, 1966) and discouraging independent decisions by middle managers and frontline workers (Andrews et al., 2009). Not surprisingly, centralization appears to foster alienation, when employees feel psychological distance between themselves and their employers (DeHart-Davis & Pandey, 2005). For these reasons, this study poses the following hypothesis:
Span of Control
Span of control is defined by the number of employees reporting to a single supervisor (Gulick, 1937). Supervisors with narrow spans of control have fewer employees to manage, while supervisors with broad spans of control have more employees to oversee.
The size of a supervisor’s span of control potentially affects inclusion via the relationships between supervisors and employees. Research suggests that leaders create workgroup inclusion by building high-quality relationships with employees, cultivating shared goals, reducing status differences, and soliciting employees’ unique ideas (Dobusch, 2021; Nishii & Leroy, 2022). Span of control affects a supervisor’s ability to build high-quality relationships with employees by limiting or facilitating supervisor–employee interactions. With narrow spans of control, supervisors have more time to devote to interacting with employees while broad spans of control lead to fewer interactions (Gittell, 2000, 2001). Along with relationship building, inclusion requires leaders to recognize the unique contributions and needs of employees (Shore et al., 2011), a relationship-intensive task rendered more difficult by broader spans of control (Gittell, 2001). Because spans of control shape the relationship between supervisors and an employee, this study hypothesizes the following:
Green Tape
Effective organizational rules, called “green tape” in the public management literature, are also a potential determinant of inclusion. Five attributes are expected to increase the probability of effective rules: rule formalization, rule logic, consistent rule purposes, optimal control, and purposes understood by stakeholders (DeHart-Davis, 2009).
The theoretical relationship between green tape and inclusion assumes that certain organizational rule characteristics send signals to employees that convey stronger or weaker connections to the organization. An employee’s sense of connection with the organization, in turn, is a necessary condition for the belonging dimension of inclusion (Hubbard, 2004). Beginning with rule formalization, written rules connect employees and employers through the transparency of the written word, which legitimizes organizational preferences and protects employees against arbitrary and capricious managerial behavior (DeHart-Davis, 2017). This connection is a fundamental attribute of inclusion, without which employees cannot feel like an integral part of the organization (Ferdman, 2014; Nishii, 2013). In support of this argument, written rules have been correlated with organizational identification, the extent to which an employee identifies with their organization (Ashforth & Mael, 1989). Logical rules, in which rule requirements prima facie fit with rule objectives, convey rationality and respect for rule followers; illogical rules, by contrast, are alienating because they can engender feelings of powerlessness (DeHart-Davis & Pandey, 2005). Respect and empowerment of employees are theoretical precursors to inclusion (Booysen, 2013; Roberson, 2006). Consistent rule application conveys fairness (DeHart-Davis, 2017), another correlate of inclusion, by systemically applying rule requirements to all individuals and groups within the organization (DeHart-Davis, 2009 ). Consistency also protects a person’s own sense of identity by assuring employees that they have equal standing and value to the organization. Optimally controlling rules are neither excessively nor inadequately controlling (DeHart-Davis, 2009). By imposing requirements that are just enough to achieve rule purposes, optimally controlling rules convey that organizations trust their employees (Sitkin, 1995), a correlate of inclusive climates (Downey et al., 2014). Finally, rules with purposes understood by stakeholders make work more meaningful, in contrast with rules for which purposes are obscure (DeHart-Davis, 2009). Meaningful work contributes to feelings of inclusion by enabling employees to fully participate in the organization (Pless & Maak, 2004).
Based on the organizational signals that green tape attributes send to employees, this article expects that:
Research Design
To test the four hypotheses, this study analyzes quantitative and qualitative survey data as well as administrative records collected in 2021 from the employees of 31 departments in a county located in the Southeastern United States. The data were collected by the Local Government Workplaces Initiative, a program of engaged scholarship at the University of North Carolina at Chapel Hill that conducts workplace climate research for academic and practical purposes.
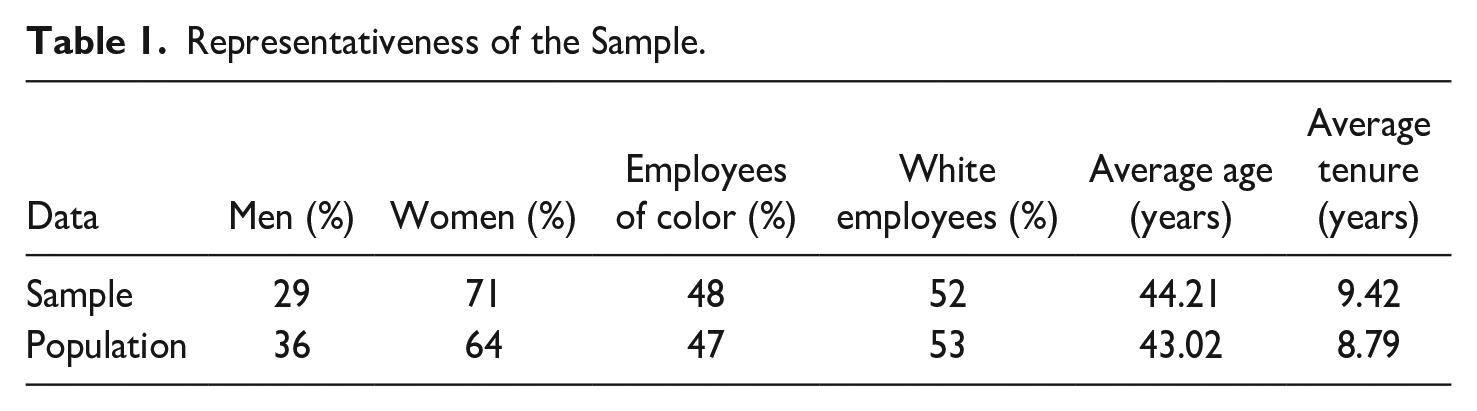
The survey was implemented in Qualtrics and used Dillman’s Total Design Method, inviting employees to complete the survey in a seriesof email communications with consistent messaging (Dillman et al., 2014). The research team sought the perspectives of employees throughout each organization’s hierarchy, representing an “echelon” approach of multiple informants with different organizational perspectives (Walker & Brewer, 2008). The survey process began with an alert email from the county manager expressing support for the study, encouraging voluntary participation, and guaranteeing confidentiality. Within a week of the alert email, survey invitations were distributed through Qualtrics. All survey responses were returned directly to the research team. Thus, surveys were distributed to all employees of the county; a total of 2,480 employees were surveyed, of which 1,699 responded, for a response rate of 69%. All departments are proportionally represented in the sample, except for law enforcement, with a 38% response rate. As Table 1 indicates, the results represent the county’s employees demographically.
Representativeness of the Sample.
Quantitative Survey Measures
The dependent variable, inclusion, is measured as the sum of responses to two 7-point survey items (0–6), “I feel included in my workplace” and “This organization values me as an employee.” This scale ranges from 0 (strongly disagree on both items) to 12 (strongly agree on both items) and exhibits Cronbach’s alpha of .79. These survey items were selected to represent the belonging and uniqueness dimensions of inclusion (Shore et al., 2011).
The independent variables are constructed from a mix of survey and administrative data. Hierarchy is measured using administrative data on the number of supervisory layers in a department. Centralization is measured as the sum of responses to three 7-point items (0–6) taken from Aiken and Hage (1966). These items are as follows: “I must check with my supervisor before I do almost anything,” “In general, an employee wanting to make his or her own decisions in my department would be quickly discouraged,” and “Even small matters have to be referred to someone higher up for a final answer.” The scale ranges from 0 (strongly disagree on all items) to 18 (strongly agree on all items) and has Cronbach’s alpha of .84. Span of control is measured using administrative data, as the number of employees supervised by an employee’s supervisor. Green tape is measured as the sum of five measures, one for each green tape attribute: rule formalization, rule logic, consistent rule application, optimal control, and understood purposes (DeHart-Davis, 2009). Each rule attribute is measured using responses to the question “How many of your work unit’s rules can be described as follows?” Response categories range from 0 (no rules) to 4 (all rules) for each green tape attribute, articulated as “written,” “logical,” “consistent,” “reasonable,” and “clear purposes.” Cronbach’s alpha for the green tape items is .91. Individual-level control variables indicate the age, tenure, gender (0 = male and 1 = female), supervisory status (0 = subordinate and 1 = manager), race (0 = White employees and 1 = employees of color) of employees, power distance (how far down in the hierarchy an employee is located), and inclusive managerial practices. At the department level of analysis we use administrative data to calculate average age, average tenure, percent of women, percent of employees of color, and group size as controls.
Results
This section reports quantitative results in terms of the validity of the measures used, descriptive statistics of the data, and the results of the hierarchical linear model (HLM) of inclusion. The qualitative results are also reported, in themes related to the positive and negative aspects of bureaucracy.
Preliminary Analysis
Confirmatory factor analysis (CFA) was conducted in Mplus 8 to examine the measurement validity of the latent variables (i.e., inclusion, green tape, centralization, and inclusive managerial practices). 1 As shown in Table 2, the CFA results indicate the model fits the data well: All fit indices and factor loadings are above the commonly used threshold values; the composite reliability scores are all above .80; and the average variance extracted (AVE) scores are above .70, providing evidence of good convergent validity and reliability. In addition, the squared correlations between the four latent variables are smaller than their AVE scores, indicating satisfactory discriminant validity. 2
CFA Results.
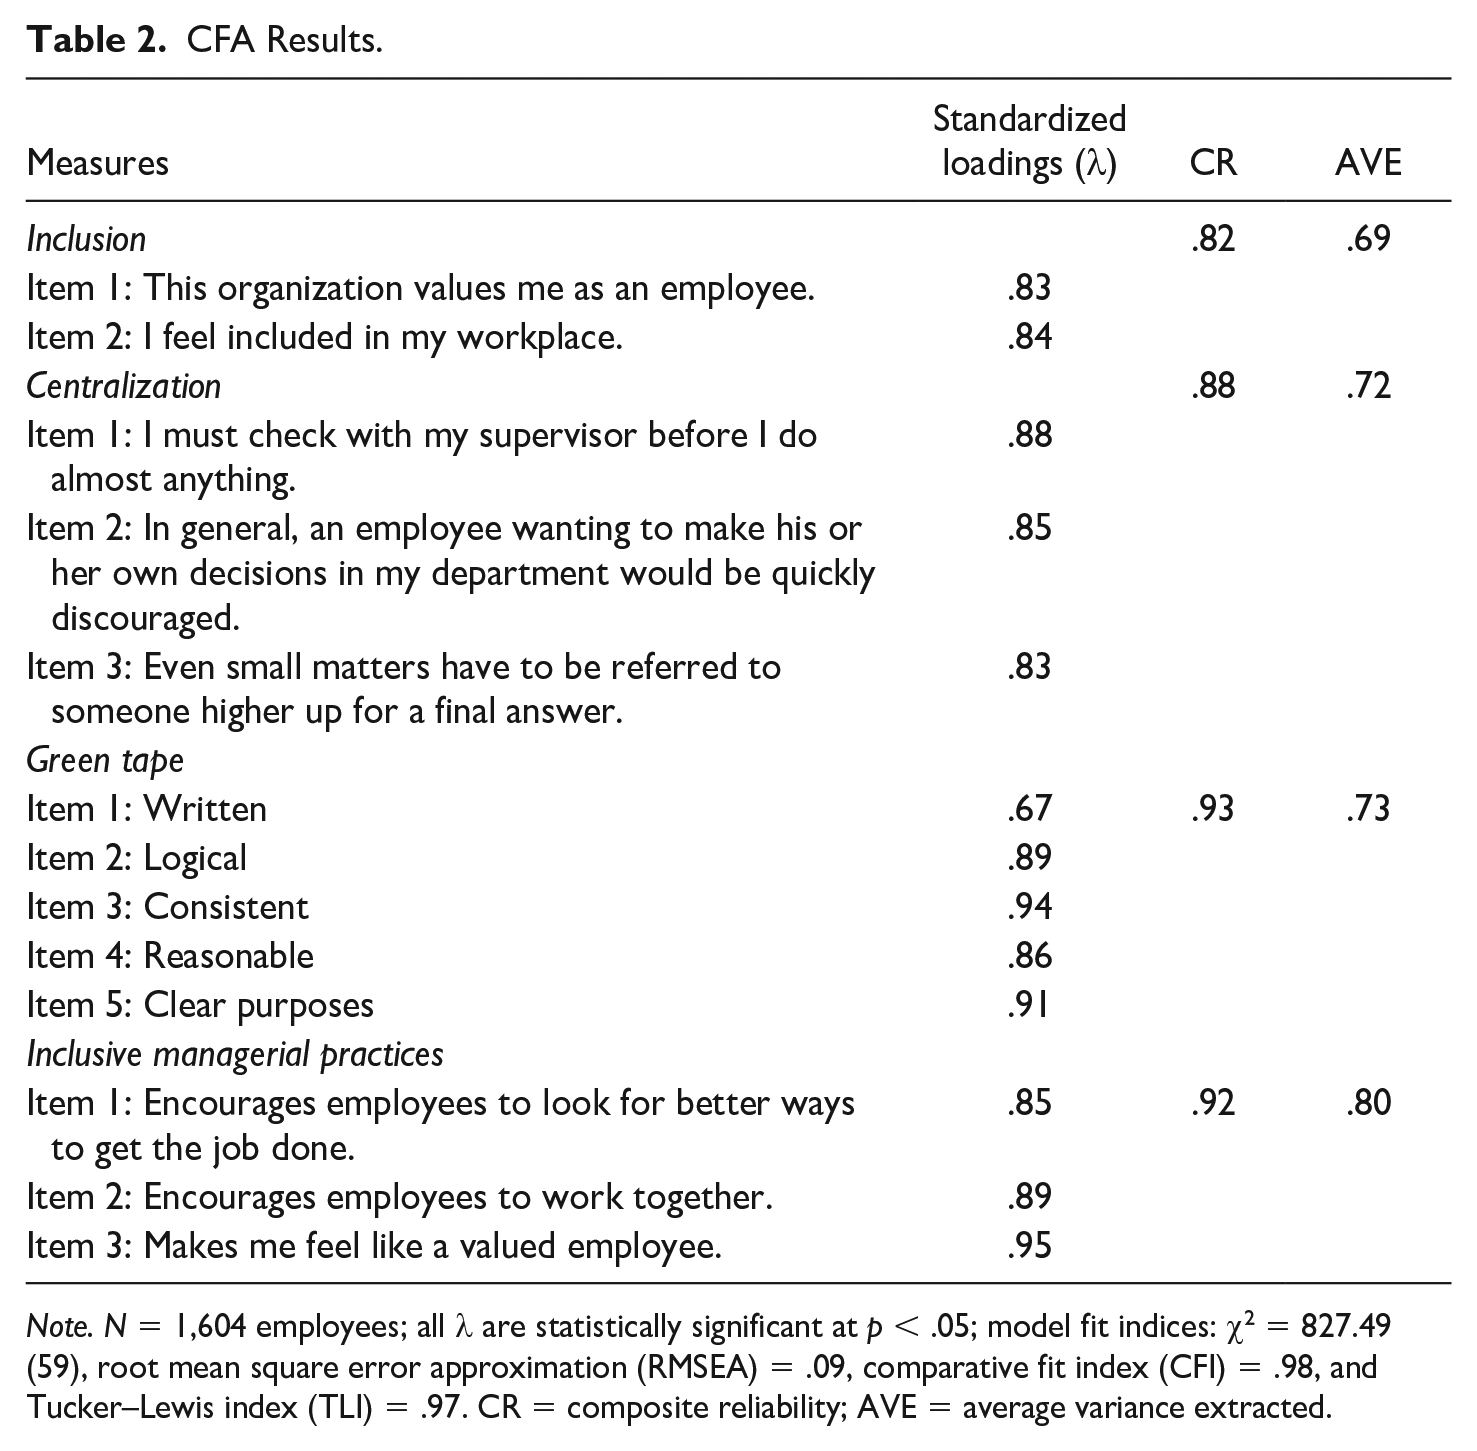
Note. N = 1,604 employees; all λ are statistically significant at p < .05; model fit indices: χ2 = 827.49 (59), root mean square error approximation (RMSEA) = .09, comparative fit index (CFI) = .98, and Tucker–Lewis index (TLI) = .97. CR = composite reliability; AVE = average variance extracted.
Table 3 shows summary statistics of the dependent variable inclusion and its predictor variables. The composite scores for inclusion, green tape, and centralization are only slightly skewed (M = 3.77/6, 2.58/4, and 2.27/5, respectively). Moreover, there is considerable variability for the dependent variable (SD = 1.51) and the independent variables (SD = 6.42 for span of control, SD = 0.83 for green tape, SD = 1.38 for centralization, and SD = 1.43 for hierarchy).
Summary Statistics.
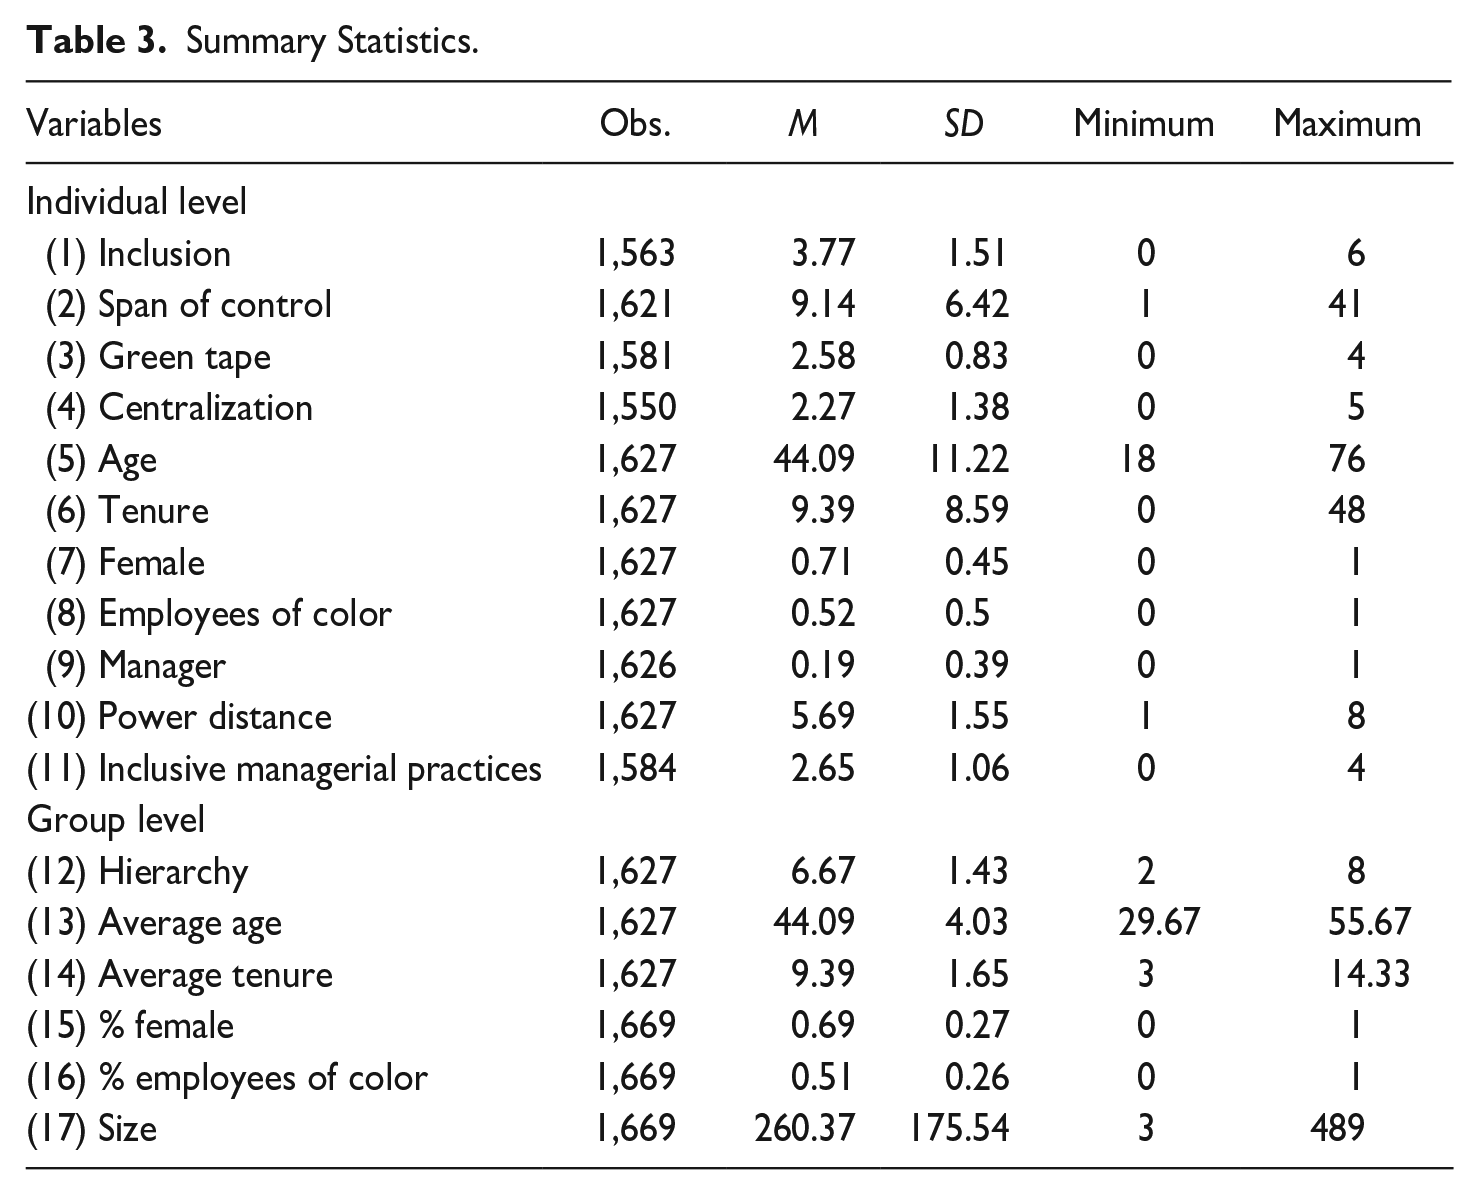
Table 4 reports the bivariate correlations among all variables. As shown in Table 4, inclusion is negatively associated with span of control and centralization (r = −.06 and −.48, p < .05), positively associated with green tape (r = .54, p < .05), and not significantly associated with hierarchy (r = −.04). These results provide preliminary support for three of the four hypotheses regarding the relationships between green tape, centralization, span of control, and inclusion. With respect to individual characteristics, longer-term employees, women, employees of color, and lower-level employees (those with higher power distance) are less likely to feel included in the organization (r = −.10, −.06, −.11, and −.15, respectively, p < .05). In terms of group characteristics, employees are more likely to feel included in groups comprising longer-tenured employees (r = .06, p < .05) and less likely to feel included in larger and more racially diverse groups (r = −.11, p < .05).
Bivariate Analysis Results.
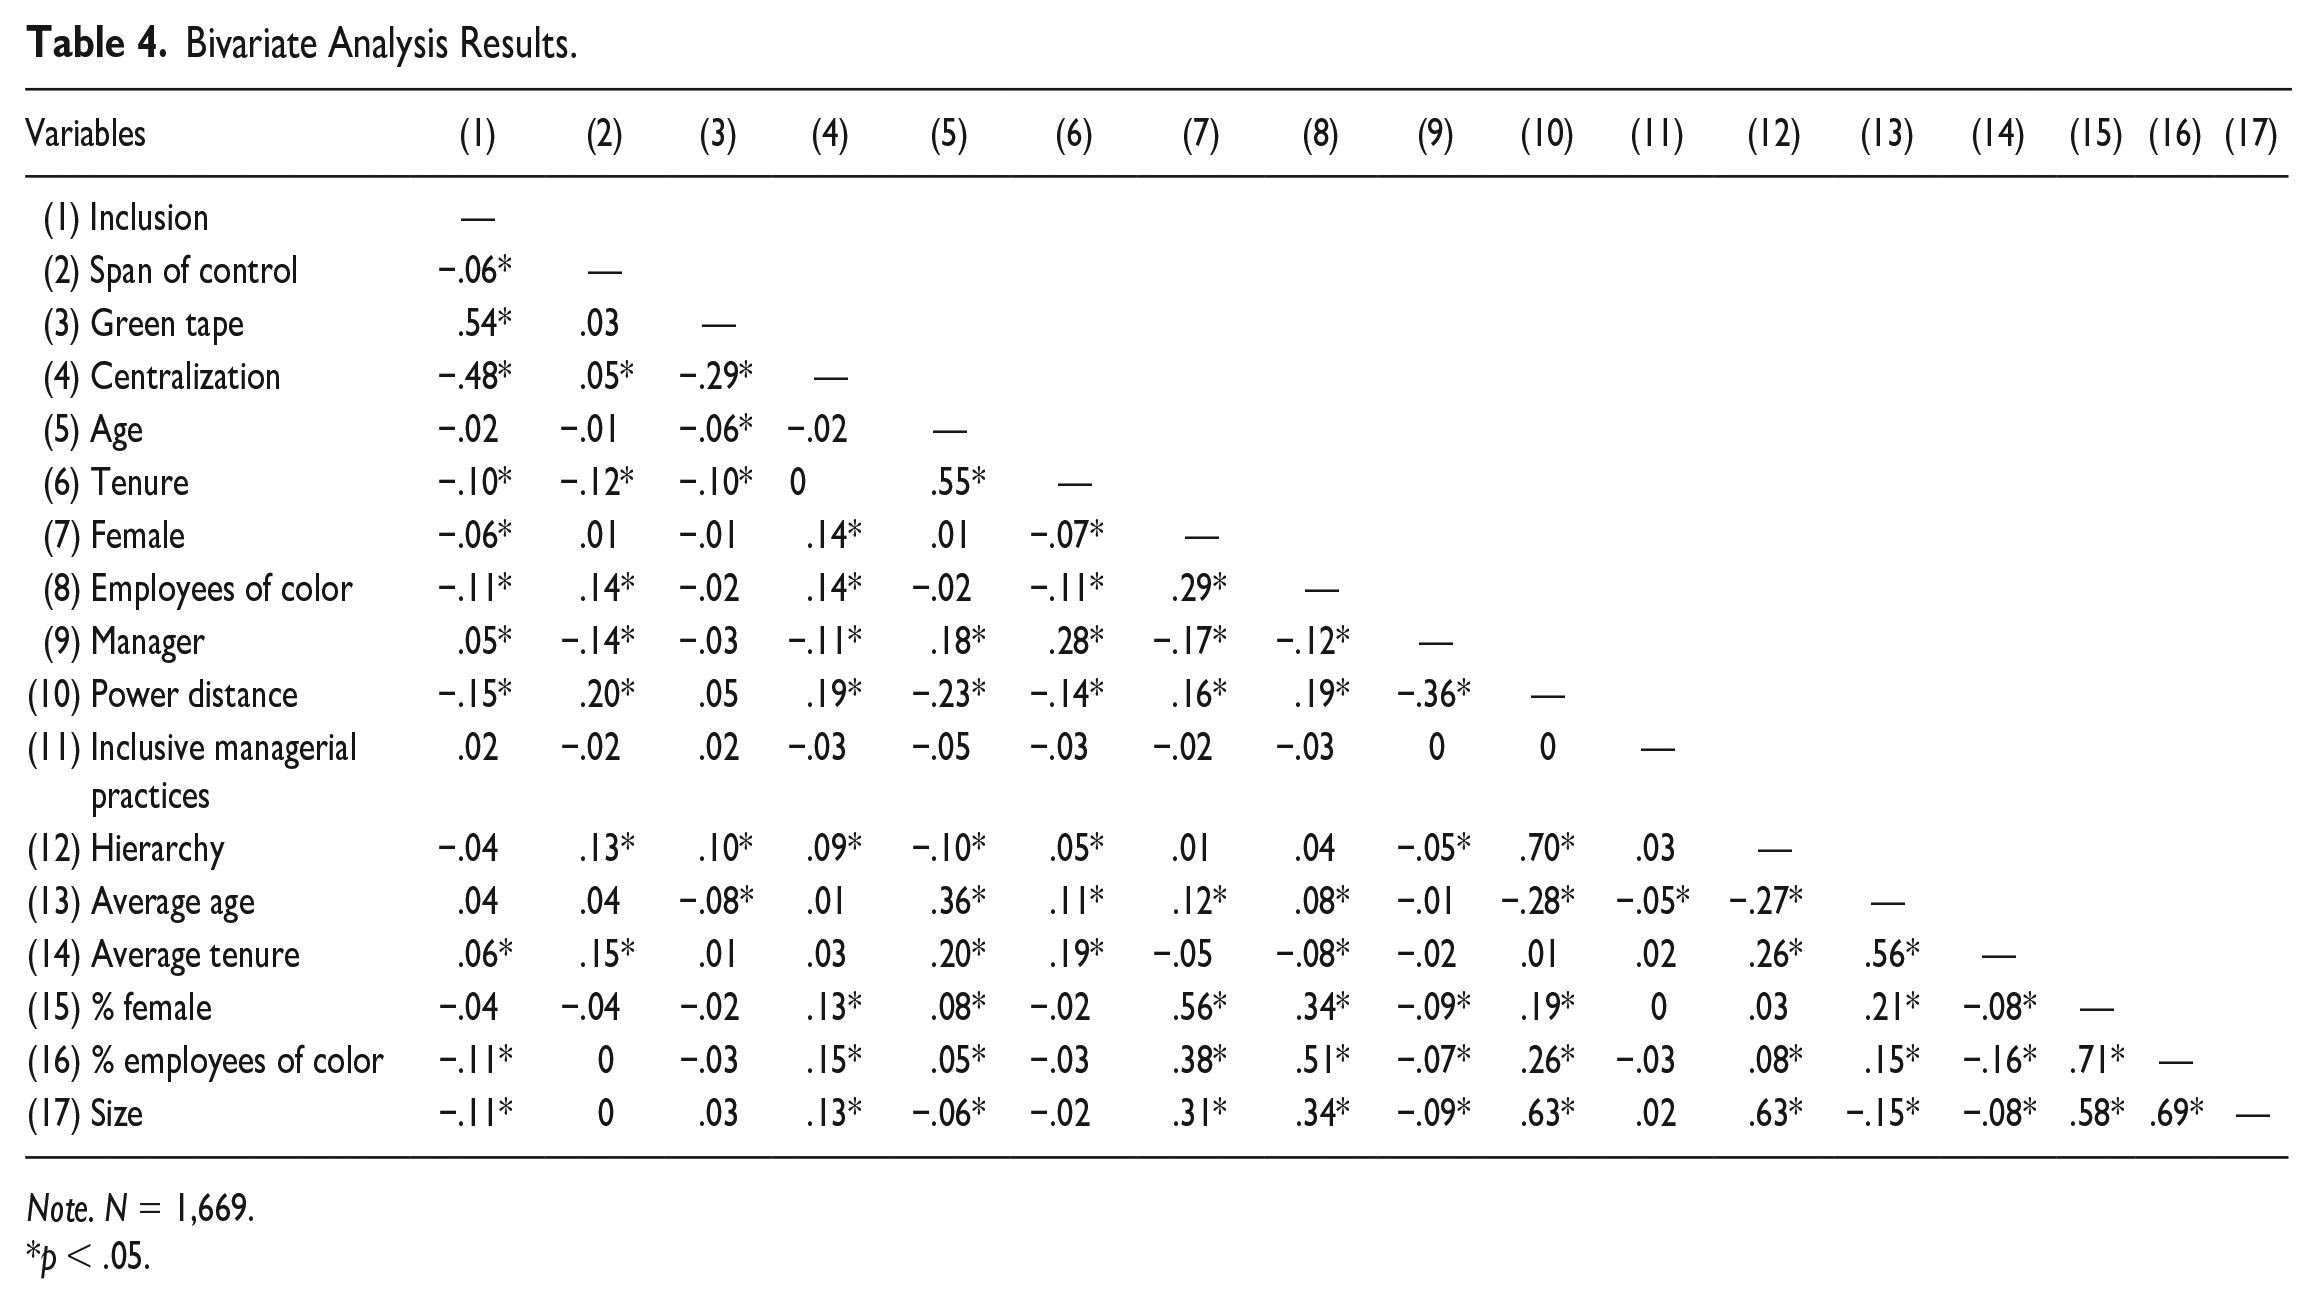
Note. N = 1,669.
p < .05.
HLM Results
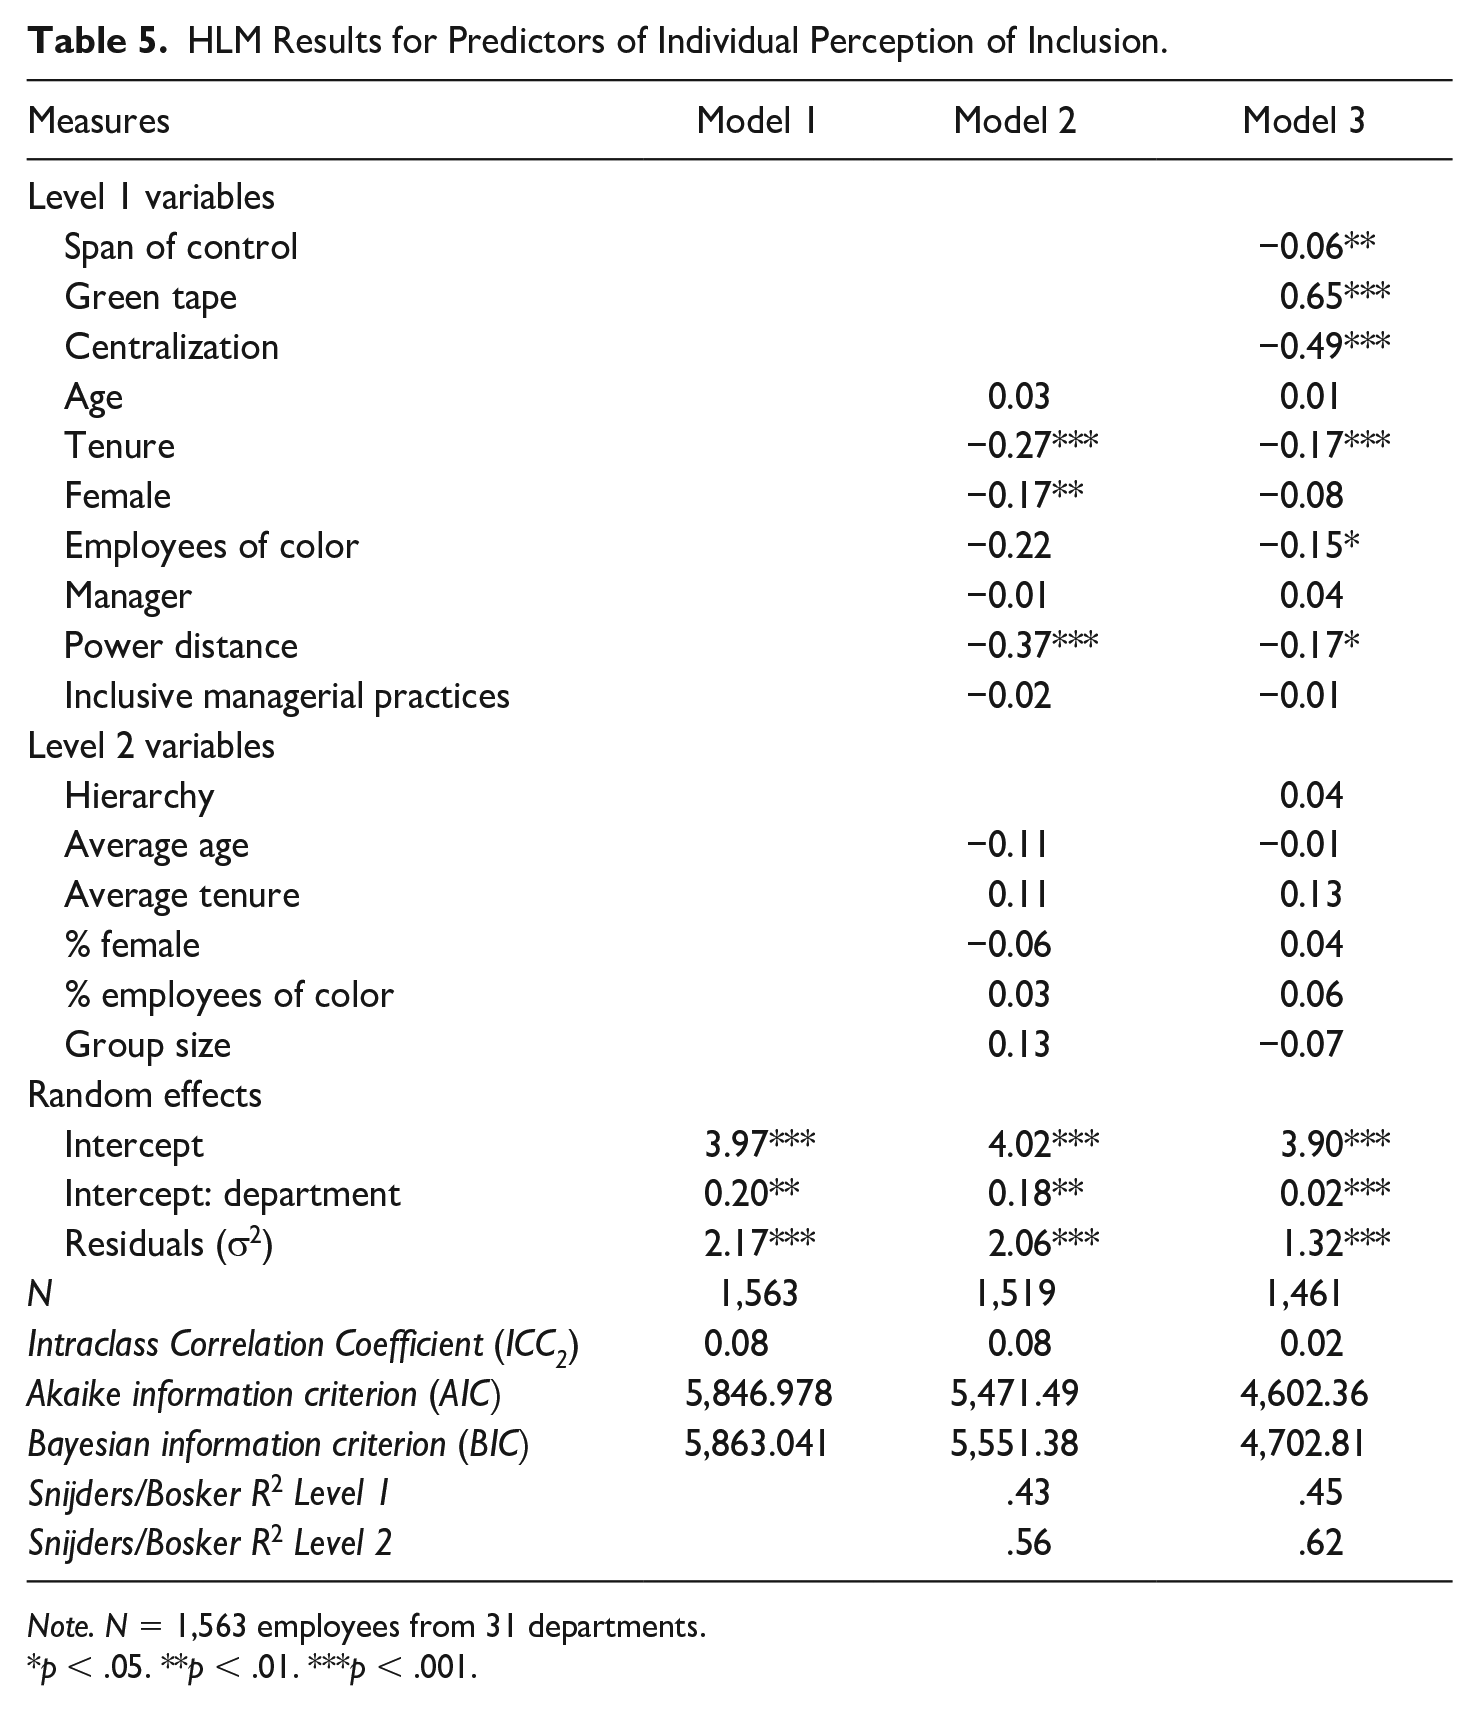
Since employees are nested within departments, this study used a multilevel modeling approach to control for department-level heterogeneity. Departments that include fewer than three employees were excluded before running regression models. The analysis also group-mean centered all Level 1 continuous variables and grand-mean centered all Level 2 continuous variables. By doing so, the estimated coefficients for the Level 1 variables represent only within-group effects.
Table 5 summarizes the HLM results for predicting inclusion. Model 1 assesses the department-level variation in the inclusion felt by individual employees (the null model). The significant intercept for the department level (γ = 0.20, p < .001) and ICC2 value indicate that department-level factors are associated with variation in individual-level inclusion, justifying the use of a multilevel modeling approach. Model 2 includes the control variables. The AIC and BIC levels indicate a significant improvement to the null model. Model 3 adds the independent variables to test Hypotheses 1 to 4, that steeper hierarchies, wider spans of control, and centralized work environments will be negatively associated with inclusion and work environments characterized by green tape will be positively associated with inclusion. The AIC and BIC levels indicate a significant improvement to Model 2 with the inclusion of the independent variables.
HLM Results for Predictors of Individual Perception of Inclusion.
Note. N = 1,563 employees from 31 departments.
p < .05. **p < .01. ***p < .001.
The results of Model 3 provide support for three of the four hypotheses regarding centralization, span of control, and green tape. Specifically, a one standard deviation increase in centralization scores is linked to a 0.49 standard deviation decrease in inclusion . A one standard deviation increase in supervisory span of control is related to a 0.06 standard deviation decrease in inclusion perception scores. The strongest predictor of inclusion perception is green tape. A one standard deviation increase in green tape is related to a 0.65 standard deviation increase in inclusion. 3 However, the results do not provide support for the hypothesis that hierarchies predict variation in inclusion (γ = 0.04, p > .05). Examining the control variables at the individual level (Model 3), employees that are longer-tenured, employees of color, and lower-level employees (those with higher power distances) tend to have lower levels of inclusion. Age, gender, manager, and inclusive managerial practices have no significant relationship with inclusion. At the department level, none of the control variables are significantly associated with individual-level inclusion . The final Snijders/Bosker R2 values show that the Level 1 R2 accounts for .45 of the model’s variance in the individual-level inclusion and the Level 2 R2 accounts for .62 of the model’s variance in department-level inclusion.
Qualitative Results
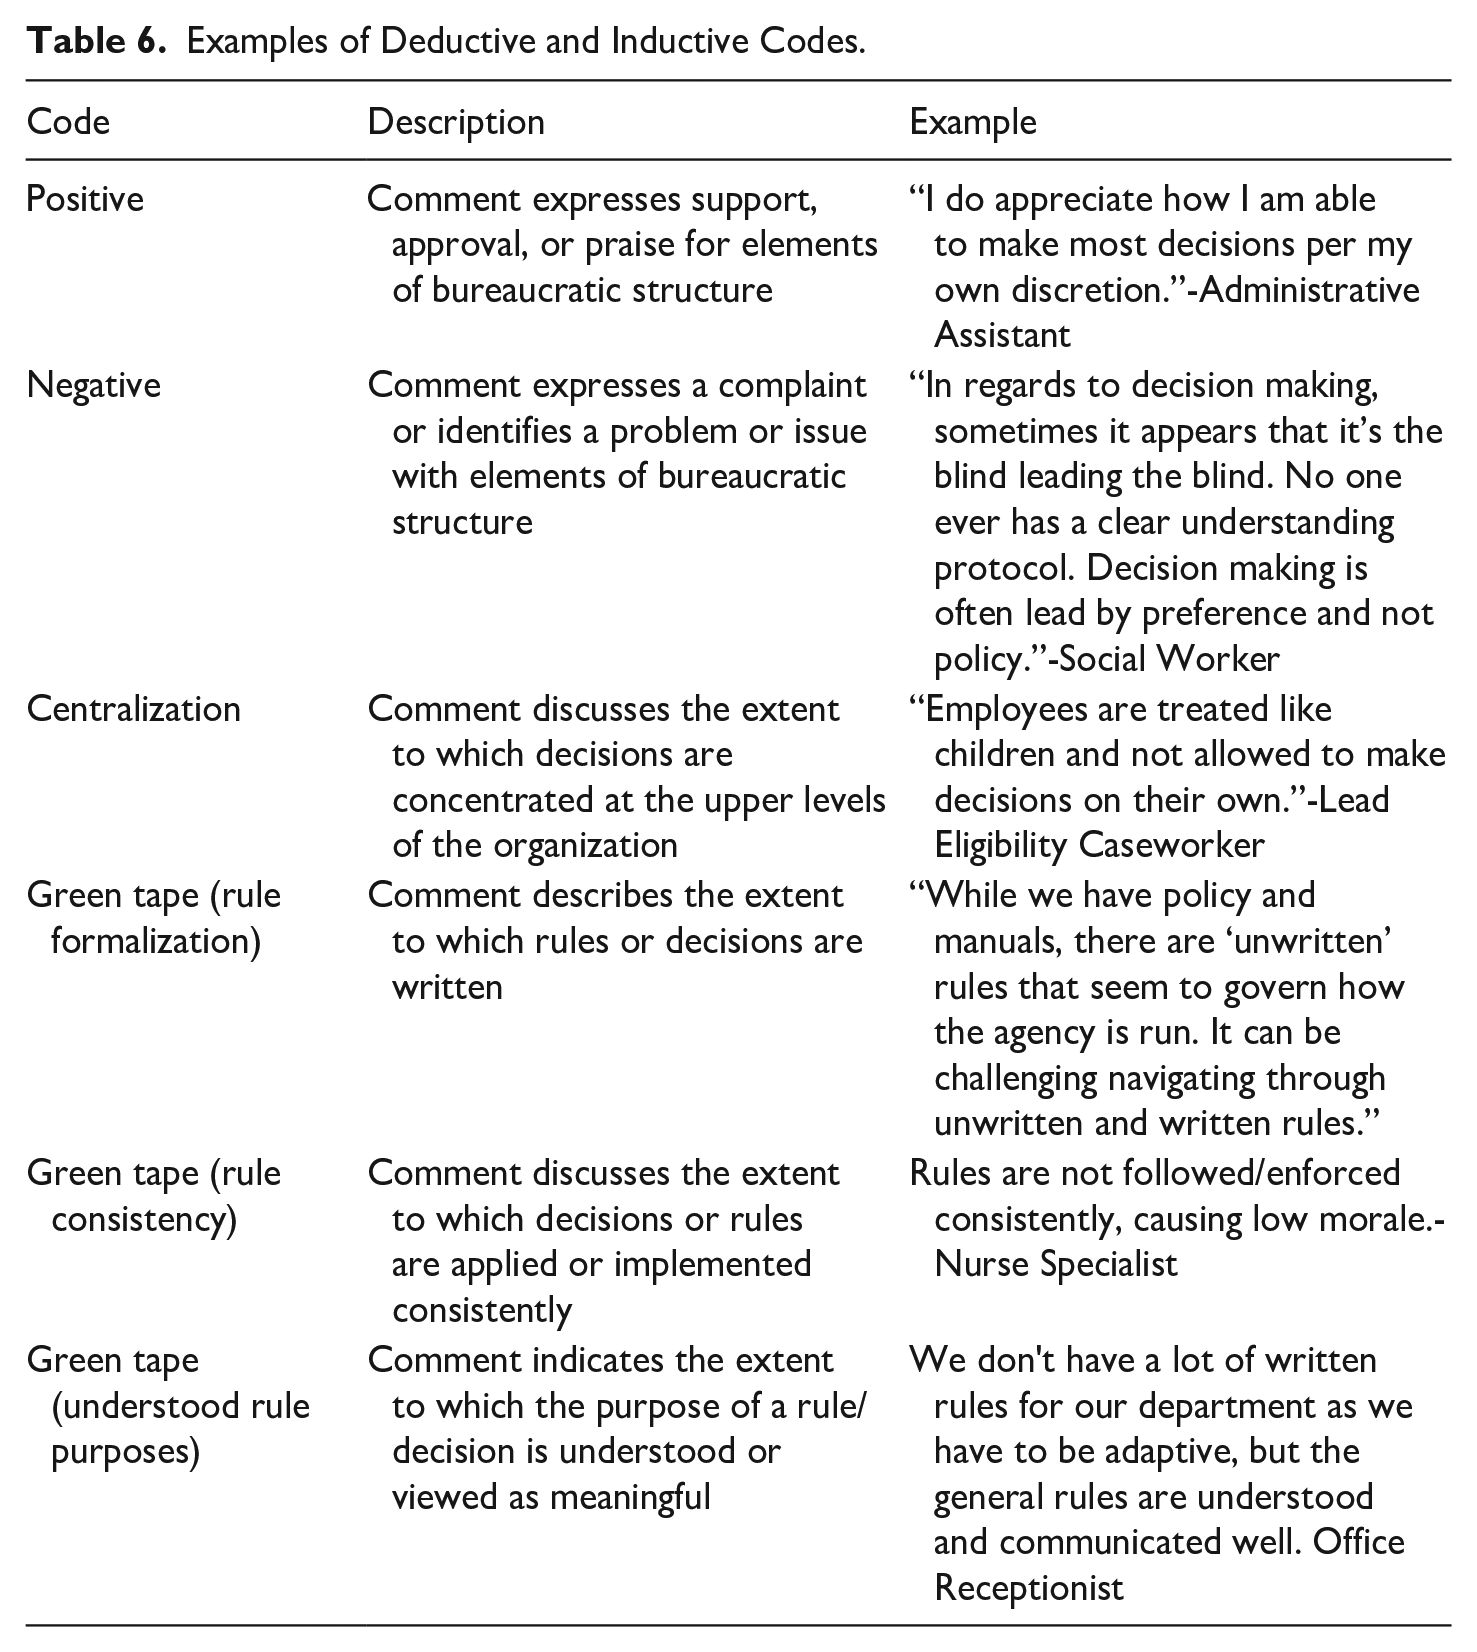
The qualitative data derive from responses to an open-ended question asking for follow-up comments on the nature of decision-making in the organization. The data included 137 comments on bureaucratic structure from employees in 25 departments. We analyzed the qualitative survey comments by developing a list of codes based on the existing literature and theoretical framework. These codes were applied deductively, with additional themes emerging inductively as we analyze the data (Fereday & Muir-Cochrane, 2006; Miles et al., 2018).
Comments were selected for analysis based on whether the survey participant indicated feelings of high or low inclusion. Responses at or below the 25th percentile of the inclusion scale were labeled low inclusion, and responses at or above the 75th percentile of the inclusion scale were labeled high inclusion. Comments on bureaucracy were coded as positive or negative (mixed comments were excluded). After coding and identifying themes, this study divided the qualitative responses according to whether they were associated with high- or low-inclusion scores. Table 6 provides a sample of the codes used in the qualitative analysis. Chi-square tests were then conducted to examine whether the number of positive or negative comments was associated with the number of high- versus low-inclusion survey participants.
Examples of Deductive and Inductive Codes.
The comments on bureaucratic structure were mostly negative (80%) and less commonly positive (8%). Consistent with the quantitative findings, most of the qualitative comments focused on factors related to centralization and green tape. These themes were present in both positive comments (defined by support, approval, or praise) and negative comments (defined bycomplaints, problems or issues raised). We excluded comments that were both positive and negative or neither positive nor negative. The following subsections describe the bureaucratic structures identified in the negative and positive comments.
Negative Bureaucracy Themes: Centralization and Inconsistent Rules
Among the negative responses about bureaucracy, the two main themes identified in this study were centralization and green tape. More than half of the negative responses referenced centralized decision-making. To illustrate, an eligibility supervisor stated that “decision making is left up to management that do not know the job,” and a security employee explained that “even as a supervisor I am not allowed to make any decisions unless my upper management decides it first.” Several respondents expressed frustration with their inability to make decisions, as illustrated by comments like the one made by this assistant register of deeds: “This department has absolutely NO RESPECT for employees’ decision-making. We are treated like we are in daycare.”
The second theme identified in the negative bureaucracy comments was green tape, or rather, the absence of green tape characteristics. Most common among these was rule inconsistency, with many employees believing that rules and decisions were applied depending on who you were or your hierarchical position. To illustrate, a facilities services technician explained, “In my department rules are meant for some employees but not for all employees,” and a juvenile counselor noted, “There is a lack of consistency among upper management regards to decision making and enforcement of rules.” Some employees connected inconsistent rules with hierarchy, noting that certain rules apply to staff but not management. A child support agent noted that “we have rules that (the) employee is to follow, but management do(es) not. [For] example, sign in and out when leaving the office and returning.” Respondents sometimes described the inconsistent rules or decisions as “unfair” or evidence of “favoritism.”
While consistency dominated the negative bureaucracy comments related to rules, the absence of other green tape characteristics surfaced as well. In particular, survey participants mentioned the unwritten nature of rules in comments such as that made by this deputy sergeant, “The order will seldom be written and put into SOP or Policy”. Misunderstood rules also surfaced in negative bureaucracy comments, illustrated by this administrative assistant’s sentiment: “Newer, undertrained supervisors with a poor understanding of policy and procedure often dismiss subject matter expert employees who attempt to correct errors.”
Positive Bureacracy Theme: Decentralized Decision-Making
Decentralization emerged as the key theme in the positive bureaucracy comments. In comparison with the negative bureaucracy comments, the positive bureaucracy comments described decentralized decision-making processes where employees were given the authority to make decisions. To illustrate, a paramedic said, “I have the ability to make decisions as is needed and I do not feel micro-managed.” Many employees noted the important role of their supervisor in enabling them to make decisions. For instance, an animal services assistant manager shared, “My supervisor empowers me to make important decisions in my day-to-day operations.” From a supervisory perspective, a juvenile detention supervisor explains that, “I try to empower my staff through trainings, one-on-ones, and encouragement.”
Comparing Bureaucracy Comments Between High- and Low-Inclusion Respondents
Comparing comments on bureaucracy by high- and low-inclusion survey respondents (Table 7), high-inclusion respondents had an equal percentage of negative and positive bureaucracy comments, 44%. By contrast, the vast majority of low-inclusion respondents made negative comments about bureaucratic structure (90%). Analyzing the data through the lens of the bureaucratic structure comments, 78% of negative comments are from low-inclusion survey participants compared with 22% from high-inclusion participants. Of the positive decision comments, 76% are from high-inclusion survey participants, compared with 24% from low-inclusion participants. Table 7 reports the results of a chi-square test of independence between the positive and negative comments made by high- and low-inclusion respondents. The results indicate a statistically significant association between inclusion level and the content of bureaucratic structure comments (p < .001), with high inclusion associated with positive bureaucracy comments and lower inclusion associated with negative bureaucracy comments.
Chi-Square Test of Association Between Inclusion and Bureaucracy Comments.
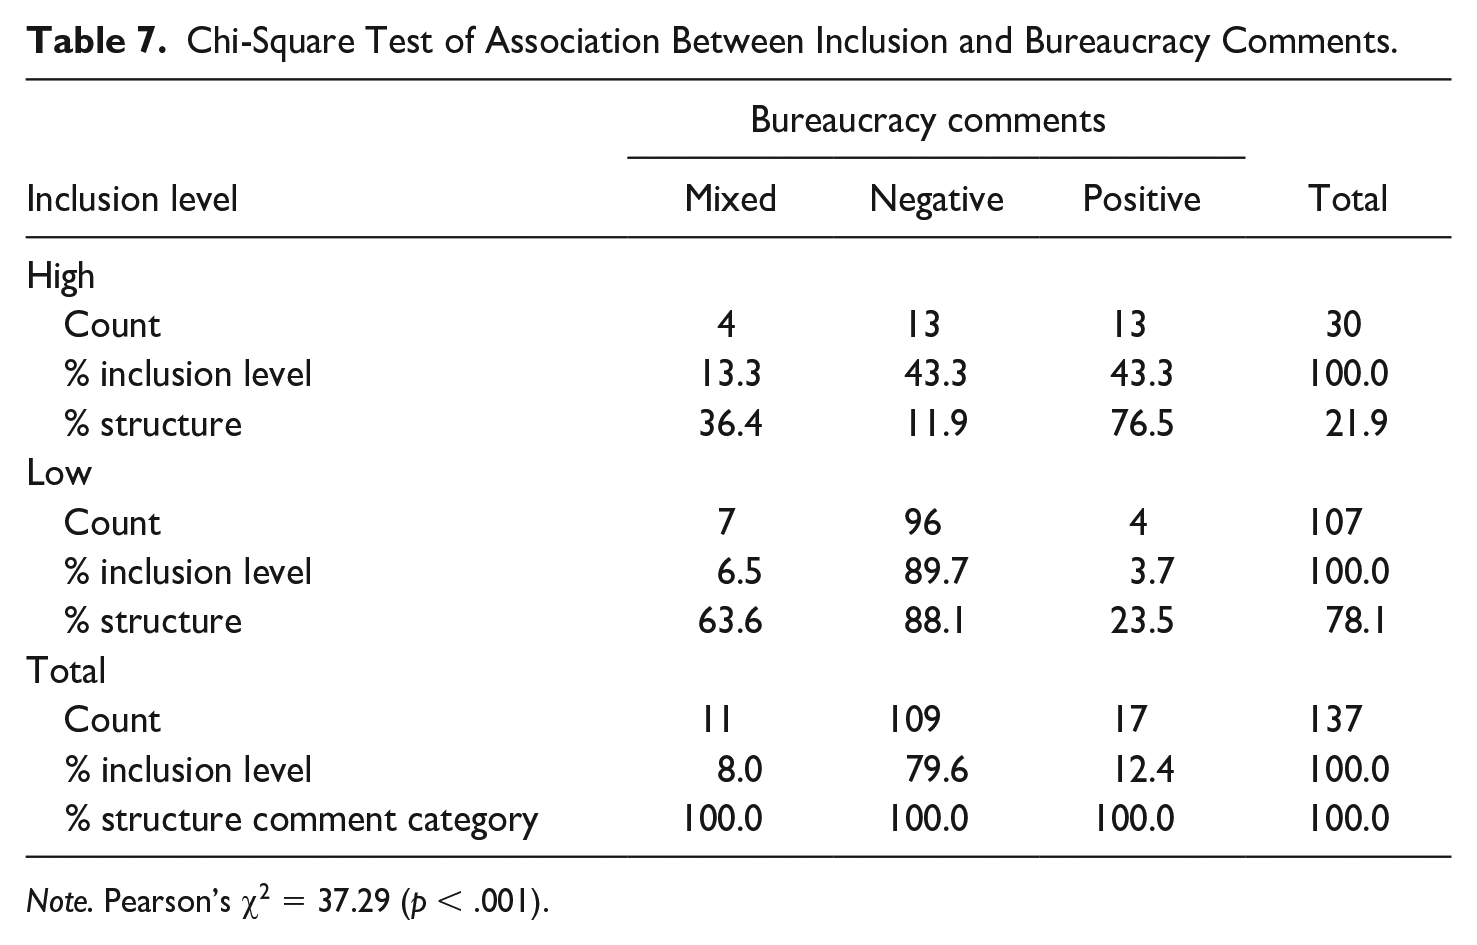
Note. Pearson’s χ2 = 37.29 (p < .001).
Discussion and Conclusion
This study investigates the influence of bureaucratic structure on the inclusion experienced by individual public employees. Inclusion is thought to be achieved when employees simultaneously feel that they belong and are uniquely valued as individuals in their workplaces (Shore et al., 2011). Different forms of bureaucratic structure were hypothesized to affect inclusion by leveling or differentiating an employee’s status within the organization: hierarchy, representing the number of supervisory levels in an organizational unit; centralization, the upward locus of decision authority; span of control, the number of subordinates overseen by one’s supervisor; and green tape, defined as effective organizational rules. Analyzing qualitative and quantitative data from a survey of county employees, results show that centralization and wider spans of control appear to lower inclusion, whereas green tape appears to increase it. While it is difficult to generalize from a one-organization sample, the results suggest practical possibilities for public organizations seeking to create more inclusive work environments.
Given that centralization appears to undermine inclusion by delineating employees with and without decision power, public managers should seek to empower employees by allowing decisions to be made at lower levels of the organization. One way of identifying delegable decisions is to ask employees, individually or collectively, about sources of inefficiency in decision processes. More broadly, our results reinforce government reformists’ recommendations to empower public employees as a means of making public organizations more agile and responsive.
Green tape appears to foster inclusion through rule characteristics that connect employees to their organizations in positive ways. This relationship suggests that public managers can increase inclusion by scrutinizing the design and implementation of organizational rules through the lens of the five green tape attributes. Are rules available in writing? Do rule requirements logically connect with rule objectives? Does the rule impose more control than needed to achieve rule objectives? And how will rule purposes be communicated? If managers are intentional about identifying and addressing rules that lack green tape characteristics, they will increase the likelihood that rules effectively achieve organizational goals (DeHart-Davis, 2017).
Wider spans of control are associated with lower inclusion, suggesting that the more employees overseen by a supervisor, the harder it is for supervisors to build relationships with individual employees. Similarly, narrower spans of control may give supervisors and employees the opportunity to work side-by-side and develop shared goals for the work. This result suggests that public managers may want to set a maximum number of employees that any single supervisor can oversee, or, at a minimum, commit to helping supervisors with high numbers of employees in their charge. It is important to note, however, that the effect of span of control is relatively small compared with centralization and green tape, suggesting that public managers may consider prioritizing empowering employees and creating effective rules in their quest to foster more inclusive work environments. It may also be worth noting that the relative significance of span of control may vary depending on contextual factors like leadership styles and may be underestimated in this study due to potential confounding variables.
Hierarchy did not appear to influence inclusion. Hierarchy was measured using administrative data on the number of supervisory layers in a department. It could be that this measure does not fully capture one’s perceived extent of power inequality among members. Perhaps, it is characteristics of the hierarchy, rather than hierarchy itself, that translate to managerial behaviors that foster or undercut inclusion. For instance, research shows that the architecture of hierarchies, including structural stability, characteristics of influence relationships, and the distinctiveness of layers, shapes the functions of hierarchies and the extent of psychological distance/power inequality among members (Accominotti et al., 2022; Bunderson et al., 2016). Along these lines, centralization and span of control could be considered characteristics of hierarchy rather than stand-alone forms of bureaucratic structure.
Looking across these results, the data suggest that different forms of bureaucratic structure indeed affect an employee’s sense of inclusion. From a theoretical perspective, this is the first research to test the relationship between different forms of bureaucratic structure and inclusion, suggesting that features of the broader workplace environment—beyond specific managerial practices—foster or undercut inclusion. Practically speaking, these results are good news for public managers, who can intentionally design bureaucratic structures with inclusion in mind.
In reviewing the effects of the control variables on inclusion, results show that longer-term and lower-level employees feel less included, as do employees of color. While it is unclear why tenure correlates with lower inclusion, the findings related to lower-level employees and employees of color are consistent with extant research.
While the analysis of 31 departments provides contextual variation in the data, this research is limited by using a single local government organization. Future research should seek to replicate these results in a sample inclusive of multiple organizations at different levels of government. Another possible research extension involves testing the influence of other dimensions of bureaucratic structure, such as task specialization, on inclusion. Finally, research is needed on the emotional mechanics of inclusion, that is, what inclusion feels like from the employee perspective.
Returning to the broad results, this study finds that bureaucratic structure indeed matters for inclusion. This finding is especially relevant for diversity and inclusion efforts within organizations, suggesting that the design of bureaucratic structure should be an additional intervention for helping employees of all demographic groups to feel belonging and valued. Given that public organizations tend to be highly structured, these results suggest an enormous opportunity for making public employees feel included in their organizations, by pushing decisions down, designing and implementing effective rules, and reducing the number of employees managed by a single supervisor.
Footnotes
Declaration of Conflicting Interests
The author(s) declared no potential conflicts of interest with respect to the research, authorship, and/or publication of this article.
Funding
The author(s) received no financial support for the research, authorship, and/or publication of this article.